bioRxiv preprint first posted online Apr. 12, 2017; doi: http://dx.doi.org/10.1101/127050. The copyright holder for this preprint (which was not peer-reviewed) is the author/funder. It is made available under a CC-BY 4.0 International license.
1
Human Missense Variation is Constrained by Domain Structure and
2
Highlights Functional and Pathogenic Residues
3
4
Stuart A. MacGowan1,2, Fábio Madeira1, Thiago Britto-Borges1, Melanie S. Schmittner1,
5
Christian Cole1 and Geoffrey J. Barton1,2
6
7
Human genome sequencing has generated population variant datasets containing
8
millions of variants from hundreds of thousands of individuals1-3. The datasets show the
9
genomic distribution of genetic variation to be influenced on genic and sub-genic scales
10
by gene essentiality,1,4,5 protein domain architecture6 and the presence of genomic
11
features such as splice donor/acceptor sites.2 However, the variant data are still too
12
sparse to provide a comparative picture of genetic variation between individual protein
13
residues in the proteome.1,6 Here, we overcome this sparsity for ~25,000 human
14
protein domains in 1,291 domain families by aggregating variants over equivalent
15
positions (columns) in multiple sequence alignments of sequence-similar (paralagous)
16
domains7,8. We then compare the resulting variation profiles from the human
17
population to residue conservation across all species9 and find that the same tertiary
18
structural and functional pressures that affect amino acid conservation during domain
19
evolution constrain missense variant distributions. Thus, depletion of missense variants
20
at a position implies that it is structurally or functionally important. We find such
21
positions are enriched in known disease-associated variants (OR = 2.83, p ≈ 0) while
22
positions that are both missense depleted and evolutionary conserved are further
23
enriched in disease-associated variants (OR = 1.85, p = 3.3×10⁻¹⁷) compared to those
1
bioRxiv preprint first posted online Apr. 12, 2017; doi: http://dx.doi.org/10.1101/127050. The copyright holder for this preprint (which was not peer-reviewed) is the author/funder. It is made available under a CC-BY 4.0 International license.
24
that are only evolutionary conserved (OR = 1.29, p = 4.5×10⁻¹⁹). Unexpectedly, a subset
25
of evolutionary Unconserved positions are Missense Depleted in human (UMD
26
positions) and these are also enriched in pathogenic variants (OR = 1.74, p = 0.02). UMD
27
positions are further differentiated from other unconserved residues in that they are
28
enriched in ligand, DNA and protein binding interactions (OR = 1.59, p = 0.003), which
29
suggests this stratification can identify functionally important positions. A different
30
class of positions that are Conserved and Missense Enriched (CME) show an enrichment
31
of ClinVar risk factor variants (OR = 2.27, p = 0.004). We illustrate these principles with
32
the G-Protein Coupled Receptor (GPCR) family, Nuclear Receptor Ligand Binding
33
Domain family and In Between Ring-Finger (IBR) domains and list a total of 343 UMD
34
positions in 211 domain families. This study will have broad applications to: (a)
35
providing focus for functional studies of specific proteins by mutagenesis; (b) refining
36
pathogenicity prediction models; (c) highlighting which residue interactions to target
37
when refining the specificity of small-molecule drugs.
38
39
40
Variant densities and the sparsity problem
41
Human sequencing projects are beginning to shed light on the patterns of genetic
42
variation that are present in human populations.1,2 One way in which these studies
43
enhance the understanding of inter-individual variation is by characterising different
44
densities of single-nucleotide variants (SNVs) and short insertion and deletions (indels)
45
at different genomic loci. Analysis of large cohort variation datasets has revealed that
46
genes differ in their tolerance of non-synonymous and loss-of-function variation.1,4
47
Within protein-coding genes, regions that encode protein domains are less tolerant of
48
non-synonymous variants than inter-domain coding regions and are more prone to
2
bioRxiv preprint first posted online Apr. 12, 2017; doi: http://dx.doi.org/10.1101/127050. The copyright holder for this preprint (which was not peer-reviewed) is the author/funder. It is made available under a CC-BY 4.0 International license.
49
disease variants.6 The 60,706 sample Exome Aggregation Consortium1 study yielded
50
~125 variants per kilobase, rendering a per nucleotide comparison impossible since
51
most single nucleotides have zero variants. Variant sparsity can also be addressed by
52
aggregating over pseudo-paralogous positions. For example, aligning nucleotide
53
sequences on start codons reveals that start codons have fewer variants than adjacent
54
sites, while the 5’-UTR is more variable than the CDS and every third base in a codon
55
variable.2 These differences are observed because the pressures imposed by those
56
genomic features are common to each individual aligned sequence.
57
58
Residue resolution through protein family aggregation
59
Multiple sequence alignments (MSA) are a well established way to identify position-
60
specific features in a family of homologous sequences. Figure 1A illustrates
61
schematically how an MSA containing multiple human paralogs can be used to
62
aggregate SNVs from multiple loci in a position specific manner. This process condenses
63
the sparse variant counts from single sequences into dense variant counts for the
64
domain family. Similar approaches have been adopted to identify low frequency cancer
65
driver mutations,10-12 and find sites in domains where pathogenic mutations cluster.13
66
To perform a comprehensive analysis of protein domains, germline variation data
67
retrieved from Ensembl14,15 was aggregated with respect to the domain families in
68
Pfam.8 Pfam contains 16,035 domain families and of these families 6,088 contain at least
69
one human sequence and 1,376 have at least five after adjusting for duplicate sequences
70
(see Methods). Figures 1B-C show that even though most human sequence residues in
71
Pfam domains have zero variants, after aggregation most Pfam domain family positions
72
have at least two variants.
73
3
bioRxiv preprint first posted online Apr. 12, 2017; doi: http://dx.doi.org/10.1101/127050. The copyright holder for this preprint (which was not peer-reviewed) is the author/funder. It is made available under a CC-BY 4.0 International license.
74 75
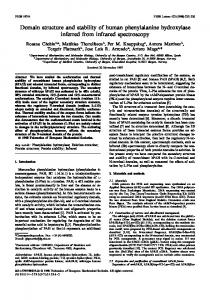
Figure 1: Variant aggregation over protein family alignments. A. Schematic illustration of a protein family
76
alignment. Each line represents a human or non-human sequence and human sequences can have zero or
77
more variants (blue circles). Few variants are observed at each alignment position per sequence but the
78
column totals are larger. B. Distribution of variants per human residue in all Pfam sequences (2,927,499
79
missense variants, 8,264,091 residues; no filters applied). C. Distribution of variants per alignment column in
80
Pfam alignments (955,636 missense variants, 159,296 columns; includes only columns with at least five
81
human residues).
82
83
SNV density is correlated with evolutionary conservation
84
Accurate predictions of structure and function can be made from MSAs16-18 because
85
these features impose constraints on accepted mutations in domain families. These
86
constraints can be inferred from patterns in residue conservation scores,9 which
87
quantify the extent of residue or physicochemical property conservation at each
88
position in the alignment. In protein domain family MSAs, which can contain orthologs
4
bioRxiv preprint first posted online Apr. 12, 2017; doi: http://dx.doi.org/10.1101/127050. The copyright holder for this preprint (which was not peer-reviewed) is the author/funder. It is made available under a CC-BY 4.0 International license.
89
and paralogs in varying proportions, these scores are interpreted as the degree of
90
evolutionary conservation in each site of the domain family and are different to
91
conservation scores for alignments that contain only closely related orthologs because
92
of greater functional divergence. Throughout this text, the term evolutionary
93
conservation refers to the conservation of residues during domain family evolution and
94
accounts for orthologous and paralogous evolutionary process as captured in the Pfam
95
alignments.
96
97
Figure 2A shows the correlation between the domain family column variant counts and
98
the Shenkin divergence score (VShenkin)19 in the SH2 domain family (PF00017). The
99
number of missense variants increases with increasing residue divergence (i.e.,
100
decreasing conservation) whilst the frequency of synonymous variation remains
101
constant with respect to column conservation. Extended Data Figs. 1 and 2 illustrate
102
this behaviour on the SH2 alignment and crystal structure and show that in this
103
example, the protein’s secondary and tertiary structures and domain-domain
104
interactions are common factors constraining both conservation and population
105
constraint. This demonstrates that the missense variant distribution is subject to the
106
same structural and functional constraints over generational timescales that affect
107
amino acid substitution frequencies over evolutionary timescales. In contrast, the
108
distribution of synonymous variation is not affected because these variants are silent at
109
the protein structure level. Figure 2B shows that this result extends to other protein
110
families by illustrating that the VShenkin regression coefficients for each family are
111
distributed around zero for synonymous variant totals and are typically positive for
112
missense variants.
113
5
bioRxiv preprint first posted online Apr. 12, 2017; doi: http://dx.doi.org/10.1101/127050. The copyright holder for this preprint (which was not peer-reviewed) is the author/funder. It is made available under a CC-BY 4.0 International license.
114 115
Figure 2: Relationship between column variant totals and VShenkin. A. Variant counts vs. VShenkin for missense
116
(left panel) and synonymous variants (right panel) for the SH2 domain (PF00017). The regression lines show
117
least-squares fits and the shaded regions indicate standard errors of prediction. B. Histograms showing the
118
distributions of VShenkin regression coefficients for linear models fitting column variant totals to VShenkin and
119
column human residue occupancies for protein families with > 50 included alignment columns (n = 934).
120
121
Properties of sites relatively depleted or enriched for missense variation
122
Domain family alignment columns were classified as missense depleted or missense
123
enriched by testing whether a column possessed significantly more or less missense
124
variation than observed elsewhere in the alignment (see Methods). Figure 3A shows
125
that with respect to ClinVar20 variant annotations missense depleted columns have
126
higher rates of ‘pathogenic’ (Fisher OR = 2.83, p ≈ 0) and ‘likely pathogenic’ variants (OR
127
= 2.17, p = 1.9×10⁻¹²) compared to other sites, indicating that diversity is suppressed in
128
positions that are critical for function. Variant enriched columns possess proportionally
129
more ‘risk factor’ variants (Fisher OR = 1.66, p = 0.017). This may suggest that there is
130
generally an increased chance of co-segregating phenotypic differences at sites with
131
relatively high population diversity.
132
6
bioRxiv preprint first posted online Apr. 12, 2017; doi: http://dx.doi.org/10.1101/127050. The copyright holder for this preprint (which was not peer-reviewed) is the author/funder. It is made available under a CC-BY 4.0 International license.
133
For comparison, Figure 3B shows the equivalent ClinVar association tests for columns
134
classified by their evolutionary conservation as measured by Valdar’s score (CValdar).9
135
For pathogenic variants, conserved vs. unconserved columns display the same
136
behaviour as missense depleted vs. enriched columns, which is concordant with
137
previous work and expected since most missense depleted columns are also conserved.
138
However, the column classification schemes yield almost opposite trends with respect
139
to the distribution of ClinVar risk factor variants. There is a slight tendency for risk
140
factor variants to occur more frequently in evolutionary conserved columns (OR = 1.47,
141
p = 0.194), which contrasts with their higher frequencies in columns that are relatively
142
enriched for missense variation.
143
144 145
Figure 3: Properties of missense depleted and enriched domain family alignment columns. Odds ratios and
146
95% C.I. for enrichment of variants with specific ClinVar terms that affect residues found in A. missense
147
depleted (p < 0.1; see methods) or enriched (p < 0.1) domain family alignment columns and B. conserved
148
(CValdar in 1st decile) or unconserved columns (CValdar in 10th decile).
149
150
The Conservation Plane: Combining column variant class and conservation
151
Although the distribution of missense variants within domains is typically concordant
152
with the evolutionary conservation profile (Figure 2B), the two metrics are not
7
bioRxiv preprint first posted online Apr. 12, 2017; doi: http://dx.doi.org/10.1101/127050. The copyright holder for this preprint (which was not peer-reviewed) is the author/funder. It is made available under a CC-BY 4.0 International license.
153
redundant and cross-classification of alignment columns by both yields residue
154
categories with interesting properties. Figure 4A shows the distribution of ClinVar
155
annotated pathogenic variants between columns classified as unconserved-missense
156
depleted (UMD), unconserved-missense enriched (UME), conserved-missense depleted
157
(CMD) and conserved-missense enriched (CME). Conserved and unconserved columns
158
that are neither missense depleted or enriched, i.e. have an average number of missense
159
variants for the family, are also shown. It shows that: 1) all conserved sites are enriched
160
for pathogenic variants but CMD sites are more so (CME: OR = 1.24, p = 1.6×10⁻⁵; CMD:
161
OR = 1.85, p = 3.3×10⁻¹⁷) and 2) the UMD subset of unconserved residues are enriched
162
for pathogenic variants to an extent comparable to conserved residues (OR = 1.74, p =
163
0.02). The UMD classification identifies sites where residues have varied throughout the
164
evolution of the domain family but the specific residue adopted by each domain is now
165
under negative selection in human. This implies that residues in this column class could
166
be enriched for specificity determinants. A structural analysis of 270 UMD sites found in
167
160 families provides some support for this hypothesis. We compared these sites to
168
UME columns from the same families and found that UMD columns were enriched for
169
ligand, domain-domain and nucleotide interactions (OR = 1.59, p = 0.003) and tended to
170
be less accessible to solvent (OR = 1.73, p = 2.0 × 10-04; Extended Data Table 1). Figure
171
4C illustrates an example of a protein family where UMD residues indicate known
172
ligand-binding sites. The Rhodopsin-like receptor family (PF00001) contains 11 UMD
173
sites, five of which occur in sequence in the centre of Helix 3 and form interactions with
174
ligands in many structures (e.g. residues in column 780 interact with ligands in 23
175
distinct proteins; Extended Data Table 2) and includes a Na2+ binding residue. Extended
176
Data Fig. 3 shows another example of ligand binding site identification in the nuclear
177
receptor ligand binding domain family (NR-LBD; PF00104). Additionally, Extended Data
8
bioRxiv preprint first posted online Apr. 12, 2017; doi: http://dx.doi.org/10.1101/127050. The copyright holder for this preprint (which was not peer-reviewed) is the author/funder. It is made available under a CC-BY 4.0 International license.
178
Fig. 4 shows UMD sites in the NR-LBD family that are not directly involved in ligand
179
binding but instead mediate strong intra-domain cross-helical interactions that vary
180
dramatically between domains. Structures of intact DNA-bound nuclear receptors
181
suggest that in some proteins these residues interact with the LBD-DNA binding domain
182
linker and thus may mediate the ligand induced DNA binding response (Not shown. For
183
an example see Glu 295 and Ser 332 in PDB ID: 3e00 chain D.).21 These important
184
interactions may not be detected by residue co-variation analysis18 because the UMD
185
site interacts with residues aligned in different columns in each domain. One UMD site
186
is seen in the IBR domain (PF01485). In the E3 ubiquitin-protein ligase parkin, this is
187
Glu370 that recent structural studies suggest is at the interface with Ubiquitin22 and so
188
likely to be important in mediating this interaction. All other UMD classified sites can be
189
found in Supplementary Data Table 1. Together, these findings show that human
190
missense variation can stratify unconserved alignment columns to identify a small
191
number of residues likely to be important for function and specificity.
192
9
bioRxiv preprint first posted online Apr. 12, 2017; doi: http://dx.doi.org/10.1101/127050. The copyright holder for this preprint (which was not peer-reviewed) is the author/funder. It is made available under a CC-BY 4.0 International license.
193 194
Figure 4: Classification of domain residues by evolutionary conservation and relative population variation. A.
195
Odds ratios for ClinVar pathogenic variants in missense depleted (p < 0.1; see methods), enriched (p < 0.1) or
196
normal (p ≥ 0.1) alignment columns that were either conserved (CValdar < median) or unconserved (CValdar >
197
median). B. Odds ratios for ClinVar risk factor variants in different column classes. UMD columns are not
198
shown as there are zero risk factor variants in this column class; the ClinVar risk factor OR and 95 % C.I. for
199
UMD columns is 0 [0, 14]. C. Illustration of UMD residues (blue) in the Rhodopsin-like receptors (PF00001)
200
mapped to a structure of the Delta-type opioid receptor (PDB ID: 4n6h).23 Amongst the 11 UMD residues are
201
several involved in ligand binding and one that coordinates the bound sodium ion; residues 249-287 are
202
hidden for clarity.
203
204
Another striking feature of residues in columns with discordant levels of evolutionary
205
conservation and population diversity was found. Figure 4B shows the odds ratios of
206
observing ClinVar risk factor variants in columns classed according to evolutionary
207
conservation and whether they are relatively enriched in missense variants or not and
208
highlights that CME sites are significantly enriched in risk factor variants (OR = 2.27, p =
10
bioRxiv preprint first posted online Apr. 12, 2017; doi: http://dx.doi.org/10.1101/127050. The copyright holder for this preprint (which was not peer-reviewed) is the author/funder. It is made available under a CC-BY 4.0 International license.
209
0.004). This is consistent with the previous observation that missense enriched
210
columns were enriched for risk factor variants and that conserved columns showed a
211
tendency toward risk factor enrichment (Figure 3) but the combined effect is much
212
stronger. To our knowledge this is the first time that a feature marking residues pre-
213
disposed to carrying risk factor variants has been identified.
214
215
With further development, the conservation plane may yield insight into the
216
evolutionary forces acting on individual sites in protein domain families. Although this
217
will require consideration of each family’s phylogeny coupled with more detailed
218
variation metrics (e.g., considering allele frequencies, heterozygosity,
219
missense/synonymous ratios (dN/dS), McDonald–Kreitman test24 and derivatives) our
220
results offer clues as to which evolutionary signatures are being detected. Given the
221
recognised effects of different types of selection upon intra- and interspecific
222
variability,25 we can loosely associate: CMD sites with negative selection and sites
223
affected by selective sweeps; UMD sites with positive selection (here, domain
224
specialisation) and CME sites with balancing selection. Whilst these associations are
225
speculative, the structural features and disease associations of those classes are
226
congruent with these evolutionary processes.25-27 A few immediate practical
227
applications follow from the missense-depletion and conservation plane class
228
associations. For variant pathogenicity prediction, the results extend the work of
229
Gussow and coworkers4,6 and open the door to hierarchical classification where the
230
impact of a variant can be can be judged in genic, sub-genic architecture, and now,
231
residue level contexts on the basis of population variation. In protein feature prediction,
232
the ability to identify functionally important residues that are classically unconserved
233
could help to identify allosteric and surface interaction sites, whilst a metric that is
11
bioRxiv preprint first posted online Apr. 12, 2017; doi: http://dx.doi.org/10.1101/127050. The copyright holder for this preprint (which was not peer-reviewed) is the author/funder. It is made available under a CC-BY 4.0 International license.
234
sensitive to specificity determining residues should prove useful in understanding
235
enzyme active sites and other functional sites in more detail.
236
237
238
Methods
239
Datasets, Mapping and Filtering
240
Protein family alignments were downloaded from Pfam (v29)7,8 and parsed using
241
Biopython (v1.66, with patches #768 #769)28 and conservation scores were calculated
242
by AACons via JABAWS (v2.1).29 The human sequences in the alignment were mapped
243
to the corresponding full UniProt sequences to create keys between UniProt sequence
244
residue numbers and Pfam alignment column numbers. For each human sequence,
245
germline population variants were retrieved from Ensembl 8414,15 via the Ensembl API
246
using ProteoFAV.30 Ensembl variants are provided with indexes to UniProt sequence
247
residue numbers and were thus mapped to Pfam alignment columns.
248
249
Ensembl variation agglomerates variants and annotation data from a variety of sources
250
including dbSNP (v146), 1KG, ESP and ExAC1. A full description of the variant sources
251
present in Ensembl 84 is available at
252
http://mar2016.archive.Ensembl.org/info/genome/variation/sources_documentation.
253
html. Ensembl provides numerous annotations including the predicted protein
254
consequences (i.e. missense, synonymous, stop gained, etc.), minor allele frequency
255
(MAF) and ClinVar20 disease status. These annotations were used to filter the Pfam-
256
mapped variants for the collection of variant sub-class alignment column statistics. For
257
example, this is how the number of ClinVar ‘pathogenic’ missense variants in each
258
alignment column was calculated.
12
bioRxiv preprint first posted online Apr. 12, 2017; doi: http://dx.doi.org/10.1101/127050. The copyright holder for this preprint (which was not peer-reviewed) is the author/funder. It is made available under a CC-BY 4.0 International license.
259
260
Pfam (v29) contains 16,035 domain family alignments. Variants were gathered and
261
mapped to the alignments for the 6,088 families that contain at least one human
262
sequence. For inclusion in this analysis, a minimum threshold of five human sequences
263
was adopted corresponding to 2,939 protein families. However, some of these families
264
do not meet this criterion after sequence duplication correction (see below) leaving
265
1,376 families. Finally, alignment column conservation scores could not be obtained for
266
85 of the families, resulting in a final dataset of 1,291 protein families. These families
267
contain an estimated 25,158 human protein domains. Only columns with ≥ 5 human
268
residues (i.e., non-gap) were considered, corresponding to 159,296 alignment columns.
269
This filter was applied in all analyses reported in this work.
270
271
Variant Duplication
272
Some alignments contained variants that mapped to multiple sequences due to
273
sequence duplication. For example, in PF00001 all variants that mapped to the human
274
sequence P2Y11/45-321 (P2Y purinoceptor 11) from the P2RY11 gene are duplicated
275
in A0A0B4J1V8/465-741 because this sequence contains the same 7 transmembrane
276
receptor domain as P2Y11 as a result of A0A0B4J1V8 being the product of a read-
277
through transcript that includes the P2RY11 gene. This means there are two copies of
278
the P2RY11 7 transmembrane receptor domain in the alignment and its variant profile
279
is doubly weighted. Another example in this family comes from human sequences
280
MSHR/55-298 (Melanocortin receptor 1), G3V4F0/55-298 and A0A0B4J269, which all
281
are mapped to the same genomic loci. Accordingly, sequence duplication was accounted
282
for by de-duplicating variants and sequences before summing over columns.
283
13
bioRxiv preprint first posted online Apr. 12, 2017; doi: http://dx.doi.org/10.1101/127050. The copyright holder for this preprint (which was not peer-reviewed) is the author/funder. It is made available under a CC-BY 4.0 International license.
284
Statistical Analyses
285
The statistical analyses were all performed using R version 3.2.2. Regressions were
286
calculated by the lm function from the stats library. Odds ratios and Fishers exact p
287
values were calculated with the fisher.test function from the stats library. Plots were
288
produced with ggplot2.
289
290
Alignment Column Classification
291
Columns were classified as depleted, enriched or neutral with respect to the column
292
variant totals relative to the average for the other columns in the alignment. For each
293
alignment column x, a 2×2 table was constructed of the form a, b, c, d with elements: a.
294
the number of variants mapped to residues in column x, b. the total number of variants
295
mapped to all other alignment columns, c. the number of human residues in column x
296
and d. the total number of human residues in the rest of the alignment. Application of
297
the R stats function fisher.test to each table yielded an odds ratio > 1 if the column
298
contained more than the alignment average number of variants per human residue or
299
OR < 1 if there were fewer than the average number of variants per human residue. The
300
function also provided the p value afforded by Fisher’s exact test. This meant that for a
301
given pthreshold columns with p ≥ pthreshold were considered normal and columns with p <
302
pthreshold were considered depleted if OR < 1 or enriched if OR > 1. Notably, in addition to
303
the effect size, p is sensitive to data availability (i.e., variant counts) and alignment
304
column occupancy. In this work, pthreshold = 0.1 unless otherwise specified.
305
306
Structural Analysis of Evolutionary Unconserved and Missense Depleted Residues
307
Columns were classified as unconserved-missense depleted (UMD) or unconserved-
308
missense enriched (UME) if they displayed significant residue diversity (VShenkin in 4th
14
bioRxiv preprint first posted online Apr. 12, 2017; doi: http://dx.doi.org/10.1101/127050. The copyright holder for this preprint (which was not peer-reviewed) is the author/funder. It is made available under a CC-BY 4.0 International license.
309
quartile) and were missense depleted or enriched, respectively. The 343 columns in 211
310
families that met these criteria were subjected to an automated analysis where the
311
flagged residues were mapped to PDB structures via SIFTS;31 270 columns from 160
312
families were mapped to at least one PDB structure. Biological units were obtained from
313
the PDBe in mmCIF format. When multiple biological units were available for a
314
particular asymmetric unit, the preferred biological unit ID was obtained by querying
315
the PDBe API.32 Atoms were considered to interact if they were within 5 Å. A residue
316
was considered to participate in a domain interaction if it interacted with a Pfam
317
domain on a different PDB chain. Residue relative solvent accessibilities (RSAs) were
318
calculated from the DSSP accessible surface33 as described in Tien et al.34 and were
319
classified as surface (RSA > 25%), partially exposed (5% < RSA ≤ 25%) or core (RSA ≤
320
5%).
321
322
The results of the automated analysis were supplemented by a manual structural
323
analysis using a workflow enabled by the Jalview multiple sequence alignment
324
workbench35 and the UCSF Chimera molecular graphics program.36 Jalview feature files
325
identifying the UMD columns were generated. When the feature files were loaded onto
326
the appropriate alignment in Jalview, the residues in the UMD columns were highlighted
327
for the user. Jalview was then used to find PDB structures for the sequences in the
328
alignment that were then visualised in UCSF Chimera. Jalview automatically mapped the
329
UMD residue annotations to the PDB structure so that the residues could be assessed in
330
their structural context. UCSF Chimera was used to identify other residues in the
331
structure that were hydrogen bonded to, or had a Van der Waals distance < 1 Å with, a
332
side-chain atom of any UMD residues present. The residues were then classified
333
according to any contacts made as either: ligand binding, ion binding, inter-domain
15
bioRxiv preprint first posted online Apr. 12, 2017; doi: http://dx.doi.org/10.1101/127050. The copyright holder for this preprint (which was not peer-reviewed) is the author/funder. It is made available under a CC-BY 4.0 International license.
334
interaction, intra-domain interaction or surface residue. This analysis found that of
335
those families with UMD residues, 19% had at least one UMD site involved in ligand-
336
binding whilst 42% had a site directly involved in domain-domain interactions.
337
338
Code availability
339
The code used in this study will be available from the Barton Group GitHub repository
340
at https://github.com/bartongroup/ on journal publication. The software was not
341
designed for portability and may not function as intended in all environments, but the
342
source code illustrates our methodology. We are currently developing a production
343
version that will enable users to apply our methods to their own alignments to be
344
released in the same repository.
345
346
Data availability
347
The multiple sequence alignments and human variation data that underlie and support
348
the findings of this study are available from Pfam, http://pfam.xfam.org/ and Ensembl
349
84, http://www.Ensembl.org/, respectively. The calculated data, including alignment
350
column variation statistics and residue conservation scores are presently available from
351
the corresponding author upon request whilst a web resource is under development.
352
The UMD columns are also identified in the supplementary material.
353
354
References
355
1
356 357
2
358 359
3
360
Lek, M. et al. Analysis of protein-coding genetic variation in 60,706 humans. Nature 536, 285-291, doi:10.1038/nature19057 (2016). Telenti, A. et al. Deep sequencing of 10,000 human genomes. Proc Natl Acad Sci U S A 113, 11901-11906, doi:10.1073/pnas.1613365113 (2016). Genomes Project, C. et al. A map of human genome variation from populationscale sequencing. Nature 467, 1061-1073, doi:10.1038/nature09534 (2010).
16
bioRxiv preprint first posted online Apr. 12, 2017; doi: http://dx.doi.org/10.1101/127050. The copyright holder for this preprint (which was not peer-reviewed) is the author/funder. It is made available under a CC-BY 4.0 International license.
361
4
362 363 364
5
365 366 367
6
368 369 370 371
7
372 373
8
374 375
9
376 377
10
378 379 380
11
381 382
12
383 384 385
13
386 387 388
14
389 390
15
391 392
16
393 394
17
395 396 397
18
398 399
19
400 401 402
20
403 404 405
21
406 407
22
408 409
Petrovski, S., Wang, Q., Heinzen, E. L., Allen, A. S. & Goldstein, D. B. Genic intolerance to functional variation and the interpretation of personal genomes. PLoS Genet 9, e1003709, doi:10.1371/journal.pgen.1003709 (2013). MacArthur, D. G. et al. A systematic survey of loss-of-function variants in human protein-coding genes. Science 335, 823-828, doi:10.1126/science.1215040 (2012). Gussow, A. B., Petrovski, S., Wang, Q., Allen, A. S. & Goldstein, D. B. The intolerance to functional genetic variation of protein domains predicts the localization of pathogenic mutations within genes. Genome Biol 17, 9, doi:10.1186/s13059-016-0869-4 (2016). Finn, R. D. et al. Pfam: the protein families database. Nucleic Acids Res 42, D222230, doi:10.1093/nar/gkt1223 (2014). Finn, R. D. et al. The Pfam protein families database: towards a more sustainable future. Nucleic Acids Res 44, D279-285, doi:10.1093/nar/gkv1344 (2016). Valdar, W. S. Scoring residue conservation. Proteins 48, 227-241, doi:10.1002/prot.10146 (2002). Melloni, G. E. et al. LowMACA: exploiting protein family analysis for the identification of rare driver mutations in cancer. BMC Bioinformatics 17, 80, doi:10.1186/s12859-016-0935-7 (2016). Miller, M. L. et al. Pan-Cancer Analysis of Mutation Hotspots in Protein Domains. Cell Syst 1, 197-209, doi:10.1016/j.cels.2015.08.014 (2015). Yang, F. et al. Protein domain-level landscape of cancer-type-specific somatic mutations. PLoS Comput Biol 11, e1004147, doi:10.1371/journal.pcbi.1004147 (2015). Peterson, T. A., Park, D. & Kann, M. G. A protein domain-centric approach for the comparative analysis of human and yeast phenotypically relevant mutations. BMC Genomics 14 Suppl 3, S5, doi:10.1186/1471-2164-14-S3-S5 (2013). Yates, A. et al. Ensembl 2016. Nucleic Acids Res 44, D710-716, doi:10.1093/nar/gkv1157 (2016). Chen, Y. et al. Ensembl variation resources. BMC Genomics 11, 293, doi:10.1186/1471-2164-11-293 (2010). Cuff, J. A. & Barton, G. J. Application of multiple sequence alignment profiles to improve protein secondary structure prediction. Proteins 40, 502-511 (2000). Mistry, J., Bateman, A. & Finn, R. D. Predicting active site residue annotations in the Pfam database. BMC Bioinformatics 8, 298, doi:10.1186/1471-2105-8-298 (2007). Marks, D. S. et al. Protein 3D structure computed from evolutionary sequence variation. PLoS One 6, e28766, doi:10.1371/journal.pone.0028766 (2011). Shenkin, P. S., Erman, B. & Mastrandrea, L. D. Information-theoretical entropy as a measure of sequence variability. Proteins 11, 297-313, doi:10.1002/prot.340110408 (1991). Landrum, M. J. et al. ClinVar: public archive of interpretations of clinically relevant variants. Nucleic Acids Res 44, D862-868, doi:10.1093/nar/gkv1222 (2016). Chandra, V. et al. Structure of the intact PPAR-gamma-RXR- nuclear receptor complex on DNA. Nature 456, 350-356, doi:10.1038/nature07413 (2008). Kumar, A. et al. Parkin–phosphoubiquitin complex reveals cryptic ubiquitinbinding site required for RBR ligase activity. Nature Structural & Molecular Biology (in press), doi:10.1038/nsmb.3400 (2017).
17
bioRxiv preprint first posted online Apr. 12, 2017; doi: http://dx.doi.org/10.1101/127050. The copyright holder for this preprint (which was not peer-reviewed) is the author/funder. It is made available under a CC-BY 4.0 International license.
410
23
411 412
24
413 414
25
415 416
26
417 418
27
419 420 421
28
422 423 424
29
425 426 427
30
428 429
31
430 431 432
32
433 434 435
33
436 437 438
34
439 440 441
35
442 443 444
36
445 446 447
37
448 449
38
450 451
39
452 453 454
40
455 456 457
41
458
Fenalti, G. et al. Molecular control of delta-opioid receptor signalling. Nature 506, 191-196, doi:10.1038/nature12944 (2014). McDonald, J. H. & Kreitman, M. Adaptive protein evolution at the Adh locus in Drosophila. Nature 351, 652-654, doi:10.1038/351652a0 (1991). Nielsen, R. Molecular signatures of natural selection. Annu Rev Genet 39, 197218, doi:10.1146/annurev.genet.39.073003.112420 (2005). Fay, J. C. Disease consequences of human adaptation. Appl Transl Genom 2, 42-47, doi:10.1016/j.atg.2013.08.001 (2013). Worth, C. L., Gong, S. & Blundell, T. L. Structural and functional constraints in the evolution of protein families. Nat Rev Mol Cell Biol 10, 709-720, doi:10.1038/nrm2762 (2009). Cock, P. J. et al. Biopython: freely available Python tools for computational molecular biology and bioinformatics. Bioinformatics 25, 1422-1423, doi:10.1093/bioinformatics/btp163 (2009). Troshin, P. V., Procter, J. B. & Barton, G. J. Java bioinformatics analysis web services for multiple sequence alignment--JABAWS:MSA. Bioinformatics 27, 2001-2002, doi:10.1093/bioinformatics/btr304 (2011). Britto-Borges, T., Madeira, F., MacGowan, S. A. & Barton, G. J. ProteoFAV: fast structural data integration. Manuscript in preparation (2017). Velankar, S. et al. SIFTS: Structure Integration with Function, Taxonomy and Sequences resource. Nucleic Acids Res 41, D483-489, doi:10.1093/nar/gks1258 (2013). Velankar, S. et al. PDBe: improved accessibility of macromolecular structure data from PDB and EMDB. Nucleic Acids Res 44, D385-395, doi:10.1093/nar/gkv1047 (2016). Kabsch, W. & Sander, C. Dictionary of protein secondary structure: pattern recognition of hydrogen-bonded and geometrical features. Biopolymers 22, 2577-2637, doi:10.1002/bip.360221211 (1983). Tien, M. Z., Meyer, A. G., Sydykova, D. K., Spielman, S. J. & Wilke, C. O. Maximum allowed solvent accessibilites of residues in proteins. PLoS One 8, e80635, doi:10.1371/journal.pone.0080635 (2013). Waterhouse, A. M., Procter, J. B., Martin, D. M., Clamp, M. & Barton, G. J. Jalview Version 2--a multiple sequence alignment editor and analysis workbench. Bioinformatics 25, 1189-1191, doi:10.1093/bioinformatics/btp033 (2009). Pettersen, E. F. et al. UCSF Chimera--a visualization system for exploratory research and analysis. J Comput Chem 25, 1605-1612, doi:10.1002/jcc.20084 (2004). Larkin, M. A. et al. Clustal W and Clustal X version 2.0. Bioinformatics 23, 29472948, doi:10.1093/bioinformatics/btm404 (2007). Xu, W., Doshi, A., Lei, M., Eck, M. J. & Harrison, S. C. Crystal structures of c-Src reveal features of its autoinhibitory mechanism. Mol Cell 3, 629-638 (1999). Huet, T., Fraga, R., Mourino, A., Moras, D. & Rochel, N. Design, Chemical synthesis, Functional characterization and Crystal structure of the sidechain analogue of 1,25-dihydroxyvitamin D3. To be published, doi:10.2210/pdb3ogt/pdb (2011). Souza, P. C. et al. Identification of a new hormone-binding site on the surface of thyroid hormone receptor. Mol Endocrinol 28, 534-545, doi:10.1210/me.20131359 (2014). Capelli, D. et al. Structural basis for PPAR partial or full activation revealed by a novel ligand binding mode. Sci Rep 6, 34792, doi:10.1038/srep34792 (2016).
18
bioRxiv preprint first posted online Apr. 12, 2017; doi: http://dx.doi.org/10.1101/127050. The copyright holder for this preprint (which was not peer-reviewed) is the author/funder. It is made available under a CC-BY 4.0 International license.
459
42
460 461 462
43
463 464 465
44
466 467 468 469 470
45
471 472
46
473 474
Blind, R. D. et al. The signaling phospholipid PIP3 creates a new interaction surface on the nuclear receptor SF-1. Proc Natl Acad Sci U S A 111, 15054-15059, doi:10.1073/pnas.1416740111 (2014). Raaijmakers, H. C., Versteegh, J. E. & Uitdehaag, J. C. The X-ray structure of RU486 bound to the progesterone receptor in a destabilized agonistic conformation. J Biol Chem 284, 19572-19579, doi:10.1074/jbc.M109.007872 (2009). Kallen, J. et al. Evidence for ligand-independent transcriptional activation of the human estrogen-related receptor alpha (ERRalpha): crystal structure of ERRalpha ligand binding domain in complex with peroxisome proliferatoractivated receptor coactivator-1alpha. J Biol Chem 279, 49330-49337, doi:10.1074/jbc.M407999200 (2004). Wisely, G. B. et al. Hepatocyte nuclear factor 4 is a transcription factor that constitutively binds fatty acids. Structure 10, 1225-1234 (2002). le Maire, A. et al. A unique secondary-structure switch controls constitutive gene repression by retinoic acid receptor. Nat Struct Mol Biol 17, 801-807, doi:10.1038/nsmb.1855 (2010).
475
476
Acknowledgements
477
We thank the Jalview development team for their help with streamlining the
478
visualisation of alignment and structural data and Jim Procter for additional assistance
479
in using AACons and useful discussions regarding evolutionary theory in relation to
480
multiple sequence alignments. We also thank Helen Walden, Maurice van Steensel,
481
Ulrich Zachariae, Owen Vickery, David Gray and Alessio Ciulli for discussions about
482
specific protein families. This work was supported by Wellcome Trust Strategic Awards
483
[098439/Z/12/Z and WT097945], Wellcome Trust Doctoral Training Account
484
[100150/Z/12/Z], Wellcome Trust Biomedical Resources Grant [101651/Z/13/Z],
485
Coordenação de Aperfeiçoamento de Pessoal de Nível Superior studentship [CAPES
486
process 1529/12-9] and Biotechnology and Biological Sciences Research Council Grants
487
[BB/J019364/1, BB/L020742/1].
488
489
19
bioRxiv preprint first posted online Apr. 12, 2017; doi: http://dx.doi.org/10.1101/127050. The copyright holder for this preprint (which was not peer-reviewed) is the author/funder. It is made available under a CC-BY 4.0 International license.
490
Author contributions
491
S.A.M. designed and performed the study, analysed data and wrote the manuscript. F.M.
492
contributed software to collect variation data and collected the interaction and RSA data
493
for UMD and UME residues. T.B. contributed software to collect variation data. M.S.
494
performed the manual structural analysis of UMD residues. C.C. analysed data. G.J.B.
495
designed the study, analysed data and wrote the manuscript.
496
497
Author information
498
1. Division of Computational Biology, School of Life Sciences, University of Dundee,
499
Dundee, UK. 2. Centre for Dermatology and Genetic Medicine, School of Life Sciences,
500
University of Dundee, Dundee, U.K. Correspondence should be addressed to G.J.B.
501
(
[email protected]). The authors declare no competing financial interests.
502
20
bioRxiv preprint first posted online Apr. 12, 2017; doi: http://dx.doi.org/10.1101/127050. The copyright holder for this preprint (which was not peer-reviewed) is the author/funder. It is made available under a CC-BY 4.0 International license.
503
Extended Data Captions
504
505 506
507
Extended Data Figure 1: An extract of the SH2 alignment (PF00017.21) showing the
508
influence of secondary structure constraints upon evolutionary conservation and
509
missense depletion. a. Alignment with Clustal X37 colouring where blue indicates
510
hydrophobic residue conservation. b. Consensus secondary structure from Pfam
511
(v31);7,8 labelled elements indicate the archetypal SH2 partially buried helices (I.a and
512
I.b) and β-strands (II.a-c). c. Missense depleted columns with P ≤ 0.2. d. Columns with
513
VShenkin ≤ 20. The pattern of conserved hydrophobic residues in a are indicative of the
514
structural constraints imposed by the secondary structure elements in b. These
515
structural constraints are known to produce patterns in conservation metrics like
21
bioRxiv preprint first posted online Apr. 12, 2017; doi: http://dx.doi.org/10.1101/127050. The copyright holder for this preprint (which was not peer-reviewed) is the author/funder. It is made available under a CC-BY 4.0 International license.
516
VShenkin in d. These constraints also influence the distribution of missense depleted
517
columns in c. Figure created with Jalview.35
518
22
bioRxiv preprint first posted online Apr. 12, 2017; doi: http://dx.doi.org/10.1101/127050. The copyright holder for this preprint (which was not peer-reviewed) is the author/funder. It is made available under a CC-BY 4.0 International license.
519 520
Extended Data Figure 2: Inter-domain interactions of the SH2 domain in inactivated Src
521
(PDB ID: 2src).38 The surface of the SH2 domain (PF00017) is coloured red to yellow
522
corresponding to a. missense depletion P over range [0, 0.2) and b. VShenkin over range
523
[0, 20); white surface regions are outside these ranges. The sub-panels show
524
interactions with the Src SH3 domain (yellow), kinase-SH2 linker (tan) and the tail
23
bioRxiv preprint first posted online Apr. 12, 2017; doi: http://dx.doi.org/10.1101/127050. The copyright holder for this preprint (which was not peer-reviewed) is the author/funder. It is made available under a CC-BY 4.0 International license.
525
region including phosphorylated-Tyr (tan). Residues that interact with the SH2 domain
526
are displayed as sticks. Figure created with Jalview35 and UCSF Chimera.36
527
24
bioRxiv preprint first posted online Apr. 12, 2017; doi: http://dx.doi.org/10.1101/127050. The copyright holder for this preprint (which was not peer-reviewed) is the author/funder. It is made available under a CC-BY 4.0 International license.
528 529
530
Extended Data Figure 3: Examples of UMD residues (blue) involved in ligand-binding in
531
the nuclear receptor ligand binding domains protein family (PF00104). a. VDR in
532
complex with a calcitriol analog (3ogt).39 b. THa in complex with triiodothyronine
533
(4lnx).40 c. PPARg (5hzc) and d. PPARa (5hyk) in complex with the PPAR pan-agonist
534
AL29-26.41 The ligand is in VdW contact with the unconserved-depleted L330 in PPARg
535
and with Y314 in PPARa. Note that the substitution at the unconserved-depleted site
536
H323 in PPARg to Y314 in PPARa is related to the activity specificity of these two
537
receptors with respect to AL29-26.41 Figure created with UCSF Chimera36 and Jalview.35
538
25
bioRxiv preprint first posted online Apr. 12, 2017; doi: http://dx.doi.org/10.1101/127050. The copyright holder for this preprint (which was not peer-reviewed) is the author/funder. It is made available under a CC-BY 4.0 International license.
539 540
541
Extended Data Figure 4: Local environments of the UMD residue of H5 distal to the
542
ligand binding pocket (blue). π-π interactions between residues a. Tyr A312 and Phe
543
A368 in SF-1 (4qk4),42 b. Trp A765 and Phe A818 of PR (2w8y)43 and c. Gln A371 and
544
Tyr A422 of ERRa (1xb7).44 Equivalent residues also form salt-bridge interactions with
545
H8 illustrated by e) Lys A185 and Asp A233 of HNF-4g (1lv2).45 In other proteins these
546
strong, specific interactions are replaced with general hydrophobic contacts such as in
547
d. Thr B275, which is in contact with both Phe B199 and Thr B326 of RARa (3kmz)46
548
and the same interactions are observed in RARg (e.g. see 1fcx, not shown). f. Lastly, the
549
negatively charged Glu A277 found in this position of VDR (3ogt)39 forms a potential
550
salt-bridge with His A139 and pi-pi interactions with Tyr A143. This results in a
551
radically different interaction topology where the site binds to a different helix. Figure
552
created with UCSF Chimera36 and Jalview.35
553
26
bioRxiv preprint first posted online Apr. 12, 2017; doi: http://dx.doi.org/10.1101/127050. The copyright holder for this preprint (which was not peer-reviewed) is the author/funder. It is made available under a CC-BY 4.0 International license.
554
Extended Data Table 1: Differences in the structural properties of unconserved residues
555
differentiated by their human missense variation classification.
556
557
Observed in Not observed one or more mapped PDB in any mapped PDB ORc p c a, e d d Residue Counts UMD UME UMD UME Ligand 765 1,448 5,579 14,454 1.37 6.4 × 10⁻¹¹ Domain 649 1,312 5,695 14,590 1.27 3.5 × 10-06 Ligand, domain or nucleotides 1,338 2,549 5,006 13,353 1.40 0 Core 1,635 1,995 4,709 13,907 2.42 0 Part-exposed 2,584 4,526 3,760 11,376 1.73 0 Surface 3,213 11,742 3,131 4,160 0.36 0 b, e Column Counts Ligand 156 407 114 357 1.20 0.23 Domain (inter-chain) 131 328 139 436 1.25 0.18 Ligand, domain or nucleotides 201 494 69 279 1.59 0.0033 Core 179 406 91 358 1.73 2.0 × 10-04 Part-exposed 231 607 39 157 1.53 0.03 Surface 253 735 17 29 0.59 0.12 a. Protein residues are counted in possession of the row feature if it is observed in any mapped PDB
558
residue and are counted as lacking the feature if it is not observed in any of its mapped PDB residues.
559
Residues that did not map to at least one PDB structure are not counted. For example, 765 UMD residues
560
map to at least one PDB structure and bind a ligand in at least one of these structures whilst 5,579 UMD
561
residues also map to at least one PDB structure but do not bind a ligand in any of them. b. Pfam columns
562
are counted in possession of the row feature if it is observed in any mapped PDB residue that is aligned in
563
the column and are counted as lacking the feature if it is not observed in any of its mapped PDB residues
564
present in the column. Columns that did not contain at least one residue that mapped to a PDB structure
565
were not counted. For example, 156 UMD columns contain at least one residue that maps to a PDB
566
structure that shows the residue is in contact with a ligand whilst 114 UMD columns contain at least one
567
residue that maps to a PDB structure but a ligand interaction is not observed in any mapped structure.
568
Note that the column statistics are not sensitive to family size variability. c. Fisher’s test of association
569
between column classification (UMD or UME) and structural property; OR > 1 indicates enrichment of the
570
row feature in the UMD class. For example, the enrichment of ligand binding residues in UMD columns
571
compared to UME columns (OR = 1.20; p = 0.23) is calculated from the contingency table [(156, 407),
572
(114, 357)]. d. Unconserved-missense depleted (UMD) residues were defined as mapping to Pfam
573
columns with VShenkin in 4th quartile for the protein family that are also missense depleted (see Methods)
27
bioRxiv preprint first posted online Apr. 12, 2017; doi: http://dx.doi.org/10.1101/127050. The copyright holder for this preprint (which was not peer-reviewed) is the author/funder. It is made available under a CC-BY 4.0 International license.
574
whilst unconserved-missense enriched (UME) residues are equally divergent but missense enriched. e.
575
See Methods for feature definitions.
576
28
bioRxiv preprint first posted online Apr. 12, 2017; doi: http://dx.doi.org/10.1101/127050. The copyright holder for this preprint (which was not peer-reviewed) is the author/funder. It is made available under a CC-BY 4.0 International license.
577
Extended Data Table 2: Example proteins with protein, ligand or nucleotide binding
578
interactions involving residues in unconserved-missense depleted (UMD) columns from
579
selected families (see Supplementary Data Table 1 for all families with discovered UMD
580
columns).
581
Family Col.a Res.b PF00001 PF00076 PF00104
582
525
89
575
98
584
99
780 129 792 130 808 131 818 132 832 134 1075 176 1141 187 1328 211 291 148
Proteinc
Ligandc
ACM3_RAT (4u15) [2] B3GWA1_CAEEL* (5ca5) [13]
AA2AR_HUMAN (5iu8) [6]
ACM3_RAT (4u14) [6]
5HT1B_HUMAN* (4iar) [23]
5HT1B_HUMAN* (4iaq) [23]
5HT2B_HUMAN (4nc3) [4]
5HT2B_HUMAN (4nc3) [7]
ACM2_HUMAN (4mqs) [7]
5HT2B_HUMAN (4ib4) [8]
AA2AR_HUMAN (2ydo) [4] AA2AR_HUMAN (4eiy) [6]
B3GWA1_CAEEL* (5ca5) [10]
CELF1_HUMAN (3nmr) [29]
190 715
ESR1_HUMAN (2jf9) [4]
312 743
NR4A1_HUMAN (3v3e) [3]
A0A0B4J1T2_HUMAN* (2amb) [17] ANDR_HUMAN (1e3g) [35]
330 750
NR4A1_HUMAN (3v3e) [2]
ANDR_HUMAN (1t5z) [39]
332 752
Nucleotidec
NR1I3_MOUSE (1xnx) [3] A0A0B4J1T2_HUMAN* (1t5z) [12]
a. Pfam alignment column number, b. UniProt residue number for aligned residue of asterisked sequence
583
in columns 4-6. For example, in the PF00001 (Rhodopsin-like receptor family) the numbering
584
corresponds to 5HT1B_HUMAN and in PF00076 it corresponds to B3GWA1_CAEEL. This additional
585
numbering allows the distance between UMD residues to be assessed in sequence space, which is
586
obscured by gaps in Pfam alignment column indexes. c. Example protein and PDB structure where this
587
interaction is observed. Number in parenthesis indicates how many domains in total have at least one
588
PDB structure that provides evidence for the interaction. For example, the first row indicates that the
589
AA2AR_HUMAN residue aligned in column 525 of PF00001 is in contact with a ligand in PDB 5iu8 and
590
there are a total of 6 domains that display this interaction type in at least one PDB structure. Additionally,
591
residue 89 of 5HT1B_HUMAN maps to column 525 of PF00001.
592
29
bioRxiv preprint first posted online Apr. 12, 2017; doi: http://dx.doi.org/10.1101/127050. The copyright holder for this preprint (which was not peer-reviewed) is the author/funder. It is made available under a CC-BY 4.0 International license.
593
Supplementary Data
594
Supplementary Data Table 1: Example proteins with protein, ligand or nucleotide
595
binding interactions involving residues in unconserved-missense depleted (UMD)
596
columns. See table end for footnotes.
597
Family Col.a Res.b PF00001 PF00004 PF00011
525
89
575
98
584
99
780 129 792 130 808 131 818 132 832 134 1075 176 1141 187 1328 211
Proteinc
Ligandc
ACM3_RAT (4u15) [2]
557 172 A4YHC5_METS5* (4d80) [12] 690 197
CLPC_BACSU (3pxg) [4]
Nucleotidec
AA2AR_HUMAN (5iu8) [6]
AA2AR_HUMAN (4eiy) [6] FTSH_THET8 (1ixz) [1]
DLG4_RAT (2xkx) [6]
ABL1_HUMAN* (4j9d) [8]
ACTS_RABIT* (1o18) [4]
ACTS_RABIT* (2a3z) [2]
2486 281
ACTS_RABIT* (1o18) [1]
ACTS_RABIT* (2asm) [1]
2690 316
ACTS_RABIT* (1o18) [2]
ACTS_RABIT* (1s22) [2]
62 537
TRPA1_HUMAN (3j9p) [3]
ANK1_HUMAN* (1n11) [7]
56 304
FA11_HUMAN* (2j8j) [1]
GLOB6_CAEEL (3mvc) [7]
PF00042
196
PF00043
397 183
MCA3_HUMAN (5bmu) [1]
D2WL63_POPTR* (5f05) [3]
102 229
MMP9_HUMAN (1itv) [1]
HEMO_RABIT* (1qhu) [4]
PF00047
148
54
CD4_HUMAN* (3j70) [3]
CD4_HUMAN* (2nxy) [2]
PF00049
105
73
INS_BOVIN (2a3g) [4]
IGF1_HUMAN* (1imx) [3]
75 222
C209B_MOUSE* (3zhg) [7]
CLC1B_HUMAN (3wsr) [10]
171 245
CD209_HUMAN (1k9i) [8]
C209B_MOUSE* (4c9f) [4]
PF00076
291 148 B3GWA1_CAEEL* (5ca5) [13]
PF00079
263 101
ILEU_HORSE (1hle) [5]
GSTM1_RAT (3fyg) [3]
426 192
CYGB_HUMAN* (2dc3) [6]
266 102
PF00031
490 134
CYTC_HUMAN* (3qrd) [1]
CXB2_HUMAN* (2zw3) [1]
83
DPA44_BPT4 (3u60) [1]
CYTC_HUMAN* (1tij) [1]
61
116
179
PF00074
PF00029
PF00063 1233 226
AA2AR_HUMAN (2ydo) [4]
176 104 PF00022 1610 190
PF00059
5HT2B_HUMAN (4ib4) [8]
ABL1_HUMAN* (1bbz) [9]
PF00045
ACM2_HUMAN (4mqs) [7]
DLG4_RAT (2xkx) [6]
90
5HT2B_HUMAN (4nc3) [7]
94
PF00024
5HT2B_HUMAN (4nc3) [4]
142
PF00023
5HT1B_HUMAN* (4iaq) [23]
58 HS16B_WHEAT* (1gme) [7]
5HT1B_HUMAN* (4iar) [23]
104
PF00018
ACM3_RAT (4u14) [6]
F1RQI7_PIG* (4pjm) [5] ECP_HUMAN* (4a2o) [2] B3GWA1_CAEEL* (5ca5) [10]
CELF1_HUMAN (3nmr) [29]
A1AT_HUMAN* (1hp7) [2]
ANT3_HUMAN (1sr5) [5]
30
bioRxiv preprint first posted online Apr. 12, 2017; doi: http://dx.doi.org/10.1101/127050. The copyright holder for this preprint (which was not peer-reviewed) is the author/funder. It is made available under a CC-BY 4.0 International license.
Family Col.a Res.b PF00100
Proteinc
Ligandc
Nucleotidec
764 591
TGBR3_RAT* (3qw9) [2]
TGBR3_RAT* (3qw9) [1]
PF00102 1290 255
PTN1_HUMAN* (2cm3) [2]
PF00104 PF00118 PF00125 PF00134 PF00135 PF00149 PF00151 PF00155 PF00157 PF00160 PF00168 PF00170 PF00171 PF00173
190 715
ESR1_HUMAN (2jf9) [4]
312 743
NR4A1_HUMAN (3v3e) [3]
PTN11_HUMAN (4gwf) [2] A0A0B4J1T2_HUMAN* (2amb) [17] ANDR_HUMAN (1e3g) [35]
330 750
NR4A1_HUMAN (3v3e) [2]
ANDR_HUMAN (1t5z) [39]
332 752 198
A8JE91_CHLRE* (5cdi) [6]
435 138
A8JE91_CHLRE* (5cdi) [10]
CH60_ECOLI (1xck) [1]
781 207
A8JE91_CHLRE* (5cdi) [6]
CH602_MYCTU (3rtk) [1]
468 102 CENPA_HUMAN* (3an2) [17] 226 229
CCND3_HUMAN (3g33) [2]
578 296
CCNA2_HUMAN* (1jsu) [6]
496 103
EST1_HUMAN (1mx1) [1]
1571 265
CCNC_HUMAN (3rgf) [2]
ACES_HUMAN* (4ey7) [3]
ACES_MOUSE (4b84) [4] ACES_MOUSE (2ha0) [2]
J3K8M7_COCIM (5b8i) [9]
ASM3A_MOUSE (5fc1) [10]
MRE11_METJA (4tug) [1]
926 126
G0RYR3_CHATD (4yke) [6]
ASM_MOUSE (5hqn) [4]
MRE11_METJA (4tug) [1]
932 128
MRE11_METJA (4tug) [3]
A6THC4_KLEP7* (3jyf) [11]
LIPP_HUMAN* (1lpb) [2]
AAT_ECOLI (3qn6) [8]
289
74
345
96
795 202 290
87
341
95
698 151 804 162 118 184 122
72
978 217
1A12_SOLLC* (1iax) [51] 1A12_SOLLC* (1iax) [28] C6XII3_HIRBI* (5ex1) [1]
247
26
312
39
UN13A_RAT (2cjt) [1]
579
77
SYT1_HUMAN (2k8m) [1]
234 148
HY5_ARATH* (2oqq) [1] A1U6U7_MARHV* (3rh9) [43]
886 139 1260 209
CYB5B_HUMAN* (3ner) [1]
389 138
CAH12_HUMAN* (1jcz) [2]
PF00209 1454 271
O67854_AQUAE* (3tt1) [2]
PF00211
925 125
64
PF00194
NR1I3_MOUSE (1xnx) [3] A0A0B4J1T2_HUMAN* (1t5z) [12]
76
522 110
198
1877 333
AADAT_HUMAN (2r2n) [7]
AAT_ECOLI (3zzk) [4] AAT_ECOLI (3qpg) [4] Q7RRM6_PLAYO (2b71) [1]
PO5F1_MOUSE* (3l1p) [1]
PPIA_HUMAN (4ipz) [2]
CAR1_ARATH* (5a52) [27]
DYSF_HUMAN (4ihb) [9]
CAR1_ARATH* (5a52) [12]
B1XMM6_SYNP2 (4it9) [1]
CAH2_HUMAN (2q38) [3]
Q9KDT3_BACHD (4us3) [1]
228 902
ADCY2_RAT* (1u0h) [4]
155 563
NOS2_HUMAN* (3hr4) [1]
PF00270 1238 199
DBP5_YEAST* (3rrm) [4]
DDX3X_HUMAN (4pxa) [1] DD19B_HUMAN (3fht) [2]
1405 220
DBP5_YEAST* (3rrm) [2]
DBP5_YEAST* (3pew) [3] DD19B_HUMAN (3fht) [2]
1591 253
DBP5_YEAST* (3rrm) [4]
DBP5_YEAST* (3pew) [5]
556 143
AP4A_HUMAN (4ijx) [5]
8ODP_HUMAN* (3q93) [8]
PF00258
PF00293
ADCYA_HUMAN (4clu) [1]
DBP5_YEAST* (3pew) [5]
31
bioRxiv preprint first posted online Apr. 12, 2017; doi: http://dx.doi.org/10.1101/127050. The copyright holder for this preprint (which was not peer-reviewed) is the author/funder. It is made available under a CC-BY 4.0 International license.
Family Col.a Res.b PF00300
Proteinc
Ligandc
Nucleotidec
485 321
F262_HUMAN* (5htk) [4]
F262_HUMAN* (5htk) [2]
913 367
PGAM1_HUMAN (4gpi) [4]
F262_HUMAN* (5htk) [2]
437 229
ACTN3_HUMAN (3lue) [4]
ACTN2_HUMAN* (4d1e) [4]
PF00350
868 152
DRP1A_ARATH* (3t34) [2]
PF00365
119 630
PFKA1_YEAST* (3o8o) [3]
PF00378
543 861
PF00307
PF00386 PF00406 PF00412
71 B1MEE0_MYCA9 (3qxz) [12]
A0R747_MYCS2 (3moy) [3]
92
B1MIA8_MYCA9 (3rsi) [4]
A0QS88_MYCS2* (4qfe) [6]
272 193
ADIPO_MOUSE (1c28) [10]
ADIPO_HUMAN* (4dou) [6]
370 228
ADIPO_MOUSE (1c28) [3]
C1QT5_HUMAN (4nn0) [3]
KAD_FRATT* (4pzl) [2]
KAD1_HUMAN (1z83) [2]
LHX4_MOUSE* (3mmk) [2]
502
74
853 118 129
49
PF00413
898 210
MMP13_HUMAN (2ozr) [2]
PF00431
304 221
C1S_HUMAN (1nzi) [3]
444 243
A2VCV7_RAT* (5ckn) [1]
A2VCV7_RAT* (5ckn) [8]
PK3CA_HUMAN (4jps) [1]
P4K2A_HUMAN* (4pla) [1]
P2C16_ARATH* (3rt0) [3]
Q7PP01_ANOGA (2i0o) [1]
PF00454 1001 359 PF00481
335 265 341 266 511 323 823 376
PF00501 1787 113 PF00566 PF00629 PF00630
1924 137 375 331 843 431 934 448 497 758 716 2308
PF00641
27
PF00643
80 150
PF00644
100 1624
PF00685 PF00688 PF00690
77
224 1657 218
62
745 125 580 140 784 195 244
58
PF00704
939 203
PF00754
384 377
PF00777
338 225
PF00786
43
95
PF00787
104
39
PF00822
353
65
PF00850
480
71
493
79
PF00855
102 1104
GYP1_YEAST* (2g77) [1]
C6W5A4_DYAFD* (4gs5) [1]
RBG1L_HUMAN (3hzj) [1]
NRP1_HUMAN* (5l73) [1]
FLNA_HUMAN* (2w0p) [1]
PML_HUMAN* (2mvw) [3]
PML_HUMAN* (2mvw) [11]
Q6ND88_RHOPA (4fut) [1]
FLNA_HUMAN* (2brq) [2]
TNKS2_HUMAN (4hkk) [1]
MMP1_HUMAN* (1hfc) [7]
ZRAB2_HUMAN* (3g9y) [1]
PAR14_HUMAN* (3se2) [1]
PAR14_HUMAN* (3se2) [4]
ST4A1_HUMAN* (1zd1) [1]
GDF2_MOUSE* (4ycg) [1]
CHID1_HUMAN (3bxw) [1] SIA8C_HUMAN* (5bo6) [1] PAK1_HUMAN* (1f3m) [1] CLD4_HUMAN* (5b2g) [1] HDGF_HUMAN (2nlu) [1]
AT2A1_RABIT* (1su4) [1]
A8GFD6_SERP5* (4ptm) [4]
NRP2_HUMAN* (5dq0) [2]
NCF4_HUMAN* (1h6h) [3]
B2JF16_BURP8* (5ji5) [2]
B2JF16_BURP8* (5ji5) [4]
BRPF1_HUMAN* (5c6s) [4]
32
bioRxiv preprint first posted online Apr. 12, 2017; doi: http://dx.doi.org/10.1101/127050. The copyright holder for this preprint (which was not peer-reviewed) is the author/funder. It is made available under a CC-BY 4.0 International license.
Family Col.a Res.b PF00856
834 1153 926 1158 935 1161 2057 1212 2140 1219
PF00858 1887 262 PF00878
380 1555
PF00884 1080 164 PF00899 PF00928 PF00969 PF01055 PF01094 PF01150 PF01237 PF01344
1595 300 787 524 956 551 234 205 835 316 837 318 1354 407 24
47
373 189 1074 303
Proteinc
Ligandc
O41094_PBCV1 (1n3j) [2] EZH2_HUMAN (5hyn) [1] ASIC1_CHICK* (2qts) [1]
Nucleotidec
EHMT2_HUMAN (3rjw) [3]
UBA1_YEAST (4nnj) [1]
UBA1_SCHPO* (4ii2) [2]
BETC_RHIME* (4ug4) [1]
HB2A_MOUSE (3c6l) [1]
2B11_HUMAN* (3pgc) [3]
GANAB_MOUSE (5f0e) [2]
AGLU_SULSO* (2g3m) [1]
92
ANPRC_HUMAN (1jdp) [3]
ANPRC_HUMAN (1jdn) [1]
1009 197
CASR_HUMAN (5fbh) [11]
GRID1_MOUSE (5kc9) [3]
1609 298
CASR_HUMAN (5fbh) [2]
GRM7_HUMAN (5c5c) [2]
2223 391
CASR_HUMAN (5fbh) [2]
ANPRA_RAT* (1t34) [8]
834 229
ENTP1_RAT* (3zx0) [1]
1092 309 1979 492 2016 497 318
727 185 972 202
312 385
RPN3_YEAST* (3jck) [2]
PF01433
384
43 800
PF01485
332 377
PF01590
389 322 581 360
104
25 AP1B1_HUMAN* (4hmy) [1]
343
80
322 218 424 237 595 524 244 1624
PF01399
KES1_YEAST* (1zhy) [1]
RYR2_MOUSE (4l4i) [1]
1059 172
RYR1_RABIT* (5t15) [2]
71
139 2159
AP4M1_HUMAN (3l81) [1]
KEAP1_HUMAN (3zgd) [18]
PF01759
AP2M1_RAT* (3h85) [1]
ESP_ARATH* (5gq0) [8]
PF01740
MPRI_HUMAN* (1gqb) [1]
109 157
PF01663
EHMT1_HUMAN* (4i51) [3]
KEAP1_HUMAN (3vnh) [17]
PF01602
EHMT2_HUMAN (3rjw) [3]
ESP_ARATH* (5gq0) [6]
PF01436
O41094_PBCV1 (3kma) [4]
30 130
PF01365
EZH2_HUMAN (4mi0) [4]
AMPN_ECOLI* (3b2p) [1] AMPN_ECOLI* (3puu) [2] BRAT_DROME* (4zlr) [2]
BRAT_DROME* (4zlr) [4]
ARI1_HUMAN* (2m9y) [8]
PDE6C_CHICK (3dba) [2]
PDE10_HUMAN* (2zmf) [6]
ENPP1_MOUSE* (4b56) [7]
ENPP2_MOUSE (5hrt) [1]
CO5_HUMAN* (5hcc) [1]
Q9KN88_VIBCH* (3mgl) [3]
33
bioRxiv preprint first posted online Apr. 12, 2017; doi: http://dx.doi.org/10.1101/127050. The copyright holder for this preprint (which was not peer-reviewed) is the author/funder. It is made available under a CC-BY 4.0 International license.
Family Col.a Res.b PF01833
385 328
386 329 PF01979 2169 325
Ligandc
PEG3_HUMAN (4bhx) [2]
479 428
PF02263
510 189
ATLA1_HUMAN* (4idn) [2]
826 252
GBP1_HUMAN (2b92) [1] ACOX1_ARATH (1w07) [7]
PF02770
387 259
PF02798
208
PF02815
316 268
RYR1_RABIT* (5t15) [1]
PF02932
262 262
GBRB3_HUMAN (4cof) [4]
360 279
5HT3A_MOUSE* (4pir) [8]
421 293
5HT3A_MOUSE* (4pir) [7]
485 305
GLRA3_HUMAN (5tio) [2]
617 330
5HT3A_MOUSE* (4pir) [8]
PF03098 1517 495 PF03114 PF03281 PF03372 PF03727
398
84
541 107 606 333
ACDSB_HUMAN* (2jif) [1]
GSTA4_HUMAN* (3ik7) [3]
RYR1_RABIT* (4i0y) [1]
PERL_BOVIN* (2pt3) [4]
AMPH_HUMAN* (3sog) [1]
MID51_HUMAN* (4nxt) [1]
APEX1_DANRE* (2o3c) [2]
APEX1_HUMAN (4qh9) [4]
868 133
APEX1_DANRE* (2o3c) [2]
APEX1_HUMAN (4qh9) [4]
889 140
TYDP2_DANRE (4f1h) [1]
O26314_METTH (3g0a) [4]
1086 155
TYDP2_DANRE (4f1h) [1]
APEX1_HUMAN (4qh9) [5]
1281 192
TYDP2_DANRE (4f1h) [1]
EXOA_BACSU (5cfe) [3]
1409 206
TYDP2_DANRE (4f1h) [1]
APEX1_HUMAN (4qhe) [6] CNO6L_HUMAN (3ngo) [1]
1654 247
TYDP2_DANRE (4f1h) [1]
C5C3L1_BEUC1 (4ruw) [4]
719 444 49
2144 600 111
32
203
48
208
50
213 251
C7Z7K1_NECH7* (4wis) [1] Q8SSJ3_ENCCU* (2o30) [1]
87 124 331
59
XPO1_YEAST* (5dhf) [1]
G0RY84_CHATD* (5d0u) [1]
THAP1_HUMAN* (2ko0) [1] THAP1_HUMAN* (2ko0) [1]
KLH11_HUMAN* (3i3n) [1]
ITAX_HUMAN* (3k6s) [1]
TYDP2_MOUSE (4gz2) [1]
HXK_KLULA* (3o08) [1]
PF08441 1216 970
270
APEX1_HUMAN (5dff) [3]
YHFP_BACSU (1tt7) [1]
COMP_HUMAN* (3fby) [7]
867 132
85
PF13499
APEX1_HUMAN (5dff) [5]
PF04547 1815 546
PF13424
TYDP2_DANRE (4f1h) [1]
73 502
PF08240
NRX1A_BOVIN* (2h0b) [3]
667 113
PF04408
PF07707
TYDP2_DANRE (4f1h) [1]
73
PF05485
97
477
PF03810
PF04969
BIN2_HUMAN (4i1q) [4]
COE1_HUMAN* (3mqi) [3]
MZF1_HUMAN* (2fi2) [2]
PF02210
38
Q8A1I2_BACTN (3hrp) [2] Q9X247_THEMA (3ooq) [1]
101
109 330
Nucleotidec
ADEC2_AGRFC* (3nqb) [2]
PF02023
PF02412
94
Proteinc
ADH1E_HORSE* (7adh) [2]
GPSM2_MOUSE* (4jhr) [5]
GPSM2_MOUSE* (4g2v) [3]
CALM_HUMAN (2be6) [10]
C4M0U8_ENTHI* (2lc5) [25]
34
bioRxiv preprint first posted online Apr. 12, 2017; doi: http://dx.doi.org/10.1101/127050. The copyright holder for this preprint (which was not peer-reviewed) is the author/funder. It is made available under a CC-BY 4.0 International license.
Family Col.a Res.b PF13561 1250 130
Proteinc
Ligandc
Nucleotidec
A9NFJ2_ACHLI (4nbt) [7]
FABG_VIBCH (4i08) [4]
1429 147 A0QQJ6_MYCS2* (3pk0) [77]
A0QQJ6_MYCS2* (3pk0) [21]
2287 217
A9CL57_AGRFC (4imr) [27]
A9CJ43_AGRFC (4ibo) [6]
201 338
EGLN1_HUMAN* (5las) [1]
Q81LZ8_BACAN (5hv0) [1]
PF13848
587 277
PDIA1_HUMAN* (4ju5) [1]
PF14497
297 173
PF14670
26 288
PF13640
PF16746
179
56
ACAP1_HUMAN* (4ckg) [3]
C5ATQ9_METEA* (4pxo) [3]
LRP6_HUMAN* (3sov) [1]
598
a. Pfam alignment column number, b. UniProt residue number for aligned residue of asterisked sequence
599
in columns 4-6. For example, in PF00001 (Rhodopsin-like receptor family) the numbering corresponds to
600
5HT1B_HUMAN and in PF00004 it corresponds to A4YHC5_METS5. This additional numbering allows the
601
distance between UMD residues to be assessed in sequence space, which is obscured by gaps in Pfam
602
alignment column indexes. c. Example protein and PDB structure where this interaction is observed.
603
Number in parenthesis indicates how many domains in total have at least one PDB structure that
604
provides evidence for the interaction. For example, the first row indicates that the AA2AR_HUMAN
605
residue aligned in column 525 of PF00001 is in contact with a ligand in PDB 5iu8 and there are a total of 6
606
domains that display this interaction type in at least one PDB structure. Additionally, residue 89 of
607
5HT1B_HUMAN maps to column 525 of PF00001.
608
35