low complexity make HVS-based image compression a particu- lar challenge. Finally .... masking, edge masking, and texture masking are often used to describe ..... Lubin [69] designed an elaborate visual discrimination model for measuring ..... exact reproduction of spatial detail, e.g. in the wreath and hair of the woman.
1
Human Vision Models for Perceptually Optimized Image Processing – A Review Marcus J. Nadenau, Member, IEEE, Stefan Winkler, Member, IEEE, David Alleysson and Murat Kunt, Fellow, IEEE Abstract— By taking into account the properties and limitations of the human visual system (HVS), images can be more efficiently compressed, colors more accurately reproduced, prints better rendered, to mention a few major advantages. To achieve these goals it is necessary to build a computational model of the HVS. In this paper we give an introduction to the general issue of HVS-modeling and review the specific applications of visual quality assessment and HVS-based image compression, which are closely related. On one hand, these two examples demonstrate the common structure of HVS-models, on the other hand they also show how application-specific constraints influence model design. Recent vision models from these application areas are reviewed and summarized in a table for direct comparison. Keywords— Human Visual System (HVS), Color Perception, Quality Assessment, Image Compression
almost any algorithm is permitted to approximate visual perception in the best possible manner. Image compression (see section VI) is probably the most wide-spread application that can be improved considerably by the use of HVS-models. Most importantly, image compression schemes require a quality metric for rate control. However, the constraint to keep the data volume as small as possible without introducing any new redundancy as well as the need for HVS-models with reasonably low complexity make HVS-based image compression a particular challenge. Finally, recent HVS-models from both application areas are summarized with regard to their structural elements and reported performance in Table I, which allows a comparison at a glance. II. Physiology of Vision
I. Introduction
I
N many different image processing applications the limitations of the human visual system (HVS) can be exploited to improve the performance from a visual quality point of view. Such HVS-model based approaches are only slowly replacing “classical” schemes, in which the quality metric consists of a simple pixel-based difference measure, like the mean squared error (MSE). The quality improvement that can be achieved using an HVS-based approach instead is significant and applies to a large variety of image processing applications. For instance, quality assessment tools try to predict subjective ratings, image compression schemes reduce the visibility of introduced artifacts, and watermarking schemes hide more robustly information in images. The HVS also plays a major role in applications related to the reproduction of images: half-toning patterns are perceptually optimized and colors rendered more accurately. The design of new image capture and display devices is no longer possible without considering the properties of the human visual system. Even if the specific requirements for each of these applications are different, the common element is always a computational model of human vision. Its general structure is usually determined by the modeling of psychophysical effects. Models based on neurobiology have been designed as well, but are less useful in the applications considered because of their overwhelming complexity and the limited knowledge of the underlying processes (see section II). How the general structure of computational models can be derived from psychophysics is outlined in section III. Human observers are still needed for experiments to measure specific effects of vision or to evaluate the final prediction performance of any new HVS-model. Such experiments are very time consuming and have to be carefully designed and controlled in order to achieve reliable and reproducible results. Section IV gives an overview of the most frequently used methods for subjective tests. Only very few articles have reviewed the role of human vision modeling in image processing applications [41, 88]. Here, a review of visual quality assessment tools and HVS-based image compression schemes is presented. Quality assessment tools (see section V) represent the state of the art in HVS-modeling –
Most visual properties of the HVS are not intuitive. Even when they have been characterized by psychophysical experiments, physiological evidence is the only way to understand the phenomenon completely. This section gives a short introduction to the main physiological concepts of the HVS that could also serve for its modeling. For a more detailed review of vision physiology, the reader is referred to [57, 127]. The physiology of human vision includes the eyes and the retina, where vision is initiated, as well as the visual pathways and the visual cortex, where high-level perception takes place. The eyes represent the first stage of the HVS. They can be understood as a complicated camera continually in motion, allowing accommodation to different light levels and to objects at various distances. The eyes have certain optical defects such as optical blur and chromatic aberration, but normally these do not affect the rest of the processing chain. At the back of the eyes lies the retina, a dense layer of interconnected neurons that sample and process the visual information. The role of the retina is preponderant, because the processing that the retina performs governs the rest of the visual chain. The retina encodes the visual information before transmitting it along the optical nerve, which is a channel with limited capacity. The ratio (≈100:1) between the number of receptors in the retina and the number of fibers in the optical nerve implies already at this stage a compression of the visual information. This “compression” is achieved by a replacement of the photographic image with spatial, temporal and chromatic characteristics such as contours, color and motion. The primary function of the retina is the sampling of the optical signal by photoreceptors. There are two kinds of photoreceptors, rods and cones. Rods are sensitive to low levels of luminosity and saturate in photopic conditions, under which images are usually viewed. For this reason and also because rods are almost non-existent in the center of the visual field, their contributions are generally neglected in image processing applications. Cones can be classified as L-, M- and S-cones according to their sensitivity to long, medium and short wavelengths, respectively. For the moment there is no real consensus on the exact sensitivity spectrum of the three cone types; depending on the method used, molecular genetics of the photo-pigment [77], suction micro-electrodes [10], or psychophysical studies of
2
Daltonians and normal observers [109–111], the results differ slightly. Establishing the relationship between these approaches is difficult due to adaptation and the interactions between the retinal neurons. The cones do not provide detailed spectral information, but a weighted summation over the different sensitivity spectra. This means that three values should be sufficient to reproduce human color distinction capabilities, which leads to the description of color by tri-stimulus values. Grassmann [42] formalized color as a three-dimensional vector space, which makes computations with color values possible. This idea has been used by the CIE (Commission International de l’Eclairage) to define several colorimetric functions like RGB and XYZ [149]. Human color perception is not directly related to the cone responses, but rather to their differences [54]. These are represented by an achromatic channel and two opponent-color channels [17], which code red-green and blue-yellow color differences. This coding decreases the redundancy between the signals of the three cone types [14], because it follows the principal components of natural scenes [100]. This efficient coding takes place in the retina, and Derrington et al. [24] proposed a color space based on the null response of color-opponent retinal neurons which respond to color differences. In image processing this coding is exploited in several color spaces such as Y CB CR , where Y is the luminance channel and CB , CR the color-difference channels. The HVS and especially the retina are able to adapt their sensitivity to the input signal. This allows to handle a wide range of light intensities with a small number of quantization levels. The mechanisms for adaptation include the iris, which controls the size of the pupillary aperture and thus the retinal illumination, the photoreceptors, and the ganglion cells [108]. These adaptations greatly influence the perception of color and luminosity contrast [140], hence HVS-models should incorporate these mechanisms of adaptation. For that reason, the CIE has formalized a color space called L∗ a∗ b∗ , a non-linear opponentcolors space adapted to the light source. The neurons in the retina realize a spatio-temporal filtering of the visual signal through their synaptic interactions [148]. This filtering is quite complex and not yet completely understood. It is characterized by lateral inhibition, the persistence effect, and feedback. Its influence on perception is very high, because the processing of information is very local, which is not taken into account by many current color models. As an example, improvements to the L∗ a∗ b∗ color space were proposed to model the filtering properties of the retina (see section V-D). As mentioned above, a great amount of data reduction takes place in the retina before the information is passed on through the optical nerve. Two main pathways have been identified at the output of the retina, which are referred to as magnocellular and parvocellular pathways. Their functional role has been investigated by electrophysiological studies [62, 65]. The magnocellular pathway carries blurred spatial information of luminance at high speeds, which is important for reflex actions, whereas the parvocellular pathway carries spatial detail and color information, which is important for conscious perception. This type of separation suggests similar concepts for engineering applications (e.g. feature-based face recognition). In the visual cortex, many cells are tuned to specific stimulus properties such as orientation, form, color, spatio-temporal frequency, stereo information, or motion, and decompose the visual information accordingly. This tuning has inspired algorithms that decompose images into different channels in a similar fashion (see sections III-B and V-E). Anatomically, several
areas can be distinguished in the visual cortex, among them area V1 (also known as primary visual cortex), which receives the input from the retina, area V2, which processes color, form and stereo, area V4, which also processes color, and area MT, which handles movement and stereo vision [68]. Although these cortical areas have been identified according to their functional role, this role is not explicit. Furthermore, many stages in the visual cortex are still unknown, but new cortical regions and functionalities are now investigated by techniques such as functional MRI [25]. Despite our current knowledge of the HVS, its complexity makes it impossible to construct a complete physiological model. Some attempts have been made [6,7,44,119], but they have been restricted to models of the retina and do not account for higherlevel perception. Consequently HVS models used in image processing are usually behavioral and are based on psychophysical studies. III. HVS-Models for Imaging Applications HVS-models account for a number of psychophysical effects [143] that are typically implemented in a sequential process as shown in Fig. 1. Color Processing
Local Contrast & Adaptation
Decomposition
Masking Effects Contrast Sensitivity Function
Fig. 1. Block-diagram of a typical HVS-model.
A. Luminance and Color The first stage in the processing chain of HVS-models concerns the transformation into an adequate perceptual color space, usually based on opponent colors. After this step the image is represented by one achromatic and two chromatic channels carrying color difference information. This stage can also take care of the so-called luminance masking or lightness non-linearity [106], the non-linear perception of luminance by the HVS. Such a non-linearity is inherent to more sophisticated color spaces like CIE L∗ a∗ b∗ , but needs to be added to simple linear color spaces. In compression applications, it can be considered by setting the quantization precision of the transform coefficients [36]. B. Multi-Channel Decomposition It is widely accepted that the HVS bases its perception on multiple channels that are tuned to different ranges of spatial frequencies and orientations. Measurements of the receptive fields of simple cells in the primary visual cortex revealed that these channels exhibit approximately a dyadic structure [21, 35]. This behavior is well matched by a multi-resolution filter bank or a wavelet decomposition. An example for the former is the cortex transform [128], a flexible multi-resolution pyramid, whose filters can be adjusted within a broad range. Wavelet transforms on the other hand offer the advantage that they can be implemented in a computationally efficient manner by a lifting scheme [20, 95]. It is believed that there are also a number of channels processing different object velocities or temporal frequencies. These include one temporal low-pass and one, possibly two, temporal band-pass mechanisms in the human visual system [33, 50], which are generally referred to as sustained and transient channels, respectively.
3
C. Contrast and Adaptation The response of the HVS depends much less on the absolute luminance than on the relation of its local variations to the surrounding background, a property known as Weber-Fechner law [106]. Contrast is a measure of this relative variation, which is commonly used in vision models. While it is quite simple to define a contrast measure for elementary patterns, it is very difficult to model human contrast perception in complex images, because it varies with the local image content [89, 90, 146]. Furthermore, the adaptation to a specific luminance level or color can influence the perceived contrast. D. Contrast Sensitivity One of the most important issues in HVS-modeling concerns the decreasing sensitivity for higher spatial frequencies. This phenomenon is parameterized by the contrast sensitivity function (CSF). The correct modeling of the CSF is especially difficult for color images. Typically, separability between color and pattern sensitivity is assumed, so that a separate CSF for each channel of the color space needs to be determined and implemented. Achromatic CSF’s are summarized in [9], color CSF measurements are described in [40, 80, 124], and a detailed description for efficient CSF-modeling in combination with the wavelet decomposition can be found in [85]. The human contrast sensitivity also depends on the temporal frequency of the stimuli. Similar to the spatial CSF, the temporal CSF has a low-pass or slightly band-pass shape. The interaction between spatial and temporal frequencies can be described by spatio-temporal contrast sensitivity functions, which are commonly used in vision models for video [19]. For easier implementation, they may be approximated by combinations of components separable in space & time [58, 150]. E. Masking Masking occurs when a stimulus that is visible by itself cannot be detected due to the presence of another. Sometimes the opposite effect, facilitation, occurs: a stimulus that is not visible by itself can be detected due to the presence of another. Within the framework of image processing it is helpful to think of the distortion or coding noise being masked (or facilitated) by the original image or sequence acting as background. Masking explains why similar distortions are disturbing in certain regions of an image while they are hardly noticeable elsewhere (cf. Fig. 2). Several different types of spatial masking can be distinguished [61,137], but this distinction is not clear-cut. The terms contrast masking, edge masking, and texture masking are often used to describe masking due to strong local contrast, edges, and local activity, respectively. Temporal masking is a brief elevation of visibility thresholds due to temporal discontinuities in intensity, e.g. at scene cuts [107]. It can occur not only after a discontinuity, but also before [3]. IV. Subjective Testing Subjective tests provide the foundations for building vision models. At the same time, they are the only true benchmark for evaluating the performance of perception-based image processing tools. Unfortunately, perceptual responses cannot be represented by an exact figure; due to their inherent subjectivity, it can only be described statistically. Even in psychophysical threshold experiments, where the task of the observer is just to give a yes/no answer, there exists a significant variation between observers. In the evaluation of supra-threshold artifacts, these differences become even more pronounced, because the
objectionability of artifacts depends on the observers’ expectations and presumptions as to the intended application. The observers’ differing experiences also lead to a different weighting of the artifacts [23]. The tools for measuring the perceptual performance of subjects are provided by psychophysics [37]. In general, two kinds of decision tasks can be distinguished, namely adjustment and judgment [91]. In the former, the observer is given a classification and modifies the stimulus accordingly, while in the latter, the observer is given a stimulus and provides the classification. Adjustment tasks include setting the threshold amplitude of a stimulus, canceling a distortion, or matching a stimulus to a given one. Judgment tasks on the other hand include yes/no decisions, forced choices between two alternatives, and magnitude estimation on a rating scale. Most of these adjustment and judgment tasks focus on threshold measurements, which traditionally have played an important role in psychophysics, because researchers like to minimize the influence of cognition and subjectivity by means of simple criteria and tasks. In the experiments, the threshold is defined as the stimulus level at a specific detection probability, e.g. 75%, depending on the type of task. Signal detection theory provides the statistical framework for the evaluation of such measurements [43]. While threshold detection experiments are well suited to the investigation of low-level sensory mechanisms, a simple yes/no answer is not sufficient to capture the observer’s visual experience in many cases. With respect to the visual quality of natural scenes, for example, the threshold level is important as it corresponds to visually lossless compression. However, the quality range above threshold is of great interest as well, because the goal is a visually graceful degradation of the compressed output with decreasing bitrate. This has stimulated a great deal of experimentation with supra-threshold stimuli and non-detection tasks in recent years [125]. Subjective assessment of visual quality has been formalized in ITU-R Rec. 500 [52], which suggests standard viewing conditions, criteria for the selection of observers and test material, assessment procedures, as well as data analysis methods. While targeted at the subjective assessment of television pictures, most of it directly applies to still images as well. In particular, it describes the Double Stimulus Continuous Quality Scale (DSCQS) and the Double Stimulus Impairment Scale (DSIS), two of the most commonly used methods. In a DSCQS test, viewers are shown stimulus pairs consisting of a “reference” and a “test” stimulus, which are presented twice in alternating fashion, with the order of the two chosen randomly for each trial. Subjects are not informed which is the reference and which is the test stimulus. They rate each of the two separately on a continuous quality scale ranging from “bad” to “excellent”. Analysis is based on the difference in rating for each pair, which is calculated from an equivalent numerical scale from 0 to 100. DSCQS has been shown to work reliably even when the quality of test and reference stimuli are rather similar, because it is quite sensitive to small differences in quality. In a DSIS test, the reference is always displayed before the teststimulus, and both are shown only once. Subjects rate the amount of impairment in the test stimulus on a discrete fivelevel scale ranging from “very annoying” to “imperceptible”. DSIS is the preferred method when evaluating clearly visible impairments. The above-mentioned testing procedures can be used for images and (short) sequences alike. A method designed specifically for measuring the time-varying quality of longer video sequences
4
is the Single Stimulus Continuous Quality Evaluation (SSCQE) [52, 79], where viewers watch a program of typically 20-30 minutes duration. Using a slider, they continuously rate the instantaneously perceived quality on the DSCQS scale. This makes it possible to avoid the recency phenomenon, a bias in the ratings toward the final 10-20 seconds of a video sequence due to limitations of human working memory, which would become apparent with single-rating methods. Furthermore, no reference is shown, which puts the subjects in a situation closer to an actual home viewing environment. V. Visual Quality Assessment A. Introduction Perhaps the most direct application of vision models in image processing is visual quality assessment, i.e. measuring the perceived quality of a given image or video. The properties and limitations of the human visual system determine the visibility of distortions and thus perceived quality. In this section we discuss some of the issues associated with visual quality assessment and review a number of proposed quality metrics. In order to be able to design reliable visual quality metrics, it is necessary to understand what “quality” means to the viewer. Viewers’ enjoyment when looking at an image or video depends on many factors. One of the most important is of course the content and material. Provided the content itself is at least “watchable”, visual quality plays a prominent role. Research has shown that perceived quality depends on viewing distance, display size, resolution, brightness, contrast, sharpness, colorfulness, naturalness and other factors [2, 60, 75, 99]. For video, the accompanying sound also has great influence on perceived quality: subjective quality ratings are generally higher when the test scenes are accompanied by a good quality sound program [96], which apparently distracts the viewers’ attention from video impairments. It is also important to note that perceived quality is not necessarily equivalent to fidelity, i.e. the accurate reproduction of the original. For example, sharp images with high contrast are usually more appealing to the average viewer [104]. Likewise, subjects prefer slightly more colorful and saturated images despite realizing that they look somewhat unnatural [22, 152]. Most “quality” metrics are actually fidelity metrics based on the comparison of the distorted image with a reference and neglect these phenomena. The reason for this is that without any reference it is very difficult for a metric to tell apart distortions from desired content, whereas humans usually are able to make this distinction from experience. The problem with this approach is that the reference may not be available, for example at the receiver side of TV broadcasts or internet streaming. For such applications, reduced-reference metrics are becoming very important, which rely only on little pieces of information extracted from the reference to compute a quality measure. An example is the metric presented in [147], which is discussed among others in section V-F. B. What performance can be expected from a quality metric? The performance of a quality metric is usually evaluated with the help of subjective ratings for a certain test set. A number of different attributes can be considered in such an evaluation, e.g. prediction accuracy (the average error), monotonicity (the ordering of images according to their quality), and consistency (the number of outliers). These attributes can be quantified with mathematical tools such as regression analysis; correlations are probably the most commonly used performance indicators.
However, as discussed above in section IV, perceived visual quality is an inherently subjective measure and can only be described statistically, i.e. by averaging over the opinions of a sufficiently large number of observers. Therefore the question is also how well subjects agree on the quality of a given image or video. In a study carried out by the Video Quality Experts Group [126] (see section V-G for details), DSCQS ratings were collected for a large set of test sequences by several laboratories, with each lab adhering to ITU-R Rec. 500 [52] for the viewing setup and test conditions. The resulting correlations obtained between the average ratings of viewer groups from different labs are in the range of 0.9-0.95. While the exact figures certainly vary depending on the application and the range of the test set, this gives an indication of the limits of prediction performance for quality metrics. In the same study, the best-performing metrics only achieved correlations in the range of 0.8-0.85. This shows that there still remains work to be done before quality metrics can replace subjective tests. C. Pixel-Based Metrics The mean squared error (MSE) and the peak signal-to-noise ratio (PSNR) are the most popular difference metrics in image and video processing. The MSE is the mean of the squared differences between the gray-level values of pixels in two pictures ˜ or sequences I and I: MSE =
1 TXY
XXXh t
x
I (x , y, t) − ˜I (x , y, t)
i
2
,
(1)
y
for pictures of size X×Y and T frames in the sequence. The average difference√ per pixel is thus given by the root mean squared error RMSE = MSE. The PSNR in decibels is defined as: PSNR = 10 log
m2 , MSE
(2)
where m is the maximum value that a pixel can take (e.g. 255 for 8-bit images). Note that MSE and PSNR are well-defined only for luminance information; once color comes into play, there is no agreement on the computation of these measures. Technically, MSE measures image difference, whereas PSNR measures image fidelity, i.e. how closely an image resembles a reference image, usually the uncorrupted original. The popularity of these two metrics is due to the fact that minimizing the MSE is equivalent to maximum likelihood estimation for independent measurement errors with normal distribution. Besides, computing MSE and PSNR is very easy and fast. Because they are based on a pixel-by-pixel comparison of images, however, they only have a limited, approximate relationship with the distortion or quality perceived by human observers. In certain situations the subjective image quality can be improved by adding noise and thereby reducing the PSNR. Dithering of color images with reduced color depth, which adds noise to the image to remove the perceived banding caused by the color quantization, is a common example of this. Furthermore, the visibility of distortions depends to a great extent on the image content, a property known as masking (see section III-E). Distortions are often much more disturbing in relatively smooth areas of an image than in texture regions with a lot of activity , an effect not taken into account by pixel-based metrics. Therefore the perceived quality of images with the same PSNR can actually be very different (see Fig. 2). A number of additional pixel-based metrics have been proposed and tested [31]. It was found that although some of these
5
Fig. 2. Two images with identical PSNR of 31.7 dB. The same amount of noise has been added to a rectangular area at the top on the left and at the bottom on the right. The noise is much more visible in the sky than on the rocks and in the water due to strong masking, which PSNR does not take into account.
metrics can predict subjective ratings quite successfully for a given compression technique or type of distortion, they are not reliable for evaluations across techniques. Another study concluded that even perceptual weighting of MSE does not give consistently reliable predictions of visual quality for different pictures and scenes [74]. These results indicate that pixel-based error measures are not accurate for quality evaluations across different scenes or distortion types. Therefore it is imperative for reliable quality metrics to consider the way the HVS processes visual information. In the following, we discuss the implementation and performance of a variety of visual quality metrics. An overview of these and other quality metrics can be found in Table I. D. Single-Channel Models The first models of human vision adopted a single-channel approach. Single-channel models regard the human visual system as a single spatial filter, whose characteristics are defined by the contrast sensitivity function. The output of such a system is the filtered version of the input stimulus, and detectability depends on a threshold criterion. The first computational model of vision was designed by Schade [105]. It is based on the assumption that the HVS representation is a shift-invariant transformation of the retinal image and can thus be expressed as a convolution. In order to determine the convolution kernel of this transformation, Schade carried out psychophysical experiments to measure the CSF. Schade’s model was able to predict the visibility of simple stimuli, but failed as the complexity of the patterns increased. The first image quality metric for luminance images was developed by Mannos and Sakrison [73]. They realized that simple pixel-based distortion measures were not able to accurately predict the quality differences perceived by observers. On the basis of psychophysical experiments on the visibility of gratings, they inferred some properties of the human visual system and came up with a closed-form expression for the contrast sensitivity as a function of spatial frequency, which is still widely used in HVS-models. The input images are filtered with this CSF after a lightness nonlinearity. The squared difference between the filter output for the two images is the distortion measure. It was shown to correlate quite well with subjective ranking data. Despite its simplicity, this metric was one of the first works in engineering to recognize the importance of applying vision science to image processing. The first color image quality metric was proposed by Faugeras [32]. His model computes the cone absorption rates and applies
a logarithmic nonlinearity to obtain the cone responses. An achromatic and two chromatic color difference components are calculated from linear combinations of the cone responses to account for the opponent-color processes in the human visual system. These opponent-color signals go through individual filtering stages with the corresponding CSF’s. The squared differences between the resulting filtered components for the reference image and for the distorted image are the basis for an image distortion measure. The first video quality metric was developed by Lukas and Budrikis [71]. It is based on a spatio-temporal model of the CSF using an excitatory and an inhibitory path. The two paths are combined in a nonlinear way, enabling the model to adapt to changes in the level of background luminance. Masking is also incorporated into the model by means of a weighting function derived from the spatial and temporal activity in the reference sequence. In the final stage of the metric, an Lp -norm of the masked error signal is computed over blocks in the frame whose size is chosen such that each block covers the size of the foveal field of vision. The resulting distortion measure was shown to outperform MSE as a predictor of perceived quality. Tong et al. [117] recently proposed an interesting singlechannel video quality metric called ST-CIELAB (spatiotemporal CIELAB). ST-CIELAB is an extension of the spatial CIELAB (S-CIELAB) image quality metric [153]. Both are backward compatible to the CIELAB standard, i.e. they reduce to CIE L∗ a∗ b∗ for uniform color fields. The ST-CIELAB metric is based on a spatial, temporal, and chromatic model of human contrast sensitivity in an opponent-colors space, after which the data are transformed to CIE L∗ a∗ b∗ space, whose difference formula is used for pooling. Single-channel models are still in use today because of their relative simplicity and computational efficiency, and a variety of extensions and improvements have been proposed. However, they are intrinsically limited in prediction accuracy. They are unable to cope with more complex patterns and cannot account for empirical data from masking and pattern adaptation experiments. These data can be explained quite successfully by a multi-resolution theory of vision, which assumes a whole set of different channels instead of just one (cf. section III-B). The corresponding multi-channel models and metrics are discussed in the next section. E. Multi-Channel Models Multi-channel models assume that each band of spatial frequencies is dealt with by an independent channel. The CSF is just the envelope of the sensitivities of these channels. Detection occurs independently in any channel when the signal in that band reaches a threshold criterion. A well-known image distortion metric, the Visual Differences Predictor (VDP), was proposed by Daly [18]. The underlying vision model includes an amplitude nonlinearity to account for the adaptation of the visual system to different light levels, an orientation-dependent CSF, and a hierarchy of detection mechanisms. These mechanisms involve a decomposition similar to the cortex transform [128] and a simple intra-channel masking function. The responses in the different channels are converted to detection probabilities by means of a psychometric function and finally combined according to rules of probability summation. The resulting output of the VDP is a visibility map indicating the areas where two images differ in a perceptual sense. Lubin [69] designed an elaborate visual discrimination model for measuring still image fidelity, which is also known as the Sarnoff Visual Discrimination Model (VDM). First the input
6
images are convolved with an approximation of the point spread function of the eye’s optics. Then the sampling by the cone mosaic in the retina is simulated. The decomposition stage implements a Laplacian pyramid for spatial frequency separation, local contrast computation, as well as directional filtering, from which a phase-independent contrast energy measure is calculated. This contrast energy measure is subjected to a masking stage, which comprises a normalization process and a sigmoid nonlinearity. Finally, a distance measure or JND map is computed as the Lp -norm of the masked responses. The VDM is one of the few models that take into account the eccentricity of the images in the observer’s visual field. It was later modified to the Sarnoff JND metric for color video [70]. An interesting distortion metric for still images was presented by Teo and Heeger [114, 115]. It is based on the response properties of neurons in the primary visual cortex and the psychophysics of spatial pattern detection. The model was inspired by analyses of the responses of single neurons in the visual cortex of the cat [5, 48, 49], where a so-called contrast gain control mechanism keeps neural responses within the permissible dynamic range while at the same time retaining global pattern information. In the metric, contrast gain control is realized by an excitatory nonlinearity that is normalized by a pool of inhibitory responses from other neurons. The distortion measure is then computed from the resulting normalized responses by a simple squared-error norm. Contrast gain control models have become quite popular, and have been generalized in recent years [28, 39, 136, 144]. Van den Branden Lambrecht proposed a number of video quality metrics based on multi-channel vision models [121]. The Moving Picture Quality Metric (MPQM) is based on a local contrast definition and Gabor-related filters for the spatial decomposition, two temporal mechanisms, as well as a spatio-temporal CSF and a simple intra-channel model of contrast masking [122]. A color version of the MPQM based on an opponent-colors space was presented as well as a variety of applications and extensions of the MPQM [121], e.g. for assessing the quality of certain image features such as contours, textures, and blocking artifacts, or the study of motion rendition [123]. Due to the MPQM’s purely frequency-domain implementation of the spatio-temporal filtering process and the resulting huge memory requirements, it is not practical for measuring the quality of sequences with a duration of more than a few seconds, however. The Normalization Video Fidelity Metric (NVFM) [67] avoids this shortcoming by using a steerable pyramid transform for spatial filtering and discrete time-domain filter approximations of the temporal mechanisms. It is a spatio-temporal extension of Teo and Heeger’s above-mentioned image distortion metric. Winkler [144] presented a perceptual distortion metric (PDM) for color video. It is based on the NVFM and a model for color images [142]. After conversion of the input to an opponent colors space, each of the resulting three components is subjected to a spatio-temporal decomposition by the steerable pyramid, yielding a number of perceptual channels. They are weighted according to spatio-temporal contrast sensitivity data and subsequently undergo a contrast gain control stage for pattern masking. Finally, the sensor differences are combined by means of an Lp -norm into visibility maps or a distortion measure. The performance of the metric is discussed in [145].
need not necessarily rely on sophisticated general models of the human visual system; they can exploit a priori knowledge about the compression algorithm and the pertinent types of artifacts using ad-hoc techniques or specialized vision models. While such metrics are not as versatile, they normally perform well in a given application area. Their main advantage lies in the fact that they often permit a computationally more efficient implementation. One example of such specialized metrics is DCTune [133,134], which was developed as a method for optimizing JPEG image compression (see section VI-E.1 for details), but can also be used as a quality metric. Watson [135] recently extended the latter to video. In addition to the spatial sensitivity and masking effects considered in DCTune, this so-called Digital Video Quality (DVQ) metric relies on measurements of the visibility thresholds for temporally varying DCT quantization noise. It also models temporal forward masking effects by means of a masking sequence, which is produced by passing the reference through a temporal low-pass filter. A report of the DVQ metric’s performance is given in [139]. Wolf and Pinson [147] designed a video distortion metric that uses reduced reference information in the form of low-level features extracted from spatio-temporal blocks of the sequences. These features were selected empirically from a number of candidates so as to yield the best correlation with subjective data. First, horizontal and vertical edge enhancement filters are applied to facilitate gradient computation in the feature extraction stage. The resulting sequences are divided into spatio-temporal blocks. A number of features measuring the amount and orientation of activity in each of these blocks are then computed from the spatial luminance gradient. To measure the distortion, the features from the reference and the distorted sequence are compared using a process similar to masking. Hamada et al. [47] proposed a picture quality assessment system based on a perceptual weighting of the coding noise. In their three-layered design, typical noise types from the compression are classified and weighted according to their characteristics. The local texture is analyzed to compute the local degree of masking. Finally, a gaze prediction stage is used to emphasize noise visibility in and around objects of interest. The PSNR computed on the weighted noise is used as distortion measure. This metric has been implemented in a system that permits real-time video quality assessment. Tan et al. [112] presented an objective measurement tool for MPEG video quality. It first computes the perceptual impairment in each frame based on contrast sensitivity and masking with the help of spatial filtering and Sobel-operators, respectively. Then the PSNR of the masked error signal is calculated and normalized. The interesting part of this metric is its second stage, a cognitive emulator, that simulates higher-level aspects of perception. This includes the delay and temporal smoothing effect of observer responses, the nonlinear saturation of perceived quality, and the asymmetric behavior with respect to quality changes from bad to good and vice versa. This metric is one of the few models targeted at measuring the temporally varying quality of video sequences. While it still requires the reference as input, the cognitive emulator was shown to improve the predictions of subjects’ SSCQE ratings. G. Metric Comparisons
F. Specialized Metrics Metrics based on multi-channel vision models such as the ones presented above in section V-E are the most general and potentially the most accurate ones [143]. However, quality metrics
While video quality metric designs and implementations abound, only few comparative studies exist that have investigated the prediction accuracy of metrics in relation to others. Ahumada [1] reviewed more than 30 visual discrimination
7
models for still images from the application areas of image quality assessment, image compression and halftoning. However, only a comparison of the implementations of their computational models is given; the performance of the metrics is not evaluated. Comparisons of several image quality metrics with respect to their prediction performance were carried out in [30,34,53,66,76, 97]. These studies consider many different pixel-based metrics as well as a number of single-channel and multi-channel models from the literature. Summarizing their findings and drawing overall conclusions is made difficult by the fact that test images, testing procedures, and applications differ greatly between studies. It can be noted that certain pixel-based metrics in the evaluations correlate quite well with subjective ratings for some test sets, especially for a given type of distortion or scene. They can be outperformed by vision-based metrics, where more complexity usually means more generality and accuracy. However, the observed gains are often so little that the computational overhead does not seem justified. Objective measures of MPEG video quality were validated by Cermak et al. [16]. However, this comparison does not consider entire quality metrics, but only a number of low-level features such as edge energy or motion energy and combinations thereof. The most ambitious performance evaluation of video quality metrics to date was undertaken by the Video Quality Experts Group (VQEG).1 The group was formed in 1997 with the objective to collect reliable subjective ratings for a well-defined set of test sequences and to evaluate the performance of different video quality assessment systems with respect to these sequences. Its work and findings are described in detail in the VQEG Report [126] and by Rohaly et al. [98]. The emphasis of the VQEG study was out-of-service testing (the full reference sequence is available to the metrics) of production- and distribution-class video. Therefore, the test conditions comprised mainly MPEG-2 encoded sequences, including conversions between analog and digital video or transmission errors. In total, 20 scenes were encoded for 16 test conditions each. Subjective ratings for these sequences were collected in large-scale experiments using the DSCQS method (see section IV) from ITU-R Rec. 500 [52]. Ten different video quality metrics were submitted for evaluation. Most of them belong to the category of specialized metrics, the rest is based on multi-channel HVS-models. The selected scenes were disclosed to the proponents only after the submission of their metrics. The statistical methods used for the performance analysis were variance-weighted regression, nonlinear regression, Spearman rank-order correlation, and outlier ratio [98]. The results of the data analysis show that the performance of most models as well as PSNR are statistically equivalent for all four criteria, leading to the conclusion that no single model outperforms the others in all cases and for the entire range of test sequences. Furthermore, none of the metrics achieved an accuracy comparable to the agreement between different subject groups. PSNR entschaerfen... VI. Image Compression A. How is the HVS related to image compression? Image data can be stored in various formats. The typical 24 bits-per-pixel (bpp) red-green-blue (RGB) representation is well suited for displaying the image, but very data intensive. Compression schemes usually transform these data into a more 1
See http://www.crc.ca/vqeg/ for an overview of its current activities.
efficient representation. If this transformation is entirely reversible and the initial data can be perfectly reconstructed, one speaks of lossless compression. Typical compression ratios for lossless compression of natural images are close to 2-3:1 [103]. If higher compression ratios are desired, a certain information loss has to be accepted, which is referred to as lossy compression. However, this loss need not be visible, because it might introduce only slight changes in the image that are below the perception threshold (visually lossless compression). For even higher compression ratios the visual appearance of the image changes compared to the original. Thus, compression artifacts or image distortions are introduced. The objective of incorporating an HVS-model into a compression scheme is to minimize these distortions and to achieve the best visual quality for a given bitrate. HVS RD-Control
HVS RGB-image Bitstream Transformation
Quantization
EntropyCoding
0110...010
Fig. 3. Three main stages of image compression
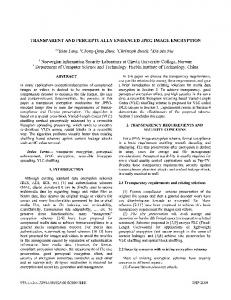
The process of image compression can be described by three separate stages, as illustrated in Fig. 3. The image is transformed into the compression domain, where it is represented by its transform coefficients. These coefficients are then quantized and entropy-coded to create the compressed bitstream. In recent image compression schemes, the stages of quantization and entropy coding are typically controlled by a so-called RateDistortion (RD) unit. This unit allocates a specific quantization precision to each coefficient, so that the resulting overall quality of the compressed image is optimized for the given bitrate. Ideally, this means that the final bitstream contains only information about visually important transform coefficients and none about the rest. The HVS-model influences the design of a compression scheme at two stages, namely the transformation and the RDunit. First, the image data should be transformed into a visually meaningful representation. Only then it is guaranteed that the final visual quality can be well controlled. Second, the visibility of the compression-related distortions needs to be measured and controlled by the RD-unit. B. How much quality improvement can be expected? The impact of HVS-models on compression quality is demonstrated in Fig. 4. The original image was compressed with the most recent image compression standard, JPEG2000 (see section VI-F.2), once in its plain version that optimizes the MSE, and once exploiting an integrated HVS-model. To facilitate the comparison, a magnified region is shown. Even if the visual difference is reduced by the print quality, the benefits of HVSbased compression are clearly visible. In the MSE-optimized image, the entire texture of the face is lost, while it is preserved in the HVS-compressed image. Why does the MSE-scheme performs so badly at the same bitrate? The reason for this remarkable difference in quality is that the MSE-optimized scheme spends many bits in places that do not contribute to a visual improvement, but only to a minimization of the mathematical error measure. While the missing skin
8
a
b
c
d
olution, and others. It is possible to design HVS-models that try to meticulously incorporate all of these parameters. The problem with this approach is that the model becomes tuned to very specific situations, which is generally not practical, because some viewing parameters may not be known in advance. However, looking at the examples in Figs. 2 and 4, the quality differences remain, even if the viewing parameters such as background light or viewing distance are changed. It is clear that one will no longer be able to distinguish them from three meters away. That is where lies the answer to the problem: It is necessary to make realistic assumptions about the typical viewing conditions, and to derive from them a good model parameterization, which can actually work for a wide variety of situations. D. How much additional complexity does the HVS-model require?
Fig. 4. Sub-images (a) and (b) show the original image and a magnified sub-region. The magnification of the compression result for the conventional JPEG 2000 (c) and the HVS-based codec (d) demonstrate clearly the visual impact.
texture appears blurred and unnatural to a human observer, it is not very important from the point of view of MSE optimization, which instead puts more than necessary weight on the exact reproduction of spatial detail, e.g. in the wreath and hair of the woman. However, the human observer is less sensitive to a quality degradation in these regions, because it is masked by the strong textures. Consequently, many of the bits that are allocated there are wasted. It is difficult to give precise numbers for the impact of HVSbased image compression, because they vary from one image to another, and only very few authors evaluated the performance increase in a quantitative way. The comparison of entire HVSbased codecs is even more difficult, because not only the HVSmodel, but also the entire coding process is different. Some estimates can be given nonetheless. Already incorporating the CSF into the JPEG2000 codec leads for visually-lossless compression to an approximately 30% higher compression ratio [82, 83, 85]. Simple masking models increase the correctness of the HVSbased predictions, whether a coding artifact is visible or not, by 50% [84]. Further improvements can be obtained by a combination with model-based texture coding, which deceives the HVS with its synthesized textures. Thus, a MSE-based compression scheme has approximately to double the bitrate with respect to an HVS-based scheme to achieve the same visual quality. So far only relative improvements were considered. In absolute terms this means that an A4-format color image at 300 dpi can be compressed at visually lossless quality at compression ratios of 80:1 to 100:1 (for 24bit images 0.3 - 0.24bpp). C. Does a general HVS-model parameterization exist? As mentioned before, human visual perception is highly adaptive, but also very dependent on certain parameters such as color and intensity of ambient lighting, viewing distance, media res-
It is instructive to discuss the question of complexity separately for each stage of the HVS-model shown in Fig. 1. The color space transformation might be extended by a lightness non-linearity. However, the gamma correction is already a nonlinearity of the same type and can easily be implemented by a look-up table. As a space-frequency decomposition, the standard discrete wavelet transform (DWT) of the compression algorithm can be well utilized by an HVS-model, hence no additional complexity is added at this stage. Local background adaptation and contrast computation typically increase the complexity by an additional division per coefficient. What is more annoying is the more complex memory access required and the increased total amount of buffer memory, because it is necessary to access data from other decomposition levels. The CSF can be implemented by a single weighting factor per subband in its simplest form, which is negligible in terms of computational complexity. If an adaptive CSF filtering is chosen, an additional FIR filter operation has to be applied to about 25% of all coefficients [85]. The masking stage can be the most expensive one computationally. If only point-wise contrast masking is implemented, a simple compressor function is sufficient. If the local surround is considered as well, a power function and an additional summation are required for every coefficient of the local surround. Since this local surround behaves like a sliding window, significant complexity savings can be achieved. For inter-channel masking models, the computational and memory complexity increase significantly. In the pooling stage, the power function is implemented most efficiently for a power of 2. Otherwise it does not imply additional complexity, since the total error has to be pooled for an MSE metric as well. E. Review of HVS-based Codecs We now review various HVS-based codecs and related studies. The different schemes are grouped by their spatial-frequency decomposition method. Readers who are less familiar with image compression might appreciate the introductory papers by Podilchuk and Safranek [94] and Jayant et al. [55]. The first is not specifically focused on HVS-based compression, but provides a good overview of image and video compression in general. It explains the concept of transform coding schemes like DCT or DWT and discusses the advantages of multi-resolution techniques. A number of standards for image and video compression are also introduced. The second provides a general reflection on the concept of perceptual image coding. It presents the basic structure of a perceptual codec and points out that at the present time no optimal perceptual codec exists; all codecs found in the literature are
9
rather empirical approximations. E.1 Fourier or DCT-based Schemes The early work of Hall [46] presents a compression scheme that processes the input image in a non-reversible manner to obtain the “visual image content”, which is encoded in the Fourier domain. First, the input image is filtered by a spatial low-pass that simulates the modulation transfer function of the eye. Then, the three color channels corresponding to the photoreceptors are simulated by separate CSF low-pass and spectral band-pass filters. A logarithmic point nonlinearity and another high-pass filter implement lightness perception and the lateral inhibition. The bitrate-allocation is related to the local variance as an estimation of visual information content. The final performance of the scheme is evaluated by a subjective quality ranking. The scheme appears quite complete, but has some significant drawbacks. All filters are directly applied to the coefficients, which implies that the initial image content is irreversibly modified before any coding is applied. Lossless coding is thus made impossible, and any change of the assumed viewing conditions (magnification) cannot be compensated by further decoding of the progressively encoded bitstream. Furthermore, the arithmetic complexity is rather high. Many perceptual optimizations are based on a modification of the quantization matrix of the DCT-based JPEG encoder (cf. section VI-F.1). Klein et al. [59] discuss how an HVSmodel can be tailored to compute such a quantization matrix by considering primarily the CSF. Issues such as the orientation dependence of the CSF and the inter-dependence of the 64 DCT coefficients are investigated. Moreover, the significant difficulty of implementing masking models in a DCT-scheme is underlined. This work also establishes a good link to relevant psychophysics literature through numerous references. Watson [133,134] integrated an HVS-model into a DCT-based codec called DCTune,2 for which he analyzed the visibility of DCT quantization noise with respect to display resolution, contrast masking, frequency and spatial summation. He demonstrates how the quantization matrix can be perceptually optimized for individual gray-level images [131]. In [132] an extension for color images is described. However, it is very basic and not really based on color CSF data. Therefore, the compressed images often suffer from color artifacts. Westen et al. [141] developed an HVS-model that first transforms the image into an opponent color space. Then, a variant of the steerable filter pyramid is applied to decompose the image in an over-complete fashion into several frequency bands with four different orientations. Finally, local background adaptation, CSF and masking effects are modeled to compute a weighted mean squared error (WMSE). Using this data intensive model, JPEG quantization matrices are computed for each DCT block by establishing a link between the DCT coefficients and the WMSE. Tong et al. [116] scale the default JPEG quantization matrix by a locally-adaptive factor that accounts for the masking due to texture and luminance. The technique uses specific DCT coefficients of the 8×8 block to classify the entire block as plain, edge or texture region. Depending on the classification, another scaling factor is determined. The model is finally implemented in a mode conforming to the baseline JPEG standard and as a version extending the standard. The method is only encoderbound and achieves 5-22% of bitrate savings on a test set of 17 natural images, while increasing the complexity by 10%. 2 A demonstration version http://vision.arc.nasa.gov/dctune/.
of
DCTune
can
be
downloaded
from
Drukarev [26] analyzes the compression performance in 8 different commonly used color spaces. Particular attention is paid to the influence of gamma correction. The observations are analyzed based on objective criteria like energy compaction. The compression performance was primarily measured by PSNR, but some subjective evaluations are reported also. E.2 DWT-based Schemes Various compression schemes employ the discrete wavelet decomposition (DWT) in combination with an HVS-model. Safranek et al. [101] propose a perceptually tuned subband coder that decomposes an image in YIQ-space into 16 subbands per color channel by a generalized quadrature mirror filter bank. The coefficients are quantized based on an empirically derived masking model that uses the local variance as an indicator for texture masking. The output of a DPCM quantizer is then Huffman encoded. The perceptual model consists of base sensitivity, brightness and texture correction. The base sensitivity is determined by experiments using artificially generated noise signals and approximates the CSF. In a similar way, the influence of the background brightness is evaluated. The performance is described as “good”, but no quantitative subjective results are given. Lai and Kuo applied a simplified version of their HVS-based quality metric [64] to a wavelet coding scheme [63]. The HVSmodel uses an opponent color space and determines the local contrast based on the Haar wavelet coefficients. The initial HVS-model of the quality metric implements a luminance CSF and an inter-channel masking model that considers contrast and frequency masking. The final quality gain is discussed based on some coding examples. Unfortunately, the entire model is based on measurements by the authors that are not well documented. It is also unclear how the frequency weighting of the chrominance channels is implemented. In the compression scheme, the HVS-model sacrifices the masking stage to enable embedded encoding and to reduce the complexity. Thus, only a CSF frequency weighting is implemented. Bao and Leung [8] present a subband codec that implements a spatial frequency weighting and an edge preserving technique. The wavelet coefficients in each subband are weighted by a single invariant factor that is computed from the CSF in [73]. Edges are extracted directly from the input image using a Cannyoperator. Finally, a map of the visually significant edges is created by fuzzy-logic. This map is used to weight the wavelet coefficients that are quantized and encoded using run-length and arithmetic coders. The obtained compression quality is measured in terms of PSNR. It achieves values equivalent to the SPIHT-codec [102], but the visual quality is found to be superior. This work follows the interesting idea of treating the edge information separately, but suffers from an empirical formulation of the visibility model. Truchetet et al. [118] present a concept to remove specific coefficients of a wavelet packet decomposition before their entropy encoding. The criterion whether a coefficient is removed or not is based on very basic empirical experiments using three different images. The entropy of the wavelet packet representation pruned in this fashion is computed to estimate the achieved compression ratio. The scheme uses a linear transformation to an opponent color space and an orthonormal B-spline filter of 23 taps. Its complexity is rather low, since it either suppresses or retains a coefficient, which comes down to an elementary quantization strategy. The performance is rather poor, however: visually lossless compression for color images is only reached at a compression ratio of 10:1.
10
Watson et al. [138] carried out an analysis that is directly related to HVS-based subband decomposition. Artificial noise signals and single basis functions were created in the wavelet domain to measure their visibility after reconstruction. All signals were created in the separate decomposition channels of Y CB CR space. Based on the experimental results, perceptual weighting factors for a four-level decomposition with the 9/7 Daubechies wavelet filter in this color space were determined, which can be used for perceptually optimized quantization. Nadenau and Reichel proposed a new way to implement the CSF [81, 83, 85] using a filtering operation instead of a simple weighting in the wavelet domain. This provides an optimal adaptation of the CSF weighting to the local characteristics (spatial power spectrum) and can be combined with JPEG2000 in an encoder-bound technique while preserving lossless coding properties. In [82] it is investigated which color space is best suited for an HVS-model that provides an optimal datadecorrelation for DWT-based image compression. Three very different opponent color spaces are examined regarding their performance within the JPEG2000 codec. A detailed analysis is carried out using subjective ratings, and the observed performance is explained by various objective criteria like intercoefficient or inter-color-channel correlations. Finally, the same authors studied the performance of different masking models for DWT-based compression [84]. They used natural scenery stimuli and analyzed the models’ prediction performance, reliability and sensitivity to slightly changed parameters. The psychophysical test setup was intentionally close to the DWT-compression structure, so that the obtained results can be used directly for compression purposes.
E.3 DCT-DWT Comparison It is often argued which decomposition structure is better for compression, DCT or DWT. Eckert [29] presents a comparative analysis of wavelets, block DCT and lapped orthogonal transforms. He compares their visual compression performance by applying modified versions of the HVS model by Watson [131] to each of these decomposition structures. The SPIHT approach [102] is included as a non-HVS reference scheme. The results show that the DCT scheme exhibits the best visual quality and SPIHT the worst. The authors explain the inferior performance of the wavelet-codec with the sub-optimal arrangement of the data for the entropy coding step. The study revealed that the HVS-model applied to wavelet data was more correlated with subjective impression than the one in combination with the DCT. Jones et al. [56] compared the performance of a wavelet-based and a DCT-based codec for medical image compression. They implemented the CSF by means of a single factor frequency weighting in both codecs. Since the DCT-based approach does not allow to exploit local masking properties, they omitted this feature for the wavelet scheme as well. Nevertheless, the wavelet-based codec is found to offer the absence of blocking and the exploitation of masking as potential advantages. Its only drawback is the coarser precision of the CSF implementation (typically one weighting factors per subband, instead of one per DCT-coefficient in the 8 by 8 block). Both coding methods are compared by evaluating the entropy of the quantized coefficients at visually lossless quality. Recently, the problem of the coarser CSF control has been solved [85], which gives a clear advantage to the DWT.
E.4 Other Decomposition Structures A number of other decomposition structures have been proposed aside from the commonly used DCT and DWT. Watson [129] suggested using the cortex transform [128] for compression purposes. The transform coefficients are sampled and quantized based on an intra-channel contrast masking model. The entropy of the final data is measured to estimate a lower bound for the coding rate. Visually lossless coding is achieved for approximately 1 bpp. He also proposed an extension to video coding by separating static and motion channels [130], which has never been implemented and tested, however. Van Dyck and Rajala [27] propose a subband codec in combination with vector quantization. Instead of a typical wavelet decomposition it uses one that delivers diagonally structured subbands. They argue that this decomposition structure better accounts for the lower sensitivity to diagonally oriented edges. In the end, however, the compression performance is inferior to the one of standard rectangular subband decompositions, while the complexity is significantly increased. Moreover, features like lossless coding can no longer be realized. O’Rourke and Stevenson [87] also present a subband codec that uses vector quantization together with an HVS-model to control bit allocation. Within the same coding scheme they compare a separable, a non-separable and a newly proposed diagonal decomposition structure. The argument for the diagonally oriented decomposition is that the quantization artifacts will also be oriented diagonally and thus less visible, due to the reduced human sensitivity for diagonal stimuli. However, for normal-length decomposition filters, the non-separable decomposition is found to outperform the diagonal one. For long filters, the separable decomposition performs worse. The bit allocation uses a simple CSF weighting for all three structures. For decent compression ratios (0.9 bpp), standard JPEG performs better than the proposed scheme and is significantly cheaper in terms of complexity. For very high compression the quality judgment becomes very subjective. In general, blocking artifacts (JPEG) appear less natural and more annoying than ringing artifacts (wavelet codec). Albanesi and Bertoluzza [4, 11] did not modify the quantization or bit allocation stages. Instead, they designed new HVS-based wavelet filters so that the resulting low-frequency representation (approximation subband) is closest to the original, measured by means of a CSF-weighted MSE. The idea of directly modified filters is good, but it is insufficient to consider only an improved approximation subband. Also the quantization noise of the high-frequency coefficients in the detail subbands needs to be considered by the CSF. Moreover, the new filters are not necessarily stable. A similar modification of the DCT was also presented by Nill [86]. F. HVS in Still Image Compression Standards Basically, two standards exist for the compression of photorealistic images, namely JPEG (Joint Picture Experts Group) and JPEG2000 (currently available is the Final Committee Draft).3 Both of them include certain features that can be used to perceptually optimize the compression result. However, these features are not activated by default, and it is up to the final user to supply the required HVS-parameter files. This is the main reason why the standards are normally used without any visual optimization setting in their “plain” version. 3
See http://www.jpeg.org/ for an overview of current activities.
11
F.1 JPEG The JPEG standard [93] is based on the DCT computed on 8×8 blocks. The HVS is typically integrated via the 8×8 quantization table, whose entries specify the quantization step size. A proper design of the quantization table is difficult; some attempts were discussed in section VI-E.1 above. Even if the control over the CSF frequency weighting is relatively precise, it is quite difficult to implement its orientation-dependency [59]. Moreover, any masking implementation can only be based on the spatial information that is given by the position of the entire 8×8 coding block. Therefore, a pixel-wise modeling of contrast masking is impossible, but masking effects like texture masking that concern an entire sub-region can be modeled. Typically, this requires local adaptation and thus a locally varying quantization table. Even if the standard supports this feature, it is very coding-expensive, because all the quantization tables have to be transmitted within the bitstream. The standard itself recommends a particular quantization table in Annex K.1 [92], which is designed for a luminance-chrominance separated color space. F.2 JPEG2000 The JPEG2000 standard [51] is DWT-based and attaches particular importance on functionalities such as progressive coding, lossless coding and scalability. The quantization of the coefficients is implemented as successive approximations. For HVS integration, part 1 of the standard offers only the specification of a single perceptual CSF weight per subband. Part 2 also includes features to incorporate a coefficient-wise contrast masking function. However, the main advantage for HVS implementation in JPEG2000 lies in its multi-resolution decomposition structure and the post-compression rate-allocation [113], which allows to compute any distortion function based on the decomposition coefficients. Hence, it is possible to implement an entire HVS-model that uses the wavelet decomposition as input information and to influence the progressively encoded bitstream such that visually important information is encoded first. Even if the control over this ordering is of limited precision, it is typically sufficient as long as the images are not too small. Additionally, this allows an asymmetric complexity balance, because the HVS implementation affects only the encoder side.
be appropriate for elementary experiments. However, they are probably insufficient for the modeling of more complex phenomena that occur in natural images. Similarly, most psychophysical experiments focus on measurements at the threshold level, whereas quality metrics and compression are often applied above threshold. This obvious discrepancy has to be overcome by strongly intensified efforts with supra-threshold experiments, otherwise the metrics run the risk of being nothing else than extrapolation guesses. Finally, the particularities of color are often neglected and have not received much attention so far. Effects like chrominance masking should be investigated more intensively, and new color spaces need to be derived that consider spatial aspects and energy compaction. As these items show, the remaining tasks in HVS-research are challenging and need to solved by close collaboration of experts in psychophysics, color science and image processing. Acknowledgments The authors would like to acknowledge the financial support by Hewlett-Packard. References [1] [2]
[3]
[4]
[5]
[6]
[7] [8]
[9] [10]
VII. Conclusions Many image processing applications can be optimized by a measure of visual quality. Often this measure is realized by inadequate pixel-based difference metrics like MSE. We have attempted to show that significant improvements can be obtained by using metrics based on HVS-models instead. Those HVS-models are summarized in table I. However, the development of computational HVS-models is still in its infancy, and many issues remain to be investigated and solved. First of all, more comparative analysis is necessary in order to determine the most promising modeling approaches. The collaborative efforts of Modelfest [15] or VQEG [126] represent important steps in the right direction. Even if the former concerns low-level vision and the latter entire video quality assessment systems, both share the idea of applying different models to the same set of subjective data. For compression schemes, it is important to choose a standard codec, e.g. JPEG2000, to facilitate the comparison of the results. Furthermore, more psychophysical experiments (especially on masking) need to be done with natural images. The use of simple test patterns like Gabor patches or noise patterns may
[11]
[12] [13] [14]
[15] [16] [17] [18]
[19]
[20] [21]
A. J. Ahumada, Jr.: “Computational image quality metrics: A review.” in SID Symposium Digest , vol. 24, pp. 305–308, 1993. A. J. Ahumada, Jr., C. H. Null: “Image quality: A multidimensional problem.” in Digital Images and Human Vision, ed. A. B. Watson, pp. 141–148, MIT Press, 1993. A. J. Ahumada, Jr. et al.: “Spatio-temporal discrimination model predicts temporal masking function.” in Proc. SPIE , vol. 3299, pp. 120–127, San Jose, CA, 1998. M. Albanesi, S. Bertoluzza: “Human vision model and wavelets for highquality image compression.” in Image Processing and its Applications, pp. 311–315, IEE, 1995. D. G. Albrecht, W. S. Geisler: “Motion selectivity and the contrastresponse function of simple cells in the visual cortex.” Vis. Neurosci. 7:531–546, 1991. D. Alleysson: The processing of chromatic signal in the retina: A basis model for human color perception (In French). Ph.D. thesis, UJF University Joseph Fourier, 1999. J. Atick et al.: “Understanding retinal color coding from first principles.” Neural computation 4:559–572, 1992. P. Bao, B. Leung: “Wavelet transform image coding based on fuzzy visual perception modeling.” in Proceedings of the SPIE , vol. 3391, pp. 649–58, SPIE, Bellingham, WA, 1998. P. G. J. Barten: Contrast Sensitivity of the Human Eye and Its Effects on Image Quality. SPIE, Bellingham, Washington, 1999. D. A. Baylor et al.: “Spectral sensitivity of cone of the monkey macaca fascicularis.” Journal of Physiology 390:145–160, 1987. S. Bertoluzza: “On the coupling of the human visual system and wavelet transform for image compression.” Wavelet Applications in Signal and Image Processing II pp. 390–397, 1994. M. R. Bolin, G. W. Meyer: “A visual difference metric for realistic image synthesis.” in Proc. SPIE , vol. 3644, pp. 106–120, San Jose, CA, 1999. A. P. Bradley: “A wavelet visible difference predictor.” IEEE Trans. Image Processing 8(5):717–730, 1999. G. Buchsbaum, A. Gottschalk: “Trichromacy, opponent colours coding and optimum colour information transmission in the retina.” Proc. R. Soc. Lond. 220:89–113, 1983. T. Carney et al.: “Modelfest: year one results and plans for future years.” in Proc. SPIE , vol. 3959, pp. 140–151, San Jose, CA, 2000. G. W. Cermak et al.: “Validating objective measures of MPEG video quality.” SMPTE J. 107(4):226–235, 1998. D. Dacey: “Circuitry for color coding in the primate retina.” Proc. Natl. Acad. Sci. USA 93:582–588, 1996. S. Daly: “The visible differences predictor: An algorithm for the assessment of image fidelity.” in Digital Images and Human Vision, ed. A. B. Watson, pp. 179–206, MIT Press, 1993. S. Daly: “Engineering observations from spatiovelocity and spatiotemporal visual models.” in Proc. SPIE , vol. 3299, pp. 180–191, San Jose, CA, 1998. I. Daubechies, W. Sweldens: “Factoring wavelet transforms into lifting steps.” J. Fourier Anal. Appl. 4(3):245–267, 1998. J. G. Daugman: “Two-dimensional spectral analysis of cortical receptive field profiles.” Vision Res. 20(10):847–856, 1980.
Fourier DCT DCT custom/DCT DCT DCT QMF DWT (DB-16) DWT DWT-Packet DWT (DB 9/7) DWT DWT DWT/DCT DWT/DCT Cortex DWT DWT DWT
WHT
Fourier Fourier mod. Cortex DWT (DB 9/7) 2DoG DWT (Haar) 2DoG steerable pyr. Gabor mod. Gabor steerable pyr. DCT steerable pyr. steerable pyr. DWT (Haar)
Transform
yes yes
yes
yes
yes
?
yes yes yes
yes yes
B CSF E IQ QMF T
Local Contrast
2nd derivative of Gaussian Contrast masking over orientations Discrete Wavelet Transform Image compression Opponent color space Related analysis Walsh-Hadamard Transform
?
log L
Lγ
log L
L1/2.2
?
yes
L1/3 L1/3 yes
?
L0.33 log L
Lightness
2DoG C(ϕ) DWT IC Opp. RA WHT
Lum. AC1 C2 Lum. Lum. Lum. Opp. Opp. Lum. Lum. Lum. Opp. L∗ u∗ v ∗ Lum. AC1 C2 Opp. Lum. Y OZ Opp. various Lum. Lum. Lum. Lum. Lum. Lum. LMS Lum. Y CB CR Opp. Lum. various Y IQ Opp. Lum. Opp. Y CB C R Y CB C R Lum. Lum. Lum. Lum. Lum. Lum. Lum.
Color Space
not specified in publication Contrast masking over frequencies Discrete Cosine Transform Histogram Luminance Subjective ratings CSF weighting
IQ, IC IQ, IC VQ VQ IQ IQ VQ IQ IQ IQ IQ VQ IQ IQ VQ VQ VQ VQ VQ IQ VQ VQ VQ IQ VQ IC, IQ IC IC IC IC RA IC IC IC IC RA RA RA IC IC IC IC IC IC
Mannos & Sakrison 1974 [73] Faugeras 1979 [32] Lukas & Budrikis 1982 [71] Girod 1989 [38] Malo et al. 1997 [72] Zhang & Wandell 1996 [153] Tong et al. 1999 [117] Daly 1993 [18] Bradley 1999 [13] Lubin 1995 [69] Bolin & Meyer 1999 [12] Lubin & Fibush 1997 [70] Teo & Heeger 1994 [114] D’Zmura 1998 [28] van den Branden 1996 [120] Lindh & van den Branden 1996 [67] Watson 1998 [135] Winkler 1999 [144] Winkler 2000 [145] Lai & Kuo 2000 [64] Wolf and Pinson 1999 [147] Hamada et al. 1998 [47] Tan et al. 1998 [112] Miyahara et al. 1998 [78] Yeh et al. 1998 [151] Hall 1985 [45] Klein et al. 1992 [59] Watson 1994 [132] Westen et al. 1996 [141] Tong et al. 1998 [116] Drukarev 1997 [26] Safranek et al. 1990 [101] Lai & Kuo 1998 [63] Bao & Leung 1998 [8] Truchetet et al. 2000 [118] Watson et al. 1997 [138] Nadenau & Reichel 2000 [85] Nadenau & Reichel 2000 [84] Eckert 1997 [29] Jones et al. 1995 [56] Watson 1987 [129] Van Dyck & Rajala 1994 [27] O’Rourke & Stevenson 1995 [87] Albanesi & Bertoluzza 1994/5 [4, 11]
? C(f ) DCT H Lum. R W
Appl.
Reference
C
C,T C
Edge
T
C C C,T
C C C C C(?) C(ϕ) C(?) C C(ϕ) C C(ϕ) C(ϕ) C(f, ϕ) T T Edge Edge C T
C C
Masking
L2 L2
?
L2
L2 L4 L? L2 , L 4 various L2 H,L1
L1 PS PS L2.4 L2.4 Lp ,H L2
L2 L2 Lp L2 , L∞ L2
Pooling
Bitrate savings Contrast sensitivity function Examples Image quality Quadrature Mirror Filters Texture masking
W
W W W W W F F W W
F F F F W ? W
W W W W W W W
F F F F F F F F W F,W ? W
CSF
TABLE I Overview of HVS-models
C DB F Lp PS VQ
Spatio-temporal blocks, 2 features Noise, texture, object weighting Cognitive emulator 5 features Edge artifacts Coding of filtered image JPEG Q-matrix design DCTune DCT-compression JPEG Q-table scaled by texture Optimal color space for IC Empirical masking model Simplified HVS-model of [64] Edge-based HVS-model Coefficient pruning Wavelet noise visibility Precise CSF-filtering Comparison of masking models DCT/DWT comparison DCT/DWT comparison Cortex transform VQ-coding of diamond shaped DWT Rotated DWT HVS-based DWT-filter
Simplified version of [69] Sarnoff JND (VQEG) Contrast gain control model Color contrast gain control Color MPQM Video extension of [114] DVQ metric (VQEG) Video extension of [142] (VQEG) Analysis of [144]
Spatio-temporal model DCT-based error weighting Spatial CIELAB extension Spatio-temporal CIELAB extension Visible Difference Predictor Wavelet version of [18]
Remarks
Contrast masking, intra-channel Daubechies wavelet CSF filtering Lp -norm, exponent p Probability summation Video quality
B B B B E
E
B
R R R R R R
R E R E E R E R E E E E R [139] R [145] R
R E R
Subjective Evaluation
12
13
[22]
[23] [24] [25] [26] [27]
[28] [29]
[30] [31] [32] [33] [34]
[35] [36] [37] [38]
[39]
[40] [41] [42] [43] [44] [45]
[46]
[47]
[48] [49] [50] [51]
[52]
[53] [54]
[55] [56]
H. de Ridder et al.: “Naturalness and image quality: Chroma and hue variation in color images of natural scenes.” in Proc. SPIE , vol. 2411, pp. 51–61, San Jose, CA, 1995. G. Deffner et al.: “Evaluation of display-image quality: Experts vs. nonexperts.” in SID Symposium Digest , vol. 25, pp. 475–478, 1994. A. Derrington et al.: “Chromatic mechanisms in lateral geniculate nucleus of macaque.” J. Physiol. 357:241–265, 1984. M. D’Esposito et al.: “A functional mri study of mental image generation.” Neuropsychologia 35:725–730, 1997. A. Drukarev: “Compression-related properties of color spaces.” in Proceedings of SPIE , vol. 3024, pp. 855–863, 1997. R. V. Dyck, S. Rajala: “Subband/VQ coding of color images using a separable diamond decomposition.” Journal of Visual Communication and Image Representation 5(3):205–220, 1994. M. D’Zmura et al.: “Contrast gain control for color image quality.” in Proc. SPIE , vol. 3299, pp. 194–201, San Jose, CA, 1998. M. Eckert: “Lossy compression using wavelets, block DCT, and lapped orthogonal transforms optimized with a perceptual model.” in Proceedings of the SPIE , vol. 3031, pp. 339–50, SPIE, 1997. R. Eriksson et al.: “Modelling the perception of digital images: A performance study.” in Proc. SPIE , vol. 3299, pp. 88–97, San Jose, CA, 1998. A. M. Eskicioglu, P. S. Fisher: “Image quality measures and their performance.” IEEE Trans. Comm. 43(12):2959–2965, 1995. O. D. Faugeras: “Digital color image processing within the framework of a human visual model.” IEEE Trans. ASSP 27(4):380–393, 1979. R. E. Fredericksen, R. F. Hess: “Estimating multiple temporal mechanisms in human vision.” Vision Res. 38(7):1023–1040, 1998. D. R. Fuhrmann et al.: “Experimental evaluation of psychophysical distortion metrics for JPEG-coded images.” J. Electronic Imaging 4(4):397– 406, 1995. M. A. Garc´ıa-P´ erez: “The perceived image: Efficient modelling of visual inhomogeneity.” Spatial Vision 6(2):89–99, 1992. A. Gersho, R. M. Gray: Vector Quantization and Signal Compression. Kluwer Academic Publishers, Boston/Dordrechet/London, 1992. G. A. Gescheider: Psychophysics: The Fundamentals. Lawrence Erlbaum Associates, 3rd edn., 1997. B. Girod: “The information theoretical significance of spatial and temporal masking in video signals.” in Proc. SPIE , vol. 1077, pp. 178–187, Los Angeles, CA, 1989. N. Graham, A. Sutter: “Normalization: contrast-gain control in simple (Fourier) and complex (non-Fourier) pathways of pattern vision.” Vision Res. 40(20):2737–2761, 2000. E. M. Granger, J. C. Heurtley: “Visual chromaticity-modulation transfer function.” J. Opt. Soc. Am. 63(9):1173–1174, 1973. D. J. Granrath: “The role of human visual models in image processing.” Proceedings of the IEEE 69(5):552–561, 1981. H. G. Grassmann: “Zur Theorie der Farbenmischung.” Poggendorffs Annalen der Physik und Chemie 89:69–84, 1853. D. M. Green, J. A. Swets: Signal Detection Theory and Psychophysics. Wiley, 1966. S. Guth: “Model for color vision and light adaptation.” J. Opt. Soc. Am. 8(6):976–993, 1991. C. Hall: “The application of human visual system models to digital color image compression.” in Image Coding, vol. 594, pp. 21–8, SPIE, Bellingham, WA, 1985. C. F. Hall: “The application of human visual system models to digital color image compression.” in Proc. SPIE , vol. 594, pp. 21–28, Cannes, France, 1985. T. Hamada et al.: “Picture quality assessment system by three-layered bottom-up noise weighting considering human visual perception.” SMPTE J. 108(1):20–26, 1999. D. J. Heeger: “Half-squaring in responses of cat striate cells.” Vis. Neurosci. 9:427–443, 1992. D. J. Heeger: “Normalization of cell responses in cat striate cortex.” Vis. Neurosci. 9:181–197, 1992. R. F. Hess, R. J. Snowden: “Temporal properties of human visual filters: Number, shapes and spatial covariation.” Vision Res. 32(1):47–59, 1992. ISO/IEC JTC1/SC29/WG1: “JPEG 2000 - lossless and lossy compression of continous-tone and bi-level still images: Part I minimum decoder.” Final Committee Draft Version 1.0, 2000. ITU-R Recommendation BT.500-10: “Methodology for the subjective assessment of the quality of television pictures.” ITU, Geneva, Switzerland, 2000. R. E. Jacobson: “An evaluation of image quality metrics.” J. Photographic Sci. 43(1):7–16, 1995. D. Jameson, L. M. Hurvich: “Some quantitative aspects of an opponentcolors theory. I. chromatic response and spectral saturation. II. brightness, saturation and hue in normal and dichromatic vision.” J. Opt. Soc. Am. 45(7,8), 1955. N. Jayant et al.: “Perceptual coding of images.” in Proceedings of the SPIE , vol. 1913, pp. 168–78, 1993. P. Jones et al.: “Comparative study of wavelet and DCT decompositions with equivalent quantization and encoding strategies for medical images.” in Proceedings of the SPIE , pp. 571–582, 1995.
[57] [58] [59]
[60]
[61] [62]
[63]
[64]
[65] [66] [67]
[68] [69]
[70] [71] [72]
[73]
[74] [75]
[76]
[77] [78] [79] [80] [81]
[82]
[83] [84]
[85]
[86]
[87]
[88]
[89]
P. Kaiser, R. Boynton: Human color vision. ISBN 1-55752-461-0, Optical Society of America, 1996. D. H. Kelly: “Spatiotemporal variation of chromatic and achromatic contrast thresholds.” J. Opt. Soc. Am. 73(6):742–750, 1983. S. Klein et al.: “Relevance of human vision to JPEG-DCT compression.” in Proceedings of the SPIE - Human Vision, Visual Processing and Digital Display III , vol. 1666, pp. 200–215, 1992. S. A. Klein: “Image quality and image compression: A psychophysicist’s viewpoint.” in Digital Images and Human Vision, ed. A. B. Watson, pp. 73–88, MIT Press, 1993. S. A. Klein et al.: “Seven models of masking.” in Proc. SPIE , vol. 3016, pp. 13–24, San Jose, CA, 1997. J. Kremers et al.: “Responses of macaque ganglion cells and human observers to coumpound periodic waveforms.” Vision Res. 33(14):1997– 2011, 1993. Y.-K. Lai, C.-C. J. Kuo: “Wavelet image compression with optimized perceptual quality.” in Applications of Digital Image Processing XXI , SPIE, San Diego, CA, 1998. Y.-K. Lai, C.-C. J. Kuo: “A Haar wavelet approach to compressed image quality measurement.” Journal of Visual Communication and Image Representation 11(1):17–40, 2000. B. Lee et al.: “Responses to pulses and sinusoids in macaque ganglion cells.” Vision Res. 34(23):3081–3096, 1994. B. Li et al.: “A comparison of two image quality models.” in Proc. SPIE , vol. 3299, pp. 98–109, San Jose, CA, 1998. P. Lindh, C. J. van den Branden Lambrecht: “Efficient spatio-temporal decomposition for perceptual processing of video sequences.” in Proc. ICIP , vol. 3, pp. 331–334, Lausanne, Switzerland, 1996. M. Livingstone, D. Hubel: “Segregation of form, color movement and depth : Anatomy, physiology and perception.” Science 240:740–749, 1988. J. Lubin: “A visual discrimination model for imaging system design and evaluation.” in Vision Models for Target Detection and Recognition, ed. E. Peli, pp. 245–283, World Scientific Publishing, 1995. J. Lubin, D. Fibush: “Sarnoff JND vision model.” T1A1.5 Working Group Document #97-612, T1 Standards Committee, 1997. F. X. J. Lukas, Z. L. Budrikis: “Picture quality prediction based on a visual model.” IEEE Trans. Comm. 30(7):1679–1692, 1982. J. Malo et al.: “Subjective image fidelity metric based on bit allocation of the human visual system in the DCT domain.” Image Vis. Comp. 15(7):535–548, 1997. J. L. Mannos, D. J. Sakrison: “The effects of a visual fidelity criterion on the encoding of images.” IEEE Trans. Inform. Theory 20(4):525–536, 1974. H. Marmolin: “Subjective MSE measures.” IEEE Trans. Systems, Man, and Cybernetics 16(3):486–489, 1986. J.-B. Martens, V. Kayargadde: “Image quality prediction in a multidimensional perceptual space.” in Proc. ICIP , vol. 1, pp. 877–880, Lausanne, Switzerland, 1996. A. Mayache et al.: “A comparison of image quality models and metrics based on human visual sensitivity.” in Proc. ICIP , vol. 3, pp. 409–413, Chicago, IL, 1998. S. Merbs, J. Nathans: “Absorption spectra of human cone pigments.” Nature 356:433–435, 1992. M. Miyahara et al.: “Objective picture quality scale (PQS) for image coding.” IEEE Trans. Comm. 46(9):1215–1226, 1998. MOSAIC: A New Single Stimulus Quality Assessment Methodology. RACE R2111, 1996. K. T. Mullen: “The contrast sensitivity of human colour vision to redgreen and blue-yellow chromatic gratings.” J. Physiol. 359:381–400, 1985. M. Nadenau, J. Reichel: “Compression of color images with wavelets under consideration of the HVS.” in Proc. SPIE Human Vision and Electronic Imaging, vol. 3644, SPIE, San Jose, CA, 1999. M. Nadenau, J. Reichel: “Opponent color, human vision and wavelets for image compression.” in Proceedings of the Seventh Color Imaging Conference, pp. 237–242, IS&T, Scottsdale, Arizona, 1999. M. Nadenau, J. Reichel: “Wavelet compression of color images with reference to the HVS.” Electronic Newsletters 9(2):6, 1999. M. Nadenau, J. Reichel: “Image compression related contrast masking measurements.” in Proc. SPIE Human Vision and Electronic Imaging, vol. 3959, SPIE, San Jose, CA, 2000. M. J. Nadenau et al.: “Wavelet-based color image compression: Exploiting the contrast sensitivity function.” submitted to IEEE Transactions on Image Processing 2000. N. B. Nill: “A visual model weighted cosine transform for image compression and quality assesment.” IEEE Transactions on Communications COM-33(6):551–557, 1985. T. O’Rourke, R. Stevenson: “Human visual system based wavelet decomposition for image compression.” Journal of Visual Communication and Image Representation 6(2):109–121, 1995. T. N. Pappas, R. J. Safranek: “Perceptual criteria for image quality evaluation.” in Handbook of Image & Video Processing, ed. A. Bovik, chap. 8.2, pp. 669–684, Academic Press, 2000. E. Peli: “Contrast in complex images.” J. Opt. Soc. Am. A 7(10):2032– 2040, 1990.
14
[90]
[91]
[92] [93] [94]
[95]
[96]
[97]
[98] [99] [100] [101] [102]
[103] [104] [105] [106] [107]
[108] [109] [110]
[111]
[112] [113] [114] [115] [116]
[117] [118] [119] [120] [121]
[122]
[123]
[124]
E. Peli: “In search of a contrast metric: Matching the perceived contrast of Gabor patches at different phases and bandwidths.” Vision Res. 37(23):3217–3224, 1997. D. G. Pelli, B. Farell: “Psychophysical methods.” in Handbook of Optics: Fundamentals, Techniques, and Design, eds. M. Bass et al., vol. 1, chap. 29, McGraw-Hill, 2nd edn., 1995. W. Pennebaker, J. Mitchell: “Probability adaption for arithmetic coders.” US Patent 5,099,440, 1992. W. B. Pennebaker, J. L. Mitchell: JPEG Still image data compression standard. Van Nostrand Reinhold, New York, 1993. C. I. Podilchuk, R. J. Safranek: “Image and video compression: A review.” International Journal of High Speed Electronics and Systems 8(1):119–77, 1997. J. Reichel et al.: “Integer wavelet transform for embedded lossy to lossless image compression.” to be published in IEEE Transactions on Image Processing 2000. S. Rihs: “The influence of audio on perceived picture quality and subjective audio-video delay tolerance.” in MOSAIC Handbook, pp. 183–187, 1996. A. M. Rohaly et al.: “Object discrimination in natural background predicted by discrimination performance and models.” Vision Res. 37(23):3225–3235, 1997. A. M. Rohaly et al.: “Video Quality Experts Group: current results and future directions.” in Proc. SPIE , vol. 4067, Perth, Australia, 2000. J. A. J. Roufs: “Perceptual image quality: Concept and measurement.” Philips J. Res. 47(1):35–62, 1992. D. Ruderman et al.: “Statistics of cone response to natural images : implications for visual coding.” J. Opt. Soc. Am. 15(8):2036–2045, 1998. R. Safranek et al.: “A perceptually tuned sub-band image coder.” SPIE, Human Vision and Electronic Imaging 1249:284–293, 1990. A. Said, W. A. Pearlman: “A new fast and efficient image codec based on set partitioning in hierarchical trees.” IEEE Transaction on Circuits and Systems for Video Technology 6:243–250, 1996. D. Santa-Cruz et al.: “JPEG 2000 still image coding versus other standards.” in Proceedings of the SPIE , vol. 4115, 2000. A. E. Savakis et al.: “Evaluation of image appeal in consumer photography.” in Proc. SPIE , vol. 3959, pp. 111–120, San Jose, CA, 2000. O. H. Schade: “Optical and photoelectric analog of the eye.” J. Opt. Soc. Am. 46(9):721–739, 1956. W. Schreiber: Fundamentals of Electronic Imaging Systems. Springer Verlag, New York, 1993. A. J. Seyler, Z. L. Budrikis: “Detail perception after scene changes in television image presentations.” IEEE Trans. Inform. Theory 11(1):31– 43, 1965. R. Shapley, C. Enroth-Cugell: “Visual adaptation and retinal gain controls.” Progr. Ret. Res. 3:263–346, 1984. V. Smith, J. Pokorny: “Spectral sensitivity of the foveal cone photopigments between 400 and 500 nm.” Vision Res. 15:161–171, 1973. A. Stockman, L. T. Sharpe: “Spectral sensitivities of the middle- and long-wavelength sensitive cones derived from measurements in observers of known genotype.” Vision Res. 40(13):1711–1737, 2000. A. Stockman et al.: “The spectral sensitivity of the human shortwavelength sensitive cones derived from thresholds and color matches.” Vision Res. 39(17):2901–2927, 1999. K. T. Tan et al.: “An objective measurement tool for MPEG video quality.” Signal Processing 70(3):279–294, 1998. D. Taubman: “High performance scalable image compression with EBCOT.” IEEE Transactions on Image Processing 9(7):1158–70, 2000. P. C. Teo, D. J. Heeger: “Perceptual image distortion.” in Proc. SPIE , vol. 2179, pp. 127–141, San Jose, CA, 1994. P. C. Teo, D. J. Heeger: “Perceptual image distortion.” in Proc. ICIP , vol. 2, pp. 982–986, Austin, TX, 1994. H. H. Y. Tong, A. N. Venetsanopoulos: “A perceptual model for JPEG applications based on block classification, texture masking and luminance masking.” in Proc. ICIP , pp. 428–32, Chicago, IL, 1998. X. Tong et al.: “Video quality evaluation using ST-CIELAB.” in Proc. SPIE , vol. 3644, pp. 185–196, San Jose, CA, 1999. F. Truchetet et al.: “High-quality still color image compression.” Optical Engineering 39(2):409–14, 2000. R. D. Valois, K. D. Valois: “A multi-stage color model.” Vision Res. 33(8):1053–1065, 1993. C. J. van den Branden Lambrecht: “Color moving pictures quality metric.” in Proc. ICIP , vol. 1, pp. 885–888, Lausanne, Switzerland, 1996. C. J. van den Branden Lambrecht: Perceptual Models and Architectures for ´ Video Coding Applications. Ph.D. thesis, Ecole Polytechnique F´ ed´ erale de Lausanne, Switzerland, 1996. C. J. van den Branden Lambrecht, O. Verscheure: “Perceptual quality measure using a spatio-temporal model of the human visual system.” in Proc. SPIE , vol. 2668, pp. 450–461, San Jose, CA, 1996. C. J. van den Branden Lambrecht et al.: “Quality assessment of motion rendition in video coding.” IEEE Trans. Circ. Syst. Video Tech. 9(5):766– 782, 1999. G. van der Horst, M. A. Bouman: “Spatiotemporal chromaticity discrimination.” Journal of the Optical Society of America 59:1482–1488, 1969.
[125] A. M. van Dijk, J.-B. Martens: “Subjective quality assessment of compressed images.” Signal Processing 58(3):235–252, 1997. [126] VQEG: “Final report from the Video Quality Experts Group on the validation of objective models of video quality assessment.” 2000, available at ftp://ftp.its.bldrdoc.gov/dist/ituvidq/. [127] B. Wandell: Foundations of Vision. Sinauer Associates, 1995. [128] A. B. Watson: “The cortex transform: Rapid computation of simulated neural images.” Computer Vision, Graphics, and Image Processing 39(3):311–327, 1987. [129] A. B. Watson: “Efficiency of a model human image code.” Journal of the Optical Society of America A 4(12):311–327, 1987. [130] A. B. Watson: “Perceptual-components architecture for digital video.” J. Opt. Soc. Am. A 7(10):1943–1954, 1990. [131] A. B. Watson: “DCT quantization matrices visually optimized for individual images.” in Proceedings of the SPIE , vol. 1913, pp. 202–216, 1993. [132] A. B. Watson: “Perceptual optimization of DCT color quantization matrices.” in Proc. ICIP , vol. 1, pp. 100–104, Austin, TX, 1994. [133] A. B. Watson: “Image data compression having minimum perceptual error.” US Patent 5,426,512, 1995. [134] A. B. Watson: “Image data compression having minimum perceptual error.” US Patent 5,629,780, 1997. [135] A. B. Watson: “Toward a perceptual video quality metric.” in Proc. SPIE , vol. 3299, pp. 139–147, San Jose, CA, 1998. [136] A. B. Watson, J. A. Solomon: “Model of visual contrast gain control and pattern masking.” J. Opt. Soc. Am. A 14(9):2379–2391, 1997. [137] A. B. Watson et al.: “Image quality and entropy masking.” in Proc. SPIE , vol. 3016, pp. 2–12, San Jose, CA, 1997. [138] A. B. Watson et al.: “Visibility of wavelet quantization noise.” IEEE Transactions on Image Processing 6(8):1164–1174, 1997. [139] A. B. Watson et al.: “Design and performance of a digital video quality metric.” in Proc. SPIE , vol. 3644, pp. 168–174, San Jose, CA, 1999. [140] M. Webster: “Human colour perception and its adaptation.” Network: Computation in Neural Systems 7:587–634, 1996. [141] S. J. P. Westen et al.: “Optimization of JPEG color image coding using a human visual system model.” SPIE 2657:370–381, 1996. [142] S. Winkler: “A perceptual distortion metric for digital color images.” in Proc. ICIP , vol. 3, pp. 399–403, Chicago, IL, 1998. [143] S. Winkler: “Issues in vision modeling for perceptual video quality assessment.” Signal Processing 78(2):231–252, 1999. [144] S. Winkler: “A perceptual distortion metric for digital color video.” in Proc. SPIE , vol. 3644, pp. 175–184, San Jose, CA, 1999. [145] S. Winkler: “Quality metric design: A closer look.” in Proc. SPIE , vol. 3959, pp. 37–44, San Jose, CA, 2000. [146] S. Winkler, P. Vandergheynst: “Computing isotropic local contrast from oriented pyramid decompositions.” in Proc. ICIP , vol. 4, pp. 420–424, Kyoto, Japan, 1999. [147] S. Wolf, M. H. Pinson: “Spatial-temporal distortion metrics for in-service quality monitoring of any digital video system.” in Proc. SPIE , vol. 3845, pp. 266–277, Boston, MA, 1999. [148] S. Wu: “Synaptic transmission in the outer retina.” Annual Reviews on Physiology 56:141–168, 1994. [149] G. Wyszecki, W. S. Stiles: Color Science: Concepts and Methods, Quantitative Data and Formulae. John Wiley & Sons, 2nd edn., 1982. [150] J. Yang, W. Makous: “Spatiotemporal separability in contrast sensitivity.” Vision Res. 34(19):2569–2576, 1994. [151] E. M. Yeh et al.: “A perceptual distortion measure for edge-like artifacts in image sequences.” in Proc. SPIE , vol. 3299, pp. 160–172, San Jose, CA, 1998. [152] S. N. Yendrikhovskij et al.: “Perceptually optimal color reproduction.” in Proc. SPIE , vol. 3299, pp. 274–281, San Jose, CA, 1998. [153] X. Zhang, B. A. Wandell: “A spatial extension of CIELAB to predict the discriminability of colored patterns.” in SID Symposium Digest , vol. 27, pp. 731–735, 1996.
15
Marcus J. Nadenau, Member IEEE, was born in Germany, 1971. He received his diploma (M.S.) in electrical engineering from the University of Technology, Aachen, Germany, in 1997. In 1997 he joined the Signal Processing Laboratory of Prof. Murat Kunt at the Swiss Federal Institute of Technology, Lausanne, Switzerland. He is currently working towards his Ph.D. degree. His research interests include image compression, color and human vision.
Stefan Winkler, Member IEEE, received his diploma (M.Sc.) in electrical engineering from the University of Technology in Vienna, Austria, in 1996. He then joined the Signal Processing Laboratory of the Swiss Federal Institute of Technology (EPFL) in Lausanne, where he currently works towards his Ph.D. degree. His research interests include vision modeling and its application to visual quality assessment.
David Alleysson was born in France, 1971. He received his diploma (PhD) in computer science option cognitive science from the University Joseph Fourier Grenoble France in 1999. He his currently in PostDoc at the Signal Processing Laboratory of Prof. Murat Kunt at the Swiss Federal Institute of Technology, Lausanne, Switzerland. His research interests is modeling human physiology for finding robust and efficient color image processing algorithms.
Murat Kunt (SM 1970, M 1974, SM 1980, F 1986) was born in Ankara, Turkey, on January 16, 1945. He received his M.S. in Physics and his Ph.D. in Electrical Engineering, both from the Swiss Federal Institute of Technology, Lausanne, Switzerland, in 1969 and 1974 respectively. From 1974 to 1976, he was a visiting scientist at the Research Laboratory of Electronics of the Massachusett Institute of Technology where he developed compression techniques for X-ray images and electronic image files. In 1976, he returned to the Swiss Federal Institute of Technology (EPFL) where, presently, he is Professor of Electrical Engineering and Director of the Signal Processing Laboratory, one of the largest laboratories at EPFL. He conducts teaching and research in digital signal and image processing with applications to modeling, coding, pattern recognition, scene analysis, industrial developments and biomedical engineering. His Laboratory participates to a large number of European projects under various programs such as Esprit, Eureka, Race, HCM, Commett and Cost. He is the author or the coauthor of more than two hundred research papers and fifteen books and hold seven patents. He is the Editor-in-Chief of the Signal Processing Journal and a founding member of EURASIP, the European Association for Signal Processing. He serves as a chairman and/or a member of the Scientific Committees of several international conferences and in the editorial boards of the Proceedings of the IEEE, Pattern Recognition Letters and Traitement du Signal. He was the co-chairman of the first European Signal Processing Conference which was held in Lausanne in 1980 and the general chairman of the International Image Processing Conference (ICIP’96) held in Lausanne in 1996. He was the President of the Swiss Association for Pattern Recognition from its creation till 1997. He consults for governmental offices including the French General Assembly and major IT companies. He received the gold medal of EURASIP for meritorious services, the IEEE ASSP technical achievement award and the IEEE Third millennium Medal in 1983, 1997 and 2000 respectively.