is only 20-25% (Wilcox et al., 1993) and approximately one quarter of ...... Ko, L. J., Yamamoto, M., Leonard, M. W., George, K. M., Ting, P. and. Engel, J. D. ...
Development 121, 2513-2523 (1995) Printed in Great Britain © The Company of Biologists Limited 1995
2513
Hxt encodes a basic helix-loop-helix transcription factor that regulates trophoblast cell development James C. Cross1,†,*, Margaret L. Flannery1, Michael A. Blanar2,‡, Eirikur Steingrimsson3, Nancy A. Jenkins3, Neal G. Copeland3 William J. Rutter2 and Zena Werb1 1Laboratory of Radiobiology and Environmental Health, Department of Anatomy, and Program in Developmental Biology, and 2Hormone Research Institute, University of California, San Francisco, California 94143, USA 3Mammalian Genetics Laboratory, ABL-Basic Research Program, NCI-Frederick Cancer Research and Development Center,
Frederick, Maryland 21702, USA *Author for correspondence †Present address: Samuel Lunenfeld Research Institute, Mount Sinai Hospital, 600 University Avenue, Toronto, Ontario M5G 1X5, Canada ‡Present address: Department of Cardiovascular Molecular and Cellular Biology, Bristol-Myers Squibb Pharmaceutical Research Institute, Route 206 and Provinceline Road, Princeton NJ 08543-4000, USA
SUMMARY Trophoblast cells are the first lineage to form in the mammalian conceptus and mediate the process of implantation. We report the cloning of a basic helix-loop-helix (bHLH) transcription factor gene, Hxt, that is expressed in early trophoblast and in differentiated giant cells. A separate gene, Hed, encodes a related protein that is expressed in maternal deciduum surrounding the implantation site. Overexpression of Hxt in mouse blastomeres directed their development into trophoblast cells in blastocysts. In addition, overexpression of Hxt induced the differentiation of rat trophoblast (Rcho-1) stem cells as assayed
by changes in cell adhesion and by activation of the placental lactogen-I gene promoter, a trophoblast giant cell-specific gene. In contrast, the negative HLH regulator, Id-1, inhibited Rcho-1 differentiation and placental lactogen-I transcription. These data demonstrate a role for HLH factors in regulating trophoblast development and indicate a positive role for Hxt in promoting the formation of trophoblast giant cells.
INTRODUCTION
farm animals, failures in development at implantation account for almost 80% of the embryonic loss that occurs throughout the entire length of gestation (Roberts et al., 1990). Factors that regulate the differentiation of placental cell lineages are largely unknown. The POU-domain transcription factor Oct-4 is expressed in undifferentiated cells during cleavage stage development and is downregulated as cells differentiate into trophoblast and endoderm (Palmieri et al., 1994). Although Oct-4 may play a direct role in preventing differentiation into the trophoblast lineage, other factors must play a positive role. Pem is a homeodomain transcription factor that is expressed in trophoblast and yolk sac in the mouse placenta (Wilkinson et al., 1990), but its expression peaks after implantation. GATA-3 is a zinc finger transcription factor that is expressed in the placenta and in trophoblast cell lines which may regulate placental lactogen-1 transcription (Ng et al., 1994). However, GATA-3 is also expressed in other cell types (Ko et al., 1991). Genetic evidence indicates that basic-helix-loop-helix (bHLH) transcription factors function as cell-lineage determinants in skeletal muscle development in mammals (MyoD, myogenin, mrf-4, myf-5) and in mesoderm and neuronal cell differentiation in Drosophila (achaete-scute) (Olson, 1990, 1992; Jan and Jan, 1993). Cell-specific bHLH factors have also
The first cell lineages to be established in the mammalian embryo contribute only to extraembryonic structures that form the placenta (see Cross et al., 1994). It is only after implantation that significant differentiation occurs in the embryonic ectoderm, cells that give rise to all the structures of the embryo proper. The placenta is formed from three extraembryonic lineages: trophoblasts that lie adjacent to maternal cells in the implantation site, endoderm that migrates across the inner surface of the trophoblast layer and mesoderm that gives rise to placental blood vessels. The development of these extraembryonic lineages has largely been ignored in the molecular analysis of development. Nonetheless, abnormalities in trophoblast development or in formation of the placenta account for the most common gestational abnormalities in humans and animals, including failures of implantation, intrauterine growth retardation and stillbirth. Human fecundity is only around 25%, owing partially to fertilization failure but more significantly to failures in early development. For example, even after careful selection of embryos, the success of embryo transfer in humans is only 20-25% (Wilcox et al., 1993) and approximately one quarter of human embryos that begin to implant die before the pregnancy is recognized clinically (Wilcox et al., 1988). In
Key words: trophoblast, placenta, transcription, helix-loop-helix, Hxt, mouse, rat
2514 J. C. Cross and others been identified in other mammalian cell types, where it is likely they function as regulators of lineage commitment and differentiation. This suggested to us that such factors might also regulate the trophoblast cell lineage. Members of the bHLH transcription factor family function as heterodimers, typically between cell-specific factors and the widely expressed E factors, such as E12 and E47, which are products of the E2A gene (Murre et al., 1991), HEB (Hu et al., 1992), and ITF2 (Henthorn et al., 1990). To take advantage of the ability of cellspecific factors to heterodimerize with E factors, we used the HLH domain of E47 as protein probe to identify two novel bHLH factors, by means of the so-called interaction cloning procedure (Blanar and Rutter, 1992). One of these factors, Hxt, is specifically expressed in trophoblast cells. We present evidence that Hxt regulates trophoblast differentiation and suggest a model for the role of bHLH factors in trophoblast development. MATERIALS AND METHODS Interaction cloning and sequencing of Hxt and Hed Phage expression libraries prepared from day 13 ovine conceptuses (Kramer et al., 1994) or differentiated mouse embryoid bodies (Robbins et al., 1990) were screened by interaction cloning (Blanar and Rutter, 1992). A detailed description of the mutant shPan-1 (E47; German et al., 1991) protein probe is provided elsewhere (Blanar et al., 1995). Briefly, the bHLH domain of E47 was cloned into an E. coli expression vector downstream of a sequence encoding the recognition sequence for cAMP-dependent protein kinase (heart muscle kinase). Basic residues in the bHLH domain were mutated to block its ability to bind DNA. This protein was labeled with heart muscle kinase (Sigma) and γ-[32P]ATP. The original Hxt isolate from the ovine conceptus library (λ8.1) did not contain a full-length Hxt cDNA. A 5′ end fragment was used to probe the original library by using standard procedures (Sambrook et al., 1989). cDNAs cloned into pBluescript (Stratagene) were sequenced by using the dideoxy chain termination method. Plasmids A cytomegalovirus promoter-Hxt expression vector (pCMVHxt) was prepared by ligating an XhoI-EcoRI fragment of the ovine Hxt cDNA into pcDNA-I (Invitrogen). The plasmid pCMVMash2 was constructed by ligating the rat Mash2 cDNA (Johnson et al., 1990) into pcDNA-I. Id-1 sense (pMXIds) and antisense (pMXId1as) expression vectors were obtained from J. Campisi (Lawrence Berkeley Laboratory). The Id-1 cDNA was also ligated into the BamHI site downstream of a promoter regulated by operator binding sites for a tetracycline-regulated transactivator (Gossen and Bujard, 1992), to produce pTTOId-1. The plasmid pβactinlacZ was produced by inserting the lacZ gene from pNASSβ (Clontech) downstream of the human β-actin promoter (from K. Sturm). The IFN-τ promoterluciferase construct (pBTP-450Luc) was prepared by ligating a HindIII-NcoI IFN-τ promoter fragment (Cross and Roberts, 1991) upstream of the luciferase gene in the plasmid pFOXLuc (from M. German, University of California, San Francisco). Mouse placental lactogen-I promoter-CAT constructs (Shida et al., 1993) were obtained from D. Linzer (Northwestern University). Interspecific backcross mapping Interspecific backcross progeny were generated by mating (C57BL/6J×M. spretus)F1 females and C57BL/6J males as described (Copeland and Jenkins, 1991). A total of 205 H2 mice were used to map the Hed and Hxt loci using standard procedures (Jenkins et al., 1982). The original probe was a 220 bp PCR-derived fragment over-
lapping the bHLH domain (reaction is described below) that was generated from mouse genomic DNA and was labeled with α[32P]dCTP by random prime labeling. Washing was done to a final stringency of 1.0× SSCP (Sambrook et al., 1989), 0.1% sodium dodecyl sulfate (SDS) at 65°C. Major fragments of 20.5 and 7.8 kb were detected in BamHI-digested C57BL/6J DNA compared to 11.0 and 9.6 kb in M. spretus DNA. The 11.0 kb BamHI M. spretus-specific fragment defined the Hxt locus to chromosome 11, whereas the 9.6 kb BamHI M. spretus-specific fragment defined the Hed locus to chromosome 8. These assignments were confirmed with 3′ noncoding region probes for the two genes. The probes and RFLPs for the loci linked to Hed, including scavenger receptor (Scvr), jun D (Jund) and mitochondrial uncoupling protein (Ucp), have been reported previously (Freeman et al., 1990; Kuo et al., 1991). However, the lipoprotein lipase (Lpl) locus has not been reported for this interspecific cross. The Lpl probe was a 1.4 kb EcoRI fragment of mouse cDNA that detected 5.0, 4.4, 3.6, 0.7 and 0.54 kb fragments in C57BL/6J and 10.5, 5.0, 2.8, 0.8, 0.62 and 0.54 kb fragments in M. spretus TaqI-digested DNA. The 10.5, 2.8, 0.8 and 0.62 fragments co-segregated and were followed in backcross mice. The probes and RFLPs for the loci linked to Hxt, including adrenergic receptor, alpha 1 (Adra1), granulocyte-macrophage colony-stimulating factor (Csfgm) and skeletal myosin heavy chain (Myhs) have been reported (Buchberg et al., 1989; McKenzie et al., 1993). Recombination distances were calculated (Green, 1981) by using the computer program SPRETUS MADNESS. Gene order was determined by minimizing the number of recombination events required to explain the allele distribution patterns. RNA analysis Total RNA was prepared from cells and tissues by extraction in a guanidine-acid phenol solution (Biotecx), according to the manufacturer’s recommendations. RNAs were electrophoresed in MOPS/formaldehyde gels (Sambrook et al., 1989), capillary blotted with 10× SSC (Sambrook et al., 1989), and UV-crosslinked onto nylon membranes (Duralon, Stratagene). A blot containing poly(A)+ RNA from several mouse tissues was obtained from Clontech Laboratories (mouse MTN blot). cDNA probes for Hxt, Id-1/2 (Sun et al., 1991), Mash-2 (Johnson et al., 1990), Pem (Wilkinson et al., 1990) and glyceraldehyde-3-phosphate dehydrogenase (GAPDH) were labeled with α-[32P]dCTP by random prime-labeling. Blots were hybridized for 3 hours in Quick-Hyb solution (Stratagene) and were washed in 0.1× SSC, 0.1% SDS at 58-63°C. The presence of Hxt mRNA at preimplantation stages of development was assessed by using a PCR-based assay of plasmid cDNA libraries prepared from mouse eggs, 2-cell embryos and blastocysts (Rothstein et al., 1992). Dilutions of library or vector were subjected to 30 cycles of PCR (94°C, 55°C, 72°C; 1 minute each) by using Hxtspecific primers (5′-GCGGAATTCTCCTATGGTCCAGACGCCAG3′ and 5′-GGCGAATTCGCGCAGAGTCTTGATCTTGG-3′). The 220 bp product was assessed by agarose gel electrophoresis. In situ hybridization In situ hybridization was performed by whole-mount or on sections of implantation sites as described (Wilkinson and Nieto, 1993), except that whole-mount conceptuses were incubated in RIPA buffer instead of proteinase K (Burdsal et al., 1993). Digoxigenin- or [35S]UTPlabeled RNA probes were made by preparing sense and antisense strand transcripts, with a kit from Boehringer Mannheim, from the 3′ end of mouse Hxt cDNA that had been cloned into pBluescript (Stratagene). Some conceptuses stained by whole-mount were embedded in ethyl methacrylate JB-4 medium (Polaron) and sectioned at 8 µm. Injection, culture and β-galactosidase staining of mouse embryos 2-cell mouse embryos obtained at day 1.5 of gestation from matings of CF-1 females and CD-1 males (Charles River) were injected using
Hxt is a bHLH regulator of trophoblast 2515 standard procedures (Hogan et al., 1986). Briefly, pβactinlacZ and either pcDNA-I or pCMVHxt (20 ng/µl each in 5 mM Tris-HCl, pH 7.2, and 0.1 mM EDTA) were injected into the nucleus of a single, randomly chosen cell. Embryos that survived injection were cultured until the blastocyst stage in TE medium (Spindle, 1980). Because development of injected embryos was not affected by pcDNA-I, compared to embryos that were injected with pβactinlacZ alone (data not shown), the data were pooled. β-galactosidase staining was done either with X-gal after fixation (Vernet et al., 1993) or in live blastocysts with a fluoresceinated substrate, Imagene Green (Molecular Probes). Culture and transfection of Rcho-1 cells Rcho-1 cells were maintained as described previously (Faria and Soares, 1991; Shida et al., 1993; Hamlin et al., 1994). For the isolation of homogeneous differentiated subpopulations of cells, trypsin-labile cells were removed from the cultures as described in the legend to Fig. 6. Differentiation of adherent cells was accelerated by switching medium from NCTC-135 (Sigma) supplemented with 20% fetal bovine serum to that supplemented with 10% horse serum. Cells were transfected by using Lipofectamine (Gibco-BRL), because this liposome was more efficient than Lipofectin, as was previously used (Shida et al., 1993). Transient transfections performed to measure promoter activities were performed as described in the Figure Legends. Reporter gene activities were normalized to control for transfection efficiency by co-transfection of pRSVβGal, and all experiments were repeated at least twice. Luciferase activity was measured using a kit from Promega. CAT enzyme activity was measured by extraction of reaction products with ethyl acetate (Sambrook et al., 1989). Stable transfectants were produced in which Id-1 was expressed under the control of a tetracycline-regulated transactivator (Gossen and Bujard, 1992). The plasmid pUHD15-1, encoding the transactivator, was co-transfected in the presence of tetracycline (1 µg/ml) to inhibit the transactivator, with vector alone or pTTOId-1 and transfectants were selected with G418 and hygromycin B. After die-off was complete, transfected cells were pooled, amplified for two passages, plated in the absence of tetracycline and analyzed as described in the legend to Fig. 6.
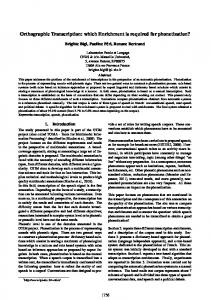
RESULTS Interaction cloning identifies bHLH factors expressed in the peri-implantation conceptus To identify bHLH factors expressed in early placental cell lineages, we used the HLH domain of E47 to screen cDNA libraries from early conceptus tissues. Approximately 600,000 plaques of an ovine elongated blastocyst cDNA library (Kramer et al., 1994) were screened. Three positive plaques were identified and the phages were found to contain identical 1.3 kb inserts, based on digestion with several restriction endonucleases. Longer clones, up to 1.8 kb (clone λ81.5), were obtained by using a 0.5 kb BamHI fragment as a probe to rescreen the original library. Analysis of ovine, mouse and human cell and tissue RNAs revealed an mRNA size of approximately 1.8 kb (see below) indicating that the longest clone was probably full-length. The cDNA insert in λ81.5 had a potential translation start site at position 220 and an open reading frame of 202 codons. The amino acid sequence was unique but was similar to that of members of the bHLH family within a 55 amino acid region that represents the bHLH domain. Based on its mRNA expression pattern (see below), the gene was called Hxt (for HLH tran-
scription factor expressed in extraembryonic mesoderm and trophoblast). Screening of a mouse embryoid body cDNA library (Robbins et al., 1990) with the E47 protein probe yielded single clones for Id-1 and Mash-1, five clones of the mouse Hxt, and two clones of a novel gene that was called Hed (for HLH transcription factor expressed in embryo and deciduum). The mouse Hxt cDNA encoded a protein of 216 amino acids (Fig. 1A). Although Hed was unique, its deduced amino acid sequence was 87% identical within the bHLH domain to that of mouse Hxt (Fig. 1B). For this reason, all probes that were used in subsequent studies represented the 3′ noncoding regions of Hxt and Hed, because probes that encompass the bHLH domain of Hxt hybridized to both Hxt and Hed.
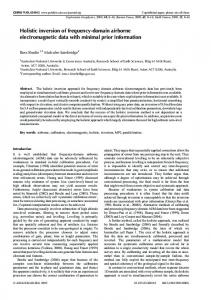
Hxt and Hed encode related bHLH factors with distinct chromosomal locations The bHLH domains of the Hxt and Hed proteins most closely resemble (43-47% amino acid identity) that of HEN1, which is expressed in the central nervous system (Brown and Baer, 1994), Scl (Begley et al., 1991) and Lyl-1 (Kuo et al., 1991) which are expressed in hematopoietic cells, and Twist (Wolf et al., 1991) and Meso1 (Blanar et al., 1995) that are expressed in developing mesoderm. Similarity to other members of the bHLH family, such as E12/47, MyoD, myogenin, c-myc and Max, is restricted to those residues that represent the bHLH consensus (Garrell and Campuzano, 1991). The chromosomal locations of the Hxt and Hed genes were determined by interspecific backcross analysis of matings of [(C57BL/6J×Mus spretus)F1 × C57BL/6J] mice (Copeland and Jenkins, 1991). The results indicated that Hxt is present on mouse chromosome 11 (Fig. 1C). The most likely gene order and the fraction of the total number of mice exhibiting recombinant chromosomes among the total number of mice analyzed are: centromere-Adra1 (8/123)-Csfgm (4/131)-Hxt (4/133)Myhs. Conversely, Hed is located in the central region of mouse chromosome 8. The most likely gene order and the ratios of the total number of mice exhibiting recombinant chromosomes to the total number of mice analyzed for each pair of loci are: centromere-Scvr (15/153)-Hed (5/154)-Lpl (0/154)Jund (6/119)-Ucp. No recombinants were detected between Lpl and Jund in 150 animals typed in common, suggesting that the two loci are within 2.0 cM of each other. Comparison of the interspecific maps of chromosomes 8 and 11 with composite linkage maps that report the locations of several uncloned mouse mutations (compiled by M. T. Davisson, T. H. Roderick, A. L. Hillyard and D. P. Doolittle and obtained from The Jackson Laboratory, Bar Harbor, ME) indicated that Hed and Hxt map to regions that lack mutations with expected phenotypes, given their expression patterns. Hxt is expressed in the placenta, whereas Hed is expressed in the deciduum and embryo proper To compare mRNA expression patterns, we prepared blots with RNA isolated from several mouse tissues. The mRNAs for Hxt and Hed were undetectable in RNA from undifferentiated embryonic stem cells but present in differentiated cells (data not shown), consistent with the cloning of Hxt and Hed from an embryoid body cDNA library. Neither Hxt nor Hed mRNAs were detected in undifferentiated F9 embryonal carcinoma cells or in F9 cells that had been treated with
2516 J. C. Cross and others A.
1 61 121 181
MNLVGRYAHH PPPTTAVAAA IPNVPADTKL LPQQPEGFPP
HHHHHSHPHH AYGPDARPSQ PKIKTLRLAT ASGPGEKRIK
PMLHEPFLFG SPGRLEALGS SYIAYLMDVL GRTGWPQKVW
PASRCHQERP YFQSWLLSPA DAAPDFPAGG RLPKRKGSGP KKERRRTESI NSAFAELREC AKDAQAGDPE GFKGELKKTD GGRESKRKRE ALELNQ
B. oHxt mHxt
RRKGSGPKKERRRTESINSAF.AELRECIPNVPADTKLSK.IKTLRLATSYIAYLMD KRKGSGPKKERRRTESINSAF.AELRECIPNVPADTKLPK.IKTLRLATSYIAYLMD
% Identity 98 100
mHed
KRRGTANRKERRRTQSINSAF.AELRECIPNVPADTKLSK.IKTLRLATSYIAYLMD
87
mHEN1A mSCL mLYL-1 mTWIST Meso1
KYRTAHATRERIRVEAFNLAF.AELRKLLPTLPPDKKLSK.IEILRLAICYISYLNH VRRIFTNSRERWRQQNYNGAF.AELRKLIPTHPPDKKLSK.NEILRLAMKYINFLAK ARRVFTNSRERWRQQHVNGAF.AELRKLLPTHPPDRKLSK.NEVLRLAMKYIGFLVR TQRVMANVRERQRTQSLNEAF.AALRKIIPTLPSDK.LSK.IQTLKLAARYIDFLYQ RQRQAANARERDRIQSVNTAFTA.LRTLIPTEPVDRKLSK.IETLRLASSYIAHLAN
47 43 43 38 45
Basic
Helix I
Helix II
retinoic acid to promote endoderm differentiation (Fig. 2A). Hxt and Hed had distinct mRNA expression patterns in mouse adult and embryonic tissues. Hed mRNA was detected as a single 2.5 kb band that was abundant in total RNA from decidual tissue, but that was detected only in poly(A)+ RNA in the adult, heart, liver and testis, and was undetectable in other tissues (Fig. 2). In situ hybridization with a Hed-specific probe failed to detect signal in either embryonic or extraembryonic tissue at day 7.5 (data not shown). However, Hed was expressed in the embryo proper at days 8, 9 and 10 (Fig. 3), although we have not localized its site of expression. In contrast, the Hxt-specific probe detected an abundant 1.8 kb transcript in total RNA from day 7.5 conceptuses that contained both embryonic and placental tissue (Fig. 2A) but failed to detect Hxt mRNA in total RNA from other tissues. In poly(A)+ RNA, however, 1.8 kb transcripts were identified in adult brain, muscle and testis (Fig. 2B). Consistent with expression in brain, we have detected Hxt mRNA in PC12 cells
Fig. 1. Sequence and chromosomal mapping of the Hxt and Hed transcription factors. (A) The complete amino acid sequence deduced from the murine Hxt cDNA is shown (the bHLH domain is underlined). (B) Aligned amino acid sequences of the bHLH domains in the ovine (o) and murine (m) Hxt proteins, murine Hed protein, and the related murine bHLH factors HEN1A, Scl, Lyl-1, Twist and Meso1. Numbers indicate the per cent amino acid identity. (C) Chromosomal locations of Hed and Hxt in the mouse genome were mapped by interspecific backcross analysis. The segregation patterns of these loci and flanking genes in backcross animals that were typed for all loci are shown above the chromosome maps. Each column represents the chromosome identified in the backcross progeny that was inherited from the (C57BL/6J × M. spretus)F1 parent. The black boxes represent the presence of a C57BL/6J allele and the white boxes represent the presence of a M. spretus allele. The number of offspring inheriting each type of chromosome is listed at the bottom of each column. Partial chromosome linkage maps showing the location of Hed and Hxt in relation to linked genes are shown. Recombination distances between loci (in cM) are shown to the left of the chromosome and the positions of loci in human chromosomes, where known, are shown to the right. References for the map positions of loci mapped in human chromosomes can be obtained from the Genome Data Base, a computerized database of human linkage information maintained by the William H. Welsh Medical Library, Johns Hopkins University (Baltimore, MD).
(data not shown). In addition, weakly hybridizing transcripts at 2.4 and 3.6 kb were detected in all samples. Their significance is unknown. To identify the site of Hxt mRNA expression during embryonic development, we separated postimplantation conceptuses (day 7.5 to 10.5) into embryonic and placental tissues. Major Hxt expression was restricted to the placenta at all stages examined, although faint signals were present in the embryo (Fig. 3A). At day 9.5, we removed the chorioallantois from the trophoblast cell-rich spongiotrophoblast layer. Hxt mRNA was abundant in trophoblast, but was not detected in the chorioallantois (data not shown). Plasmid cDNA libraries made from mouse conceptuses at preimplantation stages of development (Rothstein et al., 1992) were used in polymerase chain reaction (PCR) analyses to determine when Hxt mRNA is first expressed. Although not quantitative, the analysis indicated that Hxt mRNA is present as a maternal transcript in the egg as well as during cleavage development before blastocyst
Hxt is a bHLH regulator of trophoblast 2517 Fig. 2. Expression of Hxt and Hed mRNAs in mouse tissues. Hxt- and Hed-specific cDNA probes were used to probe total RNA (10 µg) (A) or poly(A)+ RNA (2 µg) (B) RNAs were derived from mouse tissues as indicated, or from undifferentiated F9 embryonal carcinoma cells (F9 ud) or F9 cells induced to differentiate into endodermlike cells by 4 days treatment with 10-8 M retinoic acid (F9 d). All tissues were from adult mice, except for decidual tissue and whole conceptus (embryo + placenta), which were obtained at day 7.5 of pregnancy. The Hxt mRNA appears at approximately 1.8 kb and the Hed mRNA appears at approximately 2.5 kb.
formation (Fig. 3B). Because placental structure differs widely among mammals (Cross et al., 1994), we tested whether Hxt is produced in the placenta in other species. Hxt mRNA was abundant in preimplantation bovine conceptuses (day 18) as well as in trophoblast-rich, cotyledon throughout pregnancy (Fig. 3C). Hxt mRNA was also detected in human (JEG-3 and JAR; data not shown) and rat (Rcho-1; see below) trophoblast cell lines.
Hxt is expressed in trophoblast and transiently in mesoderm of the placenta To identify the site of Hxt expression in peri-implantation conceptuses, we cultured mouse blastocysts for 3 days in serum to
promote attachment and outgrowth of trophoblast. In situ hybridization analysis localized Hxt mRNA exclusively to trophoblast cells in the outgrowth (E. Newman, and Z. W., unpublished data). We analyzed postimplantation stages of development for Hxt expression by whole-mount in situ hybridization. At day 7.5 of gestation, the Hxt antisense probe hybridized strongly to trophoblast cells in the ectoplacental cone (Fig. 4). Sections of these embryos revealed that Hxt mRNA was abundant in the more differentiated cells on the outside of the ectoplacental cone. Hybridization was not detected in chorionic ectoderm, cells that derive from polar trophectoderm (trophoblast) cells (Cross et al., 1994). Because the parietal yolk sac (including trophoblast giant cells) is tightly adherent
Fig. 3. Hxt mRNA expression in the placenta. (A) RNA blot of separated embryo and placental tissues. Total RNA (10 µg) prepared from whole day 7.5 mouse conceptus or separated embryo and placental fractions (including the ectoplacental cone, amnion and chorioallantois) from days 8.5, 9.5 and 10.5 of pregnancy was used to prepare an RNA blot that was sequentially probed with Hxt, Hed, and GAPDH probes. (B) PCR analysis for the presence of Hxt in mouse egg, 2-cell embryo and blastocyst cDNA libraries (Rothstein et al., 1992). Decreasing amounts of plasmid DNA were subjected to PCR. A Hxt-specific 220 bp product was observed when using plasmid aliquots from all libraries but not in the blank reaction. (C) RNA blot analysis of Hxt expression the placenta of ruminants. Bovine day 16, preimplantation conceptus and cotyledonary total RNA (10 µg) from days 60, 80 and 120 of gestation were probed with the ovine Hxt cDNA. Mouse embryo and ectoplacental cone tissue (day 9.5) were used a negative and positive controls, respectively.
2518 J. C. Cross and others
Fig. 4. In situ hybridization of Hxt mRNA in day 7.5 mouse conceptuses. (A-D) Whole-mount in situ hybridization was performed with antisense (A) or sense (B) strand Hxt− probes. Embryos were then sectioned (C) to highlight staining of extraembryonic mesoderm cells and trophoblast cells in the ectoplacental cone (D). Note that staining was not detected in the chorionic ectoderm (D, arrowhead) and the core of the ectoplacental cone (D, arrow). (E) In situ hybridization performed with an antisense Hxt probe on sections of implanted day 7 mouse conceptuses. Silver grains were abundant over the ectoplacental cone and trophoblast giant cells (arrows).
to the decidua, we also performed in situ hybridization on sections of day 7.5 conceptuses left within decidua. This analysis demonstrated that Hxt RNA was abundant in trophoblast giant cells in the parietal yolk sac (Fig. 4). We also observed weaker Hxt hybridization in extraembryonic mesoderm cells that form the allantois and line the amnion and chorionic ectoderm (Fig. 4). Hybridization was observed over mesoderm exclusively at the posterior end of the primitive streak. Cell lineage analysis showed that cells in this region contribute exclusively to extraembryonic structures (Lawson et al., 1991). In contrast to trophoblast, expression of Hxt in extraembryonic mesoderm was transient; Hxt transcripts were not detected in the chorioallantois at day 9.5 either by in situ hybridization or by RNA blot analysis (data not shown). Hxtspecific hybridization was not detected in the embryo either at day 7.5 (Fig. 4) or at day 9 by whole mount (data not shown), consistent with RNA blot analysis (Fig. 3A).
Hxt limits differentiation of blastomeres to trophectoderm in preimplantation mouse embryos Since Hxt expression was abundant in trophoblast, we tested whether Hxt could induce uncommitted cells into the trophoblast lineage. Embryonic stem cells were transfected with a Hxt expression vector (pCMVHxt) but they grew extremely slowly and could not be cloned (data not shown). This suggested that Hxt overexpression arrested the growth of embryonic stem cells. Because Hxt is expressed during cleavage-stage development, albeit at low levels, and is down-
regulated in the ICM after blastocyst formation, we tested whether continuous expression of Hxt would limit differentiation of blastomeres. A Hxt expression plasmid was coinjected with a construct containing the β-actin promoter fused to the lacZ gene into the nucleus of a single cell in mouse 2cell embryos. The developmental fate of the injected cell was followed by histochemical staining. Embryos cultured to form blastocyst outgrowths were found to no longer express β-galactosidase activity and, therefore, embryos were assessed at the blastocyst stage. Cells injected with a control vector contributed equally to ICM and trophectoderm in blastocysts (Fig. 5; Table 1), as expected. In contrast, cells injected with the Hxt expression vector were biased towards the trophectoderm (Fig. 5; Table 1). In several cases, these cells were larger than normal, suggesting that they had differentiated earlier during cleavage stage development, or that their division rate was slower than that of their uninjected cousins. Consistent with these possibilities, Hxt-injected blastocysts had significantly fewer cells than those injected with control vector (Table 1). These large cells had intact nuclei based on DNA staining (data not shown) and were considered trophoblast based on their flattened morphology and integration into the trophoblast layer. In contrast, non-viable cells are excluded from the blastocyst during development. Hxt-injected embryos also formed significantly more trophoblastic vesicles which resembled blastocysts but lacked an ICM (based on nuclear staining). Such structures can form by premature differentiation or removal of cells, resulting in an embryo in which all of the blastomeres
Hxt is a bHLH regulator of trophoblast 2519 Table 1. Distribution of cells between the ICM and trophectoderm at the blastocyst stage after injection with control or Hxt-expression vector % of embryos pcDNA-I
pCMVHxt
(A) Blastocysts ICM ICM + trophectoderm Trophectoderm
17 42 12
0 3 28
(B) Trophoblastic vesicles Trophectoderm
29
69
n=
24
29
*A single blastomere in 2-cell embryos was co-injected with pβactinlacZ and control or Hxt-expression plasmid. 50-70 embryos were injected per group. Embryos that developed into blastocyst structures were stained for βgalactosidase activity and the location of positive cells was noted. Cell numbers were assessed by staining nuclei with Hoechst 33258 and were significantly lower (P