Int. J. Mol. Sci. 2012, 13, 12925-12938; doi:10.3390/ijms131012925
International Journal of OPEN ACCESS
Molecular Sciences
ISSN 1422-0067 www.mdpi.com/journal/ijms Article
Hyaluronan Synthase and Hyaluronidase Expression in Serous Ovarian Carcinoma is Related to Anatomic Site and Chemotherapy Exposure Ilana Weiss 1, Claes G. Trope 1,2,3, Reuven Reich 1,* and Ben Davidson 3,4,* 1
2
3
4
Institute of Drug Research, School of Pharmacy, Faculty of Medicine, The Hebrew University of Jerusalem, Jerusalem 91120, Israel; E-Mails:
[email protected] (I.W.);
[email protected] (C.G.T.) Department of Gynecologic Oncology, Oslo University Hospital, Norwegian Radium Hospital, Oslo N-310, Norway Division of Pathology, Oslo University Hospital, Norwegian Radium Hospital, Oslo N-0424, Norway Institute of Clinical Medicine, Faculty of Medicine, University of Oslo, Oslo N-0424, Norway
* Authors to whom correspondence should be addressed; E-Mails:
[email protected] (R.R.);
[email protected] (B.D.); Tel.: +47-2293-4871; Fax: +47-2250-8554. Received: 3 August 2012; in revised form: 19 September 2012 / Accepted: 29 September 2012 / Published: 10 October 2012
Abstract: The present study investigated the expression and clinical role of hyaluronan synthases (HAS1-3) and hyaluronidases (Hyal1-3) in serous ovarian carcinoma. HAS and HYAL mRNA expression was analyzed in 97 tumors (61 effusions, 27 primary carcinomas, 9 solid metastases) using PCR and further studied for association with clinicopathologic parameters, including survival. HAS1 mRNA was overexpressed in effusions compared to primary carcinomas and solid metastases (p < 0.001), and an alternatively spliced HAS1 was expressed only in effusions. HAS2 mRNA was overexpressed in solid metastases and primary carcinomas compared to effusions (p = 0.043), and HAS3 mRNA was overexpressed in primary carcinomas and effusions compared to solid metastases (p = 0.008). HYAL1 mRNA was absent in all specimens, whereas HYAL2 was expressed as two splice variants, of which HYAL2-var2 was overexpressed in solid metastases compared to effusions and primary carcinomas (p < 0.001). HYAL3 mRNA was expressed as wild-type and variant 1-3 form, the latter more highly in primary carcinomas and effusions compared to solid metastases (p = 0.006). HAS1 mRNA was overexpressed in
Int. J. Mol. Sci. 2012, 13
12926
pre- compared to post-chemotherapy effusions (p < 0.001), with opposite finding for HYAL2-var1 and HYAL3-WT (p = 0.016 and p = 0.024, respectively). Higher HYAL2-var1 and HAS1 splice variant mRNA expression in effusions was associated with longer (p = 0.033) and shorter (p = 0.047) overall survival, respectively. These data are the first to document a role for HAS and Hyal members in tumor progression in ovarian carcinoma, as evidenced by their differential expression as function of anatomic site and chemotherapy exposure, with a possible prognostic role for patients with malignant effusions. Keywords: hyaluronan synthase; hyaluronidase; ovarian carcinoma; tumor progression; effusions; survival
1. Introduction Ovarian carcinoma (OC) is the most lethal gynecologic malignancy. The majority of patients are diagnosed with advanced-stage disease and despite aggressive surgery and adjuvant platinum-based combination therapy, succumb to their disease, primarily due to chemotherapy resistance [1,2]. Despite the obvious role of FIGO stage, tumor grade, residual disease (RD) volume after surgery and the presence of ascites in providing prognostic information in OC, these factors fail to predict clinical outcome for individual patients owing to a significant degree of tumor heterogeneity. Widely accepted biological factors that are able to predict chemoresponse and survival in OC are unavailable to date, a fact that in part reflects our limited understanding of metastatic OC, the cause of death for most patients. The extracellular matrix (ECM) is a critical environmental determinant of tumor cell behavior. The matrix serves as a scaffold for the tumor cells to adhere, migrate and proliferate in response to the reservoir of growth factors and cytokines stored in it. Hyaluronan (also termed hyaluronic acid or hyaluronate; HA) is a prominent component of the ECM in many tissues, particularly in rapidly remodeling ones. Hyaluronan is a very large, linear, negatively-charged polysaccharide, which is composed of repeating non-sulphated disaccharides of glucuronate and N-acetylglucosamine and exists as a high molecular weight polymer of approximately 104–107 Da. Its strong negative charge attracts a large associated volume of water capable of expansion up to 10,000 times its actual polymer volume. HA functions in normal physiology by maintaining tissue hydration and osmotic balance in tissues, and additionally regulates cell adhesion, migration, apoptosis and proliferation via interaction with specific cell surface receptors. In addition to its role in embryogenesis, there is increasing evidence for the involvement of HA in tumor progression of multiple cancers, through its effect on proliferation, apoptosis, angiogenesis, migration and invasion, as well as promotion of epithelial-to-mesenchymal transition (EMT) [3,4]. Multiple studies have documented the role of HA and its receptor CD44 in the binding of OC cells to mesothelial cells, a critical event in OC dissemination in the abdomen, and its role in tumor progression and in determining prognosis in this cancer [5]. The biosynthesis of HA is regulated by three HA synthase isozymes, HAS1-3. There is a 50%–70% amino acid sequence identity between the different genes. However, they differ in their enzymatic activities. HAS1 and HAS2 synthesize HA molecules with high molecular weight, whereas HAS3 is
Int. J. Mol. Sci. 2012, 13
12927
produces low molecular weight molecules. HAS2 is the most commonly expressed family member in normal mammalian tissues, whereas HAS3 is the predominant enzyme in pathological conditions, such as inflammation and cancer [6]. HA degradation is induced by a family of six hyaluronidases, consisting of Hyal1, Hyal2, Hyal3, Hyal4, PH-20/PSAM1 and the pseudogene HyalP1 [7]. Of these, Hyal1 and Hyal2 are the most widely distributed and best characterized. The major transcript of Hyal3 does not possess enzymatic activity by itself and may merely have a supportive role in Hyal1 expression [8]. Despite the wealth of literature regarding HA and CD44 expression in OC, little is known regarding the expression and clinical role of HA-synthesizing and HA-metabolizing enzymes in OC. Hyaluronidase activity was reported to be high in malignant ovarian tumors compared to their endometrial and cervical counterparts [9]. However, hyaluronidase activity was lower in OC compared to benign and borderline tumors of the ovary in another study [10]. In a study of HAS1-3 expression in 33 primary OC, HAS1 expression was reported to be associated with shorter overall survival (OS) [11]. In the only study in which both HAS and Hyal members were investigated, analysis of 39 ovary specimens, including 20 serous OC, demonstrated expression of HAS2 and HAS3 mRNA, with low or undetectable HAS1, and HAS mRNA levels were not significantly related to HAS protein or hyaluronan accumulation. HYAL1 mRNA level was lower in grade 3 OC compared to normal ovaries and correlated with the enzymatic activity of tissue hyaluronidases, and inversely with HA staining intensity, with no such association for HYAL2 [8]. Only one of the above studies analyzed metastatic OC specimens, and none included effusion specimens. Metastatic OC, particularly effusions, have different expression of cancer-associated molecules at the mRNA and protein level [12]. OC of different histology is additionally increasingly regarded to represent different diseases with a unique biology and expression profile [13,14]. In view of these observations, the present study focused on the expression and clinical role of the various HAS and Hyal enzymes and their splice variants in serous OC effusions, and compared these expression pattern with solid primary and metastatic serous OC specimens. 2. Results 2.1. HAS and HYAL Expression is Significantly Different at Various Anatomic Sites in OC HAS1 mRNA was detected in 47/61 (77%) effusions, 8/27 (30%) primary OC and 4/9 (44%) solid metastases, with a comparative analysis of expression levels showing significantly higher expression in effusions compared to the two other anatomic sites (p < 0.001) (Figures 1 and 2). We additionally observed that HAS1 is alternatively spliced in tumor cells derived from effusions, but not in solid specimens. The splice variant has a deletion at exon 4, and was found in 22 effusions (Figure 1). HAS2 mRNA was found in 30/61 (49%) effusions, 18/27 (67%) primary OC and 5/9 (56%) solid metastases, with expression levels being moderately higher in solid metastases and primary OC compared to effusions (p = 0.043) (Figures 1 and 2). HAS3 mRNA was detected in 61/61 (100%) effusions, 26/27 (96%) primary OC and 8/9 (89%) solid metastases, with a comparative analysis of expression levels showing significantly higher expression in primary OC and effusions compared to solid metastases (p = 0.008) (Figures 1 and 2).
Int. J. Mol. Sci. 2012, 13
12928
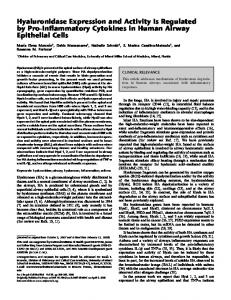
HYAL1 mRNA was not detected in any of the specimens analyzed, irrespective of the anatomic site (Figure S1). HYAL2 is alternatively spliced and has two variants. The two variants produce similar protein products but differ in the first exon. HYAL2-var1 was found in all specimens except for 3 effusions, with comparable levels at the 3 anatomic sites (p = 0.44). In contrast, HYAL2-var2 was detected in 14/51 (27%) effusions, 4/25 (16%) primary OC and 9/9 (100%) solid metastases, with significantly higher expression in solid metastases compared to effusions and primary carcinomas (p < 0.001) (Figures 1 and 2). HYAL3 is also alternatively spliced and has 4 variants. However, only the wild-type (WT) form encodes for an active protein [15]. Due to the unique structure of the gene, we could not generate probes that selectively recognize the four variants. Our primers recognized the WT form and var1-3 collectively. Both HYAL forms were found in all specimens at the 3 anatomic sites. However, expression levels were higher in primary carcinomas and effusions compared to solid metastases, this difference being a trend for HYAL3-WT (p = 0.099) and significant for HYAL3-var1-3 (p = 0.006) (Figures 1 and 2). Figure 1. Hyaluronan synthases (HAS) and hyaluronidases (HYAL) mRNA in serous ovarian carcinoma: Examples of HAS and HYAL mRNA expression in effusions, primary carcinomas and solid metastases from patients with serous ovarian carcinoma. The 28S RNA served as control. HYAL2 levels were analyzed using quantitative PCR (qPCR), but a gel was nevertheless run in addition, in order to be able to visually present all enzymes similarly.
Int. J. Mol. Sci. 2012, 13
12929
Figure 2. Anatomic site-related differences in HAS and HYAL mRNA expression. Graphic illustration of the differences in HAS1-3 and HYAL2 mRNA expression between ovarian carcinoma effusions, primary ovarian carcinomas and solid metastases. HAS1 mRNA expression is significantly higher expression in effusions compared to the two other anatomic sites (p < 0.001); HAS2 mRNA levels are higher in solid metastases and primary carcinomas compared to effusions (p = 0.043); HAS3 mRNA expression levels are significantly higher in primary carcinomas and effusions compared to solid metastases (p = 0.008); HYAL2-var1 expression is comparable in effusions, primary carcinomas and solid metastases (p = 0.44); HYAL2-var2 expression is significantly higher in solid metastases compared to effusions and primary carcinomas (p < 0.001); HYAL3-WT expression is higher in primary carcinomas and effusions compared to solid metastases, though not significantly (p = 0.094). HYAL3-var1-3 expression is significantly higher in primary carcinomas and effusions compared to solid metastases (p = 0.006). The bars on the Y-axis represent arbitrary units.
Int. J. Mol. Sci. 2012, 13
12930
2.2. HAS and HYAL Expression Is Significantly Related to Clinicopathologic Parameters in OC Effusions Clinicopathologic data of effusion cohort are detailed in Table 1. HAS and HYAL expression in effusions was studied for potential correlation with clinicopathologic parameters. The main differences observed were related to chemotherapy exposure. HAS1 mRNA levels were significantly higher in pre-compared to post-chemotherapy effusions (p < 0.001), and the same difference was observed for its splice variant (p = 0.022). In contrast, HYAL2-var1 and HYAL3-WT levels were higher in post-chemotherapy effusions (p = 0.016 and p = 0.024, respectively). The differences in HAS1 expression was significantly related to previous exposure to platinum (p < 0.001), whereas both HAS1 and HYAL3-WT levels were related to exposure to paclitaxel (p = 0.003 and p = 0.005, respectively). HAS and HYAL expression was unrelated to effusion site, patient age, FIGO stage, RD volume or response to chemotherapy at diagnosis (p > 0.05). Data are summarized in Table 2. Table 1. Clinicopathologic data of the effusion cohort (56 patients). Age FIGO stage Grade
Residual disease Chemotherapy status c Chemotherapy response at diagnosis
Parameter Mean (range) III IV Low High NA a ≤1 cm >1 cm NA b Pre-chemotherapy Post-chemotherapy Complete Non-complete d Other e
Number of patients 61 (38–79) 28 28 4 46 6 20 28 8 30 31 33 16 7
a
NA means not available, including effusions from inoperable patients where biopsy was too small for grading or patients were operated on in other hospitals, for which the primary tumor could not be accessed for assessment of grade; b NA means not available, including patients operated on in other hospitals and patients with no record; c For 61 effusions; d Partial response, stable disease or progression; e Allergic or adverse reaction or non-measurable response.
The follow-up period for the 56 OC patients with effusions ranged from 2 to 81 months (mean = 36 months, median = 33 months). PFS ranged from 0 to 40 months (mean = 8 months, median = 6 months), with 12 patients never achieving a disease-free period. At the last follow-up, all patients had died of the disease. In survival analysis of the entire cohort, higher HYAL2-var1 mRNA expression was associated with longer OS (p = 0.033; Figure 3A), whereas higher HAS1 splice variant expression was significantly related to shorter OS (p = 0.047; Figure 3B). The survival analyses without significant associations are presented in Supplementary Figure 2. None of the studied molecules was significantly related to PFS.
Int. J. Mol. Sci. 2012, 13
12931
Table 2. The association between clinicopathologic data of the effusion cohort and HAS/HYAL expression (p-value). Clinical Parameter Effusion site Age FIGO stage RD volume Chemoresponse Previous chemotherapy Previous platinum Previous paclitaxel
HAS1 0.4 0.71 0.06 0.78 0.99 50% tumor component and absence of necrosis. H&E-stained sections were reviewed by a gynecological pathologist (BD) to establish tumor type and histological grade. 4.2. RT-PCR Analysis Total RNA was extracted using a commercial kit (Tri Reagent; Sigma-Aldrich, St. Louis, MO, USA), and 0.5 μg total RNA were reverse-transcribed using M-MLV Reverse Transcriptase (Promega, Madison, WI, USA) with incubation for 2 h at 37 °C, followed by 5 min at 95 °C, and diluted to 1:5 with RNase-free water. The RT-PCR analysis was performed on cDNA samples on a DNA thermal cycler (Eppendorf Mastercycler gradient; Eppendorf, Hamburg, Germany) using primer sets detecting HAS and HYAL transcripts and 28S ribosomal RNA. Primer sequences and cycle parameters are detailed in Tables 3 and 4, respectively. RNA from HT-1080 fibrosarcoma cells served as control. Table 3. Primers for RT-PCR. mRNA HAS1 HAS2 HAS3 HYAL1 wt + variant 1-4 HYAL1 variant 5 HYAL3 28S
Primers Sense: 5'-GAGGCCTGGTACAACCAGAA-3' Antisense: 5'-GCAGAGGGACGTAGTTAGCG-3' Sense: 5'-AAGGCTAACCTACCCTGGGA-3' Antisense: 5'-AATGCACTGAACACACCCAA-3' Sense: 5'-GACGACAGCCCTGCGTGT-3' Antisense: 5'-TTGAGGTCAGGGAAGGAGAT-3' Sense: 5'-GGTCAGGAAATTTGGAGGAT-3' Antisense: 5'-ACAGGGCTTGACTGCAGAGA-3' Sense: 5'-GTGGACAAAGAACACTCCCT-3' Antisense: 5'-ACAGGGCTTGACTGCAGAGA-3' Sense: 5'-ACACACCGGAGATCTGGGAG-3' Antisense: 5'-CTGGTCACATTGATCACATA-3' Sense: 5'-GTTCACCCACTAATAGGGAACGTGA-3' Antisense: 5'-GGATTCTGACTTAGAGGCGTTCAGT-3'
Product size (bp) 551 523 342 1154 1210 100 + 200 212
Int. J. Mol. Sci. 2012, 13
12935
Products were separated on 1.5% agarose gels, isolated using the Invisorb Spin DNA extraction kit (Invitek GmbH, Berlin, Germany) and sequenced. Gels were photographed by the KODAK EDAS 290 system. Densitometer analysis of films was performed using a computerized image analysis (NIH IMAGE 1.63) program. mRNA levels were established by calculating the target molecule/28S ratio (all cases scored for band intensity compared to control). Expression intensity of ≤5% of control levels was interpreted as negative. Measurements were made at the linear phase of the reaction. Table 4. RT-PCR conditions. Gene HAS1 HAS2 HAS3 HYAL1 HYAL3 28S
Heating 94 °C-5 min 94 °C-5 min 94 °C-5 min 94 °C-5 min 94 °C-5 min 94 °C-5 min
Denaturation 94 °C-15 s 94 °C-15 s 94 °C-15 s 94 °C-15 s 94 °C-15 s 94 °C-15 s
Annealing 62 °C-30 s 60 °C-30 s 58 °C-30 s 59 °C-30 s 55.7 °C-30 s 63 °C-20 s
Extension 72 °C-20 s 72 °C-20 s 72 °C-20 s 72 °C-40 s 72 °C-20 s 72 °C-10 s
Cycles 35 32 35 40 33 16
4.3. Quantitative PCR (qPCR) mRNA levels of HYAL2, 28S and the reference gene RPLPO were analyzed in 84 specimens (52 effusions, 25 primary OC, 7 solid metastases) by qRT-PCR. cDNA was amplified by qPCR in 18 µL reactions using the DyNAmo™ SYBR® Green qPCR Kit with ROX™ passive reference dye (Finnzymes Oy, Espoo, Finland), with 200 nM of sense and antisense primers. The cycling program was according to the manufacturer’s instructions. The reaction was performed on the Mx3000P® QPCR System (Stratagene). Oligonucleotide primers were designed by the Primer Express program (Applied Biosystems, Foster City, CA, USA). Primer sequence and assay conditions are detailed in Tables 5 and 6, respectively. Table 5. Primers for quantitative PCR (qPCR). mRNA HYAL2 var1 HYAL2 var2 28S RPLPO
Primers Sense: 5'-GGACTCCCACACAGTTCCTG-3' Antisense: 5'-GTGAAGATGGGTGGTGCTGT-3' Sense: 5'-GCGCGAGTTCCTGAGCTG-3' Antisense: 5'-CAGTGAAGATGGGTGGTGCT-3' Sense: 5'-GTTCACCCACTAATAGGGAACGTGA-3' Antisense: 5'-GGATTCTGACTTAGAGGCGTTCAGT-3' Sense: 5'-CCAACTACTTCCTTAAGATCATCCAACTA-3' Antisense: 5'-ACATGCGGATCTGCTGCA-3'
Product size (bp) 157 154 212 108
Table 6. qPCR conditions. Gene HYAL2 28S RPLPO
Heating 95 °C-7 min 95 °C-7 min 95 °C-7 min
Denaturation 95 °C-30 s 95 °C-30 s 95 °C-30 s
Annealing 63 °C-1 min 60 °C-1 min 60 °C-1 min
Extension 72 °C-30 s 72 °C-30 s 72 °C-30 s
Cycles 40 40 40
Int. J. Mol. Sci. 2012, 13
12936
4.4. Statistical Analysis Data were analyzed using the SPSS-PC package, version 18.0 (Chicago, IL, USA). Comparative analysis of HAS and HYAL mRNA expression level in effusions, primary carcinomas and solid metastases were performed using the Kruskal-Wallis H test. Analyses of the association between expression levels and clinicopathologic parameters for patients with effusions were performed using the Mann-Whitney U test. For this analysis, clinicopathologic parameters were grouped as follows: Age: ≤60 vs. >60 years; effusion site: peritoneal vs. pleural; FIGO stage: III vs. IV; chemotherapy status: pre- vs. post-chemotherapy specimens; RD volume (≤1 cm vs. >1 cm); response to chemotherapy for primary disease and for disease recurrence: complete vs. partial response/stable disease/progression. Histological grade was not included in these analyses as the majority of patients had high-grade tumors. Progression-free survival (PFS) and OS were calculated from the date of the last chemotherapy treatment/diagnosis to the date of recurrence/death or last follow-up, respectively. Univariate survival analyses of PFS and OS were executed using the Kaplan-Meier method and log-rank test. Expression categories in survival analyses were clustered as higher vs. lower than median expression. Multivariate analysis of OS was performed using the Cox proportional hazard model (Method = Enter). 5. Conclusion We present the first comprehensive characterization of HAS and Hyal members in metastatic OC, as well as the first study investigating the association between these molecules and chemotherapy exposure in clinical OC. Our data suggest altered expression of enzymes from both families as a function of the anatomic site and previous exposure to chemotherapy, as well as opposing prognostic roles in effusion specimens. The association of HAS1 with more aggressive disease suggests that targeting HA synthesis in OC may be a relevant therapeutic approach. Acknowledgements This work was supported by the Inger and John Fredriksen Foundation for Ovarian Cancer Research and the Norwegian Cancer Society. References 1. 2. 3. 4.
5.
Agarwal, R.; Kaye, S.B. Ovarian cancer: Strategies for overcoming resistance to chemotherapy. Nat. Rev. Cancer 2003, 3, 502–516. Hennessy, B.T.; Coleman, R.L.; Markman, M. Ovarian cancer. Lancet 2009, 374, 1371–1382. Sironen, R.K.; Tammi, M.; Tammi, R.; Auvinen, P.K.; Anttila, M.; Kosma, V.-M. Hyaluronan in human malignancies. Exp. Cell Res. 2011, 317, 383–391. Takahashi, E.; Nagano, O.; Ishimoto, T.; Yae, T.; Suzuki, Y.; Shinoda, T.; Nakamura, S.; Niwa, S.; Ikeda, S.; Koga, H.; Tanihara, H.; Saya, H. Tumor necrosis factor-alpha regulates transforming growth factor-beta-dependent epithelial-mesenchymal transition by promoting hyaluronan-CD44-moesin interaction. J. Biol. Chem. 2010, 285, 4060–4073. Ween, M.P.; Oehler M.K.; Ricciardelli, C. Role of Versican, Hyaluronan and CD44 in Ovarian Cancer Metastasis. Int. J. Mol. Sci. 2011, 12, 1009–1029.
Int. J. Mol. Sci. 2012, 13 6.
7. 8.
9.
10.
11. 12. 13.
14. 15. 16.
17.
18.
19.
12937
Tammi, R.H.; Passi, A.G.; Rilla, K.; Karousou, E.; Vigetti, D.; Makkonen, K.; Tammi, M.I. Transcriptional and post-translational regulation of hyaluronan synthesis. FEBS J. 2011, 278, 1419–1428. Csoka, A.B.; Frost, G.I.; Stern, R. The six hyaluronidase-like genes in the human and mouse genomes. Matrix Biol. 2001, 20, 499–508. Nykopp, T.K.; Rilla, K.; Sironen, R.; Tammi, M.I.; Tammi, R.H.; Hämäläinen, K.; Heikkinen, A.M.; Komulainen, M.; Kosma, V.M.; Anttila, M. Expression of hyaluronan synthases (HAS1-3) and hyaluronidases (HYAL1-2) in serous ovarian carcinomas: Inverse correlation between HYAL1 and hyaluronan content. BMC Cancer 2009, 9, 143. Tamakoshi, K.; Kikkawa, F.; Maeda, O.; Suganuma, N.; Yamagata, S.; Yamagata, T.; Tomoda, Y. Hyaluronidase activity in gynaecological cancer tissues with different metastatic forms. Br. J. Cancer 1997, 75, 1807–1811. Hiltunen, E.L.; Anttila, M.; Kultti, A.; Ropponen, K.; Penttinen, J.; Yliskoski, M.; Kuronen, A.T.; Juhola, M.; Tammi, R.; Tammi, M.; Kosma, V.M. Elevated hyaluronan concentration without hyaluronidase activation in malignant epithelial ovarian tumors. Cancer Res. 2002, 62, 6410–6413. Yabushita, H.; Noguchi, M.; Kishida, T.; Fusano, K.; Noguchi, Y.; Itano, N.; Kimata, K.; Noguchi, M. Hyaluronan synthase expression in ovarian cancer. Oncol. Rep. 2004, 12, 739–743. Davidson, B. Biological characteristics of cancers involving the serosal cavities. Crit. Rev. Oncog. 2007, 13, 189–227. Köbel, M.; Kalloger, S.E.; Boyd, N.; McKinney, S.; Mehl, E.; Palmer, C.; Leung, S.; Bowen, N.J.; Ionescu, D.N.; Rajput, A.; et al. Ovarian carcinoma subtypes are different diseases: Implications for biomarker studies. PLoS Med. 2008, 5, e232. Prat, J. Ovarian carcinomas: Five distinct diseases with different origins, genetic alterations, and clinicopathological features. Virchows Arch. 2012, 460, 237–249. Lokeshwar, V.B.; Schroeder, G.L.; Carey, R.I.; Soloway, M.S.; Iida, N. Regulation of hyaluronidase activity by alternative mRNA splicing. J. Biol. Chem. 2002, 277, 33654–33663. Slomiany, M.G.; Dai, L.; Tolliver, L.B.; Grass, G.D.; Zeng, Y.; Toole, B.P. Inhibition of Functional Hyaluronan-CD44 Interactions in CD133-positive Primary Human Ovarian Carcinoma Cells by Small Hyaluronan Oligosaccharides. Clin. Cancer Res. 2009, 15, 7593–7601. Auzenne, E.; Ghosh, S.C.; Khodadadian, M.; Rivera, B.; Farquhar, D.; Price, R.E.; Ravoori, M.; Kundra, V.; Freedman, R.S.; Klostergaard, J. Hyaluronic acid-paclitaxel: Antitumor efficacy against CD44(+) human ovarian carcinoma xenografts. Neoplasia 2007, 9, 479–486. Banzato, A.; Bobisse, S.; Rondina, M.; Renier, D.; Bettella, F.; Esposito, G.; Quintieri, L.; Meléndez-Alafort, L.; Mazzi, U.; Zanovello, P.; Rosato, A. A paclitaxel-hyaluronan bioconjugate targeting ovarian cancer affords a potent in vivo therapeutic activity. Clin. Cancer Res. 2008, 14, 3598–3606. De Stefano, I.; Battaglia A.; Zannoni, G.F.; Prisco, M.G.; Fattorossi, A.; Travaglia, D.; Baroni, S.; Renier, D.; Scambia, G.; Ferlini, C.; Gallo, D. Hyaluronic acid-paclitaxel: Effects of intraperitoneal administration against CD44(+) human ovarian cancer xenografts. Cancer Chemother. Pharmacol. 2011, 68, 107–116.
Int. J. Mol. Sci. 2012, 13
12938
20. Anttila, M.A.; Tammi, R.H.; Tammi, M.I.; Syrjänen, K.J.; Saarikoski, S.V.; Kosma, V.M. High levels of stromal hyaluronan predict poor disease outcome in epithelial ovarian cancer. Cancer Res. 2000, 60, 150–155. © 2012 by the authors; licensee MDPI, Basel, Switzerland. This article is an open access article distributed under the terms and conditions of the Creative Commons Attribution license (http://creativecommons.org/licenses/by/3.0/).