and Atkinson, 2008; Campbell and Bozorgnia, 2008; Chiou and Youngs ...... Walter Silva, and Kenneth Campbell for their comments, suggestions, and helpful ...
Bulletin of the Seismological Society of America, Vol. 101, No. 4, pp. 1859–1870, August 2011, doi: 10.1785/0120100144
Hybrid Empirical Ground-Motion Prediction Equations for Eastern North America Using NGA Models and Updated Seismological Parameters by Shahram Pezeshk, Arash Zandieh, and Behrooz Tavakoli
Abstract
In the field of earthquake engineering, ground-motion prediction models are frequently used to estimate the peak ground acceleration (PGA) and the pseudospectral acceleration (PSA). In regions of the world where ground-motion recordings are plentiful, such as western North America (WNA), the ground-motion prediction equations are obtained using empirical methods. In other regions, such as eastern North America (ENA), with insufficient ground-motion data, alternative methods must be used to develop ground-motion prediction equations (GMPEs). The hybrid empirical method is one such method used to develop ground-motion prediction equations in areas with sparse ground motions. This method employs the stochastic simulation method to adjust empirical GMPEs developed for a region with abundant strongmotion recordings in order to estimate strong-motion parameters in a region with a sparse database. The adjustments take into account differences in the earthquake source, wave propagation, and site-response characteristics between the two regions. In this study, a hybrid empirical method is used to develop a new GMPE for ENA, using five new ground-motion prediction models developed by the Pacific Earthquake Engineering Research Center (PEER) for WNA. A new ENA GMPE is derived for a magnitude range of 5 to 8 and closest distances to the fault rupture up to 1000 km. Ground-motion prediction equations are developed for the response spectra (pseudoacceleration, 5% damped) and the PGA for hard-rock sites in ENA. The resulting ground-motion prediction model developed in this study is compared with two ENA ground-motion models used in the 2008 national seismic hazard maps as well as with available observed data for ENA.
Introduction The near-source amplitudes and attenuation of groundmotion amplitudes in engineering applications is of great significance. For seismic hazard applications, ground motions are often estimated using mathematical equations, which are called ground-motion prediction equations (GMPEs). These equations relate the ground-motion parameters (the most commonly used are the peak ground acceleration, PGA, and the pseudospectral acceleration, PSA) to seismological parameters of a specific region such as earthquake magnitude, source-to-site distance, local site conditions, and style of faulting. In areas of the world such as western North America (WNA), where ground-motion recordings are plentiful due to highly active seismicity and a dense instrumental recording network, the GMPEs are obtained using empirical methods. An example is the Next Generation Attenuation (NGA) project by the Pacific Earthquake Engineering Research Center (PEER) (Power et al., 2008). In the NGA project, five different ground-motion models are developed for WNA (Abrahamson and Silva, 2008; Boore
and Atkinson, 2008; Campbell and Bozorgnia, 2008; Chiou and Youngs, 2008; Idriss, 2008). For regions with historical or observed seismicity but insufficient strong ground-motion data, GMPEs cannot be developed using empirical methods. An example of such a region is eastern North America (ENA), which is considered a stable continental region with abundant ground-motion data of moderate and small events but sparse data in the magnitude-distance range of most engineering interest. In areas such as ENA, stochastic simulation methods can be used to estimate strong ground motions for the distance and magnitude range of interest. These estimations can then be used to develop a GMPE using the same approach that is used for actual ground-motion data. In this approach, a stochastic representation of the ground motion is developed using seismological models of the source spectrum and the propagation path (McGuire and Hanks, 1980; Hanks and McGuire, 1981; Boore 1983, 2003). Examples of using the stochastic method to develop GMPEs in ENA are Atkinson and Boore
1859
1860 (1995), Frankel et al. (1996), Toro et al. (1997), and Atkinson and Boore (1998, 2006). Ground-motion prediction equations based on actual data are often well constrained, depending on the richness of the database, and represent the inherent characteristics of ground motions especially in the near-source regions. On the other hand, GMPEs obtained from stochastic models may lack realistic near-source characteristics, especially the magnitude saturation. This happens because the stochastic point-source model is not constrained to represent nearsource characteristics of actual ground motions. This issue in the stochastic point-source model is improved through the stochastic double-corner model (Atkinson and Boore, 1995; Atkinson and Silva, 1997; Atkinson and Boore, 1998) and the more complicated finite-fault models (Beresnev and Atkinson, 1999, 2002; Motazedian and Atkinson, 2005; Atkinson and Boore, 2006). The hybrid empirical method (Campbell, 2000, 2003) is another procedure to develop GMPEs in areas with sparse ground motions. This method uses the stochastic simulation method to adjust empirical GMPEs developed for the host region, which in this study is WNA. The method is then used to estimate synthetic strong ground-motion parameters in the target region, which in this study is ENA (where there are a limited number of strong-motion recordings). These adjustments take into account the differences in the earthquake source, wave propagation, and site-response characteristics between the two regions. The hybrid empirical method is used by several authors to develop GMPEs in ENA (Campbell, 2003; Tavakoli and Pezeshk, 2005; Campbell, 2007, 2008). The hybrid empirical method has also been used for central Europe (Scherbaum et al., 2005), southern Spain, and southern Norway (Douglas et al., 2006). Campbell (2003) proposed a hybrid empirical method based on a point-source stochastic model using four empirical GMPEs for WNA. Campbell (2007) updated this hybrid empirical ground-motion model using the new WNA empirical ground-motion prediction model by Campbell and Bozorgnia (2008) in the NGA project. He used a stress drop of 140 bars for ENA point-source stochastic simulations and developed GMPEs for sites with the National Earthquake Hazard Reduction Program (NEHRP) B/C site condition (V S30 � 760 m=s). Campbell (2008) used a stress drop of 280 bars in stochastic simulations of ENA ground motions to obtain a better agreement with the Atkinson and Boore (2006) finite-source simulations, and derived revised hybrid empirical ground-motion estimations in ENA. The Campbell (2008) ground motions are determined for a NEHRP A site condition (V S30 ≥ 2000 m=s) in ENA using the empirical amplification factors used in Atkinson and Boore (2006). Tavakoli and Pezeshk (2005) proposed a hybrid empirical model for ENA using a magnitude-dependent stress parameter in the WNA stochastic simulations. They used a generic source function as a combination of single-corner and double-corner source models. Furthermore, they used the modified distance based on the Atkinson and Silva (2000) effective depth in the
S. Pezeshk, A. Zandieh, and B. Tavakoli
point-source stochastic simulations to mimic the finite-fault effects. The purpose of this study is to update the Tavakoli and Pezeshk (2005) model to develop a new hybrid empirical GMPE for ENA using five new ground-motion prediction models developed by the PEER center (Power et al., 2008) for WNA (Abrahamson and Silva, 2008; Boore and Atkinson, 2008; Campbell and Bozorgnia, 2008; Chiou and Youngs, 2008; Idriss, 2008). Furthermore, recent new information on ENA seismological parameters such as stress parameter, geometric spreading, anelastic attenuation, and site-response term are used to update the GMPE. In this study, the stochastic point-source model is used for both WNA and ENA regions to obtain ground motions at different magnitudedistance ranges of interest. A new functional form is defined for the GMPE, and a nonlinear regression analysis is performed to estimate period-dependent regression coefficients for a magnitude range of 5 to 8 and closest distances to the fault rupture up to 1000 km. Ground-motion prediction equations are developed for the response spectra (pseudoacceleration, 5% damped) and the PGA, for hard-rock sites (nearsurface shear-wave velocityβ s ≥ 2 km=s, or NEHRP site class A), in ENA as a function of the moment magnitude and the closest distance to the fault rupture. The resulting ground-motion prediction model developed in this study is compared with other recent GMPEs as well as with the available observed data for ENA.
Hybrid Empirical Method In the hybrid empirical method, the target region (ENA in this study) ground motions are predicted from the host (WNA in this study) empirical GMPEs using modification factors between two regions (Campbell, 1987, 2000, 2003). These theoretical modification factors are calculated as the ratio of stochastic simulations of ground motions for two regions. Using regional seismological parameters in simulations, the adjustment factors reflect the regional differences in source, path, and site. In the hybrid empirical method, the empirically derived ground-motion models for the host region are mapped onto the target region considering the seismological regional disparities. The key assumption in the hybrid empirical method is that the near-source distance and magnitude saturation effects for the target region (ENA) are considered to be the same as those observed in the host region (WNA). Another interpretation of the method is that the differences between the empirical and stochastic estimations for the host region are applied to the stochastic ground-motion predictions in the target region as corrections to derive a hybrid empirical model. In this study, the computer program gm_td_drvr, one of the Stochastic Model SIMulation (SMSIM) programs (Boore, 2005), is used to perform the stochastic simulation of ground-motion amplitudes for both WNA and ENA, using the seismological parameters given in Table 1. The output of the program is the PGA or the PSA at given periods.
Hybrid Empirical Ground-Motion Prediction Equations for Eastern North America
1861
Table 1 Median Parameter Values Used with the Stochastic Method in WNA and ENA Parameter
Source spectrum model Stress parameter, Δσ (bars) Shear-wave velocity at source depth, β s (km=s) Density at source depth, ρs (gm=cc) Geometric spreading, Z�R�
WNA
Single-corner-frequency ω 80 3.5 2.8 � R�1:0 ; R < 40 km R�0:5 ; R ≥ 40 km
Quality factor, Q Source duration, T s (s)
180f0:45 1=fa
Path duration, T p (s) Site amplification, A�f� Kappa, κ0 (s)
0:05R Boore and Joyner (1997) 0.04
The adjustment factors are the ratio of the simulated spectral values for ENA with respect to those for WNA.
Stochastic Ground-Motion Simulation In stochastic simulation methods, the ground-motion acceleration is modeled as a filtered Gaussian white noise modulated by a deterministic envelope function defined by seismological parameters. The filter parameters are determined by either matching the empirical properties of the spectrum of the strong ground-motion theoretical spectral shapes, or they are determined on the basis of reliable physical characteristics of the earthquake source and propagation media (Hanks and McGuire, 1981; Boore, 1983, 2003). Recent investigations into the stochastic point-source model and its relationship to stochastic finite-fault models are given in Atkinson et al. (2009) and Boore (2009). A point-source model is used in this study for stochastic simulations. In this model the total Fourier amplitude spectrum of displacement, Y�M0 ; R; f�, for horizontal ground motions due to shear-wave propagation may be modeled as (Boore, 2003): Y�M0 ; R; f� � E�M0 ; f�P�R; f�G�f�I�f�;
ENA �2
(1)
where M0 is the seismic moment (dyne-cm), R is the distance (km), and f is the frequency (Hz). E�M0 ; f� is the pointsource spectrum term, P�R; f� is the path effect function, G�f� is the site-response term, and I�f� is the type of motion function. In the stochastic point-source model, the earthquake source is assumed to be focused at a point, which is a reasonable assumption for small earthquakes when the distance from source to site is considerably larger than source dimensions. For large earthquakes the finite-fault effects influence the ground motions especially at close distances. Atkinson and Silva (2000) defined an effective distance, R0rup , to be
Single-corner-frequency ω�2 250 3.7 2.8 ( R�1:3 ; R < 70 km R�0:2 ; 70 ≤ R < 140 km R�0:5 ; R ≥ 140 km max�1000; 893f0:32 � 1=fa 8 0; R ≤ 10 km > > < �0:16R; 10 < R < 70 km �0:03R; 70 < R ≤ 130 km > > : �0:04R; R > 130 km Atkinson and Boore (2006) 0.005
used in point-source stochastic simulations to mimic the finite-fault effects. They defined a magnitude-dependent equivalent point-source depth, h, to modify the closest distance to fault rupture, Rrup , and to account for the fact that most of the surface of a finite fault will be at a distance greater than Rrup : R0rup �
q�������������������� R2rup � h2 ;
(2)
where from Atkinson and Silva (2000): log h � �0:05 � 0:15M:
(3)
In this study, the effective distance, R0rup , is used in the stochastic simulations to evaluate the adjustment factors. The NGA models are first evaluated for a set of Rrup distances; then corresponding R0rup distances from equation (3) are used in the stochastic simulations to determine the adjustment factors for Rrup distances. Finally, the hybrid empirical model for ENA is derived as a function of Rrup . We employed the seismological model parameters used in Atkinson and Boore (2006), Atkinson et al. (2009), and Boore (2009) for ENA, and parameters used in Atkinson and Silva (2000) for WNA to simulate ground motions. The seismological model parameters for both ENA and WNA regions are summarized in Table 1 and are discussed in more detail in the following sections. We did not model the uncertainty associated with the stochastic model parameters, that is, only one scalar value is used as the median parameter values. Earthquake Source Model We used the Brune (1970, 1971) point-source spectrum for the source modeling in stochastic simulations. The Brune model is a single-corner frequency point-source spectrum in
1862
Choice of Stress Parameter in ENA. Atkinson and Boore (2006) used a median stress parameter of 140 bars for ENA in their finite-fault simulations using the computer code Extended Finite Fault SIMulation (EXSIM, Motazedian and Atkinson, 2005). Campbell (2008) found that a higher stress parameter (e.g., 280 bars) has to be used with SMSIM to predict ground motions similar to those of Atkinson and Boore (2006). Atkinson et al. (2009) and Boore (2009) found that the stress parameter of 250 bars should be used in SMSIM simulations in order to attain agreement with the Atkinson and Boore (2006) finite-fault predictions, due to differences in normalization conventions between the two programs. They also pointed out that using the effective distance measure proposed by Boore (2009) in the SMSIM calculations results in a much better match between SMSIM and EXSIM results at close distances. Boore et al. (2010) determined the stress parameter for eight well-recorded earthquakes in ENA with data that are largely at distances of 100–800 km. They showed that estimates of Δσ are correlated to the rate of geometrical spreading at close distances using SMSIM point-source simulations; they evaluated a geometric-mean Δσ of 250 bars for the Atkinson (2004) attenuation model (including geometrical spreading and quality factor function) for the case in which the 1988 Saguenay earthquake is included. Atkinson and Assatourians (2010) found a stress parameter of 250 bars for the magnitude 5.0 Val-des-Bois, Quebec, earthquake. Based on the previous discussion, a stress parameter of 250 bars is used in the ENA point-source stochastic simulations, together with the attenuation model of Atkinson (2004), to be consistent with the study of Boore et al. (2010) and the findings of Atkinson et al. (2009) and Atkinson and Assatourians (2010). Choice of Stress Parameter in WNA. Atkinson and Silva (2000) examined ground motions for California using a stochastic finite-fault model and introduced an equivalent two-corner-frequency point-source spectrum that mimics the conspicuous finite-fault effects. They showed that the double-corner-frequency source model and the Brune single-corner frequency spectrum with the stress parameter of 80 bars are close for moment magnitudes (Mw ) less than 6.0, and the goodness-of-fit to the data are equivalent. However, at large magnitudes and low frequencies, where finite-fault effects become significant, the two models become different due to the spectral sag in the double-corner model. In this study, a stress parameter of 80 bars is used for the point-source stochastic simulations for WNA using the Brune
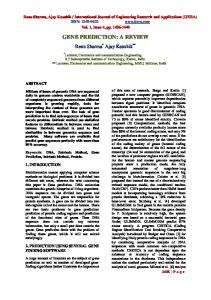
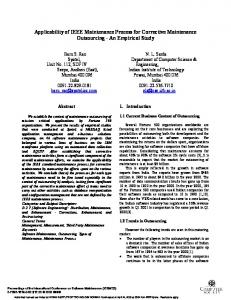
single-corner frequency model. In Figure 1, the stochastic simulations using a stress parameter of 80 bars for WNA are compared with NGA model predictions for an Mw 6.0 earthquake at distance Rrup � 10 km. The comparison is made at Mw 6.0 to avoid small-magnitude bias in NGA models for small magnitudes (Atkinson and Morrison, 2009; Chiou et al., 2010; Atkinson and Boore, 2011), and to avoid the large magnitude issue associated with finite-fault effects in the stochastic modeling. In other words, we anchor the WNA stress drop at moderate magnitudes, where this parameter is most robust and most comparable to the ENA stress value. This comparison shows reasonable agreement between the NGA models and the WNA stochastic groundmotion simulations developed in this study. It should be noted that the seismological parameters of Table 1 and the effective distance from Atkinson and Silva (2000) are used in the simulations. Filter Function of the Transfer Media The path effect, P�R; f� in equation (1), consists of a geometrical spreading function and an anelastic attenuation term described by the quality factor function (Boore, 2003). Choice of Path Model for ENA. Atkinson and Boore (2006) used the trilinear geometrical spreading along with the quality factor of Atkinson (2004) in their simulations. Boore et al. (2010) found that stress parameter is strongly tied to the choice of geometrical spreading. They consider four geometrical spreading functions, ranging from a simple 100 Mw = 6.0 Rrup= 10 km
Acceleration (g)
which stress parameter, Δσ, controls the high-frequency level of the spectrum. The choice of stress parameter for stochastic ground-motion simulations in ENA has been the subject of several studies such as Atkinson and Boore (2006), Atkinson et al. (2009), Boore (2009), and Boore et al. (2010). The preference of the stress parameters used for both ENA and WNA regions is discussed in the following sections.
S. Pezeshk, A. Zandieh, and B. Tavakoli
10-1 AS08 BA08 CB08
10-2
CY08 I08 NGA geometric mean WNA stochastic (80 bars)
10-3 0.01
0.1
1
10
Period (sec)
Figure 1. Comparison of 5%-damped acceleration response spectra predicted by NGA models with the spectrum predicted from point-source stochastic simulations of this study for Mw 6.0 atRrup � 10 km using stress parameter of 80 bars. AS08: Abrahamson and Silva (2008); BA08: Boore and Atkinson (2008); CB08: Campbell and Bozorgnia (2008); CY08: Chiou and Youngs (2008); I08: Idriss (2008). The color version of this figure is available only in the electronic edition.
Hybrid Empirical Ground-Motion Prediction Equations for Eastern North America 1=R model at all distances to more complicated bi- and trilinear functions and determined the stress parameter for eight ENA earthquakes for each path model. As mentioned previously, for the Atkinson (2004) path model the median stress parameter of 250 bars was estimated for ENA events including Saguenay. They showed that the simple 1=R model fits the data, most of it being in the distance range of 100–800 km, as well as more complex models. However, the presence of a flat or increasing geometrical spreading at intermediate distances affects the ground motions at the distances of most engineering concerns (within 100 km) significantly (Boore et al., 2010). Atkinson and Assatourians (2010) studied five ENA earthquakes and found that the data fit better if the geometrical spreading of Atkinson (2004) is assumed for hypocentral distances beyond 10 km, and a 1=R model is used from 1 to 10 km. The path model of Atkinson (2004) is used in this study for the stochastic simulations. This model is derived from a large database dominated by small earthquakes (i.e., point sources) and has not been confirmed for large events where finite-fault effects are evident. We assume that using the effective distance in point-source simulations (equation 2) captures the finite-fault effects, and therefore the Atkinson (2004) model will apply to the attenuation of R0rup . The alternative treatment of near-source attenuation suggested in Atkinson and Assatourians (2010) (i.e., switching to 1=R from 1 to 10 km) is not employed here, because the effective distance of Atkinson and Silva (2000) is being used and further saturation is not required (G. Atkinson, personal commun., 2010). The geometrical spreading function and the quality factor function of Atkinson (2004) are provided in Table 1. Choice of Path Model for WNA. Raoof et al. (1999) derived an attenuation model for Southern California from studying 820 three-component broadband recordings from 140 moderate-to-large earthquakes over distances of hundreds of kilometers. The model consists of a bilinear geometrical spreading function with a 40-km crossover distance (1=R for R ≤ 40 km and R�0:5 for larger distances), coupled with a quality factor function of the form Q � 180f0:45 . The model is determined for data within the 0.25 and 5 Hz range. Atkinson and Silva (2000) used the Raoof et al. (1999) path model in their finite-fault simulations. Malagnini et al. (2007) studied a dataset of 5769 waveforms from 281 small-tomoderate events located within 200 km of the San Francisco Bay area to derive a regional attenuation model for frequencies ranging between 0.25 and 20 Hz. Their study supports the path model developed by Raoof et al. (1999), because it includes a geometrical spreading coefficient of �1:0 for R ≤ 30 km and �0:6 for larger distances, and an anelastic attenuation of Q � 180f0:42 . Therefore, the path model of Raoof et al. (1999) is used in this study for the simulation of ground motions in WNA.
1863
Site Effects The site effect, G�f� in equation (1), can be separated into site amplification factors and a near-surface attenuation term, which models the near-surface damping effects and is independent of path. We employed the model of Anderson and Hough (1984) for near-source attenuation, which is described as a low-pass filter and is defined by the decay slope of the spectrum at high frequencies, kappa (κ0 ) (at near-source distances). Choice of Site Effects for ENA. Campbell (2003) and Tavakoli and Pezeshk (2005) developed hybrid empirical models for the ENA hard-rock shear-wave velocity profile and the generic ENA amplification model of Boore and Joyner (1997) (V S30 � 2880 m=s). The empirical site amplifications and the kappa value used in Atkinson and Boore (2006) for hard-rock sites (NEHRP site class A, V S30 ≥ 2000 m=s, κ0 � 0:05) are employed in the simulations. This choice is made to be consistent with the use of stress parameters of 250 bars and corresponding path model from the work of Atkinson et al. (2009), Boore (2009), and Boore et al. (2010), because the same amplification factors and kappa are used in these studies to derive the stress parameter of 250 bars for ENA. The presumed amplifications increase from 1.0 for frequencies less than 0.5 Hz to 1.4 for frequencies greater than 10 Hz as based on Siddiqqi and Atkinson (2002). The amplification factors and the kappa value used for ENA hard-rock sites are provided in Table 1. Choice of Site Effects for WNA. Atkinson and Silva (2000) used the amplifications for generic rock sites introduced by Boore and Joyner (1997) for WNA to derive a model for California. Campbell (2003, 2007) and Tavakoli and Pezeshk (2005) also used the generic rock sites of Boore and Joyner (1997) for the stochastic modeling of ground motions in WNA. The WNA generic rock site has an average value of shear velocity in the upper 30 meters of about 620 m=s. The shear-wave velocity at source depth is 3:5 km=s at a depth of 8 km. The amplification factors for these sites are calculated using the quarter wavelength method (Boore and Joyner, 1997). In this study, the amplification factors of Boore and Joyner (1997) for generic rock sites in WNA are used. In the WNA region, the value of κ0 is in the order of about 0.02–0.04 s (Anderson and Hough, 1984). Atkinson and Silva (1997) used an average kappa value of 0.04 in their model. We also used the κ0 value of 0.04 for the rock site in WNA. All the seismological parameters for ENA and WNA used for stochastic simulations are summarized in Table 1. It should be noted that seismological parameters not mentioned previously, and only presented in Table 1 (e.g., duration), are the same as the parameters used in Atkinson and Boore (2006) for ENA and Atkinson and Silva (2000) for WNA.
1864
S. Pezeshk, A. Zandieh, and B. Tavakoli
Ground-Motion Models in WNA The ground-motion prediction models developed for the PEER NGA project (Power et al., 2008) are used as the empirical ground-motion models for the host region, WNA. In the NGA project, five sets of ground-motion prediction
models are developed for shallow crustal earthquakes in the western United States and similarly active tectonic regions. The five models used in this study are the 2008 Abrahamson and Silva (AS08); the 2008 Boore and Atkinson (BA08); the 2008 Campbell and Bozorgnia (CB08); the 2008 Chiou and Youngs (CY08); and the 2008 Idriss (I08). The geometric mean of these five models is used as the WNA empirical ground-motion estimates. The geometric mean of the five modified WNA models are used as the hybrid empirical estimates of the ground-motion for ENA in the regression process. All NGA models have parameterization such as moment magnitude, distance, and style of faulting. The I08 model is applicable only for rock sites, while all other models have the average shear-wave velocity in the upper 30 m, V S30 , as well as input rock motion parameters to model nonlinear site response (Abrahamson et al., 2008). The AS08, CB08, and CY08 models have additional terms to account for hanging wall effects, rupture-depth effects, and soil/sediment depth effects (Abrahamson et al., 2008). The ground-motion component used in the NGA models is the new geometric mean, referred to as GMRotI50 (Boore et al., 2006), which is the geometric mean determined from the fiftieth percentile values of the geometric means computed for all nonredundant rotation angles and all periods less than the maximum useable period; therefore, it is independent of sensor orientation. In this study, we used a generic style of faulting to evaluate WNA ground-motion prediction relations. This is done because there is no evidence that differences in the ground motions between faulting styles can be expected in the target and host regions (Campbell 2003, 2007). This generic style of faulting is an average of strike slip and reverse fault mechanisms. For this purpose, we set FRV � 0:5 and FNM � 0 in the AS08, CB08, and CY08 models; SS � 0:5, RS � 0:5, NS � 0:0, and U � 0:0 in the BA08 model; and F � 0:5 in the I08 model. We did not include the hanging wall effect for the AS08, CB08, and CY08 models. A depth to the top of rupture of zero is assumed in the AS08, CB08, and CY08 models. We used Rrup as the distance metric. BA08 used RJB as the distance measure, which is the closest horizontal distance to the surface projection of the rupture plane. All other models used the closest distance to the rupture plane, Rrup . We used the Scherbaum et al. (2004) conversion equations to convert RJB to Rrup in the BA08 model. The NGA relations are evaluated for the Boore and Joyner (1997) generic rock site with V S30 � 620 m=s. The soil/sediment depth term is defined using different depth parameters in NGA relations. The AS08 and CY08 models use Z1:0 , depth to V S � 1:0 km=s at the site, and the CB08
model uses Z2:5 , depth to V S � 2:5 km=s at the site, to model the soil/sediment depth effects. These models have relations for median Z2:5 and Z1:0 for a given V S30 when no soil profile information is available. In this study, we calculated Z2:5 and Z1:0 based on the WNA generic rock profile.
Ground-Motion Prediction Equation Developed for ENA Median hybrid empirical estimates of ENA ground motion are obtained by scaling the WNA empirical relations using theoretical modification factors. The model is evaluated for moment magnitudes 5.0 to 8.0 in 0.5 magnitude unit increments, and for 25 rupture distances (Rrup ): 1, 2, 5, 10, 15, 20, 30, 40, 50, 60, 70, 80, 100, 120, 140, 180, 200, 250, 300, 400, 500, 600, 700, 800, and 1000 km. The NGA models are developed for distances less than 200 km; therefore, using them beyond this range is not appropriate. On the other hand, using the hybrid empirical method for Rrup > 70 km results in an unrealistic attenuation rate for ENA, where ground-motion predictions increase substantially with distance for periods within 0.05–3.0 seconds, especially for magnitudes larger than 6.5. The reason is that the rate of attenuation predicted by the stochastic model for WNA is higher than the rate predicted in the geometric mean of the NGA models for distances greater than 40 km. The decrease in attenuation rate in ENA from 70 to 140 km reinforces the increase in the hybrid empirical estimations for distances greater than 70 km. This is one limitation of the hybrid empirical method for ENA, that it only provides reliable estimates out to 70 km. To avoid these problems, the hybrid empirical method is applied for Rrup ≤ 70 km; hybrid empirical estimations are supplemented with stochastic ENA predictions for beyond 70 km to extend the GMPEs up to 1000 km. This is done using the method proposed by Campbell (2003), which scales the stochastic ENA ground-motion predictions by the factor required to make its estimate at Rrup � 70 km equal to the hybrid empirical method prediction. These scaled estimates are then used as estimates for Rrup beyond 70 km in regression process (to 1000 km) to develop the GMPEs. The GMPEs are developed for an ENA hard-rock site with V S30 ≥ 2000 m=s (NEHRP site class A). For a different site condition, the predictions must be modified using an appropriate method. The hybrid empirical estimates of ENA ground motion, for magnitudes 5.0–8.0 and rupture distances up to 1000 km, are used in a nonlinear least-squares regression to develop the GMPEs. This regression is used to find coefficients defining a functional form that fits the hybrid empirical estimates of ground-motion in ENA. Relationships are provided for the PGA and for the 5% damped pseudospectral acceleration (PSA) for the spectral periods of 0.01 to 10 s consistent with the periods used in NGA models. The following ground-motion prediction functional form in equation (4) is used in this study:
c1
1.5828 2.0434 2.3050 1.9848 1.6854 1.4517 1.0698 0.9314 0.3964 �0:4883 �1:0098 �1:6800 �2:3106 �3:1365 �4:5494 �5:4113 �6:4806 �6:9340 �7:4264 �7:8064 �8:2704 �8:3376 �9:1046
T (s)
PGA 0.010 0.020 0.030 0.040 0.050 0.075 0.10 0.15 0.20 0.25 0.30 0.40 0.50 0.75 1.0 1.5 2.0 3.0 4.0 5.0 7.5 10.0
2:298E�01 1:987E�01 1:877E�01 2:203E�01 2:404E�01 2:414E�01 2:989E�01 3:088E�01 4:317E�01 6:278E�01 7:401E�01 8:860E�01 1:022E�00 1:201E�00 1:508E�00 1:690E�00 1:867E�00 1:907E�00 1:881E�00 1:895E�00 1:938E�00 1:806E�00 1:899E�00
c2
Table 2 c4
�3:8325 �4:0521 �4:0443 �3:8032 �3:6129 �3:4683 �3:3770 �3:2926 �3:2112 �3:0304 �2:9959 �2:8894 �2:9265 �2:8823 �2:8614 �2:8998 �2:9338 �3:0128 �2:9742 �3:0050 �2:9501 �2:9839 �2:8611
c3
�3:847E�02 �3:837E�02 �3:697E�02 �3:616E�02 �3:578E�02 �3:468E�02 �3:897E�02 �3:844E�02 �4:578E�02 �5:654E�02 �6:309E�02 �7:162E�02 �7:965E�02 �9:037E�02 �1:087E�01 �1:196E�01 �1:282E�01 �1:287E�01 �1:205E�01 �1:183E�01 �1:180E�01 �1:042E�01 �1:076E�01
c6
3:535E�01 3:321E�01 3:688E�01 1:995E�01 3:616E�01 �1:222E�01 3:384E�01 7:814E�02 3:247E�01 2:956E�01 3:177E�01 5:224E�01 3:180E�01 7:422E�01 3:063E�01 7:064E�01 2:937E�01 6:084E�01 2:673E�01 5:422E�01 2:623E�01 4:421E�01 2:481E�01 4:869E�01 2:515E�01 4:716E�01 2:456E�01 3:333E�01 2:424E�01 4:023E�01 2:465E�01 3:766E�01 2:525E�01 2:633E�01 2:639E�01 3:172E�01 2:576E�01 2:585E�01 2:588E�01 3:069E�01 2:503E�01 3:296E�01 2:542E�01 2:879E�01 2:395E�01 2:868E�01
c5
�9:165E�02 �8:918E�02 �9:157E�02 �1:126E�01 �1:180E�01 �1:296E�01 �1:215E�01 �9:521E�02 �6:727E�02 �5:347E�02 �3:625E�02 �4:324E�02 �4:039E�02 �2:105E�02 �3:092E�02 �2:928E�02 �1:442E�02 �2:150E�02 �1:520E�02 �2:545E�02 �3:023E�02 �2:252E�02 �2:290E�02
c7
�2:5517 �2:5948 �2:9998 �3:3125 �3:3320 �3:2109 �2:6889 �2:2090 �1:6121 �1:3516 �1:2309 �1:1490 �1:0923 �1:0022 �0:9750 �0:9470 �0:9007 �0:8749 �0:8821 �0:8808 �1:0125 �1:1817 �1:3786
c8
1:831E�01 1:847E�01 1:941E�01 2:017E�01 1:977E�01 1:956E�01 1:723E�01 1:472E�01 1:072E�01 8:784E�02 7:733E�02 7:056E�02 6:554E�02 5:519E�02 5:536E�02 5:249E�02 4:974E�02 4:774E�02 5:376E�02 5:703E�02 7:332E�02 9:598E�02 1:222E�01
c9
�4:224E�04 �3:965E�04 �1:707E�04 �5:322E�05 �1:113E�04 �2:669E�04 �6:659E�04 �9:254E�04 �1:077E�03 �1:045E�03 �9:648E�04 �9:049E�04 �7:853E�04 �7:069E�04 �5:685E�04 �4:563E�04 �3:540E�04 �3:025E�04 �2:641E�04 �2:423E�04 �2:002E�04 �1:624E�04 �1:268E�04
c10
6.6521 7.0645 7.3314 7.1183 6.8113 6.3705 6.0817 6.1621 6.2667 6.1905 6.0635 5.9891 6.0263 5.9117 5.9835 6.1234 5.9875 6.1355 6.0598 6.2536 6.3423 6.5181 6.5384
c11
Coefficients of the Hybrid Empirical Model and Standard Deviation of the Regression �2:105E�02 �1:974E�02 �1:974E�02 �2:094E�02 �2:180E�02 �2:244E�02 �2:312E�02 �2:259E�02 �2:185E�02 �2:046E�02 �1:933E�02 �1:837E�02 �1:683E�02 �1:556E�02 �1:339E�02 �1:180E�02 �1:040E�02 �9:443E�03 �8:509E�03 �7:859E�03 �6:900E�03 �7:240E�03 �7:485E�03
c12
3:778E�01 3:688E�01 3:691E�01 3:817E�01 3:914E�01 3:990E�01 4:108E�01 4:102E�01 4:066E�01 3:979E�01 3:908E�01 3:867E�01 3:774E�01 3:722E�01 3:654E�01 3:588E�01 3:569E�01 3:561E�01 3:540E�01 3:527E�01 3:577E�01 3:730E�01 3:848E�01
c13
2:791E�01 2:792E�01 2:796E�01 2:838E�01 2:874E�01 2:905E�01 2:976E�01 3:007E�01 3:023E�01 3:033E�01 3:041E�01 3:068E�01 3:082E�01 3:119E�01 3:203E�01 3:249E�01 3:327E�01 3:387E�01 3:431E�01 3:463E�01 3:580E�01 3:710E�01 3:810E�01
c14
0.021 0.022 0.023 0.022 0.024 0.025 0.025 0.022 0.016 0.014 0.015 0.015 0.017 0.017 0.021 0.022 0.019 0.021 0.024 0.030 0.032 0.030 0.024
σReg
Hybrid Empirical Ground-Motion Prediction Equations for Eastern North America 1865
1866
S. Pezeshk, A. Zandieh, and B. Tavakoli
� � c1 � c2 Mw � C3 M2w � �c4 � c5 Mw � log�Y� × minflog�R�; log�70�g � �c6 � c7 Mw � × max�minflog�R=70�; log�140=70�g; 0� � �c8 � c9 Mw � × maxflog�R=140�; 0g � c10 R;
(4)
where R�
q��������������������� R2rup � c211
(5)
where Y� is the median value of PGA or PSA (g), Mw is the moment magnitude, and Rrup is the closest distance to fault rupture (km). � to be The mean aleatory standard deviation of log�Y� associated with the predictions is defined as a function of earthquake magnitude and is modeled as follows: � σlog�Y� � �
c12 Mw � c13 �6:95 × 10�3 Mw � c14
M≤7 M > 7:
(6)
This aleatory standard deviation is constructed using an equally weighted average of the standard deviations from each of the WNA ground-motion prediction models (Campbell, 2003). Standard deviation in AS08, CB08, and CY08 models is related to the ground motion on the reference rock, which varies with respect to distance, magnitude, and site condition (V S30 ). This is done to model the decrease in the standard deviation caused by a nonlinear site response. We observed that the reduction in the standard deviation is not significant for the assumed generic rock site in WNA with V S30 � 620 m=s. Therefore, in this study we neglected the soil nonlinearity effects in calculation of the standard deviation for NGA relations. After this assumption, the standard deviation in AB08, CY08, and I08 depends only on the magnitude and spectral period. The median aleatory standard deviation of the ground motion in ENA is assumed to equal the average standard deviations of NGA models and therefore depends on magnitude (equation 6). The total aleatory standard deviation may be derived by adding the standard deviation of the regression to the aleatory standard deviation from equation (6) as follows q�������������������������� (7) σTlog Y� � σ2log Y� � σ2Reg ; where σReg is the standard deviation of the regression performed to fit the model to ground-motion estimates. On the other hand, the model misfit does not represent physical variability and might therefore be neglected for seismic hazard calculation purposes. Regression coefficients c1 through c14 are calculated using a nonlinear least-squares method and tabulated in Table 2 together with the standard deviation of the fit, σReg . It should be noted that an evaluation of epistemic uncertainty is not included in this study. Based on the mathema-
tical framework given by Campbell (2003), the sources of epistemic uncertainty in hybrid empirical method are: (1) the epistemic uncertainty in seismological parameters used in stochastic simulations, and (2) the epistemic uncertainty involved in using different empirical ground-motion models for the host. We did not evaluate epistemic uncertainty in this study because in practice this type of uncertainty can be evaluated by using different models developed for ENA, and the epistemic uncertainty associated with an individual groundmotion model is not generally used (Campbell, 2007). As mentioned previously, the NGA models are for the GMRotI50 measure of seismic intensity. Therefore, the hybrid empirical model developed in this study predicts the intensity of ground motions for the new geometric-mean component, GMRotI50. Boore and Atkinson (2008) suggest using simple conversion factors between GMRotI50 and other measures of seismic intensity given by Beyer and Bommer (2006) and Watson-Lamprey and Boore (2007) as well as by Campbell and Bozorgnia (2008). Figure 2 illustrates a comparison of the result of this study with the update to the 2006 Atkinson and Boore model (Atkinson and Boore, 2011; hereafter AB06′) and the Tavakoli and Pezeshk (2005) model. The Atkinson and Boore (2006) model is based on a finite-fault stochastic method and is derived for hard-rock sites (NEHRP site class A, V S30 ≥ 2000 m=s) employing the Atkinson and Boore (2006) empirical site amplification factors; it was recently modified based on new data (Atkinson and Boore, 2011). The new data consist of small-to-moderate ENA events as well as three wellrecorded earthquakes with Mw ∼ 5:0. Atkinson and Boore (2011) compared the predictions of the Atkinson and Boore (2006) to the new data and also to the updated version of the Boore and Atkinson (2008) model for WNA to contemplate the magnitude scaling for WNA and ENA, and they inferred that a larger stress parameter should have been used in Atkinson and Boore (2006) for small magnitudes. They defined a magnitude-dependent stress parameter, which decreases as the magnitude increases, to be used in the Atkinson and Boore (2006) model. The modified model (AB06′) predicts larger high-frequency amplitudes for Mw ≤ 6 and lower amplitudes for Mw ≥ 7 compared with the original Atkinson and Boore (2006) model. Tavakoli and Pezeshk (2005) used the hybrid empirical method to develop a ground-motion model in ENA for the generic hard-rock site of Boore and Joyner (1997) with V S30 � 2880 m=s corresponding to the NEHRP A site class. To perform a consistent comparison, the estimations from Tavakoli and Pezeshk (2005) should be adjusted for the site condition in the Atkinson and Boore (2006) model and this study. This adjustment is approximated by multiplying the Tavakoli and Pezeshk (2005) predictions by the ratio of site amplifications in Atkinson and Boore (2006) to the amplification factors of Boore and Joyner (1997). Moreover, the amplification factors of Boore and Joyner (1997) are evaluated assuming a shear-wave velocity of 3:6 km=s near the source, whereas in the stochastic computations of Atkinson and
Hybrid Empirical Ground-Motion Prediction Equations for Eastern North America PSA (0.1 s)
101
101
100
100
Spectral Acceleration (g)
Acceleration (g)
PGA
10-1 10-2 10-3
This study TP05
10-4
AB06'
10-5
10-1 10-2 10-3
This study TP05
10-4
AB06'
10-5 1
10
100
1
1000
Rupture Distance (km)
10
PSA (0.2 s)
1000
PSA (0.5 s) 101
Spectral Acceleration (g)
Spectral Acceleration (g)
100
Rupture Distance (km)
101 100 10-1 10-2 This study TP05
10-3
100 10-1 10-2 This study
10-3
TP05
AB06'
AB06'
10-4
10-4 1
10
100
1000
1
Rupture Distance (km)
10
100
1000
Rupture Distance (km)
PSA (1.0 s)
PSA (4.0 s) 10-1
Spectral Acceleration (g)
100
Spectral Acceleration (g)
1867
10-110-2 10-3 This study
10-4
TP05
10-2 10-3 10-4 This study TP05 AB06'
10-5
AB06'
10-5
10-6 1
10
100
1000
Rupture Distance (km)
1
10
100
1000
Rupture Distance (km)
Figure 2.
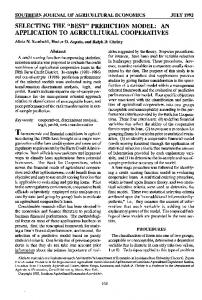
Comparison of PGA and PSA developed in this study with the predictions by two ground-motion models developed for ENA: (lower curve) magnitude 5.0; (upper curve) magnitude 7.0. TP05, empirical hybrid method (Tavakoli and Pezeshk, 2005); AB06′, modified version of the 2006 Atkinson and Boore finite-source stochastic model (Atkinson and Boore, 2011). The comparison is for
ENA hard-rock sites (V S30 ≥ 2000 m=s) defined in Atkinson and Boore (2006). The color version of this figure is available only in the
electronic edition.
Boore (2006) and also this study a shear-wave velocity of 3:7 km=s at source is used. Therefore, the amplification ratios of Atkinson and Boore (2006) p��������������� � to Boore and Joyner (1997) are multiplied by 3:7=3:6. The modified ratios are used to adjust the Tavakoli and Pezeshk (2005) estimations.
The modified amplification ratios are a factor of up to 1.21 at high frequencies. The ground-motion model comparisons are shown in Figure 2 for PGA and PSA at periods of 0.1, 0.2, 0.50, 1.0, and 4.0 s for magnitudes 5 and 7 and Rrup distances between
1868
S. Pezeshk, A. Zandieh, and B. Tavakoli
1 and 1000 km. It can be observed that the AB06′ model has larger values at very close distances in comparison with Tavakoli and Pezeshk (2005) and this study. This may occur because of using a stochastic method, which does not model the saturation effects observed in other active regions (Atkinson, 2008). However, the two models predict similar values for distances greater than 10 km at all magnitudes and frequencies. Tavakoli and Pezeshk (2005) used a lower median stress parameter compared with this study (150 versus 250 bars), together with the path model of Atkinson and Boore (1995), which consists of a lower near-source attenuation rate than the path model used in this study. Boore et al. (2010) evaluated a median stress parameter of about 60 bars for the Atkinson and Boore (1995) attenuation model. Therefore,
Rupture Distance (km) PSA (1.0 s)
Conclusions
PSA (0.2 s)
Spectral Acceleration (g)
0.1
0.01
This study, M5.0 Observations, M4.8-5.06 (H) Observations, M4.8-5.06 (V converted to H)
0.0001 1
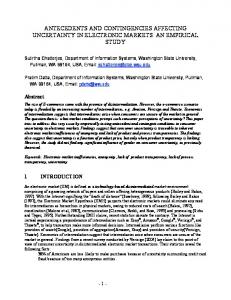
Comparison of Results with Observed Ground-Motion Data for ENA The predictions of this study are compared with the available ENA ground-motion database used in Assatourians and Atkinson (2010) (see the Data and Resources section). In Figure 3, the 0.2-s and 1.0-s spectral accelerations predicted in this study for Mw 5.0 are compared with the database of Assatourians and Atkinson (2010) for Mw 4.8–5.06 for the NEHRP A site class. It can be seen that the GMPE of this study underpredicts the observations at close distances (60 km). Atkinson and Assatourians (2010) discussed the underprediction issue of the ENA GMPEs for small magnitudes at close distances for the Val-des-Boise earthquake. They mentioned that applying an average attenuation shape to individual events, despite the event-to-event variation in the attenuation shape, might be the issue. It should be noted that spectral accelerations are shown for both the horizontal components and the vertical component converted to the horizontal component In general, there is a good agreement between the ground-motion predictions of this study and the ENA database at large distances (Rrup ≥ 200 km).
1
0.001
it is expected for the Tavakoli and Pezeshk (2005) model (with stress parameter of 150 bars) to predict higher amplitudes than the predictions of this study, especially at higher frequencies. It can be seen in Figure 2 that the estimations of Tavakoli and Pezeshk (2005) are similar to the predictions of this study at high frequencies for magnitude 5; however, they are larger for magnitude 7. For larger periods, Tavakoli and Pezeshk (2005) amplitudes are higher for all magnitudes.
10
100
1000
Spectral Acceleration (g)
0.1
0.01
0.001
0.0001
This study, M5.0 Observations, M4.8-5.06 (H) Observations, M4.8-5.06 (V converted to H)
0.00001 1
10
100
1000
Rupture Distance (km) Figure 3. Comparison of ground-motion predictions of this study (solid line) for magnitude 5 with the ENA ground-motion observations on the NEHRP A site condition used in Assatourians and Atkinson (2010) for horizontal components (indicated by H) and vertical components (indicated by V) converted to the equivalent horizontal components (a) 5%-damped response spectral acceleration at 0.2-s period (b) 5%-damped response spectral acceleration at 1.0-s period. The color version of this figure is available only in the electronic edition.
A hybrid empirical method is used to develop a groundmotion prediction model (GMPE) for ENA. The hybrid empirical procedure uses WNA empirical ground-motion models from the NGA project (Power et al., 2008) and also the most recent updated seismological parameters from Boore et al. (2010), Boore (2009), Atkinson et al. (2009), and Atkinson and Boore (2006) for the ENA stochastic simulations. The major assumption in the hybrid empirical model is that the near-source saturation effects observed in active tectonic regions such as WNA is a general behavior and is the same in other seismic regions. In the hybrid empirical method, the empirical models from the host region are scaled by factors accounting for the differences in the source, path, and site effects between the host and the target region. These factors are evaluated using a stochastic method, considering seismological parameters associated with each of the WNA and ENA regions. For ENA, the stress parameter of 250 bars together with the attenuation model of Atkinson (2004) are used in the stochastic simulation. For WNA, we employed the seismological parameters used in Atkinson and Silva (2000). The effective point-source distance of Atkinson and Silva (2000)
Hybrid Empirical Ground-Motion Prediction Equations for Eastern North America is used as the distance measure in stochastic simulations in both regions. The ground-motion model in this study is developed for Mw 5.0–8.0, Rrup < 1000 km, and the ENA hard-rock site (NEHRP site class A, V S30 ≥ 2000 m=s) defined by Atkinson and Boore (2006). The ground-motion estimates for other site conditions can be evaluated using appropriate site amplification factors. The GMPE developed in this study is an alternative ground-motion model, which can be used along with other preexisting models in ENA regions to provide a better representation of epistemic uncertainty in this region.
Data and Resources The ENA observation database used for comparisons are from Assatourians and Atkinson (2010), and is available at http://www.seismotoolbox.ca, last accessed January 2010). The SMSIM programs used for the simulations can be obtained from the online software link at http://www .daveboore.com (last accessed December 2010).
Acknowledgments We wish to thank Gail Atkinson, David Boore, Norm Abrahamson, Walter Silva, and Kenneth Campbell for their comments, suggestions, and helpful criticisms that greatly improved the manuscript.
References Abrahamson, N., and W. Silva (2008). Summary of the Abrahamson & Silva NGA ground-motion relations, Earthquake Spectra 24, 67–97. Abrahamson, N., G. Atkinson, D. Boore, Y. Bozorgnia, K. Campbell, B. Chiou, I. M. Idriss, W. Silva, and R. Youngs (2008). Comparisons of the NGA ground-motion relations, Earthquake Spectra 24, 45–66. Anderson, J. G., and S. E. Hough (1984). A model for the shape of the Fourier amplitude spectrum of acceleration at high frequencies, Bull. Seismol. Soc. Am. 74, 1969–1993. Assatourians, K., and G. M. Atkinson (2010). Database of processed time series and response spectra data for Canada: An example application to study of 2005 MN 5.4 Riviere du Loup, Quebec, earthquake, Seismol. Res. Lett. 81, 1013–1031. Atkinson, G. M. (2004). Empirical attenuation of ground motion spectral amplitudes in southeastern Canada and the northeastern United States, Bull. Seismol. Soc. Am. 94, 1079–1095. Atkinson, G. (2008). Alternative ground-motion prediction equations for eastern North America from a referenced empirical approach: Implications for epistemic uncertainty, Bull. Seismol. Soc. Am. 98, 1304–1318. Atkinson, G. M., and K. Assatourians (2010). Attenuation and source characteristics of the 23 June 2010 M 5.0 Val-des-Bois, Quebec, Earthquake, Seismol. Res. Lett. 81, 849–860. Atkinson, G. M., and D. M. Boore (1995). New ground motion relations for eastern North America, Bull. Seismol. Soc. Am. 85, 17–30. Atkinson, G. M., and D. M. Boore (1998). Evaluation of models for earthquake source spectra in eastern North America, Bull. Seismol. Soc. Am. 88, 917–934. Atkinson, G., and D. Boore (2006). Ground motion prediction equations for earthquakes in eastern North America, Bull. Seismol. Soc. Am. 96, 2181–2205. Atkinson, G., and D. Boore (2011). Modifications to existing ground-motion prediction equations in light of new data, Bull. Seismol. Soc. Am. 101, 1121–1135.
1869
Atkinson, G., and M. Morrison (2009). Regional variability in ground motion amplitudes along the west coast of North America, Bull. Seismol. Soc. Am. 99, 2393–2409. Atkinson, G. M., and W. Silva (1997). An empirical study of earthquake source spectra for California earthquakes, Bull. Seismol. Soc. Am. 87, 97–113. Atkinson, G. M., and W. Silva (2000). Stochastic modeling of California ground motions, Bull. Seismol. Soc. Am. 90, 255–274. Atkinson, G. M., D. M. Boore, K. Assatourians, K. Campbell, and D. Motazedian (2009). A guide to differences between stochastic point-source and stochastic finite-fault simulations, Bull. Seismol. Soc. Am. 99, 3192–3201. Beresnev, I. A., and G. M. Atkinson (1999). Generic finite-fault model for ground motion prediction in eastern North America, Bull. Seismol. Soc. Am. 89, 608–625. Beresnev, I. A., and G. M. Atkinson (2002). Source parameters of earthquakes in eastern and western North America based on finite-fault modeling, Bull. Seismol. Soc. Am. 92, 695–710. Beyer, K., and J. J. Bommer (2006). Relationships between median values and between aleatory variabilities for different definitions of the horizontal component of motion, Bull. Seismol. Soc. Am. 96, 1512–1522. Boore, D. M. (1983). Stochastic simulation of high-frequency ground motion based on seismological models of the radiated spectra, Bull. Seismol. Soc. Am. 73, 1865–1893. Boore, D. M. (2003). Prediction of ground motion using the stochastic method, Pure Appl. Geophys. 160, 635–676. Boore, D. M. (2005). SMSIM-Fortran programs for simulating ground motions from earthquakes: Version 2.3-A Revision of OFR 96-80A, U.S. Geol. Surv. Open–File Rept. 00–509, revised 15 August 2005, 55 pp. Boore, D. M. (2009). Comparing stochastic point-source and finite-source ground-motion simulations: SMSIM and EXSIM, Bull. Seismol. Soc. Am. 99, 3202–3216. Boore, D. M., and G. M. Atkinson (2008). Ground-motion prediction equations for the average horizontal component of PGA, PGV, and 5%-damped PSA at spectral periods between 0.01 s and 10.0 s, Earthquake Spectra 24, 99–138. Boore, D. M., and W. B. Joyner (1997). Site amplification for generic rock sites, Bull. Seismol. Soc. Am. 87, 327–341. Boore, D. M., K. W. Campbell, and G. M. Atkinson (2010). Determination of stress parameters for eight well-recorded earthquakes in eastern North America, Bull. Seismol. Soc. Am. 100, 1632–1645. Boore, D. M., J. Watson-Lamprey, and N. A. Abrahamson (2006). GMRotD and GMRotI: Orientation-independent measures of ground motion, Bull. Seismol. Soc. Am. 96, 1502–1511. Brune, J. (1970). Tectonic stress and the spectra of seismic shear waves, J. Geophys. Res. 75, 4997–5009. Brune, J. (1971). Correction: Tectonic stress and the spectra of seismic shear waves, J. Geophys. Res. 76, 5002. Campbell, K. W. (1987). Predicting strong ground motion in Utah, in Assessment of Regional Earthquake Hazards and Risk Along the Wasatch Front, Utah, P. L. Gori and W. W. Hays (Editors), U.S. Geol. Surv, Open-File Rept. 87-585, Vol. II, L1–L90. Campbell, K. W. (2000). Predicting strong ground motion in Utah, in Assessment of Regional Earthquake Hazards and Risk Along the Wasatch Front, Utah, P. L. Gori and W. W. Hays (Editors), U.S. Geol. Surv. Profess. Paper 1500-L, L1–L31. Campbell, K. W. (2003). Prediction of strong ground motion using the hybrid empirical method and its use in the development of groundmotion (attenuation) relations in eastern North America, Bull. Seismol. Soc. Am. 93, 1012–1033. Campbell, K. W. (2007). Validation and update of hybrid empirical ground motion (attenuation) relations for the CEUS, report to the U.S. Geological Survey, National Earthquake Hazards Reduction External Research Program, Award No. 05HQGR0032. Campbell, K. (2008). Hybrid empirical ground motion model for PGA and 5% damped linear elastic response spectra from shallow crustal
1870 earthquakes in stable continental regions: Example for eastern North America, Proc. 14th World Conf. Earthq. Eng. Oct. 12–17, Beijing, China, Paper S03-001. Campbell, K. W., and Y. Bozorgnia (2008). NGA ground motion model for the geometric mean horizontal component of PGA, PGV, PGD and 5% damped linear elastic response spectra for periods ranging from 0.01 to 10 s, Earthquake Spectra 24, 139–171. Chiou, B. S.-J., and R. R. Youngs (2008). An NGA model for the average horizontal component of peak ground motion and response spectra, Earthquake Spectra 24, 173–215. Chiou, B., R. Youngs, N. Abrahamson, and K. Addo (2010). Ground motion model for small-to-moderate shallow crustal earthquakes in California and its implications for regionalization of ground motion prediction models, Earthquake Spectra 26, 907–926. Douglas, J., H. Bungum, and F. Scherbaum (2006). Ground-motion prediction equations for southern Spain and southern Norway obtained using the composite model perspective, J. Earthquake Engineering 10, 33–72. Frankel, A., C. Mueller, T. Barnhard, D. Perkins, E. Leyendecker, N. Dickman, S. Hanson, and M. Hopper (1996). National seismic hazard maps: Documentation June 1996, U.S. Geological Survey Open-File Rept. 96–532, 110 pp. Hanks, T. C., and R. K. McGuire (1981). The character of high-frequency strong ground motion, Bull. Seismol. Soc. Am. 71, 2071–2095. Idriss, I. M. (2008). An NGA empirical model for estimating the horizontal spectral values generated by shallow crustal earthquakes, Earthquake Spectra 24, 217–242. Malagnini, L., K. Mayeda, R. Uhrhammer, A. Akinci, and R. B. Herrmann (2007). A regional ground-motion excitation/attenuation model for the San Francisco region, Bull. Seismol. Soc. Am. 97, 843–862. McGuire, R. K., and T. C. Hanks (1980). RMS accelerations and spectral amplitudes of strong ground motion during the San Fernando, California, earthquake, Bull. Seismol. Soc. Am. 70, 1907–1919. Motazedian, D., and G. M. Atkinson (2005). Stochastic finite-fault modeling based on a dynamic corner frequency, Bull. Seismol. Soc. Am. 95, 995– 1010. Power, M., B. Chiou, N. Abrahamson, Y. Bozorgnia, T. Shantz, and C. Roblee (2008). An overview of the NGA project, Earthquake Spectra 24, 3–21.
S. Pezeshk, A. Zandieh, and B. Tavakoli Raoof, M., R. Herrmann, and L. Malagnini (1999). Attenuation and excitation of three–component ground motion in southern California, Bull. Seismol. Soc. Am. 89, 888–902. Scherbaum, F., J. J. Bommer, H. Bungum, F. Cotton, and N. A. Abrahamson (2005). Composite ground-motion models and logic trees: Methodology, sensitivities, and uncertainties, Bull. Seismol. Soc. Am. 95, 1575–1593. Scherbaum, F., J. Schmedes, and F. Cotton (2004). On the conversion of source-to-site distance measures for extended earthquake source models, Bull. Seismol. Soc. Am. 94, 1053–1069. Siddiqqi, J., and G. Atkinson (2002). Ground motion amplification at rock sites across Canada, as determined from the horizontal-to-vertical component ratio, Bull. Seismol. Soc. Am. 92, 877–884. Tavakoli, B., and S. Pezeshk (2005). Empirical-stochastic ground-motion prediction for eastern North America, Bull. Seismol. Soc. Am. 95, 2283–2296. Toro, G. R., N. A. Abrahamson, and J. F. Schneider (1997). Model of strong ground motions from earthquakes in central and eastern North America: Best estimated and uncertainties, Seismol. Res. Lett. 68, 41–57. Watson-Lamprey, J. A., and D. M. Boore (2007). Beyond SaGMRotI: Conversion to SaArb , SaSN , and SaMaxRot , Bull. Seismol. Soc. Am. 97, 1511–1524.
Department of Civil Engineering The University of Memphis Memphis, Tennessee 38152 (S.P., A.Z.)
Department of Seismology and Geophysics G&HES, Bechtel Power Corporation Frederick, Maryland 21703 (B.T.)
Manuscript received 27 May 2010