REPRESENTATION, PROCESSING, ANALYSIS, AND UNDERSTANDING OF IMAGES
Hybrid Features of Spatial Domain and Frequency Domain for Person Identification through Ear Biometrics1 F. Saleh, A. Hamdy, and F. Zaki Helwan University, Faculty of Engineering, Department of Communications, Electronics, and Computers e-mail:
[email protected],
[email protected],
[email protected] Abstract—Biometrics proved to be very efficient, more natural and easier for users than traditional methods of human identification. This paper presents an accurate biometric system based on human ear. Many features have been extracted in the spatial domain such as area of the ear, ear edge points, and widths of ear in different places. Those features have been extracted in the enrollment stages and stored as templates. Using a comparing technique such as Euclidean distance for each feature or for the whole features gives different correct recognition rates, which reaches 88.2%. Using spatial domain features as well as frequency domain features such as FFT and DCT coefficients raises our recognition rate to 92% of success. 100% of correct recognition can be achieved by using the average values of five samples instead of three samples for each person. DOI: 10.1134/S1054661809010052 1
1. INTRODUCTION
Biometrics refer to the automatic identification of a person based on his/her physiological or behavioral characteristics [4]. Biometrics techniques can potentially prevent unauthorized access to or fraudulent use of cellular phones, smart cards, desktop PCs, workstations, and computer networks [2]. A biometric system is essentially a pattern recognition system, which makes personal identification by determining the authenticity of a specific physiological or behavioral characteristic possessed by the user [1]. Biometrics method of identification is preferred over traditional methods involving passwords and PINs for various reasons: (1) The person to be identified is required to be physically present at the point of identification. (2) Identification based on biometric techniques avoids the need to remember a password or using ID [3]. 2. PROBLEM STATEMENT The problem here is to build a powerful biometric system for human identification based on ears. Only six images for the person are needed, so in a system working with 17 persons. 102 images [5] are needed for the whole system.
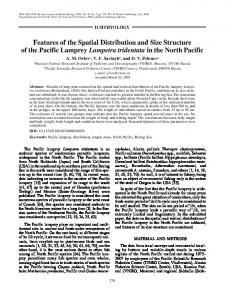
a prison are extracted, and storing these features for each person as a template. The second stage is the comparison stage: in this stage, the same features from an unknown sample are extracted, comparing them with the templates that have been stored, trying to identify this unknown sample. The features have been used in two domains: the spatial domain and the frequency domain, as discussed in the following sections. 4. SPATIAL DOMAIN FEATURES Many features have been extracted from ear images in the spatial domain; the area of the ear image, the four edge points of the ear and the width of the ear at different parts. 4.1. Area and Contour First, the area of the ear and the four edge points all together are extracted. The extraction of the area has been done from the gray level image, but the four edge points have been extracted through the contour of the ear. Figure 1 shows the gray level image and the contour of it.
3. THE PROPOSED TECHNIQUE Our system has been done through two stages; the enrollment stage in which features from three images of 1 The
article is published in the original.
Received August 11, 2008
Fig. 1. The gray level image and the contour of it.
ISSN 1054-6618, Pattern Recognition and Image Analysis, 2009, Vol. 19, No. 1, pp. 35–38. © Pleiades Publishing, Ltd., 2009.
36
SALEH et al.
Euclidean distance technique separately for each feature Person 1 Feature 1 Feature 2 Feature 3 Feature 4 Feature 5 Feature 6 Feature 7 Feature 8 Feature 9 Result
2
3
4
5
6
7
9
10
11
12
13
14
15
16
17
0
0
0
* 1
0
* * *
* * *
* * * 5
1
0
1
0
0
1
The four edge points have been identified as X, Y coordinates giving eight values for the four points. By adding the area of the ear, nine values are obtained and used as nine features for each person. The comparing technique used in this work is the Euclidean distance but for each feature separately, computed according to the following equation: D =
(sN – tN ) , 2
(1)
where D is Euclidean distance for each feature separately, s is sample’s feature, t is template’s feature, and N is feature’s number. This means every feature suggests a person from the 17 persons in the database and the person who has got large features suggestion will be the one of the unknown ear image. The table illustrates that technique for comparing. The table illustrates that person no. 1 has got large number of features; accordingly he is The correct recognition rate in % 100 90 80 70 60 50 40 30 20 10 0 5
8
10
15
20
25
30 35 40 45 50 No of segments widths
Fig. 2. The result of the widths for 9, 16, 24, and 49 segments.
0
0
0
0
1
selected as the right person. This technique gives about 60% of correct recognition. 4.2. Widths of Ear The second group of features in the spatial domain is the widths of the ear. This is done by segmenting the ear into numbers of segments and computing the width of each segment. Taking five steps between every two segments makes nine segments for the entire ear. Also, taking three steps between the segments makes 16 segments and so on. This means every time steps are changed between the segments, number of segments will be changed as well. In this work, we deal with 9, 16, 24, and 49 segment widths; as explained in the following steps: (1) Transform the gray level image into binary image. (2) Determine the edges of the ear, separating the ear from the background. (3) Segment the ear into number of segments according to the step—five steps make nine segments—9, 16, 24, and 49 segments are used. (4) Compute the width of each segment. (5) Compute the mean value of the widths of three images for the same person. (6) Store the result as a template. The comparing technique used with the widths is the Euclidean distance for the entire cluster: the entire widths for the person. This technique establishes up to 88.2% of the correct recognition. Figure 2 shows the result of different segments widths. 5. FREQUENCY DOMAIN FEATURES In the frequency domain, the Fast Fourier Transform coefficients and Discrete Cosine Transform coefficients are used as features.
PATTERN RECOGNITION AND IMAGE ANALYSIS
Vol. 19
No. 1
2009
HYBRID FEATURES OF SPATIAL DOMAIN AND FREQUENCY DOMAIN
37
Magnitude valus of FFT coefficients 3.0 2.5 2.0 1.5 1.0 0.5 0
500
1000
1500
2000 2500 FFT coefficients
Fig. 3. The FFT coefficients.
Fig. 4. The DCT coefficients.
5.1. FFT For the Fast Fourier Transform (FFT) the last 128, 256, and 512 coefficients are selected as features to be stored. Figure 3 shows the FFT coefficients. The following steps illustrate the procedure: (1) Transform the gray level image into one dimension matrix. (2) Transform the image using FFT. (3) Take the magnitude of the last FFT 128, 256, and 512 coefficients. (4) Calculate the mean values of the FFT coefficients. (5) Store these values as templates. The comparing technique that has been used is the Euclidean distance, and the correct recognition rate is less than 50%.
6. HYBRID FEATURES OF SPATIAL DOMAIN AND FREQUENCY DOMAIN The DCT coefficients features and the widths segments have been merged. DCT coefficients of 256 and 512 and the widths of 24 and 49 segments have been used. Using the Euclidean distance technique gives between 90.2 and 92% of correct recognition. The best result has been done by merging DCT coefficients of 256 and widths of 24 segments that gives 92% of correct recognition. All the templates used as database are based on the mean value of the features of three images for each person. However, if five images are used for each person in the enrollment stage instead of three images, this will give 100% of correct recognition using features of 256 DCT coefficients. Figure 5 shows the correct rec-
5.2. DCT In this work, the first Discrete Cosine Transform (DCT) coefficients are used as features. The first 256 and 512 DCT coefficients are selected. The following steps illustrate the procedure: (1) Transform the gray level image into binary image. (2) Transform the image using DCT as shown in Fig. 4. (3) Select the first two dimension DCT 256 and 512 coefficients. (4) Calculate the mean values of the DCT coefficients. (5) Store these values as templates. The comparing technique that has been used is the Euclidean distance, and the correct recognition rate is 90.2% for both 256 and 512 coefficients. PATTERN RECOGNITION AND IMAGE ANALYSIS
Vol. 19
The correct recognition rate in % 100 90 80 70 60 50 40 30 20 10 0 5 3.2 3.4 3.6 3.8 4.0 4.2 4.4 4.6 4.8 5.0 No. of images used in database Fig. 5. The correct recognition rate by using different numbers of images of a person as a template. No. 1
2009
38
SALEH et al.
ognition rate using different, numbers of images of a person as a template in database. 2.
7. CONCLUSIONS In this work, several trials have been conducted to achieve an accurate and a powerful biometric system based on the ear. It may be used as a secure system for entering buildings and different sorts of places. A database of 102 ear images for 17 persons is used, extracting many features and storing them as templates. Many features have been extracted in the spatial domain such as area of the ear, ear edge points, and widths of ear in different places. Using the Euclidean distance as a comparing technique with those features gives only 88.2% of success recognition. The recognition rate can be raised to 92% if hybrid features of frequency domain, as FFT and DCT coefficients, and spatial domain are used. Also, 100% of success recognition can be achieved by using five images instead of three images for a person as a template in the enrollment stage. REFERENCES 1. H.-K. Lammi, EAR BIOMETRICS (Lappeenranta University of Technology, Department of Information TechFarid Saleh. Graduated from Telecommunications and Electronics Department, Faculty of Engineering of Helwan University, Egypt in 2001. He is presently a M.Sc. student at the same university. His current research interests include image processing and pattern recognition.
3. 4. 5.
nology, Laboratory of Information Processing, Lappeenranta, Finland, 2003). L. Kuster, “An Overview of Biometric Technologies,” GSEC Practical Assignment, Version 1.4b Option 1 (2005). M. Burge and W. Burger, Ear Biometrics for Machine Vision (Johannes Kepler University, Department of Systems Science, Computer Vision Laboratory, Austria). M. Choras, “Ear Biometrics Based on Geometrical Feature Extraction,” Electronic Lett. Comput. Vision and Image Analysis 5 (3), 84–95 (2005). http://www.dcs.shef.ac.uk/miguel/papers/msc-thesis.html.
Alaa Hamdy. Was born in Giza in Egypt, on August 17, 1966. He graduated from the Telecommunications and Electronics Department, Faculty of Engineering and Technology of Helwan University, Cairo, Egypt in 1989. He received the M.Sc. degree in computer engineering from the same university in 1996 and the Ph.D. degree from the Faculty of Electrical Engineering, Poznan University of Technology, Poland in 2004. Currently he is working as a lecturer in the Faculty of Engineering of Helwan University. His special fields of interest include image processing, pattern analysis, and machine vision. Fathy Zaki. Is an associate professor of Microelectronics, Electronics Department, Faculty of Engineering of Helwan University.
PATTERN RECOGNITION AND IMAGE ANALYSIS
Vol. 19
No. 1
2009