Hybridising Heuristics within an Estimation Distribution Algorithm for Examination Timetabling Rong Qu*1, Nam Pham1, Ruibin Bai2, Graham Kendall1,3 1
Automated Scheduling, Optimisation and Planning, School of Computer Science University of Nottingham, Nottingham, NG8 1BB, UK *
[email protected] 2 School of Computer Science, University of Nottingham Ningbo, China Ningbo, 315100, China 3 University of Nottingham Malaysia Campus, Malaysia
Abstract This paper presents a hybrid hyper-heuristic approach based on estimation distribution algorithms. The main motivation is to raise the level of generality for search methodologies. The objective of the hyper-heuristic is to produce solutions of acceptable quality for a number of optimisation problems. In this work, we demonstrate the generality through experimental results for different variants of exam timetabling problems. The hyperheuristic represents an automated constructive method that searches for heuristic choices from a given set of low-level heuristics based only on non-domain-specific knowledge. The high-level search methodology is based on a simple estimation distribution algorithm. It is capable of guiding the search to select appropriate heuristics in different problem solving situations. The probability distribution of low-level heuristics at different stages of solution construction can be used to measure their effectiveness and possibly help facilitate more intelligent hyper-heuristic search methods. Keywords: estimation distribution algorithm; hyper-heuristic; exam timetabling; graph colouring
1 Introduction Within search methodologies, meta-heuristics have shown to be particularly effective for many combinatorial optimisation problems [21]. However, from a practical point of view, there are still challenging issues for practitioners to use meta-heuristics successfully. Firstly, meta-heuristics usually require complicated and crucial parameter tunings. These often demand intensive knowledge resulting in higher costs of implementation and maintenance. Secondly, meta-heuristics tend to be finely tuned for solving specific problems or even specific instances. This often leads to limited reusability for other problem domains or even other instances of the same problem. In fact, most meta-heuristics are designed only for a narrow class of a specific problem. For example, a meta-heuristic to construct examination timetables can be designed to effectively generate high quality timetables with respect to specific requirements supplied by a university. However, that meta-heuristic very likely requires significant adjustment to work effectively for other universities with different requirements. Thirdly, in many industries, there are requirements for quick solutions. Many meta-heuristics often require extensive research, development and parameter tuning. A more detailed discussion of these issues can be found in [10]. In early timetabling research, constraint based techniques and simple heuristics were widely studied. In constraint based techniques, problem specific constraints are modelled, and various propagation techniques are used to reduce the computational expense, leading to more efficient search. Such models with specific constraints are often not reusable for variants of the problems. In practice, many users thus often employ simple heuristics which are much easier to implement and adapt. However, such heuristics are often of inferior performance, and often cannot even produce feasible solutions to highly constrained problems. Therefore, there is a demand from many small and medium sized companies for cheaper problem solvers which are capable of producing good-enough solutions instead of high-cost, complex and domain-intensive systems. One such approach to address this issue is hyper-heuristics which are “an automated methodology for selecting or generating heuristics to solve hard computational search problems” [8]. Unlike many existing search methodologies which work in the search space of solutions, hyper-heuristics work in the search space of heuristics. Hyper-heuristic algorithms are operated on heuristics, at a higher level of abstraction. This is fundamentally different to meta-heuristics, where heuristics are used to guide neighbourhood moves or evolutionary operators to directly operate on solutions in the search space. This means there are two levels of
search in hyper-heuristics, one at the problem solution space, and the other at a higher level of heuristic space which then operates on the solution space. In our previous work [11], we have established the fundamental definitions of these two search spaces, which can have different representations (encoding), evolutionary or move operators, and an upper bound on the size of the search spaces. Hyper-heuristic research can be categorised in two main categories [8], namely heuristic-selection and heuristicgeneration. Heuristic-selection approaches use high-level search methodologies to choose from a set of given (usually simple) low-level heuristics to construct or improve a solution. Heuristic-generation approaches focus on generating novel heuristics whose components are building blocks or parts of known heuristics. This paper focuses on heuristic-selection based hyper-heuristics, which can be considered as either constructive or perturbative. Constructive methods build a complete solution from scratch through a number of decision steps. Constructive-based hyper-heuristics can be understood as methodologies that repeatedly select suitable constructive heuristics from a given set and apply them to the partial solution being constructed. Perturbativebased hyper-heuristics start with a complete solution, and then select from a given set of neighbourhood operators, and an acceptance criteria, to iteratively improve that solution. Compared to most of the problem specific meta-heuristics and constraint based techniques, hyper-heuristics represent a class of knowledge poor methods [17] with the aim of selecting appropriate heuristics from a predefined set of heuristics during the search, rather than examining specific information such as constraints in the problem. The success of hyper-heuristics depends on how they adapt a problem solving situation based on nondomain-specific information, and associate it with a number of given low-level heuristics, which then operate at the solutions of the problem. Examples of domain-independent criteria include computational time and previous choices of heuristics. Therefore, hyper-heuristics are often regarded as a search methodology of higher generality compared to other heuristics or meta-heuristics. They can help facilitate the development of systems which can operate on a range of related problems. Moreover, such systems can be deployed by non-specialised users who have little knowledge of the problem domain. This paper investigates a hyper-heuristic, based on estimation distribution algorithms, that is capable of generalising well over different problems. The exam timetabling domain is used as an experimental testbed due to its rich set of variants. The outline of this paper is as follows. Section 2 describes the exam timetabling problem and briefly reviews related work in exam timetabling including constructive hyper-heuristics. The proposed hyper-heuristic is presented in Section 3. Section 4 demonstrates experimental results on two variants of the exam timetabling problem, the uncapacitated exam timetabling problem and the graph colouring problem. Discussion on the capability of the hyper-heuristic in identifying the effectiveness of low-level heuristics is also provided in this section. Finally, Section 5 presents conclusions and future work.
2 The Exam Timetabling Problems Exam timetabling problems concerns assigning a set of exams: E = { e1, e2, ..., ee } into a limited number of ordered timeslots: T = { t1, t2, ..., tt }, subject to a set of constraints. Almost all institutions encounter challenging exam timetabling problems. The problems are often highly constrained, with a large number of different constraints which vary from institution to institution. Moreover, producing timetables manually becomes particularly hard in large educational institutions with hundreds or thousands of exams and students. Those challenges have motivated research effort to seek automated solutions to construct exam timetables and also develop approaches for different exam timetabling scenarios. The constraints for exam timetabling problems can be classified into two types: hard constraints and soft constraints which, in some cases, are in conflict with each other. Hard Constraints must be satisfied in order for a timetable to be feasible. An example of a common hard constraint is that a student cannot sit for two exams at the same time (student-conflict). Another common hard constraint is that the number of students must be less than or equal to the seating capacity of the assigned room. A timeslot that an exam e can be assigned in without causing any hard constraint conflict (i.e. no students in e are siting other exams in this timeslot) is called a valid timeslot for that exam. Soft Constraints are not compulsory but the degree of satisfaction of the soft constraints indicates the quality of solutions. The exam timetabling scenario in this paper has an objective of minimising the penalty caused by students taking exams too close together (exam-spread). The penalty of the timetable is calculated by the function given in the Appendix.
The exam timetabling problem with only the student-conflict constraint can be represented as a graph colouring problem [31], which can be defined as finding the smallest number of colours (the chromatic number) needed to obtain a feasible vertex colouring for a given graph. Feasible vertex colouring is a colouring where adjacent vertices connected by an edge are assigned different colours. The basic exam timetabling problem can be modelled by a graph representation, where exams are represented by vertices and the student-conflict hard constraint between two exams, so they should be assigned different timeslots, is represented by an edge between the corresponding vertices. If we associate each timeslot with a colour, then creating a conflict-free timetable is equivalent to constructing a feasible vertex colouring. However, all soft constraints are ignored in the graph colouring problem. This paper concerns both the uncapacitated exam timetabling problem and the graph colouring problem. The graph colouring optimisation problem is NP-hard [19], significant research effort has been devoted in timetabling to the design of approximate algorithms. These sacrifice the guarantee of optimality but produce good solutions in a reasonable amount of computational time. The most popular constructive algorithm, based on graph colouring, involves repeatedly making two simple decisions: exam-selection and timeslot-selection. Early approaches for exam timetabling focussed on using different exam-selection heuristics. Such heuristics represent different strategies to sort exams by their level of difficulty to assign them to timeslots in later stages. In each step, the most difficult exam (according to the order produced by the heursitics) will be selected and assigned to a timeslot that causes the least constraint penalty. However, there was no comparison between approaches until the introduction of a set of 13 exam timetabling benchmark instances by Carter [16]. Details of the Carter benchmark dataset can be found in the Appendix. In exam timetabling, room capacity is not usually seen as crucial, as additional seats or rooms can be added if needed. Even without the room capacity constraint, the Carter benchmark problems are difficult to solve, and is still widely studied in the scientific literature. We focus on Carter uncapacitated benchmark exam timetabling dataset in this research. We also evaluate our proposed algorithm on graph colouring problems to demonstrate their generality. Instead of designing a new algorithm or fine tuning an algorithm to achieve the best performance, we demonstrate that our algorithm, without much adaptation, is effective in addressing this different problem. Our future work may consider extensions and different research issues in the proposed algorithm to other problems. Since the introduction of the Carter benchmark dataset, many approaches have been proposed to solve exam timetabling problems. A comprehensive survey of automated search methodologies for exam timetabling on the Carter dataset can be found in [31]. Several methodologies have obtained the best results for one or more instances in the dataset. In [15] a greedy scheduler is used to create a feasible solution which is then iteratively improved using two local-search procedures, a penalty decreaser and a penalty trader. A case based reasoning methodology is developed in [11] to select appropriate exam-selection heuristics during the solution construction process. A late acceptance strategy is proposed in [7] to improve timetables by comparing the new solution and the solution several steps earlier in the search. In [22] the Carter benchmark problems have been studied from a different aspect, where patterns of high and low quality timetables are recognised by neural networks to speed up the evaluation. The method was also tested on nurse rostering problems. Recently, there has been an increased research attention in developing hyper-heuristics for exam timetabling problems, both constructively [1][2][8][28][29][30][32][33] and perturbatively [6][8][25]. Hyper-heuristics in other domains can be found in a comprehensive survey [8]. In this paper, we focus on hyper-heuristics that work on constructive exam-selection heuristics. We review below the hyper-heuristics applied to the Carter dataset for comparison purposes. A graph-based hyper-heuristic framework (GHH) is introduced in [11]. A tabu-search is used at the high level to search for good sequences of low-level exam-selection heuristics. Heuristics are applied sequentially to construct a solution. Within the same framework, an automated heuristic construction approach is presented in [30] to adaptively hybridise Saturation Degree heuristic with Largest Weighted Degree heuristic at different stages of the solution construction. Promising results have been obtained using these hybridisations in short computational times. The GHH framework is extended in [29] to add local improvements to timetables both during and after the process of selecting heuristics. The authors also investigated and analysed several different high-level search techniques in GHH. In [34], in addition to graph colouring heuristics, bin packing heuristics have also been integrated as low level heuristics in the hyper-heuristic framework for solving the International Timetabling Competition problems with room capacity constraints. Within a constructive hyper-heuristic in [33], graph colouring heuristics have been
utilised to calculate a difficulty index, which is used to order exams. The selected exams are then scheduled into a timeslot chosen by using a roulette wheel selection mechanism. In [2][4] fuzzy weights are used on a pair of ordering criteria to determine the difficulty of exams which are sorted and scheduled in constructing the timetable solutions. In [3] the fuzzy strategy is extended to three ordering criteria. The effects of altering fuzzy rules instead of fixing them are investigated. In [26] crossover and mutation operators are employed within a genetic programming approach to evolve a population of sequences of exam-selection heuristics. This paper investigates the performance of a hyper-heuristic based on estimation distribution algorithms (EDA). We analyse the algorithm by utilising Carter’s benchmark exam timetabling dataset and its graph colouring variant. The EDA based hyper-heuristic has been applied to the two different problems without any fine tuning at the high level, and with the minimum adaptation of low level heuristics to demonstrate the generality of the algorithm. Results are promising for both problems compared against the existing approaches which are tailored for the problems.
3 The Estimation Distribution Algorithms-based Hyper-heuristic (EDA-HH) In this work, we have developed a new hyper-heuristic based on the idea of estimation distribution algorithms (EDA) [24]. EDA is a branch of evolutionary algorithms that replaces genetic operators (crossover and mutation) with the estimation of gene distribution and samples new individuals from that distribution. The aim is to avoid the likely disruption of building blocks caused by genetic operators in favour of explicit modelling by exploiting the gene distribution of promising individuals. In our proposed EDA based hyper-heuristic (EDA-HH) framework, the EDA, at the higher level, searches for sequences of low level exam-selection heuristics. Each of these sequences of genes, where each gene represents one low-level heuristic, is used to construct a timetable. These heuristic sequences are generated based on the knowledge collected during the evolution. More details can be found in Section 3.3. The motivation of applying a high-level search mechanism based on EDA are as follows. In our previous work [11], it was observed that the way a high level search performs in the search space of constructive low level heuristics is not crucial as long as the high level search is able to explore large regions of the search space. In our proposed EDA-HH, a sequence of promising low level heuristics are sampled and evolved based on the estimation of gene distribution of promising individuals i.e. the collected knowledge, rather than by search algorithms. This novel idea is different from those studied in our previous work [11][13][30]. During the evolution of EDA, the estimation of gene distribution naturally provides insights into how low level heuristics are hybridised. This helps not only to analyse the effectiveness of low-level heuristics, but also to design more intelligent search mechanisms which explore the search space more effectively and adaptively based on knowledge collected during the evolution. In our previous work [11][13][30], only the resulting sequences of low level heuristics are available, which provide rather limited insights of the evolution process.
3.1 Heuristic-Choice Solution Representation and Fitness Measure The hyper-heuristic approach in this paper focuses on the search space of exam-selection heuristics. It follows many other approaches in the literature where a heuristic-choice solution is represented by a sequence of lowlevel heuristics. Note that the following terms are used interchangeably within the context of our EDA-HH approach. An individual is equivalent to a sequence or a heuristic choice solution. A gene is equivalent to a lowlevel heuristic. Each low-level heuristic provides one decision on the most difficult exam to be scheduled. The selected exam will be scheduled into a timeslot using a fixed strategy depending on the problem. After all low-level heuristics in a sequence are consecutively applied, we obtain a complete solution. In this paper, the fitness of a heuristicchoice solution in the high-level search is simply set as the evaluation of the solution obtained at the low level. For the uncapacitated exam timetabling problem, with the student-conflict hard constraint and the exam-spread soft constraint, the strategy is to choose a timeslot for a selected exam that causes no conflict and the least penalty. The penalty is calculated based on violations of the soft constraints. If there are ties, the strategy will
choose the one that reduces the least number of valid timeslots for those unassigned neighbours of the remaining exams. The evaluation of a feasible timetable in the Carter dataset is given in the Appendix. If a feasible timetable cannot be found (i.e. the assignment of a selected exam e to a timeslot t causes conflict at some point during solution construction, due to students in e already sitting other exams scheduled in t), the fitness for that heuristic sequence s will be calculated as f(s) = M + (L - p), where M is a large value, i.e. greater than any possible evaluation of a feasible solution; L is the length of heuristic sequence s while p represents the first position in s where infeasibility occurs. For the exam timetabling problem with only the student-conflict hard constraint (i.e. the graph colouring problem), the fitness of the timetable is the number of timeslots which can fit in all exams without causing violations of the hard constraints. When an exam is selected, we identify the minimum number of remaining valid timeslots for its neighbours, Tmin. The timeslot-selection strategy will select a timeslot with the highest Tmin. Ties are broken by choosing the timeslot which reduces the least number of valid timeslots for other neighbours. If there is no valid timeslot for an exam, the total number of timeslots is increased by one. However, experimental observations show that a significant number of sequences produce the same fitness, i.e. timetables using the same number of timeslots. Using the above evaluation function provides little distinction on the quality of solutions. Therefore, we employ an evaluation function for graph colouring proposed by Culberson (1992). It concerns not only the number of colours, k, but also the colouring sum in a given colouring π: f ( ) V k vV (v) where V is the set of all vertices and π(ν) is the colour assigned to vertex ν. This evaluation function prefers solutions having larger size colour classes, thus, reducing smaller size colour classes and the overall number of colours used. Colour class is defined as a set of all vertices with the same colour. This function also takes into account information of the colouring, not just the number of colours in the colouring.
3.2 Low-level heuristics Apart from those traditional constructive exam-selection heuristics in Table 1, in EDA-HH we also include a set of new heuristics, namely H12, H13, H22, H23, H32, H33, H42, H43, H52, H53 into the set of low-level heuristics. H12, H13 use the same ordering strategy as H1 in Table 1, but take the second and the third vertex respectively in the ordering list instead of the first one. The same idea applies to the other new heuristics based on H2, H3, H4 and H5. A larger set of low-level heuristics provides a larger search space of heuristics and improves the decision diversity. Table 1 Constructive low-level heuristics for the exam timetabling problems. H1 H2 H3 H4 H5
Largest Degree (LD) - Exam in conflict (i.e. share common students) with the highest number of other exams is considered to be more likely to cause conflict if deferred until later. Largest Weighted Degree (LWD) – Exam in conflict with the highest number of other exams, weighted by the number of students in conflict, are more likely to cause high penalty. Saturation Degree (SD) - Exam with the least number of valid timeslots should be scheduled earlier since it may not have any timeslots available at a later stage. Largest Enrolment (LE) - Exam with largest enrolment should be selected first since its high number of students may cause high penalty if scheduled at a later time. Largest Coloured Degree (LCD) - Exam with the largest number of conflicts with those already scheduled would be difficult to schedule since it would have less choice of valid timeslots.
For the uncapacitated exam timetabling problem, the set of low-level heuristics consists of all 15 exam-selection heuristics. For the graph colouring problem, the set includes only 9 heuristics (H1, H12, H13, H3, H32, H33, H5, H52, H53). Those using the ordering strategies of H2 and H4 are excluded as there is no corresponding penalty from the soft constraint in the graph colouring problem.
3.3 High-level Search Methodologies Our high-level search methodology is based on a Univariate Marginal Distribution Algorithm (UMDA) [24] one of the simplest EDA in the literature. It assumes no dependency between genes in an individual, thus is easy to implement compared with more complicated EDAs. Future work on more advanced EDAs, however, represents a promising research direction. Unlike in a standard UMDA, we estimate the distribution of blocks of genes, instead of a single gene, in individuals. The selection of individual genes (heuristics), without considering the search process before and afterwards, is not likely to be much use in constructing promising timetables. We therefore divide an individual into blocks of genes, i.e. blocks of heuristics in sequences which correspond to stages of solution construction.
The pseudo-code for EDA-HH is showen in Algorithm 1. In EDA-HH, the stopping condition is either a preassigned number of generations or a set running time. In step 3, the probability of heuristic i appears in stage j, pij, is calculated using the Laplace correction (addition of 1 on the numerator, respectively) to avoid situations where a low-level heuristic disappears in a particular stage in all sequences in the previous generation. Algorithm 1. The EDA-HH Framework Generate a population of N random sequences of length L. Each stage contains a fixed number of genes Ls (with the exception in the last stage). Repeat 1. Evaluate the population. 2. Use tournament selection of size TOURx to select Nselect sequences of the population. 3. pij represents the probability that the jth low-level heuristic appears in the ith stage of the Nselect selected sequences. It is estimated as: N select ei k ( X t j) 1 k 1 t s i pij N select Ci H
where 0 ≤ i ≤ (L - 1) / Ls; 0 ≤ j ≤ H, where H represents the number of low-level heuristics; Ci represents the total number of low-level heuristics needed for the ith stage, which equals to Ls with a possible exception in the last stage; si and ei represent the first and last position of the ith stage in a sequence: si = i × Ls ei = min(L – 1, (i +1) × Ls – 1); δk (Xt = j) equals 1 if the jth low-level heuristic appears at position t of the kth selected sequence; equals 0 otherwise. 4. Generate N new sequences using the probability distribution estimated in step 3. The probability of a gene in the ith stage receiving value j is pij. Replace all sequences in the old generation with these newly generated sequences. Until the stopping condition is met.
The aim of this hyper-heuristic is not to solve a specific class of problems. By online learning only the probability of low-level heuristics being used at different stages of solution construction, the high-level search relies only on non-domain-specific information, thus can be generalised to different problems. We demonstrate in the next section the generality of our EDA-HH by applying it to two variants of exam timetabling problems.
4 Experimental Results and Discussions The EDA-HH approach has been tested on the 13 Carter benchmark instances (see the Appendix) in both the uncapacitated exam timetabling and the graph colouring context.
4.1 Experimental Setup To demonstrate the generality of the hyper-heuristic approach, the parameters for the high-level search are the same across all experiments. Some parameter values (including the population size, number of generations, and tournament size) were selected empirically by performing several trial runs. We then carry out extensive experiments on six sets of parameters presented in Table 2. In all experiments, EDA-HH is executed 10 times for each instance to conduct statistic analysis. The algorithm was implemented in Java using JDK 1.6.0 and experiments were conducted on a PC Pentium IV 3.4GHz with 2GB memory. Table 2 EDA-HH parameter values. TOURx: tournament size of x% of the population. Parameters Population N – No. of Generations G Selection amount Nselect Tournament size Lblock Maximum running time
EDA-HH-TOUR6
6% of N
EDA-HH-TOUR9 EDA-HH-TOUR12 (100 – 20000), (1000 – 2000) 20% of N 9% of N 12% of N 10 24 hours
4.2 Results on the Uncapacitated Exam Timetabling Problem 4.2.1 Comparisons of Different Variants of EDA-HH
In all runs using any set of parameters, the hyper-heuristic found feasible solutions. Table 3 presents the best, the average and the standard deviation of penalty cost, with the average running time of each run on the Carter uncapacitated examination timetabling benchmark instances. Table 3 Experimental results on the Carter uncapacitated exam timetabling benchmark instances. Bold values represent the best results obtained from our EDA-HH. EDA-HH (100-20000)
EDA-HH (1000-2000)
Approx. Average Instance Running TOUR6 TOUR9 TOUR12 TOUR6 TOUR9 TOUR12 Time Best Sd. Avg. Best Sd. Avg. Best Sd. Avg. Best Sd. Avg. Best Sd. Avg. Best Sd. Avg. (hours) car91 I 5.13 0.05 5.17 5.14 0.01 5.17 5.13 0.02 5.16 4.98 0.02 5.00 4.95 0.02 4.99 4.96 0.03 5.00 10.05 car92 I 4.36 0.02 4.38 4.33 0.02 4.36 4.29 0.02 4.33 4.12 0.03 4.16 4.16 0.03 4.17 4.09 0.03 4.16 6 ear83 I 36.41 0.06 36.65 35.93 0.23 36.37 35.91 0.22 36.30 35.11 0.37 35.59 34.99 0.35 35.38 34.97 0.38 35.56 1.03 hec92 I 11.59 0.15 11.79 11.75 0.08 11.85 11.73 0.10 11.85 11.25 0.10 11.34 11.11 0.10 11.32 11.25 0.11 11.37 0.33 kfu93 I 14.93 0.22 15.25 14.81 0.15 15.12 14.75 0.16 15.11 14.09 0.32 14.49 14.19 0.33 14.50 14.15 0.35 14.32 1.93 lse91 10.97 0.16 11.12 10.91 0.11 11.05 10.89 0.11 11.06 10.77 0.08 10.89 10.77 0.09 10.90 10.71 0.11 10.87 1.64 pur93 4.78 0.07 4.89 4.78 0.06 4.91 4.76 0.08 4.9 4.76 0.05 4.81 4.73 0.06 4.77 4.74 0.08 4.75 24 rye92 9.86 0.15 10.03 9.87 0.13 10.03 9.9 0.12 10.02 9.23 0.10 9.31 9.2 0.12 9.33 9.25 0.15 9.32 2.95 sta83 I 157.64 0.23 157.95 157.82 0.12 157.96 157.81 0.22 157.97 157.75 0.12 157.92 157.81 0.12 157.92 157.76 0.15 157.91 0.58 tre92 8.5 0.04 8.56 8.49 0.03 8.53 8.51 0.04 8.54 8.28 0.02 8.31 8.27 0.05 8.34 8.29 0.06 8.33 1.91 uta92 I 3.43 0.02 3.45 3.43 0.02 3.45 3.43 0.03 3.44 3.35 0.02 3.37 3.33 0.04 3.36 3.34 0.06 3.36 8.27 ute92 26.77 0.26 27.06 26.91 0.24 27.19 27.05 0.21 27.21 26.18 0.26 26.79 26.68 0.32 26.85 26.68 0.39 26.82 0.61 yor83 I 40.23 0.79 41.11 40.45 0.63 41.26 40.81 0.59 41.26 38.25 0.39 38.79 37.88 0.48 38.58 38.31 0.45 38.91 1.02
Table 3 shows a clear preference to use a larger population size with smaller number of generations in EDAHH. With population of 1000, tournament selections of TOUR6, TOUR9 and TOUR12 obtain the best results on 2, 7 and 3 instances, respectively. A Students’ t-test on TOUR9 and TOUR12 shows no statistical difference. We therefore employ TOUR9 in our analysis in Section 4.3. The standard deviation among different variants of EDA-HH is similar. Among different instances, the standard deviation ranges [0.01-0.79], and is instance dependent. EDA-HH has different computational times for different instances. As the same number of evaluations (100 × 20000, 1000 × 2000) has been used in EDA-HH with different population sizes, there is no significant difference over the average running time. Among different tournament selections TOUR6, TOUR9 and TOUR12, TOUR6 has slightly shorter computational times when compared with TOUR9 and TOUR12. 4.2.2 Comparisons of EDA-HH Against the Best Approaches in the Literature We also compare our hyper-heuristic with other hyper-heuristics tested on the same benchmark dataset in the literature. The main objective of a hyper-heuristic algorithm is to raise the level of generality over all instances rather than fine tuning the algorithms to find the best solution for some instances. Thus, we evaluate all hyperheuristic approaches by calculating their average percentage differences to the best results reported in the literature. The algorithms producing the best results for the 13 uncapacitated exam timetabling problem instances are listed in Table 4 and descriptions of the algorithms can be found in Section 2. Table 4 Best results reported in the literature on the Carter uncapacitated exam timetabling benchmark. Bold font indicates best results. ‘-’ represents the corresponding instance is not tested. Instance car91 I car92 I ear83 I hec92 I kfu93 I lse91 pur93 rye92 sta83 I tre92 uta92 I
Caramia et al. (2001) 6.6 6.0 29.3 9.2 13.8 9.6 3.7 6.8 158.2 9.4 3.5
Yang and Petrovic (2005) 4.5 3.93 33.7 10.83 13.82 10.35 8.53 158.35 7.92 3.14
Burke and Bykov (2008) 4.58 3.81 32.65 10.06 12.81 9.86 4.32 7.93 157.03 7.72 3.16
ute92 yor83 I
25.39 36.35
24.4 36.2
24.79 34.78
Table 5 presents the soft constraint penalty costs for EDA-HH and other hyper-heuristic approaches. As described in Section 2, these approaches work on the search space of heuristics. They either search for good combinations of low-level heuristics and apply them sequentially, or find good combinations of ordering criteria to measure exam difficulty. Table 6 shows the average percentage differences of the hyper-heuristic approaches to the best results reported in the literature. The approaches in Tables 5 and 6 include the following: (1) The tabu-search developed in [11] (2) The linear combination of ordering criteria by [14] (3) The automated heuristic construction using heuristic hybridisation [30] (4) Four different high-level search techniques based on local search [29] (5) The fuzzy logic system on a pair of ordering criteria in [2] (6) The fuzzy logic system with tuning [2] (7) The extended fuzzy logic system on three ordering criteria [3] (8) The evolutionary algorithm on variable-length sequences [26] (9) The approach that combines heuristics as tie-breakers [27] (10) The genetic programming to evolve functions to order exams [28] From Tables 5 and 6, the EDA-HH has produced promising results over all instances compared to the best results reported in the literature for each of the instances. It also demonstrates high generality over all instances compared to other hyper-heuristic approaches. We obtained the lowest average percentage differences compared to the best results cited in the literature. In the literature, timetabling problems have been extensively studied since 1996 [31]. Different algorithms have been developed on different platforms over the years, thus it is difficult to compare computational times. It is also recognized that computing time is not a crucial issue in timetabling. Universities often spend days or even weeks preparing timetables before the semesters. Therefore, papers published in the literature often do not cite the computing time of the algorithms being compared. We therefore do not compare computational time of all the algorithms being compared. Table 5. Penalty costs for hyper-heuristic approaches on the Carter uncapacitated exam timetabling benchmark. Bold font indicates best results from hyper-heuristic approaches. ‘-’ represents the corresponding instance is not tested. Instance Best reported EDA-HH (1) (2) (3) car91 I 4.5 5.36 5.03 5.11 4.95 car92 I 3.81 4.53 4.22 4.32 4.09 ear83 I 29.3 37.92 36.06 35.56 34.97 hec92 I 9.2 12.25 11.71 11.62 11.11 kfu93 I 12.81 15.2 16.02 15.18 14.09 lse91 9.6 11.33 11.15 11.32 10.71 pur93 3.7 4.73 rye92 6.8 9.42 9.2 sta83 I 157.03 157.64 158.19 158.86 158.88 tre92 7.72 8.75 8.37 8.52 8.27 uta92 I 3.14 3.33 3.88 3.37 3.21 ute92 24.44 28.01 27.99 28.0 26.18 yor83 I 34.78 41.37 39.53 40.71 37.88
(4) 5.3 4.7 35.54 12.23 15.09 12.71 159.2 8.67 3.32 30 40.24
(5) 5.29 4.56 37.02 11.78 15.81 12.09 10.35 160.42 8.67 3.57 27.78 40.66
(6) 5.29 4.54 37.02 11.78 15.8 12.09 10.38 160.42 8.67 3.57 28.07 39.80
(7) 5.19 4.32 36.16 11.6 15.03 11.35 9.75 158.64 8.47 3.52 27.55 39.25
(8) 36.74 11.55 14.22 10.90 9.35 158.22 8.48 26.65 41.57
(9) 4.97 4.28 36.86 11.85 14.62 11.14 4.73 9.65 158.33 8.48 3.4 28.88 40.74
(10) 37.39 11.43 158.38 27.31 39.96
Table 6. Percentage differences between hyper-heuristic approaches and the best reported results in the literature on the Carter uncapacitated exam timetabling benchmark. ‘-’ represents the corresponding instance is not tested. Instance car91 I car92 I ear83 I hec92 I kfu93 I lse91 pur93 rye92
EDA-HH 10.00 7.35 19.35 20.76 9.99 11.56 27.84 35.29
(1) 19.11 18.90 29.42 33.15 18.66 18.02 -
(2) 11.78 10.76 23.07 27.28 25.06 16.15 38.53
(3) 13.56 13.39 21.37 26.30 18.50 17.92 -
(4) 17.78 23.36 21.30 32.93 17.80 32.40 -
(5) 17.56 19.69 26.35 28.04 23.42 25.94 52.21
(6) 17.56 19.16 26.35 28.04 23.34 25.94 52.65
(7) 15.33 13.39 23.41 26.09 17.33 18.23 43.38
(8) 25.39 25.54 11.01 13.54 37.50
(9) 10.44 12.34 25.80 28.80 14.13 16.04 27.84 41.91
(10) 27.61 24.24 -
sta83 I tre92 uta92 I ute92 yor83 I Average
0.39 7.12 6.05 7.12 8.91 13.21
0.74 13.34 23.57 14.61 18.95 18.95
1.17 8.42 7.32 14.53 13.66 16.48
1.18 10.36 2.23 14.57 17.05 14.22
1.38 12.31 5.73 24.06 15.70 18.61
2.16 12.31 13.69 13.67 16.91 20.99
2.16 12.31 13.69 14.85 14.43 20.87
1.03 9.72 12.10 12.73 12.85 17.13
0.76 9.84 9.04 19.52 16.91
0.83 9.84 8.28 18.17 17.14 17.81
0.86 11.74 14.89 15.87
4.3 Results on the Graph Colouring variant 4.3.1 Comparisons of Different Variants of EDA-HH Table 7 shows the best and average number of required colours with the average running time on the dataset. We also compare our EDA-HH with the results obtained by using a hyper-heuristic that randomly selects heuristics (RS-HH). Table 7. Experimental results on the Carter graph colouring benchmark. Underlined and bold instances are easy and hard instances, respectively. Bold values represent the best results obtained from our EDA-HH.
Instance
car91 I car92 I ear83 I hec92 I kfu93 I lse91 pur93 rye92 sta83 I tre92 uta92 I ute92 yor83 I
RS-HH Approx. (2*106 Max Average evaluations TOUR6 TOUR6 Clique Running with time (Battiti, 2001) limit = Best Avg. Best Avg. Best Avg. Best Avg. Best Avg. Best Avg. Time (hours) 24hrs) 28 28 28 28 28 28 11.25 29 23 28 28 28 28 28 28 28 28 28 28 28 28 27 27 27 6.76 28 24 27 27 27 22 22 22 22 22 22 1.08 22 21 22 22 22 22 22 22 17 17 17 17 17 17 0.21 17 17 17 17 17 17 17 17 19 19 19 19 19 19 3.48 19 19 19 19 19 19 19 19 17 17 17 17 17 17 2.89 17 17 17 17 17 17 17 17 32 32 32 32 32 32 24 33 29 32 32 32 32 32 32 21 21 21 21 21 21 3.12 21 21 21 21 21 21 21 21 13 13 13 13 13 13 0.51 13 13 13 13 13 13 13 13 20 20 20 20 20 20 1.87 20 20 20 20 20 20 20 20 29 29 29 29 29 29 9.24 30 26 29 29 29 29 29 29 10 10 10 10 10 10 0.7 10 10 10 10 10 10 10 10 19 19 19 19 19 19 18 18 18 1.21 19 18 18 18 18 EDA-HH (100-20000) TOUR9 TOUR12
EDA-HH (1000-2000) TOUR9 TOUR12
It is well known that the size of the maximum clique of a graph can be used as the lower bound to find the chromatic number of that graph [19]. A clique in a graph is a subset of vertices where every two vertices are connected. The maximum clique found by a reactive local search technique [5] on this benchmark is also listed in Table 7 for comparison purposes. For 8 easy instances underlined in Table 7, the optimal colourings can be found after generating only a few sequences. Although the best found result for ear83 I is greater than the maximum clique, we know that it is the optimal colouring by running a complete search on the solution search space. For the remaining five hard instances, we observe the same superiority of evolving sequences on a larger population as for the uncapacitated exam timetabling problem. Moreover, EDA-HH is always at least as good as the hyper-heuristic that randomly selects heuristics. This demonstrates the effectiveness of the learning process from the estimation distribution algorithm in the high-level search. 4.3.2 Comparisons of EDA-HH Against the Best Approaches in the Literature Table 8 shows the EDA-HH performance in comparison with other constructive approaches in the literature including the following: (1) The constructive approach by [16] (2) The sequential construction method by [15] (3) The automated heuristic construction using heuristic hybridisation [30] EDA-HH obtained better results than the best results reported in the literature for four hard instances.
Table 8. The minimum number of colours found by constructive approaches on the Carter graph colouring benchmark. Bold values indicate new best solutions while optimal results are underlined. ‘-’ represents the corresponding instance is not tested. Instance car91 I car92 I ear83 I hec92 I kfu93 I lse91 pur93 rye92 sta83 I tre92 uta92 I ute92 yor83 I
EDA-HH 28 27 22 17 19 17 32 21 13 20 29 10 18
(1) 28 28 22 17 19 17 35 21 13 20 32 10 19
(2) 28 28 22 17 19 17 36 21 13 20 30 10 19
(3) 30 29 22 17 19 17 13 20 31 10 19
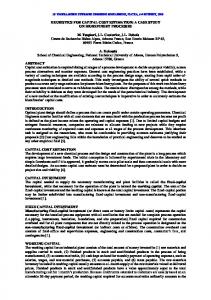
4.4 An Observation on the Probability Distribution Learning Capability in EDA-HH With a larger set of low-level heuristics, hyper-heuristics are likely to more effectively explore larger regions of the search space and eventually find better solutions. However, this is at the cost of longer computational times. On the other hand, given a shorter computational time, on a smaller set of effective low-level heuristics, hyperheuristics are more likely to achieve better results. By selecting a subset of effective low-level heuristics during the evolution, the intensification and diversification of the search can be adaptively adjusted. The issue here lies on the selection of low-level heuristics, at different stages of the evolution. We further investigate EDA-HH to understand its learning capability. This could help facilitate the design of more intelligent hyper-heuristics in the future to adaptively balance between the performance and computational time demands. During the evolution of EDA-HH, pij (see Algorithm 1) represents the probability of low level heuristic j which appearing in stage i in the promising results. This probability distribution pij thus represents useful information and knowledge of which effective low level heuristics are employed in which stage. Our EDA-HH hyperheuristic is thus capable of naturally identifying the effectiveness of specific low-level heuristics by simply examining the probability distribution obtained. We carry out two experiments to examine the learning ability of EDA-HH to learn effective and ineffective heuristics at the end of evolution. It is worth noting that by examining the probability distribution during the evolution, more knowledge could be learned to manage the diversification and intensification of the search. This remains interesting and challenging research issues for our future work. 4.4.1 Probability Distribution of the Best Results Figure 1 shows the plots of the probability distribution of low-level heuristics from the runs which obtain the best results for four sample instances: hec92 I, sta83 I, ute92 and yor83 I. To obtain generally useful knowledge, we group related low level heuristics (i.e. H1, H1 2, H13 as group of H1, and H2, H22, H23 as group H2, etc.). The probability of a heuristic in pij (e.g. Saturation Degree – H1) is represented by the summed probability of its related heuristics. This probability distribution is recorded after the last generation of the evolutionary process. In Figure 1, the probability at each stage on a curve represents the average probability of its last five stages. From Figure 1, we can observe that saturation degree is an effective heuristic for the exam timetabling problem over a large period of solution construction. However, it is rarely used in the early stages. For instance sta83 I, the saturation degree heuristic is not particularly stronger than other low-level heuristics. This can be illustrated by the fact that in the early stage of solution construction, almost all timeslots are available, thus saturation degree which measures the remaining feasible timeslots cannot distinguish the difficulty of scheduling exams into the timetable, thus is not an effective heuristic in the early stages. Our EDA-HH is able to automatically learn this by evolving the probability distribution in pij.
Figure 1. Plots of the final probability distribution of low-level heuristics obtained for the exam timetabling instances hec92 I, sta83 I, ute92 and yor83 I.
Figure 2 presents the probability distribution of low-level heuristics from the runs which obtain the best results of four hard graph colouring instances: car91 I, car92 I, uta92 I and yor83 I. This probability distribution is recorded similarly as for the exam timetabling problem. The charts support the argument that different heuristics are suitable for different stages of the colouring process. Saturation degree has proven to be among the most preferred heuristics for the graph colouring variant. However, applying it at the beginning of the colouring process is likely to produce a significant number of ties. Largest degree is most likely to be chosen at the very beginning of a colouring. Note that this observation applies to all other instances of the benchmark.
Figure 2. Plots of the probability distribution of heuristics at the end of the evolutionary process for the hardest graph colouring instances in the Carter dataset.
4.4.2 Adaptive Learning of Probability Distribution in EDA-HH To demonstrate the learning ability of EDA-HH, we conduct experiments on the car92 I graph colouring instance with the parameter settings of EDA-HH-TOUR9 (1000-2000). This EDA-HH setting was shown to perform well compared to the others in Section 3.2.1. In the first experiment, we include only the Largest Degree heuristic (H1) and nine other heuristics based on the Saturation Degree heuristic (H3, H32 ... H39) as the low level heuristics. Figure 3(a) shows the probability distribution obtained on the largest degree heuristic at each stage at the end of the evolutionary process. Although the largest degree heuristic is placed into a set of many saturation degree based heuristics, EDA-HH still learned to select it frequently at the very beginning of the colouring process. Similarly, the second experiment is conducted on the pool of nine largest degree based heuristics (H1, H12 ... H19) and only one saturation degree heuristic (H3). Even being put into a set of nine largest degree based heuristics, the saturation degree heuristic can still be chosen regularly by EDA-HH at the appropriate stages of the colouring process. Figure 3(b) illustrates this learning ability, especially from stages 4 to 16. In graph colouring, the decisions to select difficult vertices in that early part have a strong influence to the overall colouring.
(a)
(b)
Figure 3. The learning capability of EDA-HH on the selection of appropriate low-level heuristics at different stages.
5 Conclusions and Future Work In this paper we have developed a simple yet effective EDA-based hyper-heuristic. The algorithm was tested on 13 benchmark instances for both the uncapacitated exam timetabling problem and the graph colouring problem. The quality of solutions produced by EDA-HH are competitive to other hyper-heuristic approaches and was found to generalise well over both problems and all instances. Given that our EDA-HH involves only combining constructive heuristics without using back-tracking or iterative local improvement, we found the results encouraging. Moreover, EDA-HH is also capable of learning which heuristic is more suitable than the others for specific problem solving situations. There are several directions for our further research: Integrating simple backtracking or local improvement into the evolutionary process to further improve the performance. Further investigating the probability distribution of the low level heuristics across other problem domains. Investigating a hyper-heuristic that adjusts the intensification and diversification in the high-level search by removing or adding low-level heuristics. Implementing more complex estimation distribution algorithms at the high level, which take into account the dependency between stages of heuristic sequences.
Appendix – The Carter Benchmark Dataset The Carter examination timetabling benchmark dataset [16] (publicly available at http://www.cs.nott.ac.uk/~rxq/data.htm) is one of the most widely tested sets in timetabling research community. Since its introduction in 1996, it has attracted much research effort from the community. During the years, researchers are reporting the best results obtained along with the development of advanced algorithms. This dataset still remains an interesting challenge as optimal solutions for all instances have not been found yet. Therefore, we evaluate our method on this dataset to compare results against many other existing methodologies. Table A-1 shows characteristics of the instances. Table A-1 Details of the Carter benchmark dataset [16][31]. Instances car91 I car92 I ear83 I hec92 I kfu93 I lse91 pur93 rye92 sta83 I tre92 uta92 I ute92 yor83 I
No. of Exams 682 543 190 81 461 381 2419 482 139 261 622 184 181
No. of Students 16925 18419 1125 2823 5349 2726 30029 11483 611 4360 21266 2749 941
Enrolments 56877 55522 8109 10632 25113 10918 120681 45051 5751 14901 58979 11793 6034
Density 0.13 0.14 0.27 0.42 0.06 0.06 0.03 0.07 0.14 0.18 0.13 0.08 0.29
Timeslots 35 32 24 18 20 18 42 23 13 23 35 10 21
Two versions of the dataset have been circulated under the same name over the last ten years. We used the naming convention provided in [31]. An extensive survey is also provided in [31] on all search methodologies with associated best reported results for this dataset. The hard constraint requires that any two exams having common students must be assigned to two different timeslots. The soft constraint concerns the spread of exams for students. If two exams are assigned into two timeslots ti and tj, then each student taking both of these exams will cause a penalty of: 25-|i-j| if 0 < | i – j | ≤ 5. The objective is to minimise the soft constraint penalty cost: total_penalty / number_of_students. This objective represents a preference to timetables where fewer students have to take exams too close together.
References [1]. AHMADI, S., BARRONE, P., CHENG, P., BURKE, E. K., COWLING, P., MCCOLLUM, B. (2003) Perturbation based variable neighbourhood search in heuristic space for examination timetabling problem. In Proceedings of Multidisciplinary International Scheduling: Theory and Applications (MISTA 2003), 155–171. [2]. ASMUNI, H., BURKE, E. K. & GARIBALDI, J. M. (2005) Fuzzy Multiple Ordering Criteria for Examination Timetabling. IN BURKE, E. K. & TRICK, M. (Eds.) Practice and Theory of Automated Timetabling V: Selected Papers from the 5th International Conference on the Practice and Theory of Automated Timetabling (PATAT 2004), Lecture Notes in Computer Science, 3616, 147-160. [3]. ASMUNI, H., BURKE, E. K., GARIBALDI, J. M. & MCCOLLUM, B. (2007) Determining Rules in Fuzzy Multiple Heuristic Orderings for Constructing Examination Timetables. In Proceedings of the 3 rd Multidisciplinary International Scheduling: Theory and Applications Conference (MISTA 2007), 59-66. [4]. ASMUNI, H., BURKE, E. K., GARIBALDI, J. M., MCCOLLUM, B., PARKES, A. J. (2009) An Investigation of Fuzzy Multiple Heuristic Orderings in the Construction of University Examination Timetables. Computers and Operations Research, Elsevier, 36(4), 981-1001. [5]. BATTITI, R., & PROTASI, M. (2001) Reactive local search for the maximum clique problem. Algorithmica, 29(4), 610-637. Implementation from http://intelligent-optimization.org/. [6]. BILIGAN, B., OZCAN, E. & KORKMAZ, E. E. (2007) An Experimental Study on Hyper-heuristics and Exam Timetabling. In BURKE. E. K. & RUDOVA, H. (Eds.) Practice and Theory of Automated Timetabling VI: Selected Papers from the 6th International Conference on the Practice and Theory of Automated Timetabling (PATAT 2006), Lecture Notes in Computer Science, 3867, 394-412. [7]. BURKE, E. K. & BYKOV, Y. (2008) A Late Acceptance Strategy in Hill-Climbing for Examination Timetabling Problems. In Proceedings of Practice and Theory of Automated Timetabling (PATAT 2008), 2008. [8]. BURKE, E. K. ECKERSLEY, A. J., MCCOLLUM, B., PETROVIC, S., QU, R. (2010) Hybrid Variable Neighbourhood Approaches to University Exam Timetabling. European Journal of Operational Research, 206: 46-53. [9]. BURKE, E. K., HYDE, M., KENDALL, G., OCHOA, G., OZCAN, E. & QU, R. (2013) Hyper-heuristics: A Survey of the State of the Art, Journal of the Operational Research Society, 64: 1695-1724. [10]. BURKE, E. K. & KENDALL, G. (Eds). (2005) Search Methodologies: Introductory Tutorial in Optimization and Decision Support Techniques. Springer. [11]. BURKE, E. K., PETROVIC S., QU R., (2006) Case Based Heuristic Selection for Timetabling Problems. Journal of Scheduling, 9: 115-132. [12]. BURKE, E.K., QU, R. (2009) Hybridisations within a Graph Based Hyper-heuristic Framework for University Timetabling Problems, Journal of Operational Research Society, 60: 1273-1285. [13]. BURKE, E. K., MCCOLLUM, B., MEISELS, A., PETROVIC, S., QU, R. (2007) A graph-based hyperheuristic for educational timetabling problems. European Journal of Operational Research, 176: 177–192. [14]. BURKE, E. K., PHAM, N., QU, R. & YELLEN, J. (2011) Linear Combinations of Heuristics for Examination Timetabling. Annals of Operations Research, 194(1): 89-109, 2012. [15]. CARAMIA, M., DELLOLMO, P. & ITALIANO, G.F. (2001) New algorithms for examination timetabling. In: NAHER, S. & WAGNER, D. (Eds.) Algorithm Engineering 4th International Workshop, Proceedings WAE 2000. Lecture Notes in Computer Science, 1982, 230-241. [16]. CARTER, M. W., LAPORTE, G., LEE, S.T. (1996) Examination Timetabling: Algorithmic Strategies and Applications. Journal of the Operational Research Society, 47, 373-383 [17]. COWLING, P., KENDALL, G. & SOUBEIGA, E. (2000) A Hyper-heuristic Approach to Scheduling a Sales Summit, LNCS 2079, PATAT III, Konstanz, Germany, selected papers BURKE, E. K. & ERBEN, W. (Eds.), 176–190. [18]. CULBERSON, J. C. (1992) Iterated Greedy Graph Coloring and the Difficult Landscape. Technical Report [1992-07], Dept. Comp. Sci., Univ. Alberta, Canada, 1992. [19]. De WERRA, D. (1985) An introduction to timetabling. European Journal of Operational Research, 19: 151-162. [20]. GAREY, M. R. & JOHNSON, D. S. (1979) Computers and Intractability: A Guide to the Theory of NP-Completeness. W. H. Freeman. [21]. GLOVER, F., & KOCHENBERGER, G. (Eds). (2003) Handbook of Metaheuristics. Kluwer Academic Publishers. [22]. LI, J., BURKE, E.K., QU, R. (2012) A pattern recognition based intelligent search method and two assignment problem case studies. Applied Intelligence, 36(2): 442-453.
[23]. MCCOLLUM, B., SCHAERF, A., PAECHTER, B., MCMULLAN, P., LEWIS, R., PARKES, A. J., DI GASPERO, L., QU, R. & BURKE, E. K. (2010) Setting the research agenda in automated timetabling competition. INFORMS Journal on Computing, 22, 120-130. [24]. MÜHLENBEIN, H. & PAAß, G. (1996) From recombination of genes to the estimation of distributions I. binary parameters. In EIBEN, A., BÄCK, T., SHOENAUER, M. & SCHWEFEL, H. (Eds.) Parallel Problem Solving from Nature—PPSN IV, 178-187. [25]. OZCAN, E., MISIR, M., OCHOA, G. & BURKE, E. K. (2010) A Reinforcement Learning – Great-Deluge Hyperheuristic for Examination Timetabling. International Journal of Applied Metaheuristic Computing, 1(1), 39-59. [26]. PILLAY, N. & BANZHAF, W. (2007) A Genetic Programming Approach to the Generation of Hyper-Heuristics for the Uncapacitated Examination Timetabling Problem. In NEVES et al. (Eds.) Progress in Artificial Intelligence. Lecture Notes in Artificial Intelligence, 4874, 223-234. [27]. PILLAY, N. & BANZHAF, W. (2009) A Study of Heuristic Combinations for Hyper-Heuristic Systems for the Uncapacitated Examination Timetabling Problem. European Journal of Operational Research (EJOR), 482-491. [28]. PILLAY, N. (2009) Evolving Hyper-heuristics for the Uncapacitated Examination Timetabling Problem. In Proceedings of the 4th Multidisciplinary International Scheduling Conference: Theory and Applications (MISTA 2009), 447-457. [29]. QU, R. & BURKE, E. K. (2009) Hybridisations within a Graph Based Hyper-heuristic Framework for University Timetabling Problems. Journal of Operational Research Society, 60: 1273-1285. [30]. QU, R., BURKE, E. K. & MCCOLLUM, B. (2009a) Adaptive Automated Construction of Hybrid Heuristics for Exam Timetabling and Graph Colouring Problems. European Journal of Operational Research, 198(2): 392-404. [31]. QU, R., BURKE, E. K., MCCOLLUM, B., MERLOT, L. T. G. & LEE, S. Y. (2009b) A Survey of Search Methodologies and Automated Approaches for Examination Timetabling. Journal of Scheduling, 12(1): 55-89. [32]. ROSS, P., MARÍN-BLAZQUEZ, J. G., HART, E. (2004) Hyper-heuristics applied to class and exam timetabling problems. In Proceedings of the 2004 IEEE Congress on Evolutionary Computation, IEEE Press, Portland, Oregon, 1691–1698 [33]. SABAR, N.R., AYOB, M., QU, R., KENDALL, G. (2012) A graph coloring constructive hyper-heuristic for examination timetabling problems. Applied Intelligence, 37(1): 1-11. [34]. SOGHIER, A., QU, R. (2013) Adaptive selection of heuristics for assigning time slots and rooms in exam timetables. Applied Intelligence, 39(2), 438-450. [35]. TERASHIMA-MARÍN, H., ROSS, P., VALENZUELA-RENDÓN, M. (1999) Evolution of constraint satisfaction strategies in examination timetabling. In Genetic and Evolutionary Computation Conference (GECCO 1999), 635– 642.