The Journal of Immunology
A Comparison of Reactive Oxygen Species Generation by Rat Peritoneal Macrophages and Mast Cells Using the Highly Sensitive Real-Time Chemiluminescent Probe Pholasin: Inhibition of Antigen-Induced Mast Cell Degranulation by Macrophage-Derived Hydrogen Peroxide1 Emily J. Swindle,* John A. Hunt,† and John W. Coleman2* Mast cells and macrophages live in close proximity in vivo and reciprocally regulate one another’s function in various ways. Although activated macrophages possess a powerful reactive oxygen species (ROS) generating system, there is conflicting evidence regarding whether mast cells can produce ROS. We used the highly sensitive real-time chemiluminescent probe Pholasin to examine ROS release by peritoneal macrophages and mast cells isolated from OVA-sensitized rats. Macrophages stimulated with PMA (0.8 M) or ionomycin (1 M), but not OVA (1 g/ml), released high-level ROS, levels of which peaked after 3–7 min and declined to baseline levels within 1 h. Superoxide was identified as the major ROS species induced by PMA but not by ionomycin. In contrast, purified mast cells stimulated with PMA released low-level ROS, which was entirely due to the contaminating (2%) macrophages, and did not release any detectable ROS in response to ionomycin or OVA at concentrations that induced degranulation. Stimulation of mixed cell populations with PMA to induce macrophage ROS release led to 50% inhibition of serotonin release from mast cells stimulated 5 min later with OVA. The PMA-induced inhibitory factor was identified as hydrogen peroxide. In conclusion, activated rat peritoneal macrophages but not mast cells produce ROS, and macrophage-derived hydrogen peroxide inhibits mast cell degranulation. The latter could be an important mechanism whereby phagocytic cells regulate mast cell activation and promote resolution of IgE-mediated inflammation. The Journal of Immunology, 2002, 169: 5866 –5873.
M
ast cells are key effectors of specific and innate immunity. In specific immunity, they respond to Ag via receptor-bound IgE to release multiple mediators including histamine, eicosanoids, and cytokines, which together contribute to immediate allergic reactions and inflammatory cell recruitment (1, 2). In innate immunity, mast cells release TNF in response to direct interaction with bacterial adhesion molecules, and this cytokine induces neutrophil recruitment with subsequent bacterial clearance through phagocytosis (3–5). A key element of phagocytosis and killing of bacteria, and possibly of importance also in mediating and regulating inflammation, is the production of reactive oxygen species (ROS)3 (6 – 8). In activated macrophages and neutrophils, ROS are generated by NADPH oxidase in a process called the respiratory burst. This key enzyme catalyzes the generation of superoxide (O2⫺) and hydrogen peroxide (H2O2) using electrons provided by the hexose monophosphate shunt (9 – *Department of Pharmacology and Therapeutics and †U.K. Centre for Tissue Engineering, Department of Clinical Engineering, University of Liverpool, Liverpool, United Kingdom Received for publication July 22, 2002. Accepted for publication September 11, 2002. The costs of publication of this article were defrayed in part by the payment of page charges. This article must therefore be hereby marked advertisement in accordance with 18 U.S.C. Section 1734 solely to indicate this fact. 1
This work was supported by a grant from The Wellcome Trust.
2
Address correspondence and reprint requests to Dr. John W. Coleman, Department of Pharmacology and Therapeutics, Sherrington Buildings, University of Liverpool, Liverpool, Liverpool L69 3GE, U.K. E-mail address:
[email protected] 3 Abbreviations used in this paper: ROS, reactive oxygen species; MCLA, 2-methyl6(4-methoxyphenyl)-3,7-dihydroimidazol[1,2-a]pyrazin-3-one; SOD, superoxide dismutase; DPI, diphenyleneiodonium; [3H]serotonin, 5-[1,2-[3H](N)]-hydroxytryptamine creatinine sulfate; ALU, actual light units; AUC, area under the curve; RBL2H3, rat basophilic leukemia 2H3.
Copyright © 2002 by The American Association of Immunologists, Inc.
11). NADPH oxidase of phagocytic cells can also be activated by protein kinase C agonists such as PMA (12). Because mast cells are pivotal to neutrophil-mediated defense against certain bacteria (3–5) and both neutrophils and macrophages phagocytose and kill bacteria by ROS production (9 –11), the possible contribution of mast cells themselves to ROS production is an important issue. Although mucosal mast cells can phagocytose and kill bacteria, evidently via generation of ROS (13), the question of whether mast cell ROS generation accompanies degranulation is less clear cut. Several studies have reported that IgE/Ag (14), calcium ionophore (15), or compound 48/80 (14 –19), which cause rodent peritoneal mast cell degranulation, concurrently induce release of ROS. In terms of measuring the kinetics of extracellular ROS release, there are problems associated with the use of luminol and 2-methyl-6(4-methoxyphenyl)-3,7-dihydroimidazol[1,2-a]pyrazin-3-one (MCLA), which were used by several of the above studies (14, 17–19). For example, luminol can act as a source of superoxide in the presence of univalent oxidants to yield a chemiluminescent product that is superoxide dismutase (SOD) and catalase inhibitable: this would lead to artifactual production of superoxide (20). Artifactual superoxide is also generated from MCLA, the form of luciferin specific for superoxide (as used in Refs. 14 and 17–19), in the presence of cell-derived NADH (21). Hence, concerns are raised about the reliability of ROS detection using these methods. Therefore, it is important to reevaluate ROS production by mast cells using alternative techniques of high sensitivity. Pholasin is a glycoprotein derived from the marine bivalve mollusc Pholas dactylus (22, 23). It is similar to luminol in that both are photoproteins that react with ROS to form a chemiluminescent product. Pholasin can react with a variety of ROS to form oxypholasin and light as a byproduct; the protein reacts only once with 0022-1767/02/$02.00
The Journal of Immunology ROS and the luminescent product then degrades (24 –26). In studies of ROS release by activated neutrophils, Pholasin was found to have a 50- to 100-fold greater sensitivity than luminol in detecting superoxide release (27). In addition, decay of the Pholasin chemiluminescent product was more rapid than that of the luminol product, leading to a greater accuracy when establishing real-time kinetics of superoxide release (27). For these reasons, Pholasin offers several advantages over luminol. Macrophages and mast cells live in close proximity in tissues such as lung, skin, and the peritoneal cavity of rodents, and twoway interactions between these cell types influence their function. For example, rodent peritoneal macrophages generate nitric oxide that inhibits mast cell degranulation (28, 29), and peritoneal mast cells can present IFN-␥ to macrophages via glycosaminoglycans to stimulate nitric oxide production (30). Furthermore, macrophages can engulf rodent mast cell granules in vivo (31), and this has been shown, in vitro, to affect their subsequent ability to generate superoxide (32, 33). Therefore, it is critical that the functional interrelationship between mast cells and macrophages is further elucidated. Because macrophages are a major source of ROS, ROS derived from this cell type may be important in regulation of mast cell activation. Therefore, the aims of this study were twofold: first, to reevaluate the capacity of mast cells to release ROS, and second, to examine the effects of macrophage-derived ROS on Ag-induced mast cell degranulation. We report that stimulation of peritoneal macrophages from OVA-sensitized rats with PMA or ionomycin but not OVA induced rapid high-level release of ROS as determined by Pholasin-dependent chemiluminescence. Superoxide was identified as the primary ROS induced by PMA but not by ionomycin. Unlike macrophages, purified mast cells did not release detectable levels of ROS when stimulated with PMA, ionomycin, or OVA, even though ionomycin and OVA readily induced strong degranulation under the same conditions. In mixed cell populations, we found that when macrophages were stimulated with PMA to release ROS, they exerted an inhibitory effect on OVAinduced mast cell degranulation. The primary oxidant responsible for this inhibition was identified as hydrogen peroxide.
Materials and Methods Animals and reagents Female Brown Norway rats (150 –200 g) were obtained from Harlan Olac (Bicester, U.K.) and maintained in the University animal housing unit where food and water were provided ad libitum. Rats were sensitized by s.c. injection of OVA/alum (2 ⫻ 0.2 ml; total dose: 80 g of OVA, 8 mg of aluminum hydroxide). This injection was repeated on day 7, and the peritoneal cells were harvested by lavage on day 14. Experimental procedures were approved by the University of Liverpool and were in accordance with guidelines set by the Home Office (London, U.K.). Aluminum hydroxide, catalase, DMEM, L-glutamine, OVA, diphenyleneiodonium (DPI), hydrogen peroxide solution 30% (w/v), PMA, SOD, and toluidine blue were purchased from Sigma-Aldrich (Poole, U.K.). FCS, HBSS, and gentamicin were from Invitrogen (Paisley, U.K.). NG-monomethyl-L-arginine was obtained from CN Biosciences (Nottingham, U.K.). Percoll was purchased from Amersham Pharmacia (Bucks, U.K.). 5-[1,2[3H](N)]-Hydroxytryptamine creatinine sulfate ([3H]serotonin) was from NEN Life Sciences (Hounslow, U.K.). Pholasin and adjuvant K were from Knight Scientific (Plymouth, U.K.).
Peritoneal cell and purified mast cell cultures Cells were obtained by peritoneal lavage of female Brown Norway rats with HBSS (2 ⫻ 30 ml). RBCs were removed by osmotic lysis in distilled water, the cells returned to iso-osmolarity in HBSS (10⫻), and centrifuged (400 ⫻ g, 5 min at 4°C). The resulting white cell pellet was washed once in HBSS by centrifugation (400 ⫻ g, 5 min) and resuspended in 1 ml of 70% isotonic Percoll solution. The cell suspension was gently layered over 6.5 ml of 70% isotonic Percoll solution, and this was then over-layered with 2 ml of complete DMEM (DMEM containing 5% FCS, 4 mM L-
5867 glutamine, and 50 g/ml gentamicin) and centrifuged (580 ⫻ g, 15 min at 4°C). The macrophage/monocyte layer was carefully removed before collection of the purified mast cell pellet. Both macrophage and purified mast cell preparations were washed twice in HBSS by centrifugation (400 ⫻ g, 5 min at 4°C) and finally resuspended in HBSS (without Ca2⫹/Mg2⫹, pH 6.8) to give either 2 ⫻ 106 or 1 ⫻ 106 nucleated cells/ml, respectively, as determined by metachromatic staining with 0.05% toluidine blue. The purified mast cell preparations contained ⬎98% mast cells, whereas the macrophage preparations contained ⬍2% mast cells, as determined by staining with toluidine blue. Giemsa staining of cytospin preparations revealed that macrophage preparations comprised ⬎90% macrophages/monocytes, ⬍9% eosinophils, and ⬍0.1% neutrophils. The cell preparations were used either fresh or after culture in cDMEM overnight at 1 ⫻ 106 cells/ml in sterile conical plastic tubes at 37°C with 5% CO2 in air. If overnight culture was performed, the cells were washed twice in HBSS and adjusted to the appropriate density before use. Cell viability was checked using the trypan blue exclusion method and cells were always ⬎98% viable.
Measurement of mast cell serotonin release Purified mast cells were cultured overnight as described above. One hour before the termination of culture, [3H]serotonin (1 l of a 1 mCi/ml solution) was added to the cells. At the termination of the 24-h culture, the cells were sedimented by centrifugation, the supernatant medium was removed, and the cells were washed three times with 1 ml of HBSS (with Ca2⫹/ Mg2⫹, pH 6.8). Finally, the cells were resuspended in HBSS and aliquoted in duplicate into a 96-well U-bottom microplate (100 l of 0.5 ⫻ 106/ml) containing 100 l of HBSS (as a control), test compound, or Triton X-100 (0.05%) to lyse the cells. The cells were incubated with the above conditions for 30 min, after which they were centrifuged (400 ⫻ g for 2 min), and then 100 l of the supernatant fraction was transferred immediately to 2 ml of scintillation cocktail. The samples were analyzed for [3H] activity for 1 min in a liquid scintillation counter (Beckman, High Wycombe, U.K.). Percentage specific release of [3H]serotonin from mast cells was assessed as [(a ⫺ b)/(c ⫺ b)] ⫻ 100, where a ⫽ cpm for stimulated cells, b ⫽ cpm for control cells, and c ⫽ cpm for lysed cells.
Measurement of ROS generation For the determination of extracellular ROS generation from peritoneal cells, Pholasin-dependent chemiluminescence was used. Macrophage/ monocytes (100 l of 2 ⫻ 106 cells/ml) or purified mast cells (100 l of 1 ⫻ 106/ml) in HBSS were added in duplicate to a 96-well clear-bottom white plate containing Pholasin (50 l of 10 g/ml stock solution) and adjuvant K (20 l). Various compounds (ROS scavengers or inhibitors, 10 l) were added to the cultures as described in Results before placing the plate in a microplate luminometer (Anthos Lucy 1; Labtech, Ringmer, U.K.) set to 37°C. The luminometer was remotely controlled by an Acer PC using the Stingray program (Dazdaq, Ringmer, U.K.). The program was set such that the luminometer measured light emission from each well every 20 –30 s. Basal chemiluminescence was read for 0.5–1 h before the addition of various stimulants directly delivered to each well individually (20 l/well to give a final volume/well of 200 l), and luminescence was monitored for up to an additional 1 h. Luminescence was measured as actual light units (ALU), where 1 ALU ⫽ 103 counts/s. Area under the curve (AUC) data were determined using the Stingray program.
Assessment of the effect of ROS on serotonin release from mast cells Cell cultures were prepared as described above, without separation of mast cells, to give an unfractionated mixed cell population comprising 5–10% mast cells as determined by staining with toluidine blue. Cells (105 in 200 l) were added to duplicate wells of a 96-well U-bottom plate incubated at 37°C with 5% CO2 in air for 24 h. At 21 h, [3H]serotonin (10 l of a 20 Ci/ml solution) was added to each well. At the termination of the 24-h culture, the cells were sedimented by centrifugation, the supernatant medium was removed, and the cells were washed five times with 200 l of HBSS (with Ca2⫹/Mg2⫹, pH 6.8). Finally, the cells were resuspended in HBSS with or without catalase (1000 U/ml), SOD (500 U/ml), or a combination of catalase and SOD in a final volume of 200 l. The cells were left for 30 min to stabilize before the addition of HBSS (as a control), PMA (0.8 M) with or without OVA (1.0 g/ml), or Triton X-100 (0.05%) to lyse the cells. The cells were then incubated for an additional 30 min at 37°C as described above for mast cell serotonin release assay, and the percentage specific release of [3H]serotonin was calculated.
5868
ROS RELEASE FROM MACROPHAGES AND MAST CELL DEGRANULATION
Data presentation and statistical analysis Results showing kinetics of ROS generation (using Pholasin) are shown as graphs representative of at least three separate experiments each performed in duplicate. Differences in ROS release by macrophages (peak height and AUC data averaged across four independent experiments) and mast cell serotonin release data were analyzed by ANOVA followed by two-tailed Student’s t test with Bonferroni correction for multiple comparisons. Differences were considered significant when p ⬍ 0.05.
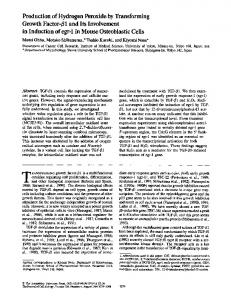
Results Real-time analysis of ROS release from macrophages and mast cells The effect of various stimulating agents on ROS release by peritoneal macrophages and purified mast cells from OVA-sensitized rats was examined by Pholasin-dependent chemiluminescence. The cells were incubated for 1 h at 37°C to obtain a steady baseline of light emission before stimulation. At 60 min, the cells were stimulated with PMA (0.8 M), ionomycin (1.0 M), or OVA (1.0 g/ml) and luminescence was measured every 20 –30 s for an additional 30 – 60 min. In parallel experiments, release of serotonin from purified mast cells was measured. Each experiment was performed on four separate occasions. Stimulation of macrophages with PMA (0.8 M) induced a steep and rapid ROS release (Fig. 1A). This response peaked sharply 3–5 min after stimulation at 250 ALU from a baseline of 30 ALU and then declined gradually back to basal levels by 60 min. Unstimulated macrophages retained a steady basal chemiluminescence of 20 –30 ALU (Fig. 1A). Stimulation of purified mast cells with PMA induced a slight increase in ROS release (from 20 to 25 ALU) that gradually declined back to basal levels 30 min after the initial stimulation (Fig. 1B). Because these mast cell preparations contained 2% macrophages, we considered that their response to PMA might be due to the contaminating cells. To examine this, we ran parallel experiments using peritoneal macrophages at the same cell density (4000/200 l) as the contaminating cells in the mast cell preparations. The re-
sponse of the macrophages mirrored exactly the response of the pure mast cells, demonstrating that indeed the low-level ROS production by the mast cell preparations in response to PMA was fully accounted for by contaminating non-mast cells. Parallel experiments revealed that PMA (0.8 M) induced a net serotonin release of 5.9 ⫾ 2.2% (mean ⫾ SEM, n ⫽ 4 experiments) from the purified mast cells. When macrophages were stimulated with ionomycin (1.0 M), again a rapid ROS release was observed that peaked at 550 ALU after 7 min (Fig. 1C). The peak response was sustained for longer (⬃5 min) compared with that seen for PMA, but ROS release subsequently declined more rapidly to reach baseline 40 –50 min after initial stimulation. In response to ionomycin, no increase in Pholasin-dependent luminescence was seen with the purified mast cell population (Fig. 1D). In parallel experiments, ionomycin (1.0 M) induced 59.0 ⫾ 6.8% net mast cell serotonin release. When either macrophages (Fig. 1E) or mast cells (Fig. 1F) were stimulated with OVA, no ROS production was observed. Upon restimulation of the macrophages with OVA at a 10-fold higher concentration (10 g/ml; Fig. 1E, second arrow), again no increase in luminescence was seen. In parallel experiments, purified mast cells released 36.2 ⫾ 4.9 net percent serotonin in response to OVA, demonstrating that these cells were actively sensitized to the Ag and were fully responsive in terms of degranulation. Identification of ROS released from stimulated macrophages To determine the primary oxidant released from stimulated macrophages, cells were incubated with either DPI (an inhibitor of flavoenzymes including NADPH oxidase) or SOD (an enzyme that scavenges superoxide) for 1 h before stimulation with either PMA or ionomycin. In experiments in which macrophages were stimulated with PMA, DPI produced a concentration-dependent inhibition of both basal and PMA-induced ROS release (Fig. 2A). A concentration of
FIGURE 1. Effect of various stimulants on ROS release from rat peritoneal macrophages and mast cells detected by Pholasin-dependent chemiluminescence. Macrophages (200,000 cells/well; A, C, and E) or mast cells (100,000 cells/well; B, D, and F) were incubated for 1 h with Pholasin (2.5 g/ml) before addition of PMA (0.8 M; A and B), ionomycin (1 M; C and D), or OVA (1 g/ml; E and F), as indicated by the arrows. ROS release was monitored for up to an additional 1 h at 30-s intervals. Results are shown as single experiments performed in duplicate and are representative of four separate experiments.
The Journal of Immunology
5869
FIGURE 2. Effect of DPI and SOD on ROS release from macrophages stimulated with PMA or ionomycin. Macrophages (200,000 cells/well) were incubated for 1 h with Pholasin (2.5 g/ml) and increasing concentrations of DPI (A and C) or SOD (B and D) before the addition of PMA (0.8 M; A and B) or ionomycin (1 M; C and D) as indicated by the arrows. ROS release was monitored for an additional 1 h at 30-s intervals. Results are from single experiments performed in duplicate, representative of four separate experiments.
50 M DPI resulted in 80% inhibition of basal ROS production (from 50 to 10 ALU), and a 72% inhibition (after baseline subtraction) of PMA-induced peak ROS production. Likewise, SOD (at both 100 and 500 U/ml) reduced basal ROS production from 50 to 10 ALU and inhibited PMA-induced ROS production by 61– 70% (after baseline subtraction) (Fig. 2B). These results show that the primary oxidant released from macrophages stimulated with PMA was superoxide. In experiments in which ionomycin was used as the stimulating agent, DPI at 10 M did not appreciably influence the peak ROS response (a slight enhancement was seen) but markedly accelerated the decline in ROS production from peak values such that levels returned to baseline within 15 min of initial stimulation (Fig. 2C). A fivefold higher concentration of DPI (50 M) inhibited the peak induced ROS release by 54% (Fig. 2C). As for DPI, SOD at the lower concentration (100 U/ml) produced a slight enhancement of the ionomycin-induced ROS release, whereas the higher concentration of SOD produced only 14% inhibition of the peak response (Fig. 2D). Unlike DPI, SOD did not accelerate the decay of ROS production induced by ionomycin (Fig. 2, compare D with C). To more objectively compare ROS responses of macrophages stimulated with PMA or ionomycin after treatment with DPI or SOD, data were averaged from four independent experiments and analyzed statistically (Fig. 3). The results confirm that DPI produced a significant concentration-related inhibition of the PMAinduced response (Fig. 3A), whereas only the higher DPI concentration (50 M) significantly inhibited the response to ionomycin (Fig. 3C). Both concentrations of SOD (100 and 500 U/ml) significantly inhibited PMA-induced ROS release (in each case by ⬃50%) (Fig. 3B), whereas neither concentration significantly inhibited the ionomycin-induced response (Fig. 3D). Although it is
necessary to plot real-time data to understand the detailed kinetics of ROS generation, in which case peak response can be measured directly (as in Figs. 2 and 3), to quantify total ROS production it is necessary to measure the AUC. Thus, Fig. 4 shows total ROS production (AUC) during the first 60 min after stimulation, averaged over four separate experiments. Both concentrations of DPI significantly inhibited the PMA- (Fig. 4A) and ionomycin-induced response (Fig. 4C); the highest concentration of 50 M DPI produced 86% inhibition of the total ROS response induced by PMA and 129% inhibition of that induced by ionomycin (i.e., to below baseline level). Hence, DPI gives a complete or almost complete inhibition of ROS responses induced by both PMA and ionomycin. Both concentrations of SOD (100 and 500 U/ml) caused a significant inhibition of the total PMA-induced response by 78% and 68%, respectively (Fig. 4B). By comparison, SOD failed to inhibit the ionomycin-induced response (Fig. 4D). It is evident that the PMA-induced response is more readily inhibited by SOD than that induced by ionomycin and that SOD is less effective than DPI at inhibiting responses induced by both stimulating agents. These results show that the ROS response is fully flavoenzyme dependent (DPI inhibitable). Furthermore, superoxide comprised ⬃50% of the PMA-induced ROS, but a small or negligible component of ionomycin-induced ROS release. Taking together the peak values and AUC for the induced responses (Figs. 2– 4), it is evident that DPI and SOD each inhibited both the initial burst and peak of the PMA-induced ROS response and the subsequent overall ROS production (AUC). By comparison, DPI at only the highest concentration tested inhibited the initial burst and peak responses induced by ionomycin, whereas both concentrations of DPI inhibited total (subsequent) ROS production.
5870
ROS RELEASE FROM MACROPHAGES AND MAST CELL DEGRANULATION
FIGURE 3. Effect of DPI and SOD on peak values of ROS release from macrophages stimulated with PMA or ionomycin. Macrophages (200,000 cells/well) were incubated for 1 h with Pholasin (2.5 g/ml) and increasing concentrations of DPI (A and C) or SOD (B and C) before addition of PMA (0.8 M; A and B) or ionomycin (1 M; C and D). ROS release was monitored for an additional 1 h at 30-s intervals, and peak values were determined. Results are means ⫾ SEM for four separate experiments performed in duplicate. ⴱ, p ⬍ 0.05; ⴱⴱ, p ⬍ 0.01; compared with stimulation without DPI or SOD by ANOVA followed by paired Student’s t test with Bonferroni correction.
FIGURE 4. Effect of DPI or SOD on AUC of ROS release from macrophages stimulated with PMA or ionomycin. Macrophages (200,000 cells/ well) were incubated for 1 h with Pholasin (2.5 g/ml) and increasing concentrations of DPI (A and C) or SOD (B and D) before addition of PMA (0.8 M; A and B) or ionomycin (1.0 M; C and D). ROS release was monitored for an additional 1 h at 30-s intervals, and AUC was determined. Results are means ⫾ SEM for four separate experiments performed in duplicate. ⴱ, p ⬍ 0.05; ⴱⴱ, p ⬍ 0.01; ⴱⴱⴱ, p ⬍ 0.001; compared with stimulation without DPI or SOD by ANOVA followed by paired Student’s t test with Bonferroni correction.
The effect of macrophage-derived ROS on mast cell degranulation
there was a significant reduction in OVA-induced degranulation by 50%. To identify which macrophage-derived ROS was responsible for this inhibition in Ag-induced degranulation, various ROS scavengers were used. Fig. 6A reveals that there was no effect of catalase or catalase ⫹ SOD on mast cell degranulation induced by OVA alone, showing that these scavengers did not affect mast cell degranulation per se, and also that basal ROS release in the mixed
The above experiments show that peritoneal macrophages but not mast cells from OVA-sensitized rats produce ROS upon stimulation with PMA or ionomycin. Neither cell type released ROS in response to OVA. In parallel assays, the purified mast cells degranulated in response to all three agents. OVA induced 36.2 ⫾ 4.9% net release of serotonin; ionomycin induced 59.0 ⫾ 6.8%, whereas PMA induced only 5.9 ⫾ 2.2% release. Therefore, OVA induces strong mast cell degranulation but no macrophage ROS production and ionomycin strongly induces both mast cell degranulation and macrophage ROS production, whereas PMA induces strong macrophage ROS production but weak mast cell degranulation. These findings, therefore, offered us the opportunity to study the effect of PMA-induced ROS production by macrophages on OVA-induced degranulation of mast cells in mixed peritoneal cell populations. We conducted experiments in which unfractionated peritoneal cells from OVA-sensitized rats were activated with either PMA or OVA alone or were activated with PMA 5 min before OVA challenge. The 5-min time interval between PMA and OVA challenge was selected because PMA-induced macrophage ROS release peaks at this time. As a further control, we challenged the mixed cells simultaneously with OVA and PMA, because under these conditions the mast cells will be activated before substantial macrophage ROS production has occurred. Mast cell degranulation was measured as serotonin release. As shown in Fig. 5, OVA alone induced 40% net serotonin release, whereas PMA alone caused 10% release. However, when the cells were stimulated with PMA 5 min before OVA challenge,
FIGURE 5. Effect of PMA-induced ROS release from macrophages on OVA-induced mast cell serotonin release. Unfractionated peritoneal cells (200,000/well) were preincubated for 30 min and then challenged with OVA alone (1 g/ml), PMA alone (0.8 M), PMA added 5 min before OVA (third bar), or PMA ⫹ OVA added simultaneously (fourth bar). After an additional 30 min, supernatant fractions were separated and net percent specific [3H]serotonin release was measured. Results are means ⫾ SEM for six separate experiments performed in duplicate. The p values were determined by ANOVA followed by paired Student’s t test with Bonferroni correction.
The Journal of Immunology
5871 inhibition at concentrations of 0.1 mM or higher. Hydrogen peroxide did not cause mast cell degranulation directly and was not cytotoxic toward the cells as determined by trypan blue exclusion (data not shown).
Discussion
FIGURE 6. Effect of ROS scavengers on OVA-induced serotonin release by mast cells in mixed peritoneal cell populations. Unfractionated peritoneal cells (200,000/well) were incubated for 30 min with HBSS, catalase (1,000 U/ml) alone, or catalase (1,000 U/ml) ⫹ SOD (500 U/ml) before addition of OVA (1 g/ml; A), or cells were prestimulated with PMA 5 min before challenge with OVA (B). After an additional 30 min, supernatant fractions were separated and net percent specific [3H]serotonin release was measured. Results are means ⫾ SEM for six separate experiments performed in duplicate. The p values were determined by ANOVA followed by paired Student’s t test with Bonferroni correction.
cell population does not influence the mast cell response to OVA. When the macrophages in the mixed population were induced to release ROS by PMA, mast cell serotonin release induced 5 min later by OVA was reduced by 50% (Fig. 6, compare A and B, left bars). This effect of PMA was completely reversed by addition of either catalase or catalase ⫹ SOD (Fig. 6B). Because there was no difference between using catalase alone or in conjunction with SOD, the primary ROS released from PMA-stimulated macrophages that caused inhibition of OVA-induced mast cell degranulation must be hydrogen peroxide. To confirm that inhibition of mast cell serotonin release was due to the action of hydrogen peroxide, purified mast cells were incubated with a 10,000-fold concentration range of hydrogen peroxide for 5 min before stimulation with OVA. As shown in Fig. 7, the hydrogen peroxide produced a catalase-reversible concentrationdependent inhibition in mast cell serotonin release, with complete
FIGURE 7. Effect of chemically derived hydrogen peroxide on OVAinduced mast cell serotonin release. Purified mast cells (15,000/well) were incubated for 30 min with HBSS or catalase (1,000 U/ml) before addition of freshly prepared hydrogen peroxide for 5 min. OVA (1 g/ml) was then added and incubations were continued for an additional 30 min before removal of supernatant fractions for measurement of released [3H]serotonin. Results are means ⫾ SEM for five separate experiments performed in duplicate.
In this study, we have demonstrated that stimulation of mast cells from OVA-sensitized rats with PMA, OVA, or ionomycin does not release detectable levels of ROS, as determined by Pholasin-dependent chemiluminescence. This was in sharp contrast to macrophages, which released high levels of ROS when stimulated with PMA or ionomycin. Serotonin release assays revealed that the concentrations of stimulants used for the determination of ROS release by mast cells also induced their degranulation. Hence, rat peritoneal mast cells do not release ROS concurrently when stimulated to degranulate by both nonimmunological (PMA, ionomycin) and immunological (OVA) activation. Pholasin is a chemiluminescent probe that can be used for detection of extracellular ROS from immune cells and has a 50- to 100-fold greater sensitivity than luminol, as shown for activated neutrophils (27). Therefore, even by using an assay for ROS with unprecedented sensitivity, we were unable to detect ROS release by mast cells. The small amount of ROS detected by mast cells stimulated with PMA was solely attributed to the contaminating macrophages. The current results contradict previous reports of low-level but nevertheless detectable ROS release after stimulation of rat peritoneal mast cells with Ag, compound 48/80, or calcium ionophore A23187 (14 –19). As outlined in the introduction, there are problems associated with luminol and MCLA (as used in Refs. 14 –19) as probes for detection of cellular release of ROS. Principally, luminol, which has been used by many researchers, has poor quantum yield at neutral pH and can generate superoxide independently of a cellular source of this radical, and this artifactual generation is SOD and catalase inhibitable (20). In addition, luminol is sensitive to intracellular ROS because there is a close correlation between the signal detected by luminol and the intracellular probe dichlorofluoroscein diacetate in experiments with activated neutrophils (34). Hence, intracellular ROS may interfere with detection of extracellular ROS using luminol as the probe. For the above reasons, luminol is an inappropriate tool in assessing extracellular ROS release by mast cells. Also MCLAdependent chemiluminescence is enhanced by NADH, and because this electron donor is present in most cells, the true superoxide release could be masked (24). Using a probe of greater sensitivity and one whose chemiluminescent product has a shorter half-life than luminol would give more accurate kinetics of ROS generation. For these reasons, Pholasin has several advantages over luminol and MCLA. Mast cells activated by compound 48/80 or anti-IgE release low levels of superoxide, as measured by the cytochrome c reduction method that is specific for this radical (14, 15). This low-level response may be inconsequential because SOD is present in the granules of mast cells and hence could dismutate any coreleased superoxide (35). In addition, FACS analysis using the intracellular ROS probes dichlorofluoroscein diacetate and dihydrorhodamine123 diacetate has shown that mast cells do produce ROS intracellularly under conditions where no degranulation is seen, and that modulation of ROS activity did not alter degranulation (36, 37). Hence, these two processes can occur independently of each other and intracellular ROS does not influence degranulation (36, 37). It must be considered that such a small intracellular ROS generation by mast cells may be a functional consequence of energy use during granule exocytosis because mitochondria are the primary physiological source of ROS within the cell. In light of our current results showing that rat peritoneal macrophages but not mast cells
5872
ROS RELEASE FROM MACROPHAGES AND MAST CELL DEGRANULATION
release high levels of ROS in response to ionomycin, previous reports of calcium ionophore A23187-induced ROS production by rat peritoneal mast cells can be explained fully by the presence of 15% contaminating non-mast cells in these preparations (15). More recently, the mast cell line rat basophilic leukemia 2H3 (RBL-2H3) has been shown to release low-level ROS when stimulated with Ag or calcium ionophore (A23187) using the detection techniques of luminol and MCLA (38, 39). Although this release was inhibitable by both DPI and SOD, no steady baseline readings were shown before stimulation, although appropriate controls were shown on stimulation. In our hands, using Pholasin-dependent chemiluminescence, RBL-2H3 cells did not release ROS in response to a 10-fold concentration range of either Ag or the calcium ionophores A23187 or ionomycin, all of which actively induced degranulation. We found that small fluctuations in background chemiluminescence were attributed to variations in cell number between samples and that increases in chemiluminescence during the initial recording of baseline ROS were due to cells and probe equilibrating to 37°C. (E. J. Swindle, unpublished observations). Therefore, it is essential, as in the present study, to allow full equilibration of cells and probe before cell stimulation. When no ROS release was observed with either RBL-2H3 or rat peritoneal mast cells, flash assays were performed in which 10 readings were taken every second over a 5-min time frame. Again, no increase in Pholasin-dependent chemiluminescence was observed after cell stimulation (E. J. Swindle, unpublished observations). In contrast to mast cells, we found that macrophages stimulated with PMA or ionomycin but not OVA released high-level ROS, as detected by Pholasin-dependent chemiluminescence. In addition to its greater sensitivity over conventional probes such as luminol, Pholasin also has the advantage of a faster decay rate (28), thus offering the best probe yet available for real-time kinetic analyses of ROS production. The current study thus provides the most reliable data on the true kinetics of ROS production by activated macrophages. We found that ROS production occurred rapidly to peak after 3–7 min, and subsequently declined steadily to baseline by 1 h. The primary oxidant released upon PMA stimulation was determined to be superoxide because both SOD and DPI almost completely inhibited the peak and total ROS response. It is well documented that macrophages possess an enzyme, NADPH oxidase, that leads to rapid release of ROS (6, 10), and our current data are in full agreement with previous reports of macrophage ROS release in response to PMA (40, 41). The ROS response of peritoneal macrophages to ionomycin was higher than that seen with PMA and was completely blocked by DPI but not by SOD. Because ionomycin causes an influx of calcium into the cell, all calcium-dependent processes would be activated. This would include not only the NADPH oxidase, which has been shown to be activated by ionomycin in neutrophils (42), but also other calciumdependent ROS-generating systems, such as constitutive nitric oxide synthase, that would produce NO rather than superoxide. This NO could neutralize superoxide with the production of peroxynitrite (43) that will not be scavenged by SOD. In essence, the NO produced by ionomycin stimulation could compete with SOD for the concurrently released superoxide. Presuming the affinity of superoxide for SOD is greater than that for NO, the following is likely to occur. At low SOD concentrations, not all of the superoxide would be scavenged by SOD and that left over would be available to react with NO to form peroxynitrite, leading to an enhancement in chemiluminescence because Pholasin can also detect peroxynitrite (E. J. Swindle, unpublished observations). At higher SOD concentrations, all superoxide produced would be scavenged by SOD, and hence an overall drop in the chemiluminescent signal would be observed.
Because macrophages and mast cells are found in close proximity in vivo and at sites of inflammation, it is critical to understand their functional relationship. The effect of macrophage-derived ROS on mast cell function was investigated. Initially, the effect of the ROS scavengers SOD and catalase on OVA-induced mast cell degranulation was examined in unfractionated peritoneal cell populations to determine whether basal ROS release from macrophages affected degranulation. Neither catalase alone nor catalase plus SOD exerted any effect, proving that basal ROS release did not influence the ability of mast cells to degranulate to OVA. We then showed that ROS generated from PMA-activated macrophages inhibited degranulation of mast cells stimulated 5 min later with OVA. The primary ROS responsible for this inhibition was identified as hydrogen peroxide. Although the stimulus was unnatural, this is the first study to demonstrate that cell-derived hydrogen peroxide inhibits Ag-induced, tissue-derived mast cell degranulation. Several studies have reported effects of ROS on mast cell function. For example, chemically derived superoxide, generated from xanthine-xanthine oxidase (15, 44, 45) or potassium superoxide (46), and hydrogen peroxide (47) have been shown to induce rat peritoneal mast cell degranulation. Furthermore, FMLP- (48) or zymosan-activated (49) human neutrophils at high cell density (106/ml) caused mast cell histamine release, and the oxidant responsible was identified as hydrogen peroxide. The above reports clearly contradict our present findings showing that macrophagederived as well as exogenously added freshly prepared hydrogen peroxide do not cause mast cell degranulation, but rather inhibit Ag-induced degranulation. These differences may relate to the quality of the preparations of hydrogen peroxide used, differences in cell origin and density, or coactivating factors. In addition, this is the first study to demonstrate the effect of chemically derived hydrogen peroxide on Ag-induced mast cell degranulation from primary rat cells. Other researchers have shown that hydrogen peroxide has varying effects on RBL-3H3 mast cells depending on the concentration used. At high concentrations, hydrogen peroxide (2 mM) induced degranulation, although this may have been a toxic effect, whereas at concentrations of 125-1000 M, an inhibition of degranulation was observed (47, 50), consistent with our findings for rat peritoneal mast cells. This inhibitory effect of hydrogen peroxide was due to blocking of intra- and extracellular calcium fluxes (50), and an effect via calcium is supported by a similar inhibitory effect of hydrogen peroxide (0.1–1 mM) on calcium ionophore A23187-mediated mast cell degranulation (51). Thus, we can speculate that the inhibitory actions of cell-derived or low concentrations of exogenous hydrogen peroxide as observed in the current study may be due to an alteration of calcium fluxes. In conclusion, macrophages but not mast cells released ROS in response to PMA or ionomycin stimulation, and neither cell type released ROS after immunological activation with OVA. Coincubation of resting macrophages with mast cells did not affect the ability of the mast cells to respond to OVA. However, when macrophages were stimulated to release ROS, an inhibition in OVAmediated serotonin release was seen. The primary ROS responsible was hydrogen peroxide. At sites of inflammation where mast cells and macrophages are in close proximity, the increased ROS production by activated phagocytic cells, such as macrophages, may inhibit the ability of mast cells to respond to Ag, thereby aiding resolution of the inflammatory response.
Acknowledgment We thank Dr. Jan Knight for her invaluable comments and advice during setting up of the Pholasin chemiluminescence assay.
The Journal of Immunology
References 1. Metcalfe, D. D., D. Baram, and Y. A. Mekori. 1997. Mast cells. Physiol. Rev. 77:1033. 2. Williams, C. M. M., and S. J. Galli. 2000. The diverse potential effector and immunoregulatory roles of mast cells in allergic disease. J. Allergy Clin. Immunol. 105:847. 3. Malaviya, R., T. Ikeda, E. Ross, and S. N. Abraham. 1996. Mast cell modulation of neutrophil influx and bacterial clearance at sites of infection through TNF-␣. Nature 381:7. 4. Echtenacher, B., D. N. Mannel, and L. Hultner. 1996. Critical protective role of mast cells in a model of acute septic peritonitis. Nature 381:75. 5. Malaviya, R., Z. Gao, K. Thankavel, P. A. van der Merwe, and S. N. Abraham. 1999. The mast cell tumour necrosis ␣ response to FimH-expressing Escherichia coli is mediated by the glycosylphosphatidylinositol-anchored molecule CD48. Proc. Natl. Acad. Sci. USA 96:8110. 6. Forman, H. J., and M. Torres. 2001. Redox signalling in macrophages. Mol. Aspects Med. 22:189. 7. Bogdan, C., M. Rollinghoff, and A. Diefenbach. 2000. Reactive oxygen and nitrogen intermediates in innate and specific immunity. Curr. Opin. Immunol. 12:64. 8. Henricks, P. A. J., and F. P. Nijkamp. 2001. Reactive oxygen species as mediators in asthma. Pulm. Pharmacol. Ther. 14:409. 9. Bastain, N. R., and J. B. Hibbs. 1994. Assembly and regulation of NADPH oxidase and nitric oxide synthase. Curr. Opin. Immunol. 6:131. 10. Segal, A. W. 1995. The NADPH oxidase of phagocytic cells is an electron pump that alkalinises the phagocytic vacuole. Protoplasma 184:86. 11. Jones, R. D., J. T. Hancock, and A. H. Morice. 2000. NADPH oxidase: a universal oxygen sensor? Free Radical Biol. Med. 29:416. 12. Segal, A. W., and A. Abo. 1993. The biochemical basis of NADPH oxidase of phagocytes. Trends Biochem. Sci. 8:43. 13. Malaviya, R., E. A. Ross, J. I. MacGregor, T. Ikeda, J. R. Little, B. A. Jakschik, and S. N. Abraham. 1994. Mast cell phagocytosis of FimH-expressing enterobacteria. J. Immunol. 152:1907. 14. Henderson, W. R., and M. Kaliner. 1978. Immunological and nonimmunological generation of superoxide from mast cells and basophils. J. Clin. Invest. 61:187. 15. Mannaioni, P. F., E. Masini, A Pistelli, D. Salvemini, and J. R. Vane. 1991. Mast cells as a source of superoxide anions and nitric oxide-like factor: relevance to histamine release. Int. J. Tissue React. 13:271. 16. Schnetti, M. L., A. Mazzini, R. Greco, and A. Bertelli. 1984. Inhibiting effect of levamisole on superoxide production from rat mast cells. Pharmacol. Res. Commun. 16:101. 17. Kurosawa, M., K. Hanawa, S. Kobayashi, and M. Nakano. 1990. Inhibitory effects of azelastine on superoxide anion generation from activated inflammatory cells measured by a simple chemiluminescence method. Arzneimittelforschung 40:767. 18. Gushchin, I. S., and O. R. Tsinkalovsky. 1992. Dissociation of histamine secretion and changes in oxidant-antioxidant system indices in immunologically and nonimmunologically activated rat mast cells. Agents Actions 35:C279. 19. Fukuishi, N., M. Sakaguchi, S. Matsuura, C. Nakagawa, R. Akagi, and M. Akagi. 1997. The mechanisms of compound 48/80-induced superoxide generation mediated by A-kinase in rat peritoneal mast cells. Biochem. Mol. Med. 61:107. 20. Faulkner, K., and I. Fridovich. 1993. Luminol and lucigenin as detectors for O2⫾. Free Radical Biol. Med. 15:447. 21. Sohn, H. Y., M. Keller, T. Gloe, P. Crause, and U. Pohl. 2000. Pitfalls of using lucigenin in endothelial cells: implications for NAD(P)H dependent superoxide formation. Free Radical Res. 32:265. 22. Michelson, A. M. 1978. Purification and properties of Pholas dactylus luciferin and luciferase. In Methods in Enzymology, Vol. 57. M. A. DeLuca, ed. Academic Press, London, p. 385. 23. Knight, J. 1997. The piddock and the immunologist. Immunol. News 4:26. 24. Mu¨ ller, T., E. V. Davies, and A. K. Campbell. 1989. Pholasin chemiluminescence detects mostly superoxide anion released from activated human neutrophils. J. Biolumin. Chemilumin. 3:105. 25. Reichl, S., J. Arnhold, J. Knight, J. Schiller, and K. Arnold. 2000. Reactions of Pholasin with peroxidases and hypochlorous acid. Free Radical Biol. Med. 28: 1555. 26. Dunstan, S. L., G. B. Sala-Newby, A. B. Fajardo, K. M. Taylor, and A. K. Campbell. 2000. Cloning and expression of the bioluminescent photoprotein pholasin from the bivalve mollusc Pholas Dactylus. J. Biol. Chem. 275:9403. 27. Roberts, P. A., J. Knight, and A. K. Campbell. 1987. Pholasin: a bioluminescent indicator for detecting activation of single neutrophils. Anal. Biochem. 160:139. 28. Eastmond, N. C., E. M. S. Banks, and J. W. Coleman. 1997. Nitric oxide inhibits IgE-mediated degranulation of mast cells and is the principal intermediate in IFN-␥-induced suppression of exocytosis. J. Immunol. 159:1444.
5873 29. deSchoolmeester, M. L., N. C. Eastmond, R. J. Dearman, I. Kimber, D. A. Basketter, and J. W. Coleman. 1999. Reciprocal effects of interleukin-4 and interferon-␥ on IgE-mediated mast cell degranulation: a role for nitric oxide but not peroxynitrite or cyclic guanosine monophosphate. Immunology 96:138. 30. Brooks, B., D. M. Briggs, N. C. Eastmond, D. G. Fernig, and J. W. Coleman. 2000. Presentation of IFN-␥ to nitric oxide producing cells: a novel function for mast cells. J. Immunol. 164:573. 31. Oliani, S. M., L. H. K. Lim, H. C. Christian, K. Pell, A. M. Das, and M. Perretti. 2001. Morphological alteration of peritoneal mast cells and macrophages in the mouse peritoneal cavity during the early phases of an allergic inflammatory reaction. Cell Biol. Int. 25:795. 32. Dileepan, K. N., K. M. Simpson, and D. J. Stechschulte. 1989. Modulation of macrophage superoxide-induced cytochrome c reduction by mast cells. J. Lab. Clin. Med. 113:577. 33. Rock, M. J., J. Despot, and R. F. Lemanske. 1990. Mast cell granules modulate alveolar macrophage respiratory-burst activity and eicosanoid metabolism. J. Allergy Clin. Immunol. 86:452. 34. Caldefie-Che´ zet, F., S. Walrand, C. Moinard, A. Tridon, J. Chassagne, and M.-P. Vasson. 2002. Is the neutrophil reactive oxygen species production measured by luminol and lucigenin chemiluminescence intra or extracellular?: comparison with DCFH-DA flow cytometry and cytochrome c reduction. Clin. Chim. Acta 319:9. 35. Fredericks, W. M., K. S. Bosch, and H. A. Vreeling-Sindelarova. 1997. In situ detection of constitutive superoxide anion production in granules of mast cells. Histochem. J. 29:287. 36. Tsinkalovsky, O. R., and O. D. Laerum. 1994. Flow cytometric measurement of the production of reactive oxygen intermediates in activated rat mast cells. APMIS 102:474. 37. Brooks, A. C., C. J. Whelan, and W. M. Purcell. 1999. Reactive oxygen species generation and histamine release by activated mast cells: modulation by nitric oxide synthase inhibition. Br. J. Phamacol. 128:585. 38. Matsui, T., Y. Suzuki, K. Yamashita, T. Yoshimaru, M. Suzuki-Karasaki, S. Hayakawa, M. Yamaki, and K. Shimizu. 2000. Diphenyleneiodonium prevents reactive oxygen species generation, tyrosine phosphorylation, and histamine release in RBL-2H3 mast cells. Biochem. Biophys. Res. Commun. 276:742. 39. Yoshimaru, T., Y. Suzuki, T. Matsui, K. Yamashita, T. Ochiai, M. Yamaki, and K. Shimizu. 2002. Blockade of superoxide generation prevents high-affinity immunoglobulin E receptor-mediated release of allergic mediators by rat mast cell line and human basophils. Clin. Exp. Allergy 32:612. 40. Hancock, J. T., and O. T. G. Jones. 1987. The inhibition by diphenyleneiodonium and its analogues of superoxide generation by macrophages. Biochem. J. 242: 103. 41. Takao, S., E. H. Smith, D. Wang, C. K. Chan., G. B. Bulkley, and A. S. Klein. 1996. Role of reactive oxygen metabolites in murine peritoneal macrophages phagocytosis and phagocytic killing. Am. J. Physiol. 271:C1278. 42. Christiansen, N. O. 1988. A time-course study on superoxide generation and protein kinase C activation in human neutrophils. FEBS Lett. 239:195. 43. Beckman, J. S., J. Chen, H. Ischiropoulos, and J. P. Crow. 1994. Oxidative chemistry of peroxynitrite. In Methods in Enzymology, Vol. 233. L. Packer, ed. Academic Press, London, p. 229. 44. Ohmori, H., K. Komoriya, A. Azuma, S. Kurozumi, and Y. Hashimoto. 1979. Xanthine oxidase-induced histamine release from isolated rat peritoneal mast cells: involvement of hydrogen peroxide. Biochem. Pharmacol. 28:333. 45. Menon, I. A., S. Shirwadkar, and N. S. Ranadive. 1988. Nature of the oxygen species generated by xanthine oxidase involved in secretory histamine release from mast cells. Biochem. Cell Biol. 67:397. 46. Akagi, M., Y. Katakuse, N. Fukuishi, T. Kan, and R. Akagi. 1994. Superoxide anion-induced histamine release from rat peritoneal mast cells. Biol. Pharm. Bull. 17:732. 47. Peden, D. B., L. Dailey, W. DeGraff, J. B. Mitchell, J. G. Lee, M. A. Kaliner, and R. J. Hohman. 1994. Hydrogen peroxide effects on mast cell function. Am. J. Physiol. 267:L85. 48. Fantozzi, R., S. Brunelleschi, A. Rubino, S. Tarli, E. Masini, and P. F. Mannioni. 1986. FMLP-activated neutrophils evoke histamine release from mast cells. Agents Actions 18:155. 49. Stendahl, O., L. Molin, and M. Lindbroth. 1983. Granulocyte-mediated release of histamine from mast cells. Int. Arch. Allergy Appl. Immunol. 70:277. 50. Guerin-Marchand, C., H. Senechal, C. Pelletier, H. Fohrer, R. Olivier, B. David, B. Berthon, and U. Blank. 2001. H2O2 impairs inflammatory mediator release from immunologically stimulated RBL-2H3 cells through a redox sensitive, calcium-dependent mechanism. Inflamm. Res. 50:341. 51. Wan, B. Y. C., K. H. Peh, M. Ho, and E. K. Assem. 2001. Effects of nitric oxide and hydrogen peroxide on histamine release from RBL-2H3 cells. Biochem. Pharmacol. 62:1537.