Ayman Ahmed, Salwa ElRamly & Mohamed El. Sharkawy
Hyperspectral Data Compression Using Spatial-Spectral Lossless Coding Technique Ayman Ahmed
[email protected]
Egyptian Space Program National Authority for Remote Sensing and Space science Cairo, Egypt
Salwa ElRamly
[email protected]
Ain-Shams University Department of Electronics and Communication Engineering Cairo, Egypt
Mohamed El. Sharkawy
[email protected]
E-JUST—Egypt-Japan University of science and technology Alexandria, Egypt
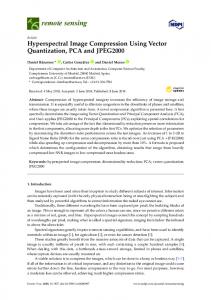
Abstract Hyperspectral imaging is widely used in many applications; especially in vegetation, climate changes, and desert studies. Such kind of imaging has a huge amount of data, which requires transmission, processing, and storage resources especially for space borne imaging. Compression of hyperspectral data cubes is an effective solution for these problems. Lossless compression of the hyperspectral data usually results in low compression ratio, which may not meet the available resources; on the other hand, lossy compression may give the desired ratio, but with a significant degradation effect on object identification performance of the hyperspectral data. Moreover, most hyperspectral data compression techniques exploits the similarities in spectral dimensions; which requires bands reordering or regrouping, to make use of the spectral redundancy. In this paper, we analyze the spectral cross correlation between bands for Hyperion hyperspectral data; spectral cross correlation matrix is calculated, assessing the strength of the spectral matrix, and finally, we propose new technique to find highly correlated groups of bands in the hyperspectral data cube based on "inter band correlation square", from the resultant groups of bands we propose a new predictor that can predict efficiently the whole bands within data cube based on weighted combination of spectral and spatial prediction, the results are evaluated versus other state of the art predictor for lossless compression. Keywords: Hyperspectral Compression; Band Regrouping; Edge Detection; Spectral correlation Matrix.
1. INTRODUCTION Hyperspectral data contains a huge amount of spectral data distinctive in spectral resolution, which allows identification of each pixel based on its spectral footprint. On the other hand; this amount of data increases as spectral bands increase, usually satellite instrument that measures earth's illumination at specified spectral band, has more dynamic range than visual images; typically ranges from 10 up to 16 bits per pixel per band; additionally, considering the swath width of the satellite imagery; hyperspectral imaging session of a satellite may contain tremendous amount of digital data to be transmitted to ground station[1]; this limits the imaging session and spatial resolution. Many researches have been conducted to efficiently "carefully" compress this amount of data without losing the main advantage of hyperspectral imaging which is spectral resolution; two known compression approaches are usually investigated, lossy and lossless techniques; lossless
International Journal of Image Processing (IJIP), Volume (6): Issue (6): 2012
467
Ayman Ahmed, Salwa ElRamly & Mohamed El. Sharkawy
compression is perfect for compression data and keeping the original information without distortion and in the same time allow further processing of the image to identify earth's objects accurately; unfortunately this approach of compassion gives compression ratio ranges from 1 up to 3[2][3]; that means the compressed data will have smaller volume down to 3 times less the original one; this, in practical situations, is not sufficient; while compressed data still represents a significant issue for onboard satellite designer for transmission and storage[4]. On the other hand; lossy compression approach gives a great compression ratio, which may goes up to 40 times; this ratio, is achieved scarifying the low distortion rate; that means more losses will appear on the reconstructed data; this losses can and will affect the process of earth's object identification process[5]. Another approach of compression is known as near lossless; this approach achieves relatively higher compression ratio than achieved by lossless approach and smaller distortion less than resulted from lossy compression approach; that is controlled by losses threshold. Meanwhile researches are continuing to find optimum solution that can fit onboard satellites[6]; most researches goes around exploitation of either spectral or spatial redundancy of hyperspectral data or both of them; spatial redundancy results from the fact that imaging certain territory will have similarity in spatial dimensions; these characteristics are exhaustively investigated during last decades; and as a result we have discrete cosine transformation and wavelet transformation; it exploits the spatial redundancy in the images in different ways of implementation either in ground image processing software or onboard satellite instrumentations. On the other hand; spectral redundancy is relatively a new dimension in hyperspectral imaging; many researches are trying to investigate the best way to deal with this redundancy[7], [8] and optimum techniques to exploit it; these facts lead to another activity of investigation and analysis of spectral structure of hyperspectral data [9],[10]. We introduce a new technique that can exploit spectral and spatial redundancies in the hyperspectral data cubes, based on the on modified median predictor[11] that can be extended to third dimension of prediction based on spectral analysis. This paper is organized as follow; first section discusses the origin of the topic, followed by explaining similarity measurement and spectral cross correlation structure of the hyperspectral data cubes, third section proposes calculation of global reference band that will be used in prediction; fourth section discusses the proposed J-predictor; section five, explains the predictor model and finally we evaluate the results against state of the art lossless compression in section six.
2. INTER-BAND SPECTRAL CROSS CORRELATION AND SIMILARITY MEASUREMENTS Hyperspectral data can be viewed as a "Data-Cube"; this data cube has two spatial dimensions and one spectral dimension, spectral dimension represent the captured image in different spectral bands, usually successive. Spectral redundancy is based on the similarity between bands and each other’s; these similarity can be measured by spectral cross correlation[12], Conditional entropy, mutual information, Euclidian Distance, Maximum Absolute Distance, and Centered Euclidian Distance; these measures are well studied by researchers and compared to determine which one is best fit for regrouping the bands for prediction based compression techniques; correlation is found to be the best for similarity measurement [8][13][14]; this results is a good point to start the analysis of spectral structure of the hyperspectral data cube. Correlation between spectral bands is named "spectral correlation" as it represents the correlation between two identical images in different spectral domains. The imaged piece of land by hyperspectral instrument is treated as unknown object, since the main objective of the satellite imagery is to provide data about these objects. The dependencies between bands should be reflectance of the material spectral response collected by imager; this may appear to be random
International Journal of Image Processing (IJIP), Volume (6): Issue (6): 2012
468
Ayman Ahmed, Salwa ElRamly & Mohamed El. Sharkawy
dependencies, but the average correlation between bands is the main measuring criteria of similarity, which is dependent on average material spectral response within the single band. Cross correlation is usually a standard measure of degree of similarity between tow images (matrices); some techniques of cross correlation estimation was used to investigate the hyperspectral inter-band correlation; this process is time consuming and requires extensive computational power. Cross correlation mainly depends on covariance calculation between the two bands; while normalized cross correlation uses variance of each band as divisor to remove values dependency on the variation of both brightness and contrast of the image. Selection of estimation technique should be based on deterministic criteria; such as simplicity, speed, minimum resources of memory and computational power. Fast normalized cross correlation[15][16] is a very good technique for calculating the similarity between two images; it is fast and calculate how much similarity two images are independent of their individual brightness and contrast. Using fast normalized cross correlation techniques, correlation between all hyperspectral bands in the data cube is estimated; for band i, correlation value is estimated with all other bands in the data cube j; using the Eq. (1). Data cube is estimated; for band i, correlation value is estimated with all other bands in the data cube j; using the Eq. (1).
NCC (i, j )
[( Di ( x, y ) Di )( Dj ( x, y ) Dj )] x, y 2 2 ( Di ( x, y ) Di ) ( Dj ( x, y ) Dj ) x, y x, y
(1)
Where: NCC(i,j): Normalized cross correlation between bands i. and j, Di (x,y): intensity of pixel, (x, y) pixel indices within one band, Di : mean of pixel intensity values of band i.
This function is implemented in fast, optimized way in Matlab image processing tool box[17], based on "Fast Normalized Cross-Correlation"[15]. We estimating the inter-band cross correlation matrix for each hyperspectral data cube; three spaceborne hyperspectral data samples are processes and used in this study; Table 1, illustrates the details of each data samples, associated figure that reflects the image view of spectral correlation matrix, and name of spectral correlation matrix (SCM) used in calculations the resulted spectral correlation matrix for three hyperspectral data samples, from both airborne and space borne instruments[18][19], are illustrated in FIGURE 1, FIGURE 2, FIGURE 3. We can notice that for "corr_mtxer" there is a strong correlation between the groups of bands starting from approximately band number 10 till band number 55, and group of bands starting from approximately band number 180 till band number 220 (GOB (~10-55) and GOB (~180-220)). This correlation appears in a square manner, dashed square in, this is called "Inter Band Correlation Square" (IBCS); IBCS itself is not symmetric around spectral correlation matrix diagonal. Checking of the existence of the IBCS, allows determining the correlation between
International Journal of Image Processing (IJIP), Volume (6): Issue (6): 2012
469
Ayman Ahmed, Salwa ElRamly & Mohamed El. Sharkawy
bands in hyperspectral data cube, this helps in band regrouping techniques used in compression of hyperspectral data[20][21][22][15].
Hyperspectra l data sample
Details
"ErtaAle"
Hyperion instrument: 7813 lines x 256 samples x 242 bands, instrument bit depth = 12 bits. Hyperion instrument: 7833 lines x 256 samples x 242 bands, instrument bit depth = 12 bits. Hyperion instrument: 7323 lines x 256 samples x 242 bands, instrument bit depth = 12 bits.
"LakeMonon a" "MtStHelens"
Figure number FIGURE 1
Spectral correlation matrix name "corr_mtxer"
FIGURE 2
"corr_mtxl"
FIGURE 3
"corr_mtxhel"
TABLE 1 Summary of hyperspectral data samples, its corresponding figures of correlation matrix, and name of correlation matrix
FIGURE 1: Image view of SCM for "corr_mtxer"
FIGURE 2: Image view of SCM for "corr_mtxl"
International Journal of Image Processing (IJIP), Volume (6): Issue (6): 2012
470
Ayman Ahmed, Salwa ElRamly & Mohamed El. Sharkawy
FIGURE 3: Image view of SCM for “corr_mtxhel”
3. GLOBAL REFERENCE BAND Inter band correlation square is pattern of spectral correlation between bands in hyperspectral data; finding this square(s) refers to the location of the group(s) of bands that are highly correlated, and usually these GOBs are far away from each other. Edge detection is concept of image processing that helps to locate edges in the processed image; some algorithms are used in this area; such as, Sobel Method, Prewitt Method, Roberts Method, Laplacian of Gaussian Method, Zero-Cross Method, and Canny Method. The interest here to find the algorithm that determines the location(s) of the IBCS in the SCM; the algorithm should, at least, be able to determine the location of the biggest IBCS; or, if many similar exists, to determine at least one of them. Sobel, Prewitt, and Roberts methods find edges using the corresponding approximation to the derivative, and return edges at those points of maximum gradient. The Laplacian of Gaussian method finds edges by looking for zero crossings after filtering the matrix with a Laplacian of Gaussian filter. Zero-cross method finds edges by looking for zero crossings after filtering matrix with a selected filter. The Canny method finds edges by looking for local maxima of the gradient. The gradient is calculated using the derivative of a Gaussian filter. The method uses two thresholds, to detect strong and weak edges, and includes the weak edges in the output only if they are connected to strong edges. This method is therefore less likely than the others to be fooled by noise and more likely to detect true weak edges[23][24]. Comparative Study of these techniques[25] have been carried out; also performance analysis of each of them [26], recommends that Canny Method has better performance while detection of edges and less sensitivity for noise. Using "Canny method" to estimate the edges of the IBCS[27]; we got the results in FIGURE 4
FIGURE 4: Canny Edge detection for SCM
International Journal of Image Processing (IJIP), Volume (6): Issue (6): 2012
471
Ayman Ahmed, Salwa ElRamly & Mohamed El. Sharkawy
4. BANDS REGROUPING TECHNIQUE Finding IBCS in SCM will help in determining groups of bands that are highly correlated to each other’s; detection threshold used in edge detection process of each IBCS is the correlation value for each GOB, which indicates the level of similarity between bands and each other. We will take "corr_mtxer" as SCM, to investigate the principle of grouping based on IBCS. for example, there is a strong correlation between the groups of bands starting from approximately band number 10 till band number 55, and group of bands starting from approximately band number 180 till band number 220 (GOB (~10-55) and GOB (~180-220)).
Detection Thr. 0.7 0.65 0.6 0.45 0.4 0.3
GOB
GOB
9-53 81-120 181-221 181-221 125-165 181-221
9-53 9-53 101-120 81-96 9-53 9-53
TABLE 2: Group of bands and correlation threshold value of detection.
FIGURE 5: GOBs correlation with each other.
FIGURE 5 and TABLE 2 illustrate the correlation between groups of bands; as we can see, the GOB (9-53) is much correlated to almost all bands in the data cube; we call it the central group of correlation. From this central band we calculate what we call Global Reference Band (GRB)[28]; this band represents the average context of the whole correlated bands in the hyperspectral data cube; we use this band to exploit spectral redundancy[29]. We use simple exponential smoothing which assumes that the data fluctuates around a reasonably stable mean as the GOB is correlated to itself; forecasting the bands is based on equation (2): (2)
Where is the band under prediction; real data of the previous (reference) band, values of the previous band, is smoothing factor, is empirically selected [30].
International Journal of Image Processing (IJIP), Volume (6): Issue (6): 2012
predicted
472
Ayman Ahmed, Salwa ElRamly & Mohamed El. Sharkawy
We apply simple exponential smoothing for GOB (9-53) to generate Global reference band (GRB); GRB is then used as a reference band represents the mean values of correlated bands.
5. J-PREDICTOR JPEG –LS[31] introduces a simple and efficient prediction scheme for spatial redundancy called median predictor or Median Edge Detection; JPEG-LS was developed with the aim of providing a low-complexity lossless and near-lossless image compression standard that could offer better compression efficiency than lossless JPEG. The JPEG-LS predictor is shown in Equation (3).
Y=
Min (N, W) if NW ≥ Max(N, W) Max(N, W) if NW ≤ Min(N, W) N + W − NW Otherwise .
(3)
FIGURE 6: Neighboring pixels location relative to predicted pixel- Median predictor.
JPEG-LS predictor uses the Neighbor pixels for prediction FIGURE 6; in our modified model we add the corresponding pixel in the GRB for prediction, as it gives a considerable amount of information about the pixel in the same location in all correlated group of bands as in FIGURE 7; JPEG-LS predictor compares the upper left pixel with the upper and left pixels to select which one is more adequate for predicting the current pixel; this exploits the spatial redundancy in the image plane; as shown earlier.
FIGURE 7: J-Predictor
The proposed predictor makes use of the collocated pixel in the previous band and predicts the current pixel based on similar model, each spectrally and spatially predicted values is assessed relative to surrounding pixel values and if spectrally predicted value is accepted it will be used in prediction process with its half weight . Y = wa Ya + wc Yc
Where, value;
(4)
spatially predicted value; spectrally predicted value, weight of spatially predicted weight of spectrally predicted value; predicted value of current pixel.
International Journal of Image Processing (IJIP), Volume (6): Issue (6): 2012
473
Ayman Ahmed, Salwa ElRamly & Mohamed El. Sharkawy
Ya =
Min (N, W) Max(N, W) N + W − NW
if if Otherwise
NW ≥ Max(N, W) NW ≤ Min(N, W) .
Yc = value of the co-located pixel in the GRB (YGRB ). wa =1-wc ; wc =
0 0 0.5
if if Otherwise
YGRB ≥ Max(N, W, NW) YGRB ≤ Min(N, W, NW) .
The model combines both spatially and spectrally predicted values with empirically selected weighting factor; it rejects the spectrally predicted value if it is far away from the surrounding pixels; while it add the spectrally predicted value multiplied by weight, in case of the value within the range. The prediction error is then encoded using JPEG2000 [33]in lossless mode.
6. RESULTS The results of using the weighted prediction model combined with JPEG2000 in lossless compression mode are compared for other techniques for the same hyperspectral data samples shown in TABLE 3. Erta_Ale Original data JPEG2000+ KLT[32] JPEG2000+ KLT Static[32] JPEG2000+ KLT Dynamic[32] JPEG2000(IWT(CDF)) PRIM+FlossTree+LSCM[34] PRIM+FlossTree+LSCM with band reorder [34] JPEG2000 with J-predictor
12 6.02 5.96 6.16 6.40 5.007 4.992
LakeMonon a 12 5.75 5.72 5.87 6.14 4.870 4.859
MtStHelen s 12 6.06 6.01 6.28 6.56 5.019 4.995
4.623
4.489
4.601
Aver age 12 5.94 5.90 6.10 6.37 4.905 4.831 4.398
TABLE 3: results of using J-predictor with JPEG2000 compared with other techniques
JPEG2000 is combined with Karhunen–Loève transform (KLT); where reversible integer wavelet transform is used for lossless transform. The PRIM+FlossTree+LSCM algorithm is combination of reordering technique followed by predictive lossless compression algorithm; Prim’s algorithm is used for bands reordering; where fast lossless Free/Libre and Open Source Software (FLOSS) algorithm is used for predictive lossless coding, the reordering process is based on local/causal Spectral Correlation Mapper[34]. Our proposed predictor has performance better than the listed techniques in table an improvement of number of bit per pixel per band is reduced using the J-predictor.
7. CONCLUSIONS As hyperspectral compression is requiring an efficient techniques for exploitation of both spatial and spectral redundancies; we have proposed a new modified predictor for lossless compression of hyperspectral data cubes; the techniques mainly depends on calculation of spectral correlation matrix to discover the correlated group of bands; and as a result we calculate the global reference band that represent a mean value of spectral information of the hyperspectral data bands; this
International Journal of Image Processing (IJIP), Volume (6): Issue (6): 2012
474
Ayman Ahmed, Salwa ElRamly & Mohamed El. Sharkawy
bans is then used in modified predictor to predict the whole bands and the residual prediction error is then encoded by JPEG2000 in lossless mode. As a comparison this technique and other techniques showed that J-predictor can minimize the prediction error and consequently the number of bits required to encode the data. The main disadvantage of this techniques is that it depends on the calculation of spectral correlation matrix; which is a time consuming process, this issue can be addressed in future research.
8. REFERENCES [1] [2]
X. Pan. R. Liu, and X. Lv, "Low-Complexity Compression Method for Hyperspectral Images Based on Distributed Source Coding," IEEE Geoscience and Remote Sensing Letters, 9(2), 224 – 227(2012). M. Slyz and L. Zhang, "A block-based inter-band lossless hyperspectral image compressor," Data Compression Conference, 2005. Proceedings, 427-436(2005).
[3]
J. Zhang and G. Liu, "Hyperspectral images lossless compression by a novel threedimensional wavelet coding," 15th international conference on Multimedia, New York, NY, USA, 2007.
[4]
F. Sepehrband, P. Ghamisi, A. zadeh, M. Sahebi, and J. Choupan, "Efficient Adaptive Lossless Compression of Hyperspectral Data using Enhanced DPCM," International Journal of Computer Applications, 35(4), 6-11 (2011).
[5]
G V lchez F Mu oz-Mar J ortea M Blanes I Gonz lez- uiz V Camps-Valls G Plaza and Serra-Sagrist n the Impact of Lossy Compression on Hyperspectral Image Classification and Unmixing," IEEE Geoscience and Remote Sensing Letters, 8(2), 253 – 257(2011).
[6]
S. Bergeron, M. Cunningham, I. Gagnon, and L. Hollinger, "Near lossless data compression onboard a hyperspectral satellite," IEEE Trans. on Aerospace and Electronic Systems, 42(3), 851 866 (2006).
[7]
B. Aiazzi L lparone S Baronti and C Lastri “Crisp and fuzzy adaptive spectral predictions for lossless and near-lossless compression of hyperspectral imagery ” IEEE Geoscience Remote Sens. Lett. (4)4, 532-536 (2007).
[8]
W. Wang, Z. Zhao, and H Zhu, "Hyperspectral Image Compression Method Based on Spectral Statistical Correlation," 2nd International Congress on Image and Signal Processing, Tianjin, china, 1 – 5(2009).
[9]
D. Manolakis, R. Lockwood, and T. Cooley, "On the Spectral Correlation Structure of Hyperspectral Imaging Data," IEEE International Geoscience and Remote Sensing Symposium, Boston, MA USA, 581-584(2008).
[10] G. Liu and F. Zhao, "Efficient compression algorithm for hyperspectral images based on correlation coefficients adaptive 3D zero tree coding," Image Processing, IET, 2(2), 72– 82(2008). [11] M J Weinberger G Seroussi and G Sapiro “L C -I: A low complexity, context-based, lossless image compression algorithm ” in Proc Data Compression Conference Snowbird UT, 140–149(1996).
International Journal of Image Processing (IJIP), Volume (6): Issue (6): 2012
475
Ayman Ahmed, Salwa ElRamly & Mohamed El. Sharkawy
[12] Z. Zhou, Y. Tan, and J. Liu, "Satellite Hyperspectral Imagery Compression Algorithm Based on Adaptive Band Regrouping," International Conference on Wireless Communications, Networking and Mobile Computing, Wuhan, China, 1-4 (2006). [13] J, Gaucel, C. Thiebaut, R. Hugues, and R. Camarero, "On-board compression of hyperspectral satellite data using band–reordering," Satellite Data Compression, Communications, and Processing VII, SPIE Proc. 8157,1152-1160 (2011). [14] D. Cesmeci, Gullu, M.K. Erturk, "Segmentation of hyperspectral images using phase correlation based on adaptive thresholding," IEEE 16th Signal Processing, Communication and Applications Conference, Aydin, Turkey, 1-4(2008). [15] M. Mori and K. Kashino, "Fast Template Matching Based on Normalized Cross Correlation Using Adaptive Block Partitioning and Initial Threshold Estimation," IEEE International Symposium on Multimedia, Taichung, Taiwan, 196 – 203(2010). [16] J. P. Lewis, "Fast Template Matching'', Canadian Image Processing and Pattern Recognition Society, Quebec, Canada, 15-19(1995). [17] Matlab www.matlab.com [March, 2012] [18] SPECTIR http://www.spectir.com/download.html [February, 2012] [19] AVIRIS, Hyperion http://compression.jpl.nasa.gov/hyperspectral/ [October, 2011] [20] G. Liu1, F. Zhao1, and G. Qu, "An efficient compression algorithm for hyperspectral images based on a modified coding framework of H.264/AVC," IEEE International Conference on Image Processing, San Antonio, TX, USA, 341-344(2007). [21] H. Liu, Y. Li. Song, and X. C. Wu, "Distributed Compressive Hyperspectral Image Sensing," Sixth International Conference on Intelligent Information Hiding and Multimedia Signal Processing 2010, Darmstadt, Germany. 15-17 (2003). [22] Q. Du, W. Zhu, H. Yang, and J.E. Fowler, "Segmented Principal Component Analysis for Parallel Compression of Hyperspectral Imagery," IEEE Geoscience and Remote Sensing Letters, 6(4), 713 – 717(2009). [23] J.CANNY, "A Computational Approach to Edge Detection," IEEE Trans. on Pattern Analysis and Machine Intelligence, 8(6), 679698(1986). [24] R. Maini and H. Aggarwal “Study and Comparison of Various Image Edge Detection Techniques International ” international Journal of Image Processing,3(1),1-11(2009). [25] R. Maini, and H. Aggarwal, "Study and Comparison of Various Image Edge Detection Techniques," International Journal of Image Processing, 3(1), (1-11)2009. [26] M. Juneja, and P. Sandhu, "Performance Evaluation of Edge Detection Techniques for Images in Spatial Domain," International Journal of Computer Theory and Engineering, 1(5), 1793-8201(2009). [27] Ayman Mahmoud, S. Elramly, and M Elsharkawy “ nalysis of Inter-band Spectral CrossCorrelation Structure of Hyperspectral Data” WSE S International Conference on Information Technology and Computer Networks (ITCN '12), Vienna, Austria, November 2012. [28] Ayman Mahmoud, S. Elramly, and M. Elsharkawy "Bands Regrouping of Hyperspectral Data Based on Spectral Correlation Matrix Analysis," International Journals of Engineering &
International Journal of Image Processing (IJIP), Volume (6): Issue (6): 2012
476
Ayman Ahmed, Salwa ElRamly & Mohamed El. Sharkawy
Sciences, 12(4), August 2012. [29]
yman Mahmoud S Elramly and M Elsharkawy “Hyperspectral band referencing based on correlation structure," IEEE International Conference on Control System, Computing and Engineering Malaysia 2012.
[30] Prajakta S. Kalekar. "Time series forecasting using Holt-Winters Exponential Smoothing," Kanwal Rekhi School of Information Technology, 1-13, (2004). [31] Marcelo J Weinberger and Gadiel Seroussi “The L C -I Lossless Image Compression Algorithm: Principles and Standardization into JPEG-LS” IEEE Transactions on Image Processing, 9(8), 1309 – 1324(2000). [32] Ian Blanes, and Joan Serra-Sagristà, "Cost and Scalability Improvements to the Karhunen– Loêve Transform for Remote-Sensing Image Coding" IEEE TRANSACTIONS ON GEOSCIENCE AND REMOTE SENSING, 48(7), 50-62 2010. [33] S Singh K Sharma and M K Sharma “Use of Wavelet Transform Extension for Graphics Image Compression using JPEG2000 Standard ” International Journal of Image Processing 3(1),55-60(2009). [34] J, Gaucel, C. Thiebaut, R. Hugues, and R. Camarero, "On-board compression of hyperspectral satellite data using band–reordering," Satellite Data Compression, Communications, and Processing VII, SPIE Proc. 81-97 (2011).
International Journal of Image Processing (IJIP), Volume (6): Issue (6): 2012
477