dictionary, also in the same feature space, by using a kernel-based greedy pursuit algorithm. The recovered sparse representation vector is then used directly to ...
1
Hyperspectral Image Classification via Kernel Sparse Representation Yi Chen1 , Nasser M. Nasrabadi2, Fellow, IEEE, and Trac D. Tran1 , Senior Member, IEEE 1
Department of Electrical and Computer Engineering, The Johns Hopkins University 3400 N. Charles Street, Baltimore, MD 21218 2 US Army Research Laboratory 2800 Powder Mill Road, Adelphi, MD 20783
Abstract—In this paper, a novel nonlinear technique for hyperspectral image classification is proposed. Our approach relies on sparsely representing a test sample in terms of all of the training samples in a feature space induced by a kernel function. For each test pixel in the feature space, a sparse representation vector is obtained by decomposing the test pixel over a training dictionary, also in the same feature space, by using a kernel-based greedy pursuit algorithm. The recovered sparse representation vector is then used directly to determine the class label of the test pixel. Projecting the samples into a high-dimensional feature space and kernelizing the sparse representation improves the data separability between different classes, providing a higher classification accuracy compared to the more conventional linear sparsity-based classification algorithms. Moreover, the spatial coherency across neighboring pixels is also incorporated through a kernelized joint sparsity model, where all of the pixels within a small neighborhood are jointly represented in the feature space by selecting a few common training samples. Kernel greedy optimization algorithms are suggested in this paper to solve the kernel versions of the single-pixel and multi-pixel joint sparsity-based recovery problems. Experimental results on several hyperspectral images show that the proposed technique outperforms the linear sparsity-based classification technique, as well as the classical Support Vector Machines and sparse kernel logistic regression classifiers.
I. I NTRODUCTION Hyperspectral imaging sensors capture images in hundreds of continuous narrow spectral bands, spanning the visible to infrared spectrum. Each pixel in a hyperspectral image (HSI) is represented by a vector whose entries correspond to various spectral-band responses. Different materials usually reflect electromagnetic energy differently at specific wavelengths. This enables discrimination of materials based on their spectral characteristics. One of the most important applications of HSI is image classification, where pixels are labeled to one of the classes based on their spectral characteristics, given a small set of training data for each class. Various techniques have been developed for HSI classification. Among the previous approaches, the support vector machine (SVM) [1], [2] has proven to be a powerful tool to solve many supervised classification problems and has shown good performances in hyThis work has been partially supported by the National Science Foundation (NSF) under Grants CCF-1117545 and CCF-0728893; the Army Research Office (ARO) under Grant 58110-MA-II and Grant 60219-MA; and the Office of Naval Research (ONR) under Grant N102-183-0208.
perspectral classification, as well [3]–[5]. Variations of SVMbased algorithms have also been proposed to improve the classification accuracy. These variations include transductive SVM, which exploits both labeled and unlabeled samples [6], and SVM with composite kernels, which incorporates spatial information directly in the SVM kernels [7]. Multinomial logistic regression [8] is another widely used classifier, which uses the logistic function to provide the posterior probability. A fast algorithm for sparse multinomial logistic regression has been developed in [9] and successfully adopted for HSI segmentation in [10], [11]. Some of the other recent HSI classification techniques can be found in [12]–[17]. In these recent methods, a feature extraction strategy is proposed in [12] for classification which generalizes the linear discriminative analysis and nonparametric discriminative analysis. In [13], the derivative information of the spectral signatures is exploited as features and then decisions obtained from spectral reflectance and derivative information are fused for the final decisions. In [14], each image band is decomposed into intrinsic mode functions (IMFs) which are adaptive to local properties via empirical mode decomposition and then SVM is applied to the lower-order IMFs for classification. In [15], the k-nearestneighbor classifier is applied to the local manifolds to exploit the intrinsic nonlinear structure of hyperspectral images. A semi-supervised classification algorithm is proposed in [16] in order to use a kernel machine which is iteratively updated by manifold regularization. In [17] the results from multiple classification/segmentation techniques are fused by postprocessing to generate the final spectral-spatial classification map. Most of the above-mentioned HSI image classification techniques do not directly incorporate the spatial or the contextual information into the classifier. Recently, sparse representation [18], [19] has also been proposed to solve many computer vision tasks [20]–[25], where the usage of sparsity as a prior often leads to state-of-theart performance. Sparse representation has also been applied to HSI target detection and classification [26]–[28], relying on the observation that hyperspectral pixels belonging to the same class approximately lie in the same low-dimensional subspace. Thus, an unknown test pixel can be sparsely represented by a few training samples (atoms) from a given dictionary and the corresponding sparse representation vector will implicitly encode the class information. The sparse representation-based
2
classifier is different from the conventional sparse classifier SVM in the following aspects. SVM is a discriminative model, while the sparse representation method can be viewed as a generative model, where the signal (pixel) is expressed as a linear combination of atoms [19]. SVM is a binary classifier that finds the separating hyperplane between two classes (multi-class SVM requires a one-against-one or one-againstall strategy). The sparse representation-based classifier is from a reconstruction point of view. The sparse decomposition of the test pixel over the entire dictionary implicitly leads to a competition between the subspaces (classes) and thus the recovered sparse representation is discriminative. Moreover, in SVM, there is an explicit training stage. The SVM classifier is trained only once and then this classifier with its fixed sparse support vectors is used to classify all of the test data. On the other hand, in our proposed approach, a new sparse representation vector is extracted for each test pixel and is thus adaptive, representing the sparsely selected atoms which are adapted to reconstruct the current test pixel. Hyperspectral images are usually smooth in the sense the pixels in a small neighborhood represent the same material and have similar spectral characteristics. Various techniques have been proposed recently to exploit the contextual correlation within HSI which have notably improved the classification and segmentation performance. Post-processing procedures are used in [29], [30] on the individually-labeled samples based on certain decision rules to impose the smoothness. Markov random fields exploit the statistical dependency among neighboring pixels and are usually applied in Bayesian approaches [11]. The composite kernel approach [7] is another way to incorporate the spatial information, which explicitly extracts spatial information for each spectral pixel and then combines the spectral and spatial information via kernel composition. Joint sparsity model [31] is exploited in sparsity-based HSI target detection and classification [27], [28], where the neighboring pixels are simultaneously represented by a sparse linear combination of a few common training samples. Each pixel, although sharing the same common support, might have weighting coefficients taking on different values. In this way, the smoothness across neighboring spectral pixels is enforced directly in the classification stage, and no post-processing steps are performed. The details of composite kernels and the joint sparsity model will be further discussed in the following sections. It is well known that for the classical HSI image classification and target detection algorithms, the use of kernel methods yields a significant performance improvement [5], [32], because the kernel-based algorithms implicitly exploit the higher-order structure of the given data which may not be captured by the linear models. Therefore, if the data set is not linearly separable, kernel methods [33]–[36] can be applied to project the data into a nonlinear feature space in which the data becomes more separable. In practical implementation, the kernel trick [37] is often used in order to avoid explicitly evaluating the data in the feature space. In this paper, we propose a new HSI classification algorithm based on kernel sparse representation by assuming that a test pixel can be linearly represented by a few training samples in
the feature space. The kernel sparse representation vector is then obtained by decomposing the test pixel represented in a high dimensional feature space over a structured dictionary consisting of training samples from all of the classes in the same feature space. The recovered sparse vector is used directly for classification. Although the proposed approach has a similar formulation as previous kernel regression approaches with a sparse prior such as kernel matching pursuit [33], kernel basis pursuit [34], and generalized LASSO [38], the underlying ideas are quite different. The objective of these previous approaches is to approximate a function as a linear combination of dictionary functions, which are the kernels centered at the training points, by minimizing certain loss function evaluated at these training points and subject to a sparsity prior. Therefore, the target vector for fitting consists of the observations of the function value at the training points, and the dictionary is then the dictionary functions evaluated at the training points which turns out to be the kernel matrix. In our proposed approach, the target vector is the test pixel itself in the feature space. It is not the similarity measure between the test sample and training samples and may not have an explicit expression. The dictionary also consists of the training samples in the feature space and can not assume an explicit expression either. The recovered sparse representation vector can be viewed as a discriminative feature extracted from the test pixel and is used directly for classification. The contextual correlation between pixels within a small spatial neighborhood can be incorporated into the kernel sparse representation through the joint sparsity model [31], where all neighboring pixels are simultaneously represented by a linear combination of a few common training samples in the feature space. Furthermore, the composite kernel approach [7] can also be used with the proposed kernel sparse representation model in order to combine spectral and spatial information. Efficient kernel-based optimization algorithms are discussed in this paper for the recovery of the kernel sparse representations for both single-pixel and multi-pixel joint sparsity models. Notation-wise, vectors and matrices are denoted by lowerand upper-case bold letters, respectively. For a vector α ∈ RN and an index set Λ ⊆ {1, . . . , N} with |Λ| = t, α Λ ∈ Rt is the portion of α indexed on Λ. For a matrix S ∈ RN1 ×N2 , index sets Λ1 ⊆ {1, . . . , N1 } with |Λ1 | = t1 , and Λ2 ⊆ {1, . . . , N2 } with |Λ2 | = t2 , S Λ1 ,: ∈ Rt1 ×N2 is a submatrix of S consisting of the t1 rows in S indexed on Λ1 , S :,Λ2 ∈ RN1 ×t2 consists of the t2 columns in S indexed on Λ2 , and S Λ1 ,Λ2 ∈ Rt1 ×t2 is formed by the rows and columns of S indexed on Λ1 and Λ2 , respectively. The remainder of this paper is structured as follows. Section II briefly introduces the sparsity-based HSI classification technique. Section III defines the sparsity models in the feature space, then discusses how to incorporate spatial information, and describes the kernel sparse recovery algorithms. Experimental results are shown in Section IV, and conclusions are drawn in Section V. II. S PARSITY- BASED HSI C LASSIFICATION This section briefly introduces the sparsity-based algorithm for HSI classification, and more details can be found in [26]– [28]. It is assumed that the spectral signatures of pixels
3
belonging to the same class approximately lie in the same lowdimensional subspace. Thus, an unknown test sample x ∈ RB , where B is the number of spectral bands, can be written as a sparse linear combination of all of the training pixels as x = Aα , (1) � � where A = a 1 a 2 · · · a N ∈ RB×N is a structured dictionary whose columns {aai }i=1,2,...,N are N training samples (referred to as atoms) from all classes, and α ∈ RN is an unknown sparse vector. The index set on which α have nonzero entries is the support of α . The number of nonzero entries in α is called α k0 . Given the the sparsity level K of α and denoted by K = kα dictionary A , the sparse coefficient vector α is obtained by solving αˆ = arg min kxx − Aα k2
subject to
αk0 ≤ K0 , kα
m=1,...,M
If the classes in the dataset are not linearly separable, then the kernel methods can be used to project the data into a feature space, in which the classes become linearly separable [1]. The kernel function κ : RB × RB 7→ R is defined as the inner product
� κ(xxi ,xx j ) = φ(xxi ), φ(xx j ) . (7) Commonly used kernels include� the radial �Basis Func 2
tion (RBF) kernel κ(xxi ,xx j ) = exp −γ x i − x j with γ > 0 controlling the width of the RBF, and order−d homogeneous and inhomogeneous polynomial kernels κ(xxi ,xx j ) = (xxi ·xx j )d and κ(xxi ,xx j ) = (xxi ·xx j + 1)d , respectively. In this section, we describe how the sparsity models in Section II can be extended to a feature space induced by a kernel function.
(2)
where K0 is a preset upper bound on the sparsity level. The problem in (2) is NP-hard, which can be approximately solved by greedy algorithms, such as Orthogonal Matching Pursuit (OMP) [39] or Subspace Pursuit (SP) [40]. The class label of x is determined by the minimal residual between x and its approximation from each class sub-dictionary: Class(xx) = arg min kxx − A :,Ωm αˆ Ωm k2 ,
III. K ERNEL S PARSE R EPRESENTATION
(3)
A. Pixel-wise Sparsity in Feature Space Let x ∈ RB be the data point of interest and φ(xx) be its representation in the feature space. The kernel sparse representation of a sample x in terms of training atoms a i ’s can be formulated as �T � �� φ(xx ) = φ (aa1 ) · · · φ (aaN ) α′1 · · · α′N = A φα ′ , (8) {z }| {z } | Aφ
α′
(5)
where the columns of Aφ are the representations of training samples in the feature space and α′ is assumed to be a sparse vector. Similar to the linear sparse recovery problem in (2), α′ can be recovered by solving
αˆ ′ = arg min φ(xx ) − Aφα ′ 2 subject to α ′ 0 ≤ K0 . (9) The problem in (9) can be approximately solved by kernelizing the OMP and SP algorithms (denoted by KOMP and KSP, respectively). Note that in the above problem formulation, we are solving for the sparse vector α ′ directly in the feature space using the implicit feature vectors, but not evaluating the kernel functions at the training points. In KOMP and KSP, essentially each dot product operation in OMP/SP is replaced by the kernel trick in (7). Let K A ∈ RN×N be the kernel matrix whose (i, j)th entry is κ (aai ,aa j ), and kA ,xx ∈ RN be the vector whose ith entry is κ (aai ,xx). Using the feature representations, the correlation (dot product) between a pixel φ(xx ) and a dictionary atom φ(aai ) is then computed by � ci = hφ (xx) , φ (aai )i = κ (xx,aai ) = kA,xx i , (10) the orthogonal projection coefficient of φ(xx) onto a set of selected dictionary atoms {φ(aan )}n∈Λ is given as �−1 � � K A )Λ,Λ p Λ = (K kA,xx Λ , (11)
where kSSkrow,0 denotes the number of non-zero rows of S and k·kF denotes the Frobenius norm. The problem in (5) can be approximately solved by the simultaneous versions of OMP (SOMP) [31] or SP (SSP) [28]. The label of the center pixel x 1 is then determined by the minimal total residual:
X − A:,Ωm SˆΩm ,: , Class(xx 1 ) = arg min X (6)
Note that the feature representation of the residual vector φ(rr ) in (12) cannot be evaluated explicitly. However, the correlation between φ(rr ) and an atom φ(aai ) can be computed by � �−1 � � K A )i,Λ (K K A )Λ,Λ ci = hφ (rr ) , φ (aai )i = kA,xx i − (K kA ,xx Λ . (13)
where Ωm ⊂ {1, 2, . . ., N} is the index set associated with the training samples belonging to the mth class. As pointed out in [25], the sparse representation-based classifier can be viewed as a generalization of the nearest neighbor classifier [41]. In HSI, pixels within a small neighborhood usually consist of similar materials and, thus, their spectral characteristics are highly correlated. The spatial correlation between neighboring pixels can be incorporated through a joint sparsity model [27], [31] by assuming the underlying sparse vectors associated with these pixels share a common sparsity pattern as follows. Let {xxt }t=1,...,T be T pixels in a spatial neighborhood centered at x 1 . These pixels can be compactly represented as � � � � X = x 1 x 2 · · · x T = Aα 1 Aα 2 · · · Aα T � � = A α 1 α 2 · · · α T = AS . (4) | {z } S
αt }t=1,...,T In the joint sparsity model, the sparse vectors {α share the same support Λ and, thus, S is a sparse matrix with only |Λ| nonzero rows. The row-sparse matrix S can be recovered by solving the following optimization problem X − AS kF Sˆ = arg min kX
subject to
m=1,...,M
where k·kF denotes the Frobenius norm.
kSS krow,0 ≤ K0 ,
F
and the residual vector between φ(xx) and �its approximation using the selected atoms {φ(aan )}n∈Λ = A φ :,Λ is then expressed as �−1 � � � K A )Λ,Λ kA ,xx Λ . φ(rr ) = φ(xx ) − A φ :,Λ (K (12)
4
The KOMP and KSP greedy algorithms, similar to the linear OMP and SP algorithms, are used to locate the support Λ of the sparse vector αˆ ′ . The KOMP algorithm augments the support set by only one index, which is given by λ = argmaxi=1,...,N ci with ci being defined in (13) and φ(rr ) being the residual vector from the previous iteration, at each iteration until K0 atoms are selected or the approximation error (i.e., norm of the residual vector in (12)) is within a preset threshold. The KSP algorithm maintains a set of K0 indices with a backtracking mechanism. At each iteration, the index set is refined by adding K0 new candidates, whose associated atoms have the K0 highest correlation (13) to the residual vector from the previous iteration, to the current list and then discarding K0 insignificant ones from the list of 2K0 candidates. This process repeats until certain stopping criterion is met. In both of the KOMP and KSP algorithms, after the support set Λ of αˆ ′ is determined, the entries of αˆ ′ indexed on Λ are computed by the orthogonal projection of the test pixel onto the selected dictionary atoms using (11). The KOMP/KSP algorithms can be viewed as special cases, with T = 1, of the kernelized SOMP/SSP algorithms (Algorithms 1 and 2) proposed in the next section, respectively. The details are thus omitted herein. Once the sparse vector αˆ ′ is recovered, the residual between the test sample and the mth-class reconstruction in the highdimensional feature space is then computed by
�
rm (xx) = φ(xx ) − A φ :,Ωm αˆ ′Ωm D E1/2 � � = φ(xx) − A φ :,Ωm αˆ ′Ωm , φ(xx ) − A φ :,Ωm αˆ ′Ωm � �1/2 � ˆ ′T K A )Ωm ,Ωm αˆ ′Ωm = κ(xx,xx) − 2αˆ ′T , Ωm k A ,xx Ωm + α Ωm (K (14) where k A,xx and K A are as defined above, and Ωm is the index set associated with the mth class. The class label of x is determined as Class(xx) = arg min rm (xx). (15) m=1,...,M
B. Joint Sparsity in Feature Space The joint sparsity model in (4) can also be extended to the feature space as follows: � � � � X φ = φ (xx1 ) · · · φ (xxT ) = A φα ′1 · · · A φα ′T � � = A φ α ′1 · · · α ′T = A φS ′ , (16) {z } | S′
αt′ }t=1,...,T share the same support. The where the vectors {α ′ row-sparse matrix S is recovered by solving
′ Sˆ = arg min X φ − A φS ′ F subject to S ′ row,0 ≤ K0 . (17) In this paper, we propose the kernelized SOMP (KSOMP) and the kernelized SSP (KSSP) algorithms in order to approximately solve the above joint sparse recovery problem in (17). In KSOMP, at every iteration, the atom that simultaneously yields the best approximation to all the T pixels (or residuals after initialization) is selected. Specifically, let C ∈ RN×T be the correlation matrix whose (i, j)th entry is the correlation between φ(aai ) and φ(rr j ), where φ(rr j ) is the residual vector of φ(xx j ). The new atom is then selected as the one associated with
the row of C , which has the maximal ℓ p -norm for some p ≥ 1. The KSOMP algorithm is summarized in Algorithm 1. Note that when computing the projection in (11) and correlation in (13), a regularization term λII is added in order to have a stable inversion, where λ is typically a small scalar (e.g. in the order of 10−5) and I is an identity matrix whose dimensionality should be clear from the context. � � Input: B ×�N dictionary �A = a 1 · · · a N , B × T data matrix X = x 1 · · · x T , kernel function κ, and a stopping criterion Initialization: compute the kernel matrices K A in Algorithm 1 (Initialization) and K A,XX ∈ RN×T whose (i, j)th entry
�
is κ (aai ,xx j ). Set index set Λ0 = arg max K A,XX i,: with i=1,...,N
p
some p ≥ 1 and iteration counter t = 1. while stopping criterion has not been met do (1) Compute the correlation matrix � �−1 � K A )Λt−1 ,Λt−1 + λII K A ):,Λt−1 (K K A,XX Λ C = K A ,XX −(K
t−1 ,:
∈ RN×T
C i,: k p , p ≥ 1 (2) Select the new index as λt = arg max kC
(3) Update the index set Λt = Λt−1 (4) t ← t + 1 end while
i=1,...,N S
{λt }
Output: Index set Λ = Λt−1 , the sparse representation ′ ′ Sˆ whose nonzero rows indexed by Λ are Sˆ Λ,: = � K Λ,Λ + λII )−1 K A,XX Λ,: (K Algorithm 1: Kernelized Simultaneous Orthogonal Matching Pursuit (KSOMP)
Similarly, KSSP is a simultaneous version of KSP where the K0 atoms that best simultaneously approximate all of the T residuals in terms of the ℓ p -norm are chosen. The KSSP algorithm is summarized in Algorithm 2. Note that the step for computing the residual vectors (12) is incorporated into the computation of the correlation vector in Step (1) of both KSOMP and KSSP. ′ Once the matrix Sˆ is recovered, the total residual between the T neighboring pixels and their approximations from the mth-class training samples is computed by ! � 1/2 T � � ′T ′ ′T ˆ ˆ ˆ K A )Ωm ,Ωm S Ωm ,i , rm (xx1 ) = ∑ κ(xxi ,xx i ) − 2SΩm ,i K A ,XX Ωm ,i + S Ωm ,i (K i=1
(18) where K A,XX and K A are as defined in Algorithms 1 and 2, and Ωm ∈ {1, 2, . . . , N} is the index set associated with the mth class. The label for the center pixel x1 is then determined by the total residual Class(xx1 ) = arg min rm (xx1 ). (19) m=1,...,M
C. Kernel Sparse Representation with a Composite Kernel Another way to address the contextual correlation within HSI is though a composite kernel [7], which takes into account the spatial correlation between neighboring pixels
5
where µ ∈ (0, 1), and κs and κw are the kernel functions of the spatial and spectral features, respectively. The composite kernels can be directly applied to the pixelwise sparsity model in the feature space in (8). The sparse Initialization: compute the kernel matrices K A in Algo- representation vector can be recovered using the KOMP or rithm 1 (Initialization) and K A,XXn∈ RN×T whose (i, j)th entry KSP algorithm, where the kernel matrix KA is now a weighted summation of the spectral and spatial kernel matrices of the is κ (aai ,xx j ). Set index set Λ0 = K0 indices corresponding to training dictionary A , and the vector kA,xx also needs to be
o �
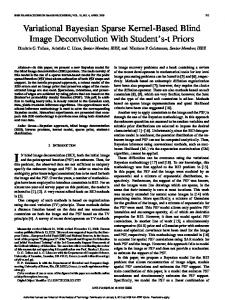
the K0 largest numbers in K A ,XX i,: , p ≥ 1, i = 1, . . . , N , modified accordingly. p It is worth noting that the composite kernel approach is and set iteration counter t = 1. different from the kernel joint sparsity model discussed in while stopping criterion has not been met do Section III-B. The joint sparsity model involves only the (1) Compute the correlation matrix � �−1 spatial information of the test pixels, and no prior knowledge � N×T K A ):,Λt−1 (K K A )Λt−1 ,Λt−1 + λII K A,XX Λ ,: ∈ Rabout C = K A ,XX −(K the neighbors of the training pixels is needed. On the t−1 n other hand, for the composite kernels, the spatial information (2) Find the index set I = K0 indices corresponding to for both training and test sets are necessary. Moreover, the joint o C i,: k p , p ≥ 1, i = 1, . . . , N the K0 largest numbers in kC sparsity model does not assume a sum or average of the same S samples, but treats all pixels in a small neighborhood equally ˜ t = Λt−1 I (3) Update the candidate index set Λ (4) � Compute � the projection coefficients and finds the sparsity pattern that simultaneously represents −1 � these pixels. K A )Λ˜ t ,Λ˜ t + λII P = (K K A,XX Λ˜ t ,: ∈ R2K0 ×T n IV. E XPERIMENTAL R ESULTS ˜ t cor(5) Update the index set Λt = K0 indices in Λ In this section, we show the effectiveness of the proposed Pi,: k p , p ≥ 1, responding to the K0 largest numbers in kP o algorithms on classification of several hyperspectral datasets. i = 1, . . . , N For each image, we solve the sparse recovery problems (6) t ← t + 1 in (2), (5), (9), and (17) for each test sample, and then deterend while mine the class by the minimal residual (the results are denoted by OMP/SP, KOMP/KSP, SOMP/SSP, and KSOMP/KSSP, Output: Index set Λ = Λt−1 , the sparse representation respectively). The results of KOMP and KSP with composite ′ ′ Sˆ whose nonzero rows indexed by Λ are Sˆ Λ,: = kernels, as discussed in Section III-C, are denoted by KOM� K Λ,Λ + λII )−1 K A,XX Λ,: (K PCK and KSPCK, respectively. The classification results are then compared visually and quantitatively to those obtained Algorithm 2: Kernelized Simultaneous Subspace Purby the classical SVM classifier and sparse multinomial kernel suit (KSSP) logistic regression (KLR). For SVM and KLR classifiers, we use a spectral-only kernel (denoted by SVM/KLR), as by combining kernels dedicated to the spectral and spatial well as a composite kernel (denoted by SVMCK/KLRCK). information. The composite kernel approach has been shown In all classifiers with a composite kernel, we use a weighted to significantly outperform the spectral-only classifier in HSI summation kernel and the spatial information is the mean classification [42]. This method, although originally proposed of pixels in a small neighborhood. The parameters for KLR, for SVM, can be readily incorporated into other classifiers KLRCK, SVM, and SVMCK are obtained by cross-validation. which operate in the feature space, such as kernel logistic The first hyperspectral image in our experiments is the regression and the kernel sparse representation-based classifier Airborne Visible/Infrared Imaging Spectrometer (AVIRIS) improposed in this paper. Specifically, let x wi be the spectral age Indian Pines [43]. The AVIRIS sensor generates 220 pixel at location i in a hyperspectral image and x si be the bands across the spectral range from 0.2 to 2.4 µm. In the spatial information extracted from a small neighborhood cen- experiments, the number of bands is reduced to 200 by tered at location i, which is usually the mean and/or the removing 20 water absorption bands. This image has spatial standard deviation of the pixels within the neighborhood. resolution of 20 m per pixel and spatial dimension 145×145. It The new pixel entity at this location can be redefined as contains 16 ground-truth classes. For each class, we randomly x i = {xxi ,xx si }. Note that in previous sections x i contains only choose around 10% of the labeled samples for training and use spectral information (i.e., x i = x wi ). The spectral and spatial the remaining 90% for testing, as shown in Table I and Fig. 1. information can then be combined in a variety of ways, Radial Basis Function (RBF) kernels are used in all kernelincluding stacking, direct summation, weighted summation, based classifiers (i.e., SVM, SVMCK, KLR, KLRCK, KOMP, and cross-information kernels [7]. In this paper, we consider KSP, KSOMP, KSSP, KOMPCK, and KSPCK). Since this the weighted summation kernel, which is shown to yield the image consists of large homogenous regions, a large spatial best classification performance compared to other types of window of size 9 × 9 (T = 81) is used in classifiers with a composite kernels [7]. The kernel function in this case is composite kernel and the joint sparsity models (4) and (16). The classification performance for each of the 16 classese, � � (20) overall accuracy (OA), average accuracy (AA), and the κ κ (xxi ,xx j ) = µκs x si ,xxsj + (1 − µ)κw x wi ,xxwj , � � Input: B ×�N dictionary �A = a 1 · · · a N , B × T data matrix X = x 1 · · · x T , kernel function κ, and a stopping criterion
6
coefficient measure [44] on the test set are shown in Table II. The OA is the ratio between correctly classified test samples and the total number of test samples, the AA is the mean of the 16 class accuracies, and the κ coefficient is a robust measure of the degree of agreement. The classification maps on labeled pixels are presented in Fig. 2, where the algorithm and OA are shown on top of each corresponding map. One can clearly see that incorporating the contextual correlation and operating in the feature space both have significantly improved the classification accuracy. The KOMPCK and KSPCK algorithms outperform all other classifiers - the OA for both of which are greater than 98%. The KSOMP and KSSP algorithms also yield superior performance, which have only about 1% lower OA than KOMPCK and KSPCK. Note that the kernel joint sparsity model for KSOMP and KSSP does not assume any prior knowledge of the neighbors of the training samples as the composite kernel approach does.
(a)
TABLE I T HE 16 GROUND - TRUTH CLASSES IN THE AVIRIS I NDIAN P INES IMAGE .
No 1 2 3 4 5 6 7 8 9 10 11 12 13 14 15 16
Class Name Alfalfa Corn-notill Corn-min Corn Grass/Pasture Grass/Trees Grass/Pasture-mowed Hay-windrowed Oats Soybeans-notill Soybeans-min Soybean-clean Wheat Woods Building-Grass-Trees-Drives Stone-steel Towers Total
Samples Train Test 6 48 144 1290 84 750 24 210 50 447 75 672 3 23 49 440 2 18 97 871 247 2221 62 552 22 190 130 1164 38 342 10 85 1043 9323
The sparsity level K0 and RBF parameter γ used in the above experiments are obtained from a small validation set. An n-fold cross validation would not be appropriate for finding the optimal sparsity level, unless n is large (e.g., leave-oneout cross validation). This is because the sparsity level K0 is related to the size of dictionary, therefore the optimal K0 for part of the dictionary may not be optimal anymore for the entire dictionary. Now we examine how these two parameters affect the classification performance on the Indian Pines image. We use randomly selected 10% of all labeled samples as the training set and the remaining samples as the test set, then vary K0 from 5 to 80 and γ from 2−3 to 212 in KOMP, KSP, KSOMP, and KSSP. The experiment for each γ, K0 , and each of the four algorithm is repeated five times using different randomly-chosen training sets to avoid any bias induced by random sampling. The window size is fixed at 9 × 9 for KSOMP and KSSP due to its smoothness. The OA on the test set, averaged over five independent realizations, are shown in Fig. 3. The bars indicate the maximal and minimal accuracies in five runs at each point, and we see that the the fluctuation is usually within 2% and within 1% in a majority of cases. One can observe from Figs. 3(a) and
Fig. 1.
(b)
Alfalfa
Oats
Corn−notill
Soybeans−notill
Corn−min
Soybeans−min
Corn
Soybean−clean
Grass/Pasture
Wheat
Grass/Trees
Woods
Grass/Pasture−mowed
Building−Grass−Trees−Drives
Hay−windrowed
Stone−steel Towers
(a) Training and (b) test sets for the Indian Pines image.
(b) that for the pixel-wise kernel sparsity model, γ = 512 leads to the highest OA at all sparsity levels. For a fixed γ, the performance of KOMP and KSP generally improves as K0 increases, and tends to saturate as K0 reaches 30-50. For KSOMP and KSSP, as shown in Figs. 3(c) and (d), the same tendency cannot be observed. However, the kernel joint sparsity model is more stable than the pixel-wise model, as for a large range of sparsity level K0 and sufficiently large γ, the overall accuracy is always around 96% with a small variance. The stable performance suggests that we could also use empirical parameters K0 and γ. In KSOMP and KSSP algorithms, a regularization term λII is added to stabilize the matrix inversion, where λ is a small scalar and is chosen as λ = 10−5 in our implementation. This parameter, however, does not seriously affect the classification performance, because the kernel matrix KA is usually invertible and regularization is not really needed. Fig. 4 shows the OA as a function of λ on the Indian Pines image, using the KSOMP and KSSP algorithms with 10% training samples while all other parameters are fixed. The classification performance remains the same until λ becomes as large as 10−3 . The next two hyperspectral images used in our experiments, the University of Pavia and the Center of Pavia images, are urban images acquired by the Reflective Optics System Imaging Spectrometer (ROSIS). The ROSIS sensor generates 115 spectral bands ranging from 0.43 to 0.86 µm and has a spatial resolution of 1.3-meters per pixel [42]. The University of Pavia image consists of 610 × 340 pixels, each having 103 bands, with the 12 most noisy bands removed. There are nine ground-truth classes of interests, as shown in Table III. For this image, we follow the same experiment settings for the training and test sets as used in [30], [42], in which about 9% of labeled data are used as training and the rest are used for testing, as shown in Table III and Fig. 5. The classification accuracies and the κ coefficients on the
7
TABLE II C LASSIFICATION ACCURACY (%) FOR THE I NDIAN P INES IMAGE USING 10% TRAINING SAMPLES AS SHOWN IN F IG . 1 AND TABLE I. Class 1 2 3 4 5 6 7 8 9 10 11 12 13 14 15 16 OA AA κ
SVM 81.25 86.28 72.80 58.10 92.39 96.88 43.48 98.86 50 71.53 84.38 85.51 100 93.30 64.91 88.24 84.52 79.24 0.823
SVMCK 95.83 96.67 90.93 85.71 93.74 97.32 69.57 98.41 55.56 93.80 94.37 93.66 99.47 99.14 87.43 100 94.86 90.73 0.941
KLR 64.58 89.46 70.67 67.14 90.60 98.07 17.39 98.86 16.67 74.97 84.87 81.16 100 95.02 61.70 57.65 84.78 73.05 0.826
KLRCK 75.00 96.43 95.47 86.19 96.42 98.66 82.61 97.95 50 93.80 95.54 91.85 100 96.56 88.01 88.24 95.10 89.55 0.944
OMP 68.75 65.97 60.67 38.57 89.49 95.24 21.74 97.05 33.33 68.20 75.96 54.53 100 92.87 41.23 94.12 74.78 68.61 0.712
KOMP 72.92 86.36 77.47 62.86 90.38 97.17 21.74 98.18 55.56 77.61 85.68 77.90 100 95.70 55.85 92.94 85.26 78.02 0.832
SOMP 85.42 94.88 94.93 91.43 89.49 98.51 91.30 99.55 0 89.44 97.34 88.22 100 99.14 99.12 96.47 95.28 88.45 0.946
KOMPCK 97.92 99.22 96.93 95.24 98.43 99.11 100 100 88.89 98.05 97.43 98.73 100 99.40 97.95 97.65 98.33 97.81 0.981
SP 68.75 74.65 63.20 40.00 89.04 95.98 21.74 99.09 61.11 70.72 77.94 61.23 100 95.62 48.25 92.94 78.10 72.52 0.749
KSP 72.92 87.91 78.53 62.86 90.60 96.88 21.74 98.64 55.56 79.33 86.90 78.44 100 95.96 55.56 94.12 86.09 78.50 0.841
SSP 81.25 95.74 92.80 82.38 93.29 98.81 82.61 99.77 0 91.27 97.43 89.13 99.47 99.05 97.95 92.94 95.34 87.12 0.947
KSSP 91.67 97.98 97.73 96.67 94.85 98.96 17.39 100 0 94.37 98.33 97.46 100 99.91 97.08 94.12 97.46 86.03 0.971
KSPCK 95.83 99.15 96.93 97.14 98.21 99.11 100 99.97 100 97.70 98.20 98.73 100 99.48 97.37 95.29 98.47 98.31 0.983
than that for SVMCK and KLRCK, which affect the OA because this class contains more than 45% of the samples in the entire test set. This could be circumvented by selecting or learning a more representative training set which is sufficiently comprehensive to span the class subspace.
97.4 97.2
Overall accuracy (%)
KSOMP 97.92 97.21 96.67 93.33 95.75 99.55 60.87 100 0 94.60 99.28 95.65 100 99.83 91.81 91.76 97.33 88.39 0.970
97 96.8
TABLE III T HE 9 GROUND - TRUTH CLASSES IN THE U NIVERSITY OF PAVIA IMAGE .
96.6
No 1 2 3 4 5 6 7 8 9
96.4 96.2 96 −12 10
KSSP KSOMP −10
10
−8
10
−6
10 λ
−4
10
−2
10
0
10
Fig. 4. Effect of the regularization term λII in the kernel sparse recovery algorithms using 10% of all labeled samples in the Indian Pines image as the training set.
test set using various techniques are shown in Table IV, and the classification maps for all labeled pixels are presented in Fig. 6. Again, the RBF kernel is used for all kernelbased algorithms. This urban image lacks the large spatial homogeneity. Therefore, a smaller neighborhood of size 5 × 5 is optimal for algorithms using a composite kernel, and the linear and kernel joint sparsity models. Similar to the Indian Pines image, the proposed KSOMP/KSSP algorithms achieve better or comparable performance when compared with the SVMCK classifier for most of the classes. KSOMP yields the best accuracy in five out of the total nine classes, and KSSP has the highest OA, AA, and κ coefficient. The overall performance of SVM, KOMP, and KSP, which are kernel methods for pixel-wise models, are comparable, and by incorporating the contextual information, the SVMCK, KSOMP, and KSSP techniques still have comparable performance. The sparsitybased algorithms generally do not handle the second class, representing Meadows, very well. For example, the accuracy for the second class for KSOMP and KSSP is 5%-9% lower
Class Name Asphalt Meadows Gravel Trees Metal sheets Bare soil Bitumen Bricks Shadows Total
Samples Train Test 548 6304 540 18146 392 1815 524 2912 265 1113 532 4572 375 981 514 3364 231 795 3921 40002
Asphalt Meadows Gravel Trees Metal sheets Bare soil Bitumen Bricks Shadows
(a) Fig. 5.
(b)
(a) Training and (b) test sets for the University of Pavia image.
In the sequel, we examine how the number of training samples affects the classification performance for various algorithms on the Indian Pines and the University of Pavia images. The algorithm parameters are fixed to be the same as those used to generate the results in Tables II and IV. For the Indian
8
Ground Truth
SVM, OA = 84.52
SVMCK, OA = 94.86
KLR, OA = 84.78
KLRCK, OA = 95.10
OMP, OA = 74.78
KOMP, OA = 85.26
SOMP, OA = 95.28
KSOMP, OA = 97.33
KOMPCK, OA = 98.33
SP, OA = 78.10
KSP, OA = 86.09
SSP, OA = 95.34
KSSP, OA = 97.46
KSPCK, OA = 98.47
Fig. 2.
Classification maps and overall classification accuracy (OA) for the Indian Pines image on labeled pixels with 10% training samples.
TABLE IV C LASSIFICATION ACCURACY (%) FOR THE U NIVERSITY OF PAVIA IMAGE USING 3921 ( AROUND 9%) TRAINING SAMPLES AS SHOWN IN F IG . 5 AND TABLE III. Class 1 2 3 4 5 6 7 8 9 OA AA κ
SVM 84.30 67.01 68.43 97.80 99.37 92.45 89.91 92.42 97.23 79.15 87.66 0.737
SVMCK 79.85 84.86 81.87 96.36 99.37 93.55 90.21 92.81 95.35 87.18 90.47 0.833
KLR 82.96 83.34 64.13 96.33 99.19 80.05 84.51 83.17 89.81 83.56 84.83 0.784
KLRCK 74.40 85.91 61.71 96.22 99.10 84.45 85.32 93.37 96.48 84.77 86.33 0.799
OMP 68.23 67.04 65.45 97.29 99.73 73.27 87.26 81.87 95.97 73.30 81.79 0.661
KOMP 76.09 69.61 72.12 98.11 99.73 87.66 88.07 89.51 93.96 78.33 86.10 0.725
SOMP 59.33 78.15 83.53 96.91 99.46 77.41 98.57 89.09 91.95 79.00 86.04 0.728
Pines image, in each test, we randomly choose 1% to 30% of the labeled data in each class as the training samples and the remaining samples as the test ones. The classification accuracy plots under various conditions are shown in Fig. 7(a) for the Indian Pines image, where the x-axis denotes the percentage of training samples from the total available labeled samples, and the y-axis is the OA on the test set. The accuracies are averaged over five runs for each classifier at each percentage level to avoid any bias induced by random sampling, and the bars indicate the maximal and minimal accuracies for each point in the five runs. The OA monotonically increase as the size of training set increases, and the variance is small (the difference between the maximum and minimum is within 1%) when at least 5%-10% training samples become available. The
KSOMP 94.23 76.74 79.23 95.12 100 99.50 99.80 98.78 29.06 85.67 85.83 0.815
KOMPCK 82.23 72.47 82.26 98.56 99.82 93.92 92.46 78.78 96.98 81.07 88.61 0.758
SP 69.78 67.90 69.20 96.77 99.64 78.96 88.18 83.68 94.59 74.86 83.19 0.681
KSP 76.67 70.92 73.39 98.15 99.82 89.70 88.28 87.54 95.22 79.18 86.63 0.735
SSP 69.59 72.31 74.10 95.33 99.73 86.72 90.32 90.46 90.94 78.39 85.50 0.724
KSSP 89.56 79.98 85.45 98.66 99.91 95.76 97.96 96.43 98.49 87.65 93.58 0.840
KSPCK 89.64 72.68 80.06 98.94 100 94.77 89.81 89.54 96.48 83.19 90.21 0.785
KOMPCK and KSPCK consistently yield higher OA than any other classifiers. For the University of Pavia image, we create a balanced dictionary by randomly choosing L = 10, 20, 30, 50, 100, and 200 training samples per class, and these training samples are a subset of the entire training set shown in Fig. 5(a). Since the dictionary is considerably small, the sparsity level K0 is set to be no more than L. The classification accuracy plots are shown in Fig. 7(b), where the x-axis denotes the number of training samples per class, and the y-axis is the overall classification accuracy on the test set. Again, the accuracies are averaged over five runs for each classifier at each L and the bars represent the maximum and minimum in the five runs. It is obvious that in most cases the OA increases monotonically
9
86
86
84 84
80 78 76 K0 = 5 74
K0 = 10
72
K0 = 20
70
K0 = 50
Overall accuracy (%)
Overall accuracy (%)
82
82
80 K0 = 5 K0 = 10
78
K0 = 20
K0 = 30
K0 = 30 K0 = 50
76
K0 = 80
68 −2
0
2
4 log2(γ)
6
8
10
K0 = 80
12
−2
0
2
(a)
4 log2(γ)
6
8
10
12
(b) 97
96
92
K0 = 5
90
K0 = 10 K0 = 20
88
Overall accuracy (%)
Overall accuracy (%)
96 94
95
94 K0 = 5 K0 = 10
93
K0 = 20
K0 = 30 K0 = 50
K0 = 30 K0 = 50
92
K0 = 80
86 −2
0
2
4 log2(γ)
6
8
10
12
K0 = 80 −2
0
(c) Fig. 3.
2
4 log2(γ)
6
8
10
12
(d)
Effect of sparsity level K0 and RBF kernel parameter γ on the Indian Pines image using (a) KOMP, (b) KSP, (c) KSOMP, and (d) KSSP.
and the variance decreases as the number of training samples increases. For the University of Pavia image, the performance at L = 50 is almost the same as that at L = 100 for all classifiers. The SVMCK classifier consistently outperforms all of the other classifiers when the number of training samples is small, but the curves for SVMCK and KSSP tend to converge as more training samples are available (see Table IV for the performance comparison of SVMCK and KSSP with a large training set). It should also be pointed out again that during the training stage of algorithms using a composite kernel, in order to extract the spatial features for each training sample, one requires knowledge of the neighboring pixels or the location of the training sample, which may not be available in the training set. Moreover, the proposed sparsity-based algorithms rely on the approximation accuracy from each class sub-dictionary. Therefore, if the size of the sub-dictionary is too small, the training samples may not be sufficient to faithfully represent the subspace associated with each class, leading to a lower classification accuracy than the discriminative classifier SVM. A closer inspection of the performance gain, as a function of the dictionary size, obtained by kernelization and contex-
tualization is shown in Figs. 8 and 9, respectively. The y-axis represents the relative gain in percentage (averaged over five runs), which is ratio between the improvement in accuracy and the OA of the algorithm before kernelization/contextualization. For example, in the case of contextualization of KOMP using the joint sparsity model, the relative gain is computed by OAKSOMP − OAKOMP ∗ 100%, OAKOMP where OAKSOMP and OAKOMP are the overall accuracy for the KSOMP and KOMP algorithms, respectively. The relative gain obtained by kernelization of the SP, SSP, OMP, and SOMP algorithms is shown in Figs. 8(a) and (b) for the Indian Pines and University of Pavia images, respectively. One can observe that in most cases, kernelization consistently leads to a performance gain of 5% to 20%. The only exception exists in the KSSP and KSOMP algorithms for the Indian Pines image with a higher percentage of training samples, which is partly due to the fact that SSP and SOMP before kernelization already achieve an OA of at least 95%. In this case, an improvement of 2% to 3% means the error rate is reduced by half which could be considered significant. g=
10
Ground Truth
SVM, OA = 79.15
SVMCK, OA = 87.18
KLR, OA = 83.56
KLRCK, OA = 84.77
OMP, OA = 73.30
KOMP, OA = 78.33
SOMP, OA = 79.00
KSOMP, OA = 85.67
KOMPCK, OA = 81.07
SP, OA = 74.86
KSP, OA = 79.18
SSP, OA = 78.39
KSSP, OA = 87.65
KSPCK, OA = 83.19
Fig. 6.
Classification maps and overall classification accuracy (OA) for the University of Pavia image using around 9% labeled samples as training set.
The relative gain obtained by incorporation of spatial information in OMP, KOMP, SVM, and KLR is shown in Figs. 9(a) and (b) for the Indian Pines image and the University of Pavia image, respectively. The contextualization of SP and KSP has a similar effect to that of OMP and KOMP, and the results are not reported here. Note that with the kernel sparse representation model, the contextual correlation can be incorporated through either a joint sparsity model (JSM) or a composite kernel (CK), and thus the relative gain of KSOMP (through JSM) and KOMPCK (through CK) over
KOMP are both shown in Fig. 9. One can observe that for the India Pines image, the linear method OMP is the most sensitive to the spatial information, in which the relative gain is generally more than 20%. The other classifiers all work in the feature space, and the gain ranges from 10% to 15% in most cases, with a slight decrease as the number of training samples increases. For the University of Pavia image, the relative gain in classification accuracy is usually around 10% to 14%. Contrary to the case of the Indian Pines image, the improvement of the linear approach OMP is slightly less than
11
15
100
Overall accuracy (%)
90 85
SP KSP SSP KSSP KSPCK OMP KOMP SOMP KSOMP KOMPCK SVM SVMCK KLR KLRCK
80 75 70 65 60 55 0
5
10 15 20 25 Percentage of training samples
Relative gain in overall accuracy (%)
95
10
5
KSP/SP KSSP/SSP KOMP/OMP KSOMP/SOMP 0 0
30
5
10 15 20 Percentage of training samples
85
20
Overall accuracy (%)
80 75 SP KSP SSP KSSP KSPCK OMP KOMP SOMP KSOMP KOMPCK SVM SVMCK KLR KLRCK
70 65 60 55 50 45 200
Relative gain in overall accuracy (%)
22
50 100 150 Number of training samples per class
30
(a)
(a) 90
40 0
25
KSP/SP KSSP/SSP KOMP/OMP KSOMP/SOMP
18 16 14 12 10 8 6 0
50
100 150 Percentage of training samples
(b)
(b) Fig. 7. Effect of dictionary size for (a) the Indian Pines image and (b) the University of Pavia image.
the kernel methods. Moreover, the performance of KLR is not as consistent as the other methods. The third image in our experiments, Center of Pavia, is the other urban image collected by the ROSIS sensor over the center of the Pavia city. This image consists of 1096 × 492 pixels, each having 102 spectral bands after 13 noisy bands are removed. The nine ground-truth classes and the number of training and test samples for each class are shown in Table V and illustrated in Fig. 10. For this image, about 5% of the labeled data are used as training samples. The classification results are summarized in Table VI, and the classification maps are shown in Fig. 11. KLRCK achieves a 100% accuracy on the first class (water), which occupies 66% of the test set, and thus yields the best OA. The KSOMP and KSSP work very well on the other classes, except that KSSP fails for the ninth class (Shadow). In general, one can observe from the experimental results on these three images that the incorporation of contextual information improves the classification performance (e.g., SP vs. SSP, KSP vs. KSSP, SVM vs. SVMCK, etc). Moreover, operating in the kernel feature space also significantly improves the accuracy (e.g., SP vs. KSP, SSP vs. KSSP, etc).
200
Fig. 8. Relative performance gain by kernelization for sparsity-based classifiers on (a) the Indian Pines image and (b) the University of Pavia image with different dictionary size. TABLE V T HE 9 GROUND - TRUTH CLASSES IN THE C ENTER OF PAVIA IMAGE AND THE TRAINING AND TEST SETS .
No 1 2 3 4 5 6 7 8 9
Class Name Water Trees Meadow Brick Soil Asphalt Bitumen Tile Shadow Total
Samples Train Test 745 64533 785 5722 797 2094 485 1667 820 5729 678 6847 808 6479 223 2899 195 1970 5536 97940
V. C ONCLUSIONS In this paper, we propose a new HSI classification technique based on sparse representations in a nonlinear feature space induced by a kernel function. The spatial correlation between neighboring pixels is incorporated through a joint sparsity model. Experimental results on AVIRIS and ROSIS hyperspectral images show that the kernelization of the sparsity-based algorithms improve the classification performance compared to
12
Ground Truth
SVM, OA = 94.63
SVMCK, OA = 96.81
KLR, OA = 97.99
KLRCK, OA = 98.92
OMP, OA = 96.68
KOMP, OA = 97.19
SOMP, OA = 97.66
KSOMP, OA = 98.53
KOMPCK, OA = 98.46
SP, OA = 96.40
KSP, OA = 97.08
SSP, OA = 96.93
KSSP, OA = 97.82
KSPCK, OA = 97.55
Fig. 11. Classification maps and overall classification accuracy (OA) for the Center of Pavia image using 5536 training samples (around 5% of all labeled samples) as shown in Fig. 11 and Table V.
13
TABLE VI C LASSIFICATION ACCURACY (%) FOR THE C ENTER OF PAVIA IMAGE USING 5536 TRAINING SAMPLES ( AROUND 5% OF ALL LABELED SAMPLES AS SHOWN IN F IG . 10 AND TABLE V). Class 1 2 3 4 5 6 7 8 9 OA AA κ
SVM 99.19 77.74 86.74 40.38 97.52 94.77 74.37 98.94 100 94.63 85.52 0.899
SVMCK 97.46 93.08 97.09 77.02 98.39 94.32 97.50 99.83 99.95 96.81 94.96 0.943
KLR 99.63 93.18 96.18 81.76 96.25 93.91 95.22 99.52 99.90 97.99 95.06 0.963
KLRCK 100 95.39 95.89 89.80 98.59 96.67 97.31 98.41 99.49 98.92 96.84 0.980
OMP 98.91 86.75 96.04 81.22 94.40 91.94 93.18 98.62 98.07 96.68 93.24 0.940
KOMP 98.13 92.76 97.04 88.84 94.89 96.13 95.40 99.34 99.39 97.19 95.77 0.949
SOMP 99.32 92.38 95.46 85.66 96.37 92.83 94.68 99.69 98.68 97.66 95.01 0.958
KSOMP 99.07 95.30 97.09 89.68 97.56 98.31 98.80 99.93 100 98.53 97.30 0.973
KOMPCK 98.98 96.31 96.08 97.78 97.82 96.54 98.63 100 96.65 98.46 97.64 0.972
SP 98.20 86.98 96.61 84.16 94.01 92.92 93.80 98.79 99.34 96.40 93.87 0.935
KSP 98.09 91.17 97.28 86.86 95.76 95.82 95.57 99.24 99.39 97.08 95.47 0.947
SSP 97.79 92.82 97.80 78.52 95.81 96.52 95.96 99.79 98.83 96.93 94.87 0.945
KSSP 99.26 91.23 97.71 95.26 97.45 97.41 97.82 99.90 71.42 97.82 94.16 0.960
KSPCK 98.79 91.70 99.57 94.54 94.99 93.92 96.90 99.55 93.60 97.55 95.95 0.956
25
Relative gain in overall accuracy (%)
Water Trees 20
Meadow Brick
15
Soil Asphalt
10
5 0
Bitumen
OMP w/ JSM KOMP w/ JSM KOMP w/ CK SVM w/ CK KLR w/ CK 5
10 15 20 Percentage of training samples
25
Tile Shadow 30
(a)
(a) Fig. 10.
(b)
(a) Training and (b) test sets for the Center of Pavia image.
24 OMP w/ JSM KOMP w/ JSM KOMP w/ CK SVM w/ CK KLR w/ CK
Relative gain in overall accuracy (%)
22 20 18 16 14 12 10 8 6 4 0
50
100 150 Percentage of training samples
200
(b) Fig. 9. Relative performance gain by contextualization for various classifiers on (a) the Indian Pines image and (b) the University of Pavia image with different dictionary size.
the linear version. It is also shown that the proposed algorithm has a better or comparable performance to the recent spectralspatial single-classifiers such as SVMCK. The proposed sparsity-based classifier is different from the conventional sparse classifier SVM in many aspects. SVM is a discriminative model, which finds the separating hyperplane between two classes. A model with a fixed set of sparse
support vectors is obtained by a training process over the whole training set and then this SVM is used to classify all of the test data. However, our method can be considered as a generative model. The subspaces representing different classes implicitly compete with each other during the sparse recovery process, leading to a discriminative representation vector. This sparse representation vector is extracted for each test pixel and is thus adaptive. This will inevitably lead to an increase in the computational cost, but the kernel matrix K A can be computed offline. Therefore, the most intensive part in the sparse recovery is the inversion of a matrix of at most size K0 × K0 for the OMP-based algorithms and (2K0 ) × (2K0 ) for the SP-based algorithms. Moreover, in the OMP-based algorithms, since the support set is sequentially augmented by one index at a time, the inversion can be accelerated by Cholesky decomposition [45]. Our proposed dictionary-based classifier provides several advantages. Firstly, new training samples can be easily added to the dictionary without re-training the model, unlike the other classifiers (e.g., SVM and KLR) that need to re-train the model for the new training data. Also, our algorithm is especially useful for creating a dictionary invariant to the environmental variations by adding synthetically generated spectral signatures that account for various illuminations and atmospheric conditions [46]. Moreover, the joint sparsity model in kernel space is still applicable when the training data is synthetically
14
generated or from a spectra library rather than taken from the scene. On the other hand, classifiers using composite-kernels require knowledge of the spatial features of each training data which may not be available, and thus these classifiers may not be applicable in the case of a synthetic or library training set. The classification accuracy can be further improved by a post-processing step, or combining the proposed technique with other state-of-the-art classifiers to generate a mega-classifier [17]. Another possible direction is the design/learning of a better dictionary such that the dictionary provides more accurate reconstruction, more discriminative power, and/or better adaptivity to the test data. VI. ACKNOWLEDGEMENT The authors would like to thank the University of Pavia and the HySenS project for kindly providing the ROSIS images of University of Pavia and Center of Pavia, and Prof. J. M. Bioucas-Dias for providing the sparse multinomial logistic regression code. Finally, we would like to thank all of the anonymous reviewers whose constructive criticisms have improved the paper significantly. R EFERENCES [1] B. E. Boser, I. M. Guyon, and V. N. Vapnik, “A training algorithm for optimal margin classifiers,” in Proc. Fifth Annual Workshop on Computational Learning Theory, Pittsburgh, PA, USA, 1992, pp. 144– 152, ACM. [2] V. N. Vapnik, The nature of statistical learning theory, Springer, 1995. [3] J. A. Gualtieri and R. F. Cromp, “Support vector machines for hyperspectral remote sensing classification,” in Proc. SPIE, Orlando, FL, Jan. 1998, vol. 3584, pp. 221–232. [4] F. Melgani and L. Bruzzone, “Classification of hyperspectral remote sensing images with support vector machines,” IEEE Trans. on Geoscience and Remote Sensing, vol. 42, no. 8, pp. 1778–1790, Aug. 2004. [5] G. Camps-Valls and L. Bruzzone, “Kernel-based methods for hyperspectral image classification,” IEEE Trans. on Geoscience and Remote Sensing, vol. 43, no. 6, pp. 1351–1362, June 2005. [6] L. Bruzzone, M. Chi, and M. Marconcini, “A novel transductive SVM for the semisupervised classification of remote sensing images,” IEEE Trans. on Geoscience and Remote Sensing, vol. 44, no. 11, pp. 3363– 3373, Nov. 2006. [7] G. Camps-Valls, L. Gomez-Chova, J. Mu˜noz-Mar´ı, J. Vila-Franc´es, and J. Calpe-Maravilla, “Composite kernels for hyperspectral image classification,” IEEE Geoscience and Remote Sensing Letters, vol. 3, no. 1, pp. 93–97, Jan. 2006. [8] D. B¨ohning, “Multinomial logistic regression algorithm,” Ann. Inst. Stat. Math., vol. 44, no. 1, pp. 197–200, Mar. 1992. [9] B. Krishnapuram, L. Carin, M. Figueiredo, and A. Hartemink, “Sparse multinomial logistic regression: Fast algorithms and generalization bounds,” IEEE Trans. on Pattern Analysis and Machine Intelligence, vol. 27, no. 6, pp. 957–968, June 2005. [10] J. Li, J. M. Bioucas-Dias, and A. Plaza, “Semisupervised hyperspectral image segmentation using multinomial logistic regression with active learning,” IEEE Trans. on Geoscience and Remote Sensing, vol. 48, no. 11, pp. 4085–4098, Nov. 2010. [11] J. Li, J. M. Bioucas-Dias, and A. Plaza, “Spectral-spatial hyperspectral image segmentation using subspace multinomial logistic regression and Markov random field,” IEEE Trans. on Geoscience and Remote Sensing, 2011, to appear. [12] H.-Y. Huang and B.-C. Kuo, “Double nearest proportion feature extraction for hyperspectral-image classification,” IEEE Trans. on Geoscience and Remote Sensing, vol. 48, no. 11, pp. 4034–4046, Nov. 2010. [13] H. R. Kalluri, S. Prasad, and L. M. Bruce, “Decision-level fusion of spectral reflectance and derivative information for robust hyperspectral land cover classification,” IEEE Trans. on Geoscience and Remote Sensing, vol. 48, no. 11, pp. 4047–4058, Nov. 2010.
[14] B. Demir and S. Ert¨urk, “Empirical mode decomposition of hyperspectral images for support vector machine classification,” IEEE Trans. on Geoscience and Remote Sensing, vol. 48, no. 11, pp. 4071–4084, Nov. 2010. [15] L. Ma, M. M. Crawford, and J. Tian, “Local manifold learning-based k-nearest-neighbor for hyperspectral image classification,” IEEE Trans. on Geoscience and Remote Sensing, vol. 48, no. 11, pp. 4099–4109, Nov. 2010. [16] W. Kim and M. M. Crawford, “Adaptive classification for hyperspectral image data using manifold regularization kernel machines,” IEEE Trans. on Geoscience and Remote Sensing, vol. 48, no. 11, pp. 4110–4121, Nov. 2010. [17] Y. Tarabalka, J. A. Benediktsson, J. Chanussot, and J. C. Tilton, “Multiple spectral-spatial classification approach for hyperspectral data,” IEEE Trans. on Geoscience and Remote Sensing, vol. 48, no. 11, pp. 4122–4132, Nov. 2010. [18] A. M. Bruckstein, D. L. Donoho, and M. Elad, “From sparse solutions of systems of equations to sparse modeling of signals and images,” SIAM Review, vol. 51, no. 1, pp. 34–81, 2009. [19] M. Elad, Sparse and Redundant Representations: From Theory to Applications in Signal and Image Processing, Springer, 2010. [20] J. Wright, Y. Ma, J. Mairal, G. Sapiro, T. Huang, and S. Yan, “Sparse representation for computer vision and pattern recognition,” Proceedings of the IEEE, vol. 98, no. 6, pp. 1031–1044, June 2010. [21] E. Elhamifar and R. Vidal, “Sparse subspace clustering,” in Proc. of IEEE Conference on Computer Vision and Pattern Recognition, June 2009, pp. 2790–2797. [22] J. Yang, J. Wright, T. Huang, and Y. Ma, “Image super-resolution as sparse representation of raw image patches,” in Proc. of IEEE Conference on Computer Vision and Pattern Recognition, Anchorage, AK, June 2008, pp. 1–8. [23] M. Elad and M. Aharon, “Image denoising via sparse and redundant representations over learned dictionaries,” IEEE Trans. on Image Processing, vol. 15, no. 12, pp. 3736–3745, Dec. 2006. [24] J. Mairal, M. Elad, and G. Sapiro, “Sparse representation for color image restoration,” IEEE Trans. on Pattern Analysis and Machine Intelligence, vol. 17, no. 1, pp. 53–69, Jan. 2008. [25] J. Wright, A. Y. Yang, A. Ganesh, S. Sastry, and Y. Ma, “Robust face recognition via sparse representation,” IEEE Trans. on Pattern Analysis and Machine Intelligence, vol. 31, no. 2, pp. 210–227, Feb. 2009. [26] Y. Chen, N. M. Nasrabadi, and T. D. Tran, “Sparse representation for target detection in hyperspectral imagery,” IEEE Journal of Selected Topics in Signal Processing, vol. 5, no. 3, pp. 629–640, June 2011. [27] Y. Chen, N. M. Nasrabadi, and T. D. Tran, “Simultaneous joint sparsity model for target detection in hyperspectral imagery,” IEEE Geoscience and Remote Sensing Letters, vol. 8, no. 4, pp. 676–680, July 2011. [28] Y. Chen, N. M. Nasrabadi, and T. D. Tran, “Hyperspectral image classification using dictionary-based sparse representation,” IEEE Trans. on Geoscience and Remote Sensing, , no. 10, pp. 3973–3985, Oct. 2011. [29] F. Bovolo, L. Bruzzone, and M. Marconcini, “A novel contextsensitive SVM for classification of remote sensing images,” in Proc. of IEEE International Geoscience and Remote Sensing Symposium, Denver, Colorado, July 2006, pp. 2498–2501. [30] Y. Tarabalka, J. A. Benediktsson, and J. Chanussot, “Spectral-spatial classification of hyperspectral imagery based on partitional clustering techniques,” IEEE Trans. on Geoscience and Remote Sensing, vol. 47, no. 8, pp. 2973–2987, Aug. 2009. [31] J. A. Tropp, A. C. Gilbert, and M. J. Strauss, “Algorithms for simultaneous sparse approximation. Part I: Greedy pursuit,” Signal Processing, special issue on Sparse approximations in signal and image processing, vol. 86, pp. 572–588, Mar. 2006. [32] H. Kwon and N. M. Nasrabadi, “A comparative analysis of kernel subspace target detectors for hyperspectral imagery,” EURASIP Journal on Applied Signal Processing, vol. 2007, no. 1, pp. 193–193, Jan. 2007. [33] P. Vincent and Y. Bengio, “Kernel matching pursuit,” Machine Learning, vol. 48, pp. 165–187, 2002. [34] V. Guigue, A. Rakotomamonjy, and S. Canu, “Kernel basis pursuit,” New Methods in Machine Learning, vol. 20, no. 6, pp. 757–774, 2006. [35] S. Gao, I. W. Tsang, and L.-T. Chia, “Kernel sparse representation for image classification and face recognition,” in Proc. of the 11th European Conference on Computer Vision, Crete, Greece, Sept. 2010, vol. 6314. [36] X.-T. Yuan and S. Yan, “Visual classification with multi-task joint sparse representation,” in Proc. of IEEE Conference on Computer Vision and Pattern Recognition, San Francisco, CA, June 2010. [37] B. Sch¨olkopf and A. J. Smola, Learning with Kernels: Support Vector Machines, Regularization, Optimization, and Beyond, The MIT Press, 2001.
15
[38] V. Roth, “The generalized LASSO,” IEEE Trans. on Neural Networks, vol. 15, no. 1, pp. 16–28, Jan. 2004. [39] J. Tropp and A. Gilbert, “Signal recovery from random measurements via orthogonal matching pursuit,” IEEE Trans. on Information Theory, vol. 53, no. 12, pp. 4655–4666, Dec. 2007. [40] W. Dai and O. Milenkovic, “Subspace pursuit for compressive sensing signal reconstruction,” IEEE Trans. on Information Theory, vol. 55, no. 5, pp. 2230–2249, May 2009. [41] R. Duda, P. Hart, and D. Stork, Pattern Classification, John Wiley and Sons, second edition, 2001. [42] A. Plaza, J. A. Benediktsson, J. W. Boardman, J. Brazile, L. Bruzzone, G. Camps-Valls, J. Chanussot, M. Fauvel, P. Gamba, A. Gualtieri, M. Marconcini, J. C. Tilton, and G. Trianni, “Recent advances in techniques for hyperspectral image processing,” Remote Sensing of Environment, vol. 113, Supplement 1, pp. S110–S122, Sept. 2009. [43] “AVIRIS NW Indiana’s Indian Pines 1992 data set,” https://engineering. purdue.edu/∼ biehl/MultiSpec/hyperspectral.html. [44] J. A. Richards and X. Jia, Remote Sensing Digital Image Analysis: An Introduction, Springer, fourth edition, 2006. [45] D. Donoho, I. Drori, V. Stodden, and Y. Tsaig, “SparseLab,” http:// sparselab.stanford.edu/. [46] G. Healey and D. Slater, “Models and methods for automated material identification in hyperspectral imagery acquired under unknown illumination and atmospheric conditions,” IEEE Trans. on Geoscience and Remote Sensing, vol. 37, no. 6, pp. 2706–2717, June 1999.