Hyphenated GC-FTIR and GC-MS techniques applied in the analysis of bioactive compounds
STELUTA GOSAV, NICOLETA PADURARU, MIRELA PRAISLER “
Dunarea de Jos” University, Department of Chemistry, Physics and Environment, Domneasca St. 47, 800008 Galati, Romania,
[email protected] ABSTRACT
The drugs of abuse, which affect human nature and cause numerous crimes, have become a serious problem throughout the world. There are hundreds of amphetamine analogues on the black market. They consist of various alterations of the basic amphetamine molecular structure, which are yet not yet included in the lists of forbidden compounds although they retain or slightly modify the hallucinogenic effects of their parent compound. It is their important variety that makes their identification quite a challenge. A number of analytical procedures for the identification of amphetamines and their analogues have recently been reported. We are presenting the profile of the main hallucinogenic amphetamines obtained with the hyphenated techniques that are recommended for the identification of illicit amphetamines, i. e. gas chromatography combined with mass spectrometry (GC-MS) and gas chromatography coupled with Fourier transform infrared spectrometry (GC-FTIR). The infrared spectra of the analyzed hallucinogenic amphetamines present some absorption bands (1490 cm-1, 1440 cm-1, 1245 cm-1, 1050 cm-1 and 940 cm-1) that are very stable as position and shape, while their intensity depends of the side-chain substitution. The specific ionic fragment of the studied hallucinogenic compounds is the 3,4-methylenedioxybenzyl cation (m/e = 135) which has a small relative abundance (lesser than 20%). The complementarity of the above mentioned techniques for the identification of hallucinogenic compounds is discussed. Keywords: drugs of abuse, GC-MS, GC-FTIR, hallucinogenic amphetamines
1. INTRODUCTION Phenylethylamines have varying degrees of hallucinogenic and central nervous system (CNS) stimulant effects. Hallucinogens (psychedelics) are psychoactive substances that alter sensory processing in the brain, causing perceptual disturbances, changes in thought processing, and depersonalization[1,2]. The hallucinogenic compounds presented in this study are synthetic amphetamine derivatives or “designer drugs”, their parent compound being 3,4-methylenedioxyamphetamine (MDA) (see Figure 1, Table 1). This compound was communicated in literature for the first time in 1910. In the eight decade of the last century, 3,4-methylenedioxymethamphetamine (MDMA, Ecstasy) was one of the most popular hallucinogens on the illicit drug market. Effects of this drug include substantial perceptual changes such as blurred vision, multiple images, vibration of objects, visual hallucinations, distorted shapes and slowed passage of time. Also, MDMA produces pupil dilation and a rise in systolic blood pressure[1,2]. In forensic laboratories, the illicit drugs are analyzed using a gas chromatograph coupled with a mass spectrometer (GC-MS). A characteristic of GC-MS spectra is that they contain a basic ion relative abundance of 100% in the spectrum, which corresponds to a fragment ion with a mass less than the molecular mass of the compound. Molecular ion spectral line’s corresponding to the molecular weight of Second International Conference on Applications of Optics and Photonics, edited by Manuel Filipe P. C. Martins Costa, Rogério Nunes Nogueira, Proc. of SPIE Vol. 9286, 92862D · © 2014 SPIE · CCC code: 0277-786X/14/$18 · doi: 10.1117/12.2063898 Proc. of SPIE Vol. 9286 92862D-1 Downloaded From: http://proceedings.spiedigitallibrary.org/ on 11/14/2014 Terms of Use: http://spiedl.org/terms
the analyte is of primordial importance in determining the structure of the compound to be analyzed, but has very low abundance in the spectrum or may be absent due to advanced fragmentation of the molecule. In the case of small molecular structures such as amphetamines, the mass spectra are very poor in lines (fragments)[3,4]. Consequently, a compound is considered positively identified if its molecular structure is also confirmed by using gas chromatography coupled with transform Fourier infrared spectrometry (GC-FTIR). This technique is successfully used for the identification of organic compounds due to the uniqueness of infrared spectra, which allows us to distinguish even very similar organic molecules. GC-FTIR is capable of obtaining infrared spectra from the peaks as they elute from the capillary columns, thus combining the separation power of gas chromatography with the identification power of infrared spectrometry[3]. R3
ni R1
R2
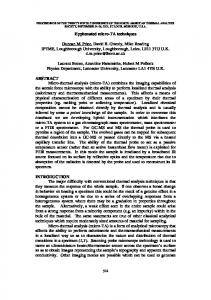
Figure 1. Molecular structure of 3,4-methylenedioxyamphetamine analogues Table 1. Name, code and substituent chemical groups R1, R2 and R3 of the main hallucinogenic amphetamines. Name of the compound Code R1 R2 R3 3,4-methylenedioxyamphetamine C1 H H -CH3 3,4-methylenedioxymethamphetamine C2 -CH3 H -CH3 3,4-methylenedioxy-N-ethylamphetamine C3 -CH2-CH3 H -CH3 1-(3,4-methylenedioxyphenyl)-2-butanamine C4 H H -CH2-CH3 N,N-dimethyl-3,4-methylenedioxyamphetamine C5 -CH3 -CH3 -CH3 In this paper we have analyzed from a spectroscopic point of view five hallucinogenic amphetamines, which are the most popular among drug abusers. The first is the “parent” compound, i.e. 3,4-methylenedioxyamphetamine (MDA), the following compounds being its main derivates: 3,4methylenedioxymethamphetamine (MDMA), which is commonly known with the street name of „Ecstasy”; 3,4-methylenedioxy-N-ethylamphetamine, 1-(3,4-methylenedioxyphenyl)-2-butanamine and N,N-dimethyl3,4-methylenedioxyamphetamine. Our goal was to find the spectroscopic common features of this group of compounds, which can then be used for the identification of their analogs and homologues based on their GC-MS and GC-FTIR spectra. Their comparative interpretation will indicate the most important fragment ions showing in their GC-MS spectra and the most stable absorption peaks present in their GCFTIR spectra. The assignment of the vibrational modes associated with the absorption peaks is carried out by using the Density Functional Theory (DFT) in combination with the potential energy distributions (PEDs). Finally, by corroborating the information provided by the mass and IR spectra, we have obtained important spectroscopic features regarding the derivates of 3,4-methylenedioxyamphetamine.
2. EXPERIMENTAL The experimental conditions in which the GC–FTIR spectra were recorded have been presented in a previous paper[5]. The obtained reference spectra were stored in a digital library after normalization. The scan range was from 4000 to 580 cm-1. All spectra were reduced in size by eliminating the spectral windows where the compounds in the database have no IR absorptions. Hence, data ranged from 3745 to 2555 cm-1 and from 1995 to 605 cm-1. In order to identify the corresponding vibration modes of the majority of peaks, besides literature research, we have computed the vibrational frequencies with the Gaussian 09 software package[6], by
Proc. of SPIE Vol. 9286 92862D-2 Downloaded From: http://proceedings.spiedigitallibrary.org/ on 11/14/2014 Terms of Use: http://spiedl.org/terms
using DFT theory. The computation was achieved only for the parent compound because the IR spectra of studied hallucinogens are very similarly. Quantum mechanical calculations of energies, geometries and vibrational wavenumbers in the ground state were carried out by using the hybrid functional B3LYP (Becke three parameter hybrid functional combined with Lee–Yang–Parr correlation functional) in correlation with the 6-311G(d,p) basis set. The computed IR spectrum has any imaginary frequency, implying that the optimized geometry is located at the minimum on the potential energy surface. The force constants matrices were transformed from Cartesian coordinates to the internal coordinates and potential energy distributions were calculated. The theoretical vibrational spectrum of the C1 compound was interpreted based on PEDs, by using the VEDA 4 program[7]. The nature of the vibration normal modes was determined by using the GaussView 3.09. program[8]. Prior to comparing the calculated vibrational frequencies with the experimental counterparts, the former have been scaled by appropriate scaling factors, namely 0.9668[9]. The mass spectra (electron impact ionization) of the compounds studied in this paper were imported from general MS libraries (NIST mass spectral database, AAFS spectral library and an in-housemade MS library). The MS spectra range from m/e 12 to 260.
3. RESULTS AND DISCUSSIONS 3.1.
Spectroscopic analysis of GC-MS spectra
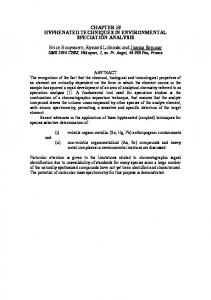
Generally, the most important scission in the case of amphetamines is breaking the C-C link neighboring with the nitrogen atom, where the rule of the preferential scission with the formation of the largest and most stable fragment is valid. Fragmentations of a molecule in mass spectrometry are governed by the formation of ions and radicals as stable as possible, and also by neutral stable particle removal. Analyzing the GC-MS spectra[10] of the studied compounds, we have found the most important fragment ions, which are presented in Figure 2.
Relative abundance (° 100
PI =207
0
-
90 -
m/e=44
1-C
SO -
!
CH3
HC'
0
CH.
m/e=163
H3C
CH3
-
60 >0 CH;
40 -
m/e=133
H
CH.,
{
CH 1' CH3
13 f 1
1
I
II
*O.
"11
ti163 1
,
,
,,
N J 00 V ,ar N J001'» N J 00 Vr ,ar N O 00 V N JOO .0 ,qrCV O OC ^ ,ar CV (NI NCol 41 V' [0000CA
V
001J J-N
206
r
(NI N Co: 'Tr V1
.
N N N N N N N N
Figure 2. GC-MS spectrum and fragment ions of N,N-dimethyl-3,4-methylenedioxyamphetamine (C5)
Proc. of SPIE Vol. 9286 92862D-3 Downloaded From: http://proceedings.spiedigitallibrary.org/ on 11/14/2014 Terms of Use: http://spiedl.org/terms
_
For all studied hallucinogens, the preferential β cleavage generates a stable fragment i.e. 3,4methylenedioxybenzyl cation (see Scheme 1), and a conjugated alkylamine fragment (R+) which is the base ion. _ α CH2
O
R
β
O
CH2
O
-e -R
O
3,4-methylenedioxybenzyl cation m/e=135 Scheme 1 Schemes 2 and 3 show the molecular structure of the base ion for each compound, namely ethylamino cation (m/e = 44) for C1, N-methylethylamino cation (m/e = 58) for C2, diethylamino cation (m/e = 72) for C3, propylamino cation (m/e = 58) for C4 and N-dimethylethylamino cation (m/e = 72) for C5.
C1 C2
R
C3
H2N
CH
H2N
CH
CH3
ethylamino cation (m/e=44)
CH3
CH3
HN
CH
CH3
CH3
HN
CH
CH3
CH3
CH2
HN
CH3
CH2
HN
N-methylethylamino cation (m/e=58)
CH CH
CH3
diethylamino cation (m/e=72)
CH3
Scheme 2
C4 R
CH3
CH2
NH2 propylamino cation (m/e=58)
CH3 C5
HC
H3 C
CH2
N
CH3
HC
NH2 H3C
N
CH3 N-dimethylethylamino (m/e=72)
HC
HC CH3
CH3
Scheme 3 Also, two cations are also present in the mass spectra of the studied hallucinogens, i.e. phenyl and cyclobutadienyl cations, which are generated by α cleavage of aromatic hydrocarbons with an aliphatic side chain. In this way, a phenyl cation (m/e= 77) is generated, which can still transform into neutral acetylene and cyclobutadienyl cation (m/e= 51):
Proc. of SPIE Vol. 9286 92862D-4 Downloaded From: http://proceedings.spiedigitallibrary.org/ on 11/14/2014 Terms of Use: http://spiedl.org/terms
_
_ R
α
- HC
-e -R
phenyl cation m/e=77
CH
cyclobutadienyl cation m/e=51
Scheme 4 It is worth to mention that the studied compounds have seven common fragment ions, of which the most important are: 3,4-methylenedioxybenzyl, phenyl and cyclobutadienyl cations. The relative abundance of these cations is very small, i.e. less than 15 % (see Table 2). The importance of these fragments doesn’t come from their important abundance (that is very small), but from the fact that the fragment ions are present in all GC-MS spectra of studied hallucinogens (see Table 2). A very important piece of information that can be extracted from the mass spectra is the molecular mass of the compound. For this purpose it is necessary to identify the molecular ion in GC-MS spectra in the case that this spectral line is present. In our case, the molecular ions show in the mass spectra of the C1, C2, C3 and C4 compounds with a very small relative abundance (see Table 2), while C5 has no spectral line (see Figure 2). Table 2. Relative abundance of the most important fragment ions, base ions and molecular ions for the studied hallucinogens.
Code of the compound
Cl
C3
C2
C4
C5
Relative abundance (%) Fragment ions (m /e) 135
12.11
3.4
4.0
7.71
1.8
77
9.71
3.6
9.81
4.5 3.3 25.22
8.1
51
2.9 2.8
7.0 0.5
44
100
3.9 0.3
58
0
100
0
100
0
72
0
0
100
0
100
179
2.0
0
0
0
0
Molecular
193
-
0.3
0
1.5
0
ion
207
-
-
0.1
-
Not present
Base ion
8.1
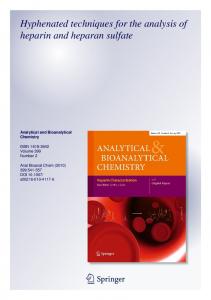
3.2. Spectroscopic analysis of GC-FTIR spectra A first observation in the analysis of the GC-FTIR spectra of the studied hallucinogens is related to their high similarity (see Figure 3). The spectral region comprised between 850 cm-1 and 1550 cm-1 contains very stable absorptions: the bands showing at 940 cm-1, 1050 cm-1, 1190 cm-1, 1245 cm-1, 1440 cm-1 and 1490 cm-1 have the same position and shape. Only the corresponding intensities are slightly different, as they depend on the side-chain substitution. The main differences show in the 2830 – 3100 cm-1 spectral domain, where the spectral bands have various shapes and intensities, while their positions are slightly shifted with a maximum of ± 10 cm-1.
Proc. of SPIE Vol. 9286 92862D-5 Downloaded From: http://proceedings.spiedigitallibrary.org/ on 11/14/2014 Terms of Use: http://spiedl.org/terms
Table 3 presents a selection of the experimental IR wavenumbers specific to the absorption bands of the studied compounds, and the IR wavenumbers computed for the parent compound (C1). The theoretical IR spectrum of C1 compound was interpreted by using PEDs. The spectral domain from 2800 cm-1 to 3100 cm-1 has only pure normal vibrational modes, while the majority of the normal modes present in the fingerprint region are mixed. Table 3 shows that a good agreement of computed vibrational modes with the experimental ones has been obtained at DFT/(B3LYP)/6-311G(d,p) level of theory.
3700
3600
3500
3400
3300
3200
3100
3000
2900
2800
2700
2600
2500
2400
2300
2200
2100
1900
2000
1800
1700
1600
1500
1400
1300
1200
1100
900
1000
800
700
600
O 1-
O
N
O
w
O
s+
A
O
a.....
T O
Absorbance (%)
1.0 O
E
V O CO O
co °0111=1.11....... O
O O O
O
Figure 3. GC-FTIR spectra of the main hallucinogenic amphetamines. The optimized molecular structure of 3,4-methylenedioxyamphetamine (C1) at B3LYP/6-311G(d,p) level. In order to analyze thoroughly the GC-FTIR spectra of the studied compounds (see Table 3), we have divided the infrared domain in three regions. The first spectral region, which is composed of the spectral “sub-regions” 3000 – 3100 cm-1, 1400 – 1600 cm-1, 680 – 1000 cm-1, contains the characteristic absorptions of the aromatic ring. The second spectral region, i.e. 2830 – 3000 cm-1, confirms the presence of aliphatic side chain. The third spectral domain, 1300 – 900 cm-1, shows the presence of the C – O groups in the para and orto’ positions of the phenyl ring[11-15]. The first spectral domain mentioned above contains the absorption bands attributed to the C-H stretching (3000 – 3100 cm-1) and C-H deformation (680 – 1000 cm-1) vibrations, as well as to the stretching C-C vibrations (1400 – 1600 cm-1) of the non-substituted phenyl ring[11-15]. Slight variations of the IR intensities of the absorptions associated to the phenyl ring are recorded, C1 and C4 having the highest absorbances. This may be due to the fact that the side chain of C1 and C4 is shorter than in the case of the other hallucinogens and it contains an electron-withdrawing and less voluminous amino group, i.e. –NH2. The absorptions attributed to the aromatic C-H stretching vibration consist of a single peak, which appears at 3020 cm-1 for C2, C3 and C4, while for C5 this band is superposed with the neighboring absorption bands which are much stronger. In the case of C1, the same vibration is observed at 3015 cm-
Proc. of SPIE Vol. 9286 92862D-6 Downloaded From: http://proceedings.spiedigitallibrary.org/ on 11/14/2014 Terms of Use: http://spiedl.org/terms
1
in the experimental IR spectrum and at 3079 cm-1 in the theoretical one. As revealed by PED, (CH)ar is a pure vibration mode, the PED assignment being 99% (Table 3). This absorption band is very weak, the highest absorbance (roughly 15%), being recorded for C1. In the case of substituted derivatives of benzene, the deformation aromatic C-H vibrations yield strong peaks in the 680-1000 cm-1 spectral region. In this case, the vibration frequency depends on the number and position of the substitutes of the aromatic ring, although it is independent of the substituent’s nature. In addition, in the case of polysubstituted aromatic compounds, the peak intensity may decrease considerably[11]. Thus, in the case of the hallucinogens that contain a tri-substituted aromatic ring, the intensity of the absorption bands associated with the γ(CH)ar vibration is smaller than that attributed to the same vibration in the case of phenyl rings such as those present in the molecular skeleton of stimulant amphetamines, which have a monosubstituted aromatic ring[16]. The absorption peaks corresponding to the out-of-plane C-H vibrations show at 800 cm-1 for the C1 and C4 hallucinogens, and at 805 cm-1 for C2, C3 and C5, their intensity being below 20%. In the case of C1 and C4, this band presents a shoulder around 765 cm-1, which represents the out-of-plane deformation of the –NH2 group. Table 3. Experimental IR wavenumbers of the main hallucinogenic amphetamines, theoretical IR wavenumbers at B3LYP/6-311G(d,p) level and the PED assignments for 3,4methylenedioxyamphetamine (C1). ..(cc)., Code
r(CH)9,
v(CC)9. -.(cc).,
1.(CH)9
compound
Cl IRtheor
1.,(000) 1.9,(OCO) v(cH).,
(Cm-l)
(cm-1)
(cm-1)
(cm-l)
(Cm-l)
(Cm'1)
(cV)
(cm1
(cm-1)
3079
3000 2973 2910 2888
1594
1473
1229
1027
923
812
[61]
[12] [40] 1490 (s)
1424 [18] [14] [16] 1440 (m)
[44]
[69]
[73]
[95]
[80]
[89]
[95]
PEO assign (°ó)
[99]
Cl
3015 (vw)
2970 2925 2875 (w) (m) (w)
-
IR exp
C2 IR exp
3020 (vw)
2970 2930 2875 (m) (m) (m)
-
C3 IR exp
3020 (vw)
2970 2930 2875 (m) (m) (m)
-
C4 IR exp
3020 (vw)
2970 2930 2880 (m) (m) (m)
-
C5 IR exp
p(CH)a, p(CHz)a
1.(C9,O)
ß(cH)9-
-
2970 2940 2875 2825 (m) (m) (w) (m)
1605 Om)
1245 (s)
1050 (m)
940 (w)
800 (w)
1050 (m)
940 (w)
805 (w)
1050 (m)
940
805 (w)
1615 (vw)
1490
1440 (m)
1245
(s)
1615 (vw)
1490 (s)
1440 (m)
1245
1605 (vw)
1490 (s)
1440 (m)
1245
1050 (m)
940
(s)
1615
1490 (s)
1440 (m)
1245 (s)
1050 (m)
940
(ww)
[25] [11 ]; (NHa)
(s)
(s)
(y,,')
!y;1
)
800 (w) 805 (w)
Abbreviations: – streching, β – in-plane deformation, γ – out-of-plane deformation; ar – aromatic, al – aliphatic, as – asymmetric; s – symmetric; vw – very weak, w – weak, m – medium, s – strong; PED less than 10% are not shown. For trisubstituted phenyl rings, the (CC)ar and β(CH)ar modes are seen in the 1640 – 1250 cm-1 region . In our case, the IR spectra have three peaks (see Figure 3), the first showing at 1605 cm-1 for C2, C3 and C5, and at 1615 cm-1 for C1 and C4. The second band is double degenerated, having two peaks at 1490 cm-1 and 1440 cm-1 for all the hallucinogens. According to the PED analysis, the first peak is associated with an almost pure (CC)ar normal mode, the PED assignment being of 61%. The peaks of the double degenerated band are attributed to mixed normal modes. The 1490 cm-1 vibrational mode is obtained by the combination of the (CC)ar and β(CH)ar vibrations and the 1440 cm-1 mode is generated by the combination of the (CC)ar, β(CH)ar and β(CH2)al vibrations (see Table 3). It is worth underlining [17]
Proc. of SPIE Vol. 9286 92862D-7 Downloaded From: http://proceedings.spiedigitallibrary.org/ on 11/14/2014 Terms of Use: http://spiedl.org/terms
that the 1490 cm-1 peak is the most stable and the strongest band of hallucinogenic amphetamines, having the same position, shape and intensity in the spectra of all hallucinogens. The second spectral domain contains medium and weak peaks, attributed to the symmetric and asymmetric stretching vibrations of the – CH3 and – CH2 groups present in the aliphatic side chain of the molecular structure of hallucinogens. These absorption bands appear in the 2830 – 3000 cm-1 spectral region[11-13]. the first peak shows at 2970 cm-1 for C1, C2, C3, C4 and C5; the second peak shows at 2925 cm-1 for C1, at 2930 cm-1 for C2, C3 and C4, and at 2940 cm-1 for C5; the third peak shows at 2875 cm-1 for C1, C2, C3 and C5, and at 2880 cm-1 for C4; the fourth peak is present only for C5, at 2825 cm-1. The third spectral domain (1300 – 900 cm-1) contains the absorption bands associated to the Car – O and O – C – O stretching vibrations. Although the absorption band attributed to the (CarO) vibration is strong, it is very difficult to detect, as some other strong bands appear in this spectral region[18-20]. In the IR spectra of all the hallucinogenic amphetamines, a very stable and intense peak appears at 1245 cm-1. This band is associated to the (CarO) vibration, the attribution of this vibration being also confirmed by DFT calculations. The theoretical wavenumber of this peak is 1229 cm-1, the generated vibration mode being mainly due to the (CarO) vibration, which has a 44% PED assignment. The asymmetric and symmetric O – C – O stretching vibrations are expected to appear in the 900 – 1050 cm-1 domain[21]. The IR spectra of all the studied hallucinogenic amphetamines have two peaks in this region, appearing at 1050 cm-1 and 940 cm-1. These absorption bands are attributed to the s(OCO) and as(OCO) vibrations, assigment that is confirmed by the PED analysis. The DFT calculations place these modes at 1027 and 923 cm-1, with a PED assignment of 69% and 73%, respectively.
4. CONCLUSIONS Both GC-MS and GC-FTIR techniques used in the present study provide important information regarding the spectroscopic features of studied hallucinogens. The most characteristic fragment ions indicated by the GC-MS sectra are the following: 3,4-methylenedioxybenzyl (m/e=135), phenyl (m/e=77) and cyclobutadienyl (m/e=51) cations. The base ion is produced by the preferential β cleavage for all hallucinogenic amphetamines, i.e. the alkylaminic fragment ion from the aliphatic side chain. The GCFTIR spectra indicate the rigorous stability of several absorption bands, i.e. 1490 cm-1, 1440 cm-1, 1245 cm-1, 1050 cm-1 and 940 cm-1. The vibrational spectrum of the parent compound in the ground state has been calculated by using the DFT method and has been compared with the experimental vibrational spectrum. The interpretation of the calculated spectrum in terms of potential energy distributions has allowed the assignment of the experimental bands based on the results of the PED analysis. Generally, a good agreement between the calculated modes and the experimental ones has been obtained for the DFT/(B3LYP)/6-311G(d,p) level of theory. References [1] Karch, S.B., [Drug Abuse Handbook], CRC Press, New York, (1998). [2] National Institute on Drug Abuse, [Pharmacology and Toxicology of Amphetamine and Related Designer Drugs], Washington, Research Monograph 94, (1989). [3] Smith, F. P., [Handbook of Forensic Drug Analysis], Elsevier Academic Press, London, (2005). [4] Vâjială, G. E., [Analiza substanţelor interzise în sport], Editura Renaissance, Bucureşti, (2006). [5] Gosav, S., Praisler, M., Dorohoi, D.O., Popa, G., “Automated identification of novel amphetamines using a pure neural network and neural networks coupled with principal component analysis,” J. Mol. Struct. 744–747, 821–825 (2005). [6] Gaussian 09 software package, Revision D.01, D. J. Gaussian, Inc., Wallingford CT, 2009. [7] Jamróz, M.H., “Vibrational Energy Distribution Analysis VEDA 4,” Warsaw, (2004). [8] GaussView 3.09 software package, Semichem, Inc., Shawnee Mission, KS, 2003.
Proc. of SPIE Vol. 9286 92862D-8 Downloaded From: http://proceedings.spiedigitallibrary.org/ on 11/14/2014 Terms of Use: http://spiedl.org/terms
[9] NIST Chemistry Webbook, IR database, http://srdata.nist.gov/cccbdb. [10] Gosav, S., Dinica, R., Praisler, M., “Choosing between GC-FTIR and GC-MS spectra for an efficient intelligent identification of illicit amphetamines,” J. of Mol. Struct. 887(1-3), 269-278 (2008). [11] Avram, M. and. Mateescu, GH.D, [Spectroscopia în infraroşu. Aplicaţii în chimia organică], Editura Tehnică, Bucureşti, (1966). [12] Dyer, J. R., [Applications of absorption spectroscopy of organic compounds], N.J., Prentice-Hall, Inc., Englewood Cliffs, (1965). [13] Pretsch, E., Clerc, T., Seibl, J., Simon, W., [Table of Spectral Data for Structure Determination of Organic Compounds], Springer-Verlag, Second Edition, Heidelberg, (1989). [14] Dorohoi, D.O., Gosav, S., Praisler, M., “Point Groups of Symmetry Applied in Molecular Spectroscopy,” American Institut of Physics Conference-Proceedings of The Sixth Internatinal Conference of the Balkan Physical Union 899, 361-362 (2007). [15] Dorohoi, D.O., Gosav, S., Praisler, M., “Theory of point group applied in molecular physics,” Rom. J. of Phys. 53, 49-55 (2008). [16] Gosav, S., Praisler, M., Birsa, M.L., “Principal component analysis aoupled with artificial neural networks — A combined technique classifying small molecular structures using a concatenated spectral database,” Int. J. Mol. Sci. 12, 6668-6684 (2011). [17] Roeges, N.P.G., [A Guide to the Complete Interpretation of the Infrared spectra of organic structures], Wiley, NewYork (1994). [18] Ahumada, G., Roisnel, T., Manzur, C., Carrillo, D., Hamon, J.R., “Reaction between ferrocenecarboxaldehyde and dioxaphospholene: Characterization and crystal structures of an unexpected bisferrocenyldioxolane,” J. of Organomet. Chem. 739, 40-44 (2013). [19] Panicker, C.Y., Varghese, H.T., Mary, Y.S., “FTIR, FT-Raman and DFT calculations of 5-nitro-1,3benzodioxole,” Orient. J. of Chem. 28(2), 1037-1041 (2012). [20] Arjunan, V., Saravanan, I., Ravindran, P., Mohan S., “FTIR, FT-Raman, ab initio and density functional studies on 4-methyl-1,3-dioxolan-2-one and 4,5-dichloro-1,3-dioxolan-2-one,” Spectrochim. Acta A Mol. Biomol. Spectrosc. 77(1), 28-35 (2010). [21] Silverstein, R.M., Bassler, G.C., Morril, T.C., [Spectrometric Identification of Organic Compounds], Edition 5, John Wiley and Sons Inc., Singapore, (1991).
Proc. of SPIE Vol. 9286 92862D-9 Downloaded From: http://proceedings.spiedigitallibrary.org/ on 11/14/2014 Terms of Use: http://spiedl.org/terms