C100. 22. Clerici, C., S. Couette, A. Loiseau, P. Herman, and C. Amiel. 1995. Evi- dence of Na-K-Cl cotransport in alveolar epithelial cells: effect of phorbol.
Hypoxia Downregulates Expression and Activity of Epithelial Sodium Channels in Rat Alveolar Epithelial Cells Carole Planès, Brigitte Escoubet, Marcel Blot-Chabaud, Gérard Friedlander, Nicolette Farman, and Christine Clerici Department of Physiology, INSERM U 426 and U 246, Faculté de Médecine Xavier Bichat, Université Paris 7, Paris, France; and Laboratoire de Physiologie, Faculté de Médecine, Université Paris 13, Bobigny, France
Decrease in alveolar oxygen tension may induce acute lung injury with pulmonary edema. We investigated whether, in alveolar epithelial cells, expression and activity of epithelial sodium (Na) channels and Na,Kadenosine triphosphatase, the major components of transepithelial Na transport, were regulated by hypoxia. Exposure of cultured rat alveolar cells to 3% and 0% O2 for 18 h reduced Na channel activity estimated by amiloride-sensitive 22Na influx by 32% and 67%, respectively, whereas 5% O2 was without effect. The decrease in Na channel activity induced by 0% O2 was time-dependent, significant at 3 h of exposure and maximal at 12 and 18 h. It was associated with a time-dependent decline in the amount of mRNAs encoding the a-, b-, and g-subunits of the rat epithelial Na channel (rENaC) and with a 42% decrease in a-rENaC protein synthesis as evaluated by immunoprecipitation after 18 h of exposure. The 0% O2 hypoxia also caused a time-dependent decrease in (1) ouabain-sensitive 86Rubidium influx in intact cells, (2) the maximal velocity of Na,K-ATPase on crude homogenates, and (3) a1- and b1-Na,K-ATPase mRNA levels. Levels of rENaC and a1-Na,K-ATPase mRNA returned to control values within 48 h of reoxygenation, and this was associated with complete functional recovery. We conclude that hypoxia induced a downregulation of expression and activity of epithelial Na channels and Na,K-ATPase in alveolar cells. Subsequent decrease in Na reabsorption by alveolar epithelium could participate in the maintenance of hypoxia-induced alveolar edema. Planès, C., B. Escoubet, M. Blot-Chabaud, G. Friedlander, N. Farman, and C. Clerici. 1997. Hypoxia downregualtes expression and activity of epithelial sodium channels in rat alveolar epithelial cells. Am. J. Respir. Cell Mol. Biol. 17:508–518.
Under physiologic conditions, resorption of fluid by alveolar epithelial cells keeps alveoli dry and ensures normal gas exchange. Sodium (Na) is actively transported from lumen to interstitium by alveolar epithelial cells, and alveolar fluid is reabsorbed across the epithelium by the resulting osmotic gradient (1). Sodium ions diffuse passively across the apical membrane of alveolar type II (ATII) cells down a favorable electrochemical gradient and are actively extruded at the basolateral side of the cells by
(Received in original form June 18, 1996 and in revised form January 8, 1997) Address correspondence to: Christine Clerici, M.D., Ph.D., Laboratory de Physiologie, UFR de Médecine, 74 rue Marcel Cachin, 93012, Bobigny Cedex, France. Abbreviations: alveolar type II, ATII; bovine serum albumin, BSA; counts per minute, cpm; Dulbecco’s modified Eagle medium, DMEM; fetal bovine serum, FBS; glyceraldehyde-3-phosphate, GAPDH; N-2-hydroxyethylpiperazine-N9-2-ethanesulfonic acid, Hepes; sodium, Na; Na,K-adenosine triphosphatase, Na,K-ATPase; ouabain-sensitive 86rubidium, OsRb; polyacrylamide gel electrophoresis, PAGE; inorganic phosphate, Pi; rubidium, Rb; rat epithelial Na channel, rENaC; maximal velocity, Vmax. Am. J. Respir. Cell Mol. Biol. Vol. 17, pp. 508–518, 1997
the ouabain-sensitive Na,K-adenosine triphosphatase (Na,KATPase) (2). Amiloride-sensitive Na channels represent the major pathway for apical Na entry in ATII cells, and are considered to be the rate-limiting step in alveolar transepithelial Na transport (1). Their presence in ATII cells has been evidenced by functional studies using 22Na flux and short-circuit current measurement or whole cell patch-clamp (2–4), and more recently by molecular studies (5) demonstrating that adult rat ATII cells express mRNA transcripts encoding the three subunits a, b, and g of the rat epithelial sodium channel (rENaC) (6, 7). In pathologic situations associated with alveolar flooding, the capacity of alveolar epithelium to maintain effective transepithelial Na transport could be critical in determining the severity and duration of alveolar edema (8). When the structure and function of epithelium are intact, alveolar Na reabsorption may participate in the clearance of alveolar edema. In some cases, the upregulation of the expression and activity of Na transport proteins in alveolar cells may also enhance alveolar fluid resorption, thereby limiting alveolar edema (9–11). On the contrary, when alveolar cell Na channel or Na,K-ATPase activity is decreased, the impairment of alveolar Na and fluid clearance
Planès, Escoubet, Blot-Chabaud, et al.: Hypoxia Downregulates Na Channels in Lung Alveolar Cells
could participate in the maintenance of pulmonary edema (12). Decrease in alveolar oxygen tension, in healthy subjects as well as in animals, potentially induces acute lung injury with pulmonary edema (13). The main mechanism whereby hypoxia induces alveolar flooding involves lung hemodynamic changes and increase in pulmonary microvascular permeability (14–16). Although alveolar cells are directly exposed to variations in ambient oxygen tension, there is little information about the role of alveolar epithelium in the development and/or the maintenance of hypoxia-induced alveolar edema. Both in vivo and in vitro studies have suggested that alveolar epithelial cells are quite resistant to hypoxia, inasmuch as neither ultrastructural characteristics nor cell viability were altered by prolonged hypoxic exposure (17, 18). However, the ability of these cells to maintain efficient vectorial Na transport under hypoxia remains questionable; we have shown in a previous report that prolonged hypoxia inhibits Na,K-ATPase activity in a rat alveolar epithelial cell line (19). In the present study, we investigated whether hypoxia altered the activity of Na channels and the expression of rENaC subunits in rat alveolar epithelial cells in primary culture. Our results indicate that hypoxia induced a timedependent decrease in Na channel activity and expression, and reduced the rate of a-rENaC protein synthesis. Hypoxia also resulted in a time-dependent decrease in the activity and expression of Na,K-ATPase, the other component of transepithelial Na transport. All these changes were fully reversed by reoxygenation. Together, these data suggest that hypoxia might reduce vectorial Na transport across alveolar epithelium. Subsequent decrease in alveolar fluid reabsorption could participate, along with increased pulmonary microvascular permeability, in the accumulation of alveolar edema during the acute phase of hypoxic lung injury.
Materials and Methods Cell Isolation ATII cells were isolated from pathogen-free male SpragueDawley rats (200–250 g) as previously described (20). Briefly, pooled cells from 3 rats were prepared as follows. Rats were injected intraperitoneally (i.p.) with 30 mg/kg pentobarbital sodium and intravenously (i.v.) 1 U/g heparin sodium. After a tracheotomy was performed, the animal was exsanguinated. Solution II (40–50 ml), which contained (in mM): 140 NaCl, 5 KCl, 2.5 sodium phosphate buffer, 10 N2-hydroxyethylpiperazine-N9-2-ethanesulfonic acid (Hepes), 2 CaCl2, and 1.3 MgSO4, pH 7.40, at 228C was perfused through the air-filled lungs via the pulmonary artery to clear the vascular space of blood. The lungs were removed from the thorax and lavaged to total lung capacity (8–10 ml) 5 times with solution I, which contained (in mM) 140 NaCl, 5 KCl, 2.5 sodium phosphate buffer, 10 Hepes, 6 D-glucose, and 2 ethylene glycol-bis(b-aminoethyl ether)N,N,N9,N9-tetraacetic acid, to remove macrophages, and 2 times with solution II. Lungs were then filled with 12–15 ml of elastase solution (porcine pancreas, twice crystallized 40 U/ml, prepared in solution II) and incubated in a shaking water bath in air for 10 min at 37 8C, after which additional elastase solution was instillated for another 10-
509
min incubation. The lungs were minced in the presence of DNAse I, and 5 ml of fetal bovine se rum (FBS) were added to stop the effect of elastase. The lungs were then sequentially filtered through 150- and 30- mm nylon mesh. The filtrate was centrifuged at 130 3 g for 8 min. The cell pellet was resuspended in Dulbecco’s modified Eagle medium (DMEM) containing 25 mM D-glucose at 378C. The cell suspension was plated at a density of 10 6 cells/cm2 in 25 cm2 bacteriologic plastic dishes to aid in the removal of macrophages by differential adherence. After incubation at 378C in a 5% CO2 incubator for 1 h, the unattached cells in suspension were removed and centrifuged at 130 3 g for 8 min. The resulting cell pellet (70% purity, . 95% viability, 8–10 3 106 cells/rat) was plated at a density of 7–10 3 105 cells/cm2 in 6-, 12-, or 24-well culture dishes. Culture medium consisted of DMEM containing 25 mM D-glucose, 10 mM Hepes, 23.8 mM NaHCO 3, 2 mM L-glutamine, 10% FBS, 50 U/ml penicillin, 50 mg/ml streptomycin, and 10 mg/ml gentamycin, incubated in a 5% CO2–95% air atmosphere. The cell purity after 24 h was 90 6 2% as assessed by a characteristic fluorescence with phosphine 3 R as previously described (20). Contaminating cells were essentially macrophages. Culture medium was changed 24 h after isolation and then on alternate days. Exposure to Hypoxia Four days after plating, growth medium was removed and replaced by a thin layer of fresh medium (0.15 ml/cm 2) with 10% FBS in order to decrease the diffusion distance of the ambient gas. Culture dishes were then placed in a humidified airtight incubator with inflow and outflow valves, and the hypoxic gas mixture (0% O 2–5% CO2– 95% N2) was delivered at 5 liters/min for 20 min. The airtight incubator was kept at 378C for 3, 6, 12, or 18 h, while control normoxic cells were placed in a 21% O2–5% CO2– 74% N2 humidified incubator for the same period of time. In additional experiments, exposure to mild hypoxia (5% O2–5% CO2–90% N2) or moderate hypoxia (3% O 2–5% CO2–92% N2) was performed as described above over an 18-h period. O2 tensions assayed in culture medium were approximately 30, 45, 60, and 140 mmHg for 0%, 3%, 5%, and 21% O2, respectively. pH in culture medium measured at the end of exposure was not significantly different under normoxic and hypoxic conditions. Trypan blue exclusion measured in cell monolayers exposed to hypoxia did not decrease, as compared with normoxic controls. For hypoxia–reoxygenation experiments, cells were exposed to 0% O2–5% CO2–95% N2 for 18 h, and then placed in a 21% O2–5% CO2–74% N2 humidified incubator with the normoxic counterparts for 24 or 48 additional hours. Culture medium was changed at the end of hypoxia and at 24 h of reoxygenation. Quantification of Dome Formation Dome formation was quantified in alveolar cell monolayers according to Goodman and Crandall (21). Immediately at the end of exposure, cell monolayers in 6-well plates obtained from 6 different preparations were observed on an inverted phase-contrast microscope (Telaval 31; Zeiss, Jena, Germany), and the density of domes in the monolay-
510
AMERICAN JOURNAL OF RESPIRATORY CELL AND MOLECULAR BIOLOGY VOL. 17 1997
ers was determined by counting the number of domes on 10 random fields/plate at a magnification of 3200.
presence of 1 mM ouabain. Results were expressed in nmol/mg protein/5 min.
Electron Microscopy At the end of exposure, cells grown in 35-mm plastic dishes were immediately fixed in 2.5% glutaraldehyde/ 0.1 M cacodylate buffer for 1 h at 4 8C, then post-fixed in 1% osmium tetroxyde and embedded in Epon. Ultrathin sections were contrasted with uranyl acetate and lead citrate and observed with an electron microscope (EM 410; Philips, Eindhoven, the Netherlands).
Na,K-ATPase Activity on Cell Homogenates Na,K-ATPase activity was assayed as ouabain-sensitive ATPase in cell homogenates as described by Post and Sen (25). At the end of exposure, cells grown in 100-mm plastic dishes were scraped off the dishes with a rubber policeman; harvested in a solution containing 300 mM mannitol and 10 mM Hepes Tris, pH 7.4; and homogenized manually on ice with 40 strokes in a glass Potter homogenizer. The homogenates were then centrifuged for 10 min at 4,000 rpm and the pellets were resuspended in the same buffer and used immediately. Samples of crude homogenates containing 30 mg of protein were incubated 15 min at 378C in a buffered solution containing (in mM) 120 NaCl, 20 KCl, 3 MgCl2, 30 Tris, and 3 ATP disodium salt, pH 7.4, in the absence or presence of 4 mM ouabain. The reaction was stopped by addition to the samples of an ice-cold solution containing 0.5% ammonium molybdate and 0.5% polyethylene 20 cetyl ether. Samples were kept on ice for 10 min and inorganic phosphate liberated was measured in a spectrophotometer at 390 nm. Na,K-ATPase activity was defined as the difference between inorganic phosphate (Pi) liberated in the absence and presence of ouabain, corrected for spontaneous nonenzymatic breakdown of ATP. Results were expressed in mmol Pi/mg protein/h.
22
Na Influx Studies The measurement of 22Na flux through amiloride-sensitive Na channels was performed as previously described (22). After removal of culture medium, cells in 12-well dishes were rinsed twice and preincubated 20 min at 37 8C in a buffered sodium-free solution (in mM): 137 N-methylglucamine, 5.4 KCl, 1.2 MgSO4, 2.8 CaCl2, and 15 Hepes (pH 7.4). At the end of preincubation, sodium-free solution was replaced by the uptake solution (in mM): 14 NaCl, 35 KCl, 96 N-methylglucamine, 20 Hepes (pH 7.4) containing 1 mM ouabain, and 0.5 mCi/ml 22NaCl (37 MBq/mg Na), in the absence or presence of 100 mM amiloride. After a 5-min incubation, uptake was stopped by washing the cells 3 times with 1 ml/well of ice-cold solution containing (in mM) 120 N-methylglucamine, and 20 Hepes, pH 7.4. Cells were solubilized in 0.5% Triton X-100. Tracer activities were determined by liquid scintillation counting and the remaining volume of each sample was used for assessing the protein content per well (23). Amiloride-sensitive 22Na influx was determined by the difference between the values measured in the absence or presence of amiloride. Results were expressed in nmol/mg protein/5 min. 86
Rubidium Influx Studies The measurement of rubidium (Rb) influx was performed as previously described (24). Assays were performed at 378C in buffered solution A of the following composition (in mM): 120 NaCl, 5 RbCl, 1 MgSO4, 0.15 Na2HPO4, 0.2 NaH2PO4, 4 NaHCO3, 1 CaCl2, 5 glucose, 2 lactate, 4 essential and nonessential amino acids, 20 Hepes, and 0.1% bovine serum albumin (BSA). The osmotic pressure of solution A was adjusted by manitol addition to 350 mosM, and pH was adjusted to 7.4. After removal of the culture medium, cells in 24-well plates were washed with 0.5 ml/ well of solution A, and incubated 5 min with 0.5 ml/well of solution A supplemented with 1 mCi/ml 86RbCl (370 MBq/ mg Rb) in the absence or presence of 1 mM ouabain. Uptake solutions used for hypoxic cells were equilibrated with the hypoxic gas mixture to avoid reoxygenation during uptake procedure. Uptake was stopped by washing the cells 3 times with 0.5 ml/well of ice-cold rinsing solution containing the following (in mM): 140 N-methylglucamine, 1.2 MgCl2, 3 NaCl2, 10 Hepes, and 0.1% BSA at pH 7.4. Cells were then solubilized in 0.5% Triton X-100 and tracer activities and protein content per well were determined as described above. Ouabain-sensitive Rb influx, reflecting Na,K-ATPase activity, was calculated as the difference between 86Rb influx measured in the absence and
RNase Protection Assay Cells in 35-mm plastic dishes were lysed in a buffer containing 4 M guanidium thiocyanate and 25 mM sodium citrate (pH 7.0, 0.5% sarcosyl), and directly used for RNase protection assay as previously described (26). Total RNA equivalent of 106 cells or 20 mg of yeast tRNA (Boehringer Mannheim, Indianapolis, IN) were cohybridized with 5 3 105 counts per minute (cpm) for rENaC or rat Na,K-ATPase probes, and 5 3 104 cpm for b-actin and glyceraldehyde-3phosphate (GAPDH) probes in 80% formamide, 40 mM 1,4-piperazine-diethanesulphonic acid (pH 7.4), 400 mM NaCl, and 1 mM EDTA at 508C overnight. RNase digestion (RNAse A, 40 mg/ml, and T1, 2 mg/ml; Boehringer Mannheim) was performed at 308C for 60 min. Then digestion with proteinase K (125 mg/ml; Boehringer Mannheim) was done at 378C for 30 min. After phenol extraction and ethanol precipitation, protected fragments were separated by urea-polyacrylamide gel electrophoresis (urea-PAGE). Gels were fixed with 10% acetic acid and vacuum-dried prior to exposure to Kodak X-OMAT AR 5 film (Kodak Scientific Imaging Systems, New Haven, CT), and signal was quantitated from the gel using direct radioactivity measurement with an Instant Imager (Packard Instruments, Packard Instrument Company, Meriden, CT). Actin expression was used as an internal standard since neither hypoxia nor reoxygenation significantly modified the level of actin mRNA. By contrast, the level of GAPDH mRNA was significantly increased after 12 and 18 h of exposure to 0% O2 (182% and 233% of normoxic control value, respectively), and could not be used as a reliable standard (see Figures 3 and 6). Results were expressed as the ratio of the mRNA of interest/actin mRNA (arbitrary units).
Planès, Escoubet, Blot-Chabaud, et al.: Hypoxia Downregulates Na Channels in Lung Alveolar Cells
cRNA Probes The 39-untranslated region of a-, b-, and g-rENaC subunit cDNA were subcloned into Bluescript KS plasmid. The length of rENaC subunit probes was 361 nt for a (protected fragment 317 nt, corresponding to nt 2458–2775), 259 nt for b (protected fragment 206 nt, corresponding to nt 2256–2462), and 385 nt for g (protected fragment 316 nt, corresponding to nt 2594–2911). Na,K-ATPase probes were synthesized from Bluescribe or Bluescript plasmids containing the cDNA of the a1 or b1 subunits. The probes were located in the 39-untranslated region. The length of Na,K-ATPase subunit probes was 240 nt for a1 (protected fragment 202 nt, corresponding to nt 3434–3636), and 395 nt for b1 (protected fragment 337 nt, corresponding to nt 1263–1600). Mouse b-actin was synthesized using a cDNA insert in PGEM-3. The probe was 190 nt long with a protected fragment of 135 nt (nt 696–831). Antisense RNA probes were synthesized using a T3/T7 in vitro synthesis kit (Promega, Madison, WI) in the presence of [32P]-UTP (15 TBq/mmol). Immunoprecipitation with Anti-rENaC a Subunit Antibodies An antibody was raised against the NH 2-terminus of the a subunit of rENaC (corresponding to aminoacids E10 to F77). A fusion protein was generated in the pGEX vector (Pharmacia, Uppsala, Sweden), isolated from bacterial lysate (glutathione S-transferase [GST]-agarose beads), and eluted with reduced glutathione according to the manufacturer’s procedure. The GST fusion protein was injected subcutaneously into rabbits. The specificity of such antibody has been reported previously (27). After the experimental period (hypoxia or normoxia), cells grown on plastic dishes (2 3 106 cells per well) were labeled with [35S]-methionine (37.5 Bq/mmol) for 3 h, and immunoprecipitation was performed according to Beron and Verrey (28) with some modifications. Cells were scraped off the plastic dishes and extracted in ice-cold lysis buffer (1% Triton X-100; 10 mM Tris-HCl, pH 7.5; 120 mM NaCl; 25 mM KCl; 2 mM, EDTA; 0.1 mM dithiothreitol; and 0.5 mM PMSF) for 20 min. Cellular debris were eliminated by centrifugation, and protein further extracted by adding sodium dodecyl sulfate (SDS) (2% final concentration) for another 20 min at 378C. Cell lysate was diluted with 6 vol of high salt buffer (HSB) (0.1% SDS; 1% deoxycholate; 0.5% Triton X-100; 20 mM Tris-HCl, pH 7.5; 120 mM NaCl; 25 mM KCl; 5 mM EDTA; and 0.1 mM dithiothreitol) and frozen until assay. Protein extracts (500 mg protein per sample) were precleared with a Staphylococcus aureus slurry (Pansorbin; Calbiochem, La Jolla, CA) at 48C for 30 min at a final concentration of 10% (volume slurry/extraction solution), followed by centrifugation (5 min, 5,000 rpm). Anti-a-rENaC antibody was added to the supernatant and the mixture was incubated overnight at 48C with end-over-end rotation. Immunoprecipitates were incubated with Protein A-Sepharose CL4B beads (Pharmacia) at 48C for 1 h with end-over-end rotation. The beads were then washed twice with HSB (with 1 M sucrose added, then with 1 M NaCl), then washed with low-salt buffer (2 mM EDTA; 0.5 mM dithiothreitol; and 10 mM Tris-HCl, pH 7.5),
511
and the antigen was eluted and reduced by heating (808C, 10 min) in PAGE sample buffer containing 5% b-mercaptoethanol. Detection of labeled proteins: samples of eluted immunoprecipitates were submitted to PAGE (7.5%). Gels were fixed with methanol and with acetic acid in water (30% and 10%, respectively) and submitted to intensifying treatment (Intensify A and B; New England Nuclear, Boston, MA) before vacuum-drying. Autoradiography of gel was obtained with Kodak X-OMAT AR 5 film and signal was quantified from the gel using direct radioactivity measurement with an Instant Imager (Packard Instruments). Results were expressed in net cpm after subtraction of background value. Materials All chemicals were purchased from Sigma Chemical (St. Louis, MO). Radioactive tracers were provided by Amersham (Aylesbury, UK). Culture media and reagents were from Gibco-BRL (Cergy-Pontoise, France). Plasticware was from Costar (Cambridge, MA). Presentation of Data and Statistical Analysis Uptakes of 22Na and 86Rb were expressed as nanomoles per milligram protein. Results are presented as means 6 SE of 3 to 6 separate experiments in which triplicates were obtained. One-way or two-way variance analyses were performed and, when allowed by the F value, results were compared by the modified least significant difference.
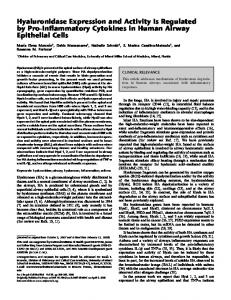
Results Effect of Hypoxia and Hypoxia–reoxygenation on Cell Morphology Light microscopy examination of normoxic alveolar cells after 4 days in culture revealed the presence of numerous domes (164.2 6 7.6 domes/cm2). Dome formation was strikingly reduced in cell monolayers exposed to 0% O 2 hypoxic atmosphere for 18 h (37.2 6 5.4 domes/cm2; P , 0.01). Reoxygenation induced a progressive reappearance of dome formation, reaching normoxic control value within 48 h. No evidence of cellular injury, such as abnormal cell debris floating in medium, was noticed in cell monolayers exposed to hypoxia. Electron microscopy examination revealed that alveolar cells after 4 days in culture retain some morphologic characteristics from type II cells, including lamellar bodies and tight junctions (Figure 1A). No sign of cellular injury such as cell swelling, nuclear picnosis, or blebs in plasmic membrane was observed in cells exposed to 0% O2 hypoxia for 18 h (Figure 1B), nor in hypoxic cells allowed to reoxygenate for 48 h (Figure 1C). Effect of Hypoxia and Hypoxia–reoxygenation on Amiloride-sensitive Na Channel Activity The activity of Na channels was estimated by amiloridesensitive 22Na influx in alveolar cell monolayers. Exposure of cells to 0% O2 hypoxia induced a time-dependent decrease in amiloride-sensitive 22Na influx which was apparent at 3 h of exposure (65% of control value), and maximal at 12 and 18 h (37% of control value) (Figure 2). After 18 h of 0% O2 exposure, reoxygenation of cells resulted in a progressive return of amiloride-sensitive 22Na influx to
512
AMERICAN JOURNAL OF RESPIRATORY CELL AND MOLECULAR BIOLOGY VOL. 17 1997
Figure 2. Effect of hypoxia and hypoxia–reoxygenation on amiloride-sensitive 22Na influx in alveolar epithelial cells. Rat alveolar cells from the same primary culture grown on plastic dishes for 4 days were exposed to either normoxia (21% O2; open squares) or hypoxia (0% O2; solid squares) for 3, 6, 12, or 18 h; or to hypoxia followed by reoxygenation (18 h 0% O 2 1 24 or 48 h 21% O2). Immediately at the end of exposure, 22Na influx measurements were performed over a 5-min period. Amiloride-sensitive 22Na influx was determined as the difference between uptake values in the absence and presence of amiloride (100 mM). Results are expressed in nmol/mg protein/5 min and represent means 6 SE of 3 to 7 different experiments in which triplicates were obtained. *Significantly different from normoxic control value. P , 0.05.
control value, with a complete recovery within 48 h. The effect of hypoxia was also O 2 concentration-dependent: while exposure to 5% O2 for 18 h had no significant effect on Na channel activity, exposure to 3% O2 and 0% O2 for the same period of time reduced amiloride-sensitive 22Na influx by 32% and 67%, respectively (compared with normoxic control value) (Table 1). Hypoxia affected only the amiloride-sensitive component of 22Na influx; the amilorideinsensitive 22Na influx, which initially represented approximately 55% of total influx, remained unchanged after 18 h of hypoxic exposure (47.8 6 4.8 versus 48.7 6 3.4 nmol/mg protein/5 min for hypoxia and normoxia, respectively; NS). Effect of Hypoxia and Hypoxia–reoxygenation on a-, b-, and g-rENaC mRNA Levels RNase protection assays were performed in order to determine the level of a-, b- and g-rENaC subunit mRNA transcripts in normoxic and hypoxic cells. As shown in Figure 3, transcripts encoding for the three rENaC subunits
Figure 1. Ultrastructural characteristics of normoxic and hypoxic alveolar epithelial cells. Rat ATII cells grown on plastic dishes for 4 days were exposed for 18 h to either normoxia (21% O 2; A:
original magnification 37,100), hypoxia (0% O2; B: original magnification 37,100), or hypoxia–reoxygenation (18 h 0% O2 1 48 h 21% O2; C: original magnification 37,100), and immediately processed for electron microscopic examination. Cells exposed to normoxia, hypoxia, or hypoxia–reoxygenation display apical microvilli (arrowheads), lamellar bodies (lb), and tight junctions (arrows) between adjacent cells. No sign of cellular injury is detected in cells exposed to hypoxia or to hypoxia–reoxygenation. AP 5 apical side; BL 5 basolateral side.
Planès, Escoubet, Blot-Chabaud, et al.: Hypoxia Downregulates Na Channels in Lung Alveolar Cells
TABLE 1
Effect of decreasing oxygen concentration on amiloride-sensitive 22Na influx in alveolar epithelial cells Oxygen Concentration 21%
5%
3%
0%
Amiloride-sensitive 38.6 6 2.4 36.3 6 7.5 26.3 6 2.9* 12.7 6 2.9† 22 Na influx (nmol/mg protein/5 min) Rat alveolar cells grown on plastic dishes for 4 days were exposed to either 21%, 5%, 3%, or 0% O2 for 18 h. Immediately at the end of exposure, 22Na influx measurements were performed over a 5-min period. Amiloride-sensitive 22 Na influx was determined as the difference between uptake values in the absence and presence of amiloride (100 mM). Values are means 6 SE of 6 separate experiments in which triplicates were obtained. Statistical difference (P , 0.05) of values from 21% group is indicated by *; from 3% group is indicated by †.
were detectable in alveolar epithelial cells. In normoxic control cells, the level of a-, b- and g-rENaC mRNAs remained unchanged over time. Exposure of alveolar cells to 0% O2 hypoxia induced a time-dependent decrease in the expression of a-, b- and g-rENaC mRNAs (Figure 4). The decrease in a- and b-rENaC mRNA was similar, being significant after at least 6 h of hypoxia, and maximal at 18 h
513
of hypoxia (58% and 52% of normoxic values for a- and b-rENaC, respectively). By contrast, the fall in g-rENaC mRNA level was already significant at 3 h of hypoxia, and maximal at 12 h of exposure (32% of normoxic control value). When hypoxic cells were allowed to recover in 21% O2, g-rENaC mRNA level returned to normal in 24 h whereas a complete recovery in a- and b-rENaC mRNA levels was achieved within 48 h. Effect of Hypoxia and Hypoxia–reoxygenation on a-rENaC Subunit Synthesis Immunoprecipitation assays using a polyclonal antibody against a-rENaC subunit were performed in normoxic and hypoxic alveolar cells in order to quantify the rate of a-rENaC subunit synthesis. As shown in Figure 5, immunoprecipitation allowed detection of a specific band at 90 kD. Exposure of alveolar cells to 0% O2 hypoxia for 18 h reduced by 42% the rate of a-rENaC subunit synthesis, as compared with the corresponding normoxic control value (0.6 6 0.09 versus 0.35 6 0.04 cpm for normoxia and hypoxia, respectively; n 5 6, P , 0.05). Reoxygenation for 48 h induced a complete recovery in the rate of a-rENaC subunit synthesis (0.59 6 0.11 versus 0.63 6 0.12 cpm for normoxia and hypoxia–reoxygenation, respectively; n 5 4, NS).
Figure 3. mRNA expression of a-, b-, and g-rENaC subunits in alveolar epithelial cells exposed to hypoxia and hypoxia–reoxygenation. Rat alveolar cells from the same primary culture grown in 10% FBS on plastic dishes were exposed to: (1) either normoxia (21% O2) or hypoxia (0% O2) for 3, 6, 12, or 18 h; or (2) hypoxia–reoxygenation (18 h 0% O 2 1 24 or 48 h 21% O2). At the end of exposure, RNase protection assays were performed on cell lysates (RNA equivalent to 10 6 cells) as described in Materials and Methods. C: normoxic control cells; H: hypoxic cells; MW: molecular weight ladder; arrows indicate the size of the expected protected fragment for each probe.
514
AMERICAN JOURNAL OF RESPIRATORY CELL AND MOLECULAR BIOLOGY VOL. 17 1997
Figure 5. Immunoblot showing the effect of hypoxia and hypoxia–reoxygenation on a-rENaC subunit synthesis in alveolar epithelial cells. Rat alveolar cells from 3 different preparations were grown 4 days in 10% SVF and then exposed to either normoxia (21% O2) or hypoxia (0% O2) for 18 h, followed by 48 h reoxygenation. At the end of exposure, cells were labeled with [35S]methionine for 3 h and immunoprecipitation with antirENaC a subunit antibodies was afterwards performed on cell extracts (500 mg protein per sample) as described in Materials and Methods. Lane 1: molecular weight (MW). Lanes 2, 3, 4: normoxia (18 h 21% O2). Lanes 5, 6, 7: hypoxia (18 h 0% O2). Lanes 8, 9, 10: normoxia (66 h 21% O2). Lanes 11, 12, 13: hypoxia–reoxygenation (18 h 0% O2 1 48 h 21% O2).
shown in Figure 6, exposure to 0% O2 induced a time-dependent decrease in OsRb influx. This decrease was significant but moderate at 3 and 6 h of exposure (80% of control value), and maximal at 18 h hypoxia (45% of control value). In cells exposed to 18 h hypoxia and allowed to reoxygenate, OsRb influx recovered progressively, representing 75% of control value within 24 h and reaching normoxic control value within 48 h. To determine whether the hypoxia-induced OsRb influx decrease was related to a change in the number of
Figure 4. Effect of hypoxia and hypoxia–reoxygenation on mRNA expression of a-, b-, and g-rENaC subunits in alveolar epithelial cells. Rat alveolar cells from the same primary culture grown in 10% FBS on plastic dishes were exposed to either normoxia (21% O2; open squares) or hypoxia (0% O2; solid squares) for 3, 6, 12, or 18 h; or to hypoxia–reoxygenation (18 h 0% O 2 1 24 or 48 h 21% O2). At the end of exposure, RNase protection assays were performed on cell lysates (RNA equivalent to 106 cells) as described in Materials and Methods. Quantitation of a-, b-, and g-rENaC subunit mRNAs was performed using an Instant Imager. Data were normalized for the corresponding actin signal in each lane. Results are expressed as the unitless ratio of a-, b-, and g-rENaC subunit mRNA/actin mRNA, and represent means 6 SE of 3 to 6 independent experiments. *Significantly different from normoxic control value. P , 0.05.
Effect of Hypoxia and Hypoxia–reoxygenation on Na,K-ATPase Activity Na,K-ATPase activity was first estimated in alveolar cell monolayers by ouabain-sensitive 86Rb (OsRb) influx. As
Figure 6. Effect of hypoxia and hypoxia–reoxygenation on OsRb influx in alveolar epithelial cells. Rat alveolar cells from the same primary culture grown in 10% FBS on plastic dishes were exposed to either normoxia (21% O2; open squares) or hypoxia (0% O2; solid squares) for 3, 6, 12, or 18 h; or to hypoxia–reoxygenation (18 h 0% O2 1 24 or 48 h 21% O2). 86Rb influx studies were performed immediately at the end of exposure over a 5-min period. OsRb influx was determined as the difference between uptake values in the absence and presence of ouabain (1 mM). Results are expressed in nmol/mg protein/5 min and represent means 6 SE of 4 to 6 different experiments in which triplicates were obtained. *Significantly different from normoxic control value. P , 0.05.
Planès, Escoubet, Blot-Chabaud, et al.: Hypoxia Downregulates Na Channels in Lung Alveolar Cells
TABLE 2
Effect of hypoxia and hypoxia–reoxygenation on the maximal velocity of Na,K-ATPase activity in alveolar epithelial cells Vmax of Na,K-ATPase Activity (mmol Pi/mg protein/h) Exposure time
Normoxia (21% O2) Hypoxia (0% O2)
3h
18 h
18 h 1 48 h reox.
4.16 6 1 4.31 6 0.65
4.47 6 0.49 2.20 6 0.53*
5.98 6 0.28 6.05 6 0.13
Rat alveolar cells from the same primary culture were grown 4 days in 10% FBS on plastic dishes and then exposed to either normoxia (21% O2) or hypoxia (0% O2) for 3 or 18 h, or to hypoxia followed by reoxygenation (18 h 0% O2 1 48 h 21% O2). Immediately at the end of exposure, crude cell homogenates were prepared and Na,K-ATPase activity was determined by the rate of ouabain-inhibitable ATP hydrolysis under conditions of Vmax determined over a 15-min period. Results are expressed in mmol Pi/mg protein/h and represent means 6 SE of 3 or 6 separate experiments in which triplicates were obtained. * Significantly different from normoxic value. P , 0.05.
515
Effect of Hypoxia and Hypoxia–reoxygenation on the Level of mRNAs Encoding a1- and b1-subunits of Na,K-ATPase RNase protection assays showed that a1- and b1-Na,KATPase subunit mRNA transcripts were expressed in alveolar cells (Figure 7). The mRNA levels of both subunits were unchanged throughout the experimental procedure in normoxic alveolar cells (Figure 8). The 0% O2 hypoxia induced a decrease in a1-Na,K-ATPase mRNA level which was maximal at 6 h of exposure (54% of normoxic control value), and remained at this level for longer exposure times (Figure 8). The level of b1-Na,K-ATPase mRNA dropped in a time-dependent manner during hypoxia, reaching 36% of control value after 12 h of exposure. The effect of hypoxia was reversible; mRNA level of both subunits progressively increased during reoxygenation. However, the recovery was complete for a1-Na,K-ATPase mRNA after 48 h of reoxygenation, whereas it was only partial at this time for b1-Na,K-ATPase mRNA expression (71% of control value).
Discussion available functional units of Na pump, we also measured the maximal velocity (Vmax) of Na,K-ATPase activity on crude cell homogenates. Exposure to 0% O 2 for 3 h did not modify the Vmax of the enzyme (Table 2). By contrast, after an 18 h exposure, the Vmax of Na,K-ATPase activity decreased by 50%, as compared with normoxic control. In hypoxic cells allowed to reoxygenate for 48 h, the Vmax of Na,K-ATPase activity returned to normoxic control value (Table 2).
The present study shows that after several days in culture adult rat ATII cells maintain their ability to transport Na actively, to express the three transcripts for rENaC subunits, and to synthetize a-rENaC protein, even though they may have undergone some phenotypic changes with time in culture. Our data clearly indicate that exposure of alveolar epithelial cells to hypoxia resulted in an inhibition of Na channel activity, as shown by the decrease in amiloride-sensitive 22Na influx. This decrease was O2 con-
Figure 7. mRNA expression of a1- and b1-Na,K-ATPase subunits in alveolar epithelial cells exposed to hypoxia and hypoxia–reoxygenation. After 4 days in culture, rat alveolar cells were exposed to: (1) either normoxia (21% O 2) or hypoxia (0% O2) for 3, 6, 12, or 18 h; or (2) hypoxia–reoxygenation (18 h 0% O2 1 24 or 48 h 21% O2). At the end of exposure, RNase protection assays were performed on cell lysates (RNA equivalent to 10 6 cells) as described in Materials and Methods. C: normoxic control cells; H: hypoxic cells; MW: molecular weight ladder; arrows indicate the size of the expected protected fragment for each probe.
516
AMERICAN JOURNAL OF RESPIRATORY CELL AND MOLECULAR BIOLOGY VOL. 17 1997
Figure 8. Effect of hypoxia and hypoxia–reoxygenation on mRNA expression of a1- and b1-Na,K-ATPase subunits in alveolar epithelial cells. Rat alveolar cells were exposed to either normoxia (21% O2; open squares) or hypoxia (0% O2; solid squares) for 3, 6, 12, or 18 h; or to hypoxia–reoxygenation (18 h 0% O 2 1 24 or 48 h 21% O2). At the end of exposure, RNase protection assays were performed on cell lysates (RNA equivalent to 10 6 cells), and a1- and b1-Na,K-ATPase mRNA levels were quantitated using an Instant Imager. Data were normalized for the corresponding actin signal in each lane. Results are expressed as the ratio of a1- or b1-Na,K-ATPase subunit mRNA/actin mRNA, and represent means 6 SE of 3 to 6 independent experiments. *Significantly different from normoxic control value. P , 0.05.
centration-dependent with a threshold between 5% and 3% O2, and time-dependent with a maximal effect at 12 and 18 h for 0% O2. Na channel inhibition was associated with a decrease in a-, b- and g-rENaC mRNA levels and with reduced synthesis of a-rENaC protein. That the decrease in Na channel expression and activity was not due to a general toxic effect of 0% O2 hypoxia is indicated by the following evidence. First, the decrease in rENaC mRNA transcripts was concomitant with an increase in GAPDH mRNA, while b-actin mRNA remained unchanged. Second, no sign of cellular damage was detected in hypoxic cells by light and electron microscopy. Third, the inhibitory effects of hypoxia were completely reversed when hypoxic cells were transferred to normoxic atmosphere for 48 h.
Our experiments show that under hypoxia, the decrease in amiloride-sensitive 22Na influx roughly paralleled that in rENaC subunit mRNA levels, suggesting a causative link between reduced mRNA expression and impaired activity. Likewise, it was previously reported that in Xenopus oocytes, maximal channel activity was obtained only when the three rENaC subunit cDNAs were simultaneously injected (7). That the expression of the three subunits is crucial for optimal activity is supported herein by the fact that during long-term hypoxia, maximal inhibition of Na channel activity occurred concomitantly with maximal decrease in a-, b-, and g-rENaC mRNA transcripts and with reduced synthesis of a-rENaC protein. Moreover, the observation that during reoxygenation, the progressive recovery in Na channel activity paralleled the recovery in a-, b-, and g-rENaC mRNA level, and was associated with normalization of a-rENaC protein synthesis, suggests that de novo synthesis of rENaC subunits is necessary to restore normal Na channel activity after prolonged hypoxia, and that this protein synthesis requires the restoration of adequate rENaC mRNA levels. Regarding short-term hypoxia, it is noteworthy that reduced channel activity occurred at a time when only g-rENaC mRNA was decreased, whereas a- and b-rENaC mRNA levels were unchanged. One possibility is that reduced amount of g-rENaC mRNA led to insufficient production of g-rENaC subunit and subsequently accounted for reduced functional activity, inasmuch as g-rENaC subunit was previously reported to be necessary for the correct processing of Na channel proteins at the cell surface (29). The other possibility is that the decrease in Na channel activity is related to translational or post-translational events, including decreased efficiency in the translation of rENaC mRNA or in the apical membrane trafficking of rENaC subunits, abnormal degradation or internalization of the channel protein (11), or hypoxia-induced modification of intracellular signals that modulate Na channel activity (30). Our observation that 0% O2 induced a time-dependent decrease in rENaC mRNA levels followed by an increase when the cells were transferred from 0% to 21% O 2 strongly suggests that Na channel expression is regulated by O2 tension. Consistent with this hypothesis, others have shown that, in alveolar cells, an increase in O2 tension upregulated the level of rENaC transcripts: (1) the transfer of rat fetal distal lung epithelial cells in culture from 3% O2 to higher O 2 concentration induced an increase in rENaC mRNA transcripts as well as in Na channel activity (31), and (2) hyperoxic lung injury in adult rat was associated with increased a-rENaC mRNA expression and Na channel activity in ATII cells (11). The molecular mechanisms whereby decrease in O 2 tension downregulates rENaC mRNA transcripts in alveolar cells has not been yet elucidated. From previous studies in bacterial and mammalian systems, a general mechanism for regulation of gene expression under hypoxia can be drawn: a cytosolic membrane-bound protein, probably a hemoprotein, could function as an oxygen sensor; and hypoxic signal transduction could involve changes in protein phosphorylation or in redox status of the cell which, in turn, modulate the activity of various transcription factors controlling the expression of oxygen-responsive genes (32). Moreover,
Planès, Escoubet, Blot-Chabaud, et al.: Hypoxia Downregulates Na Channels in Lung Alveolar Cells
modification of intracellular ionic content under hypoxia may itself exert control over expression of ion transport proteins. Further in vitro studies will help to determine the mechanisms implicated in the oxygen-dependent regulation of rENaC gene expression in alveolar cells. Along with apical Na channels, basolateral Na,K-ATPase represents the major protein involved in transepithelial Na transport by alveolar cells. In our study, hypoxia resulted in a time-dependent decrease in Na,K-ATPase activity, estimated by OsRb influx, which roughly paralleled the reduction in Na channel activity. This could either be due to a direct effect of hypoxia on Na,K-ATPase, or be secondary to the hypoxia-induced inhibition of Na channel activity. For short exposure times, the decrease in OsRb influx with no change in Vmax and in mRNAs of Na,K-ATPase likely reflects short-term feedback inhibition of the Na pump in response to decreased intracellular Na concentration due to reduced rate of Na entry through Na channels (33). For long exposure times, the decrease in OsRb influx was associated with reduced Vmax, indicating that the amount of functional enzyme available at the cell surface was reduced, and with decreased level of Na,KATPase mRNA transcripts. In this case, the decrease in Na pump activity could be the consequence of a direct effect of hypoxia either on Na,K-ATPase mRNA expression, or at a post-translational level including abnormal cellular routage or increased degradation rate of the protein (34). It cannot be ruled out, however, that prolonged inhibition of Na channels might also be partly responsible for reduced Vmax in this case, since sustained decrease in intracellular Na was previously shown to reduce the number of pumps inserted in plasmic membrane (35). In conclusion, the present study clearly demonstrates in alveolar epithelial cells in culture a downregulation of amiloride-sensitive Na channels by hypoxia. Although the direct assessment of transepithelial Na flux by short circuit current was not performed in the present study, the decrease in Na channel activity along with that in Na,KATPase strongly suggests that hypoxia may reduce transepithelial Na flux. It is generally assumed that, in vivo, hypoxia-induced alveolar edema is mostly related to lung hemodynamic changes or increase in pulmonary microvascular permeability (15). From our results, we can speculate that decreased expression and activity of Na transport proteins in alveolar cells may hamper the resorption of alveolar edema in the early phase of hypoxic lung injury, an effect which may, however, be counteracted in vivo by catecholamine-dependent and independent compensatory mechanisms (9–11). In line with our data, a recent preliminary report showed that subacute hypoxic exposure in rat was associated with a decrease in alveolar Na and fluid clearance (36). Finally, in our experiments, the recovery in Na channel and Na,K-ATPase expression and activity observed upon reoxygenation suggests that active transepithelial Na transport may be restored during the reparative phase of hypoxic lung injury, and may therefore contribute, along with other adaptive mechanisms, to the clearance of alveolar fluid. Acknowledgments: The authors thank Dr. B. Rossier for the generous gift of cDNA probes coding for a-, b-, and g-rENaC subunits; Dr. J. Lingrel for the generous gift of the full-length cDNA probes coding for the a1 and b1 isoforms
517
of rat Na,K-ATPase; and Mrs. S. Couette, C. Leroy, and Mr. A. Grodet for their helpful technical assistance. This work was supported by grants from INSERM, CNRS, Fondation pour la Recherche Médicale, and Laboratoire de Recherches Physiologiques.
References 1. Basset, G., C. Crone, and G. Saumon. 1987. Significance of active ion transport in transalveolar water absorption: a study on isolated rat lung. J. Physiol. (Lond.) 384:311–324. 2. Matalon, S., R. J. Bridges, and D. J. Benos. 1991. Amiloride-inhibitable Na1 conductive pathways in alveolar type II pneumocytes. Am. J. Physiol. 260: L90–L96. 3. Matalon, S., K. L. Kirk, J. K. Bubien, Y. Oh, P. Hu, G. Yue, R. Shoemaker, E. J. Cragoe, Jr., and D. J. Benos. 1992. Immunocytochemical and functional characterization of Na1 conductance in adult alveolar pneumocytes. Am. J. Physiol. 262:C1228–C1238. 4. Russo, R. M., R. L. Lubman, and E. D. Crandall. 1992. Evidence for amiloride-sensitive sodium channels in alveolar epithelial cells. Am. J. Physiol. 262:L405–L411. 5. Tchepichev, S., J. Ueda, C. Canessa, B. C. Rossier, and H. O’Brodovich. 1995. Lung epithelial Na channel subunits are differentially regulated during development and by steroids. Am. J. Physiol. 269:C805–C812. 6. Canessa, C. M., J.-D. Horisberger, and B. C. Rossier. 1993. Epithelial sodium channel related to proteins involved in neurodegeneration. Nature 361:467–470. 7. Canessa, C. M., L. Schild, G. Buell, B. Thorens, I. Gautschi, J.-D. Horisberger, and B. C. Rossier. 1994. Amiloride-sensitive epithelial Na1 channel is made of three homologous subunits. Nature 367:463–467. 8. Matthay, M. A., and J. P. Wiener-Kronish. 1990. Intact epithelium barrier function is critical for the resolution of alveolar edema in humans. Am. Rev. Respir. Dis. 142:1250–1257. 9. Pittet, J. F., J. P. Wiener-Kronish, M. C. McElroy, H. G. Folkesson, and M. A. Matthay. 1994. Stimulation of lung epithelial liquid clearance by endogenous release of catecholamines in septic shock in anesthetized rats. J. Clin. Invest. 94:663–671. 10. Olivera, W., K. Ridge, L. D. H. Wood, and J. I. Sznajder. 1994. Active sodium transport and alveolar epithelial Na-K-ATPase increase during subacute hyperoxia in rats. Am. J. Physiol. 266:L577–L584. 11. Yue, G., W. J. Russell, D. J. Benos, R. M. Jackson, M. A. Olman, and S. Matalon. 1995. Increased expression and activity of sodium channels in alveolar type II cells of hyperoxic rats. Proc. Natl. Acad. Sci. USA 92:8418– 8422. 12. Olivera, W. G., K. M. Ridge, and J. I. Sznajder. 1995. Lung liquid clearance and Na,K-ATPase during acute hyperoxia and recovery in rats. Am. J. Respir. Crit. Care Med. 152:1229–1234. 13. Schoene, R. B. 1985. Pulmonary edema at high altitude: review, pathophysiology, and update. Clin. Chest Med. 6:491–506. 14. Ogawa, S., H. Gerlach, C. Esposito, A. Pasagian-Macaulay, J. Brett, and D. Stern. 1990. Hypoxia modulates the barrier and coagulant function of cultured bovine endothelium. J. Clin. Invest. 85:1090–1098. 15. Stelzner, T. J., R. F. O’Brien, K. Sato, and J. V. Weil. 1988. Hypoxia-induced increases in pulmonary transvascular protein escape in rats. J. Clin. Invest. 82:1840–1847. 16. West, J. B., K. Tsukimoto, O. Mathieu-Costello, and R. Prediletto. 1991. Stress failure in pulmonary capillaries. J. Appl. Physiol. 70:1731–1742. 17. Scott, K. W. M., G. R. Barer, E. Leach, and I. P. F. Mungall. 1978. Pulmonary ultrastructural changes in hypoxic rats. J. Pathol. 126:27–33. 18. Graven, K. K., L. H. Zimmerman, E. W. Dickson, G. L. Weinhouse, and H. W. Farber. 1993. Endothelial cell hypoxia associated proteins are cell and stress specific. J. Cell Physiol. 157:544–554. 19. Planès, C., G. Friedlander, A. Loiseau, C. Amiel, and C. Clerici. 1996. Inhibition of Na,K-ATPase activity after prolonged hypoxia in an alveolar epithelial cell line. Am. J. Physiol. 271:L71–L78. 20. Clerici, C., P. Soler, and G. Saumon. 1991. Sodium-dependent phosphate and alanine transports but sodium-independent hexose transport in type II alveolar epithelial cells in primary culture. Biochim. Biophys. Acta 1063: 27–35. 21. Goodman, B. E., and E. D. Crandall. 1982. Dome formation in primary cultured monolayers of alveolar epithelial cells. Am. J. Physiol. 243:C96– C100. 22. Clerici, C., S. Couette, A. Loiseau, P. Herman, and C. Amiel. 1995. Evidence of Na-K-Cl cotransport in alveolar epithelial cells: effect of phorbol ester and osmotic stress. J. Membr. Biol. 147:295–304. 23. Bradford, M. 1976. A rapid and sensitive method for the quantification of microgram quantities of protein utilising the principle of protein-dye binding. Anal. Biochem. 72:248–254. 24. Clerici, C., G. Friedlander, and C. Amiel. 1992. Impairment of sodium-coupled uptakes by hydrogen peroxyde in alveolar type II cells: protective effect of d-a-tocopherol. Am. J. Physiol. 262:L542–L548. 25. Post, R. A., and A. K. Sen. 1967. Sodium potassium stimulated ATPase. Methods Enzymol. 10:762–768.
518
AMERICAN JOURNAL OF RESPIRATORY CELL AND MOLECULAR BIOLOGY VOL. 17 1997
26. Escoubet, B., C. Coureau, M. Blot-Chabaud, J.-P. Bonvalet, and N. Farman. 1996. Corticosteroid receptor mRNA expression is unaffected by corticosteroids in rat kidney, heart, and colon. Am. J. Physiol. 270:C1343–C1353. 27. Duc, C., N. Farman, C. M. Canessa, J.-P. Bonvalet, and B. C. Rossier. 1994. Cell-specific expression of epithelial sodium channel a, b, and g subunits in aldosterone-responsive epithelia from the rat: localization by in situ hybridization and immunocytochemistry. J. Cell Biol. 127:1907–1921. 28. Beron, J., and F. Verrey. 1994. Aldosterone induces early activation and late accumulation of Na-K-ATPase at surface of A6 cells. Am. J. Physiol. 266:C1278–C1290. 29. Lingueglia, E., S. Renard, R. Waldmann, N. Voilley, G. Champigny, H. Plass, M. Lazdunski, and P. Barbry. 1994. Different homologous subunits of the amiloride-sensitive Na1 channel are differently regulated by aldosterone. J. Biol. Chem. 269:13736–13739. 30. Palmer, L. G., and G. Frindt. 1987. Effects of cell Ca21 and pH on Na1 channels from rat cortical collecting tubule. Am. J. Physiol. 253:F333–F339.
31. Pitkänen, O., A. K. Tanswell, G. Downey, and H. O’Brodovich. 1996. Increased PO2 alters the bioelectric properties of fetal lung epithelium. Am. J. Physiol. 270:L1060–L1066. 32. Bunn, H. F., and R. O. Poyton. 1996. Oxygen sensing and molecular adaptation to hypoxia. Physiol. Rev. 76:839–885. 33. Pressley, T. A. 1988. Ion concentration-dependent regulation of Na,Kpump abundance. J. Membr. Biol. 105:187–195. 34. Molitoris, B. A., P. D. Wilson, R. W. Schrier, and R. S. Simon. 1985. Ischemia induces partial loss of surface membrane polarity and accumulation of putative calcium ionophores. J. Clin. Invest. 76:2097–2105. 35. Kim, D., and T. W. Smith. 1986. Effect of growth in low-Na1 medium on transport sites in cultured heart cells. Am. J. Physiol. 250:C32–C39. 36. Suzuki, S., T. Sakuma, M. Sugita, Y. Hoshikawa, M. Noda, S. Ono, T. Tanita, and S. Fujimura. 1996. Subacute hypoxic challenge decreases alveolar fluid clearance in rat. Am. J. Respir. Crit. Care Med. 153:A505. (Abstr.)