Dynamic Coordination of Neuronal Circuits Through Inter-Areal Oscillatory ... coordination of multiple, spatially-distributed neuronal circuits. ...... gs and rando.
Dynamic Coordination of Neuronal Circuits Through Inter-Areal Oscillatory Synchronization By Andre Bastos B.A. (University of California, Berkeley) 2007 DISSERTATION Submitted in partial satisfaction of the requirements for the degree of DOCTOR OF PHILOSOPHY in Neuroscience in the OFFICE OF GRADUATE STUDIES of the UNIVERSITY OF CALIFORNIA DAVIS Approved: ______________________________________________ Steven J. Luck, Chair ______________________________________________ W. Martin Usrey ______________________________________________ George R. Mangun ______________________________________________ Pascal Fries ______________________________________________ Arne Ekstrom Committee in Charge 2013 i
Abstract
A central question in neuroscience is how does the brain accomplish contextsensitive computation? A well-established example of context-sensitive computation is visual selective attention, which involves enhancing some neuronal representations relative to others such that behaviorally relevant stimuli are preferentially processed. This cognitive computation most likely relies on a dynamic coordination of multiple, spatially-distributed neuronal circuits. This dissertation pursues the hypothesis that neuronal oscillations are intimately involved in this context-sensitive computation, by dynamically coordinating the activity between and within neuronal circuits through synchronization at distinct frequencies. In Chapter 1, I review the dynamic coordination problem and the existing evidence for oscillations as a mechanism thereof. In Chapter 2, I summarize the foundational concepts for the methods used in this dissertation to quantify inter-areal oscillatory synchronization. In Chapter 3, I describe how these methods were applied to highdensity electrocorticography recordings from awake-behaving monkeys, and report large-scale networks of oscillatory synchronization and their modulation by selective attention. In Chapter 4, I describe how the hierarchical interactions between multiple areas of the visual cortex are revealed in functional data by showing that beta frequency rhythms flow in the top-down direction, and gamma frequency rhythms flow in the bottom-up direction. Furthermore, these counter-streaming directed influences define a functional hierarchy of the visual cortex which is highly ii
similar to anatomy-based hierarchies. In Chapter 5, I describe an analysis of the anatomy and physiology of the underlying circuits which might have generated these structured patterns of oscillatory synchronization. The empirically observed circuit is compared to the theoretically predicted circuit implied by predictive coding theory. This analysis converges on the notion that some aspects of cortical circuitry and physiology are canonical, and that these circuits would be capable of implementing predictive coding through feedforward and feedback message passing amongst multiple hierarchically deployed canonical microcircuits. In Chapter 6, the canonical microcircuit model from Chapter 5 is used to model observed oscillatory synchronization patterns between two hierarchically-separated visual cortical areas. In Chapter 7, I consider whether oscillatory interactions are emergent properties of the cortex, or whether they are inherited from pre-cortical structures. Finally, in Chapter 8, I summarize the findings and consider challenges to the framework of dynamic coordination through oscillations.
iii
Table of Contents Abstract ............................................................................................................................... ii Acknowledgements ............................................................................................................. 1 Chapter 1: Introduction ....................................................................................................... 4 Part I: Historical Background ......................................................................................... 5 Part II: The Computational level..................................................................................... 9 Part IIIa: The algorithmic level: possible mechanisms for dynamic coordination ....... 11 Part IIIb: The algorithmic level: review of the evidence that oscillations subserve dynamic coordination.................................................................................................... 23 Part IV: The physical level ........................................................................................... 33 Part V: How this thesis contributes to answering the dynamic coordination problem . 39 Chapter 2: Methods ........................................................................................................... 42 Part I: The recording methodology problem ................................................................. 43 Part IIa: Motivation, intuition, and definition for functional connectivity methods ..... 47 Part IIb: Limitations and common problems of functional connectivity methods ....... 66 Part IIIa: Motivation, intuition, and definition for effective connectivity methods...... 81 Part IIIb: Pros and cons of the DCM approach ............................................................. 91 Chapter 3: Gamma- and beta-synchronized corticocortical networks mediate bottom-up and top-down processing .................................................................................................. 96 Introduction ................................................................................................................... 97 Materials and Methods .................................................................................................. 98 Results ......................................................................................................................... 103 Discussion ................................................................................................................... 122 Chapter 4: Visual areas exert bottom-up and top-down influences through distinct frequency channels.......................................................................................................... 127 Introduction ................................................................................................................. 128 Materials and Methods ................................................................................................ 131 Results ......................................................................................................................... 139 Discussion ................................................................................................................... 152 Chapter 5: Canonical microcircuits for predictive coding .............................................. 154 Part I: The anatomy and physiology of cortical connections ...................................... 156 Part II: A canonical microcircuit for predictive coding .............................................. 178 Part III: The cortical microcircuit and predictive coding............................................ 187 iv
Chapter 6: A dynamic causal modeling study of spectral asymmetries in feedforward and feedback connections between visual areas V1 and V4 in the monkey.......................... 196 Part I: Functional asymmetries in hierarchical connections ....................................... 199 Part II: Dynamic causal modeling with canonical microcircuits ................................ 204 Part III: Dynamic causal modeling of cross spectral densities ................................... 213 Part IV: Empirical analysis ......................................................................................... 218 Chapter 7: Simultaneous recordings from the primary visual cortex and lateral geniculate nucleus reveal a cortical source for network gamma-band oscillations ......................... 236 Introduction ................................................................................................................. 237 Materials and Methods ................................................................................................ 238 Results ......................................................................................................................... 242 Discussion ................................................................................................................... 251 Chapter 8: Discussion ..................................................................................................... 255 Part I: Summary and implications of this dissertation ................................................ 256 Part II - Challenges to the DCTO hypothesis ............................................................. 263 Part III – Oscillations: causal or epiphenomenal? ...................................................... 275 References ....................................................................................................................... 290
v
Acknowledgements I would like to thank my parents for their continual, undivided support and love. This journey would not have been possible without you, thank you so much! Thank you also to my entire family – Madrinha Cecilia, Tio Ronaldo, primos Augusto e Aurelio, Tio Don e Tia Sandra, Tia Simone, Padrinho Hilton Filho, Tio Silvio, vovô Orestes e vovô Hilton, vovó Eneida e vovó Denise: I have felt continually supported by you all through this process by your kind words, your encouragement, and your love, and that is why I feel like we can all share this great moment. Thank you to my advisors and mentors, Marty, Ron, Karl, and Pascal: you have been very inspiring role models for me, and with your support and encouragement, I have begun to carve out a place for myself within the neuroscience community. I look forward to continuing to work together and collaborate on projects, and I am very grateful to have received your mentorship and support throughout my PhD. To my friends from the Bay Area and Davis, from my time in Nijmegen, from my time in London, and from my time in Frankfurt: thank you all! Your friendship has been a truly beautiful part of my life. Jacy, thank you, your support and friendship has been a constant with me throughout all the moves, all of the new pursuits, and all of the ups and downs – having a friend like you has make life more fun, rewarding, and easier to go through the tough times. From Davis, I’d like to thank all of my fellow students from my year at the UC Davis Neuroscience – Julie, Ben, Ling, Caitlin, Andrew, Sam, Andrea, and Chris. You guys made the first year really fun and interesting, and our bond really deepened when we each helped each other out through the tough classes and in
1
preparation for our qualifying exam –the bond that was formed from that is something I will carry with me for the rest of my life! From Nijmegen, I want to thank Rodrigo (yogui), Saskia, René, Ali, Ole, Cristiano, Kirsten, Tracy, Alex, Marijn, Peter, and Goedie for helping to make my time there such a blast! A really special thank you goes out to Jan-Mathijs, who really mentored and guided me and also helped push me to be the best I could be. Thanks also to Robert for your guidance and friendship, and for teaching me so much – those sessions that we had in your office were very inspiring and really got me thinking critically about methods. A big thank you to Conrado, who was a very inspiring colleague and friend at the Donders, and without whom, this dissertation would not have been possible! From London, Gabriella and Maria, it was such a special time that I will never forget – thanks for helping to make the gray city of London a fun and exciting place. I’d like to send out a special thanks to Markus and Oiwi who were amazing friends, at the exact time when I needed them the most. Goedie and Peter, it was really awesome to have connected with you both in two separate countries during my PhD! From the FIL, thank you to Vladimir, Dimitris, and Rosalyn for your mentorship and for teaching me about DCM. From Frankfurt, thank you to my sweetheart Katrin – the love, tenderness, and carinho that we have shared and that has grown between us during our time together in Frankfurt has been a very beautiful part of my life. Thank you for being there for me during the difficult times, and I have found it so natural to also be there for you when you have needed me. Together, we make each other strong.
2
From Frankfurt at the Ernst Strüngmann Institute, thank you to Giorgos, Georgios, Flor, Chris, Craig, Jarrod, Thomas, Andrea, Sylvia, Jianguang, Alina, Iris, Barbara, Ayelet, Julien, and Marieke: you guys have been an amazing group of colleagues and friends and I can only say thank you for all of the conversations that have helped to strengthen this body of work, and that has really made it into what it is. You guys have also been such dear friends, we have had so much fun together, and it has been an inspiring and exciting time both scientifically and socially to have shared with you. Julien, I really value the incredible friendship and scientific partnership we have developed over the last two years and I hope we continue to work together. From the Rheno, thanks to my rowing buddy Mickey, our sessions on the water in the double, with nothing to be heard except the blades going in the water and the boat fluidly gliding along have been centering, meditative, and connecting. Our friendship is something I know we will continue to share throughout life. Thank you for being there for me when I needed support. From Brazil and from the world, Daniel and Humberto, thank you for your friendship and I hope we continue to have exciting adventures together – and hopefully soon the G3 will become the G6. I look forward to continuing to share your friendship – it is a bond that I believe we will always share.
3
Chapter 1: Introduction
Abstract One of the great challenges in neuroscience is to understand how disparate brain regions become functionally integrated in the correct configuration to enable performance of distinct perceptual and cognitive tasks. This problem, known as the “dynamic coordination problem,” arises because different neocortical and subcortical areas are each specialized for different functions. Therefore, complex processing will require different functional areas to form transient neuronal coalitions to exchange the relevant information for meeting the computational demands of a given moment. Therefore, dynamic coordination entails grouping, routing, and gain control between neurons. What mechanisms might mediate these processes? Numerous authors have suggested that neuronal oscillations could be a mechanism to solve the dynamic coordination problem. In this Chapter, I will review the problem of dynamic coordination and the potential mechanisms that could solve it, focusing on the putative role of oscillations, and conclude by indicating how each of the Chapters of this dissertation contribute to answering this question.
4
Part I: Historical Background Any cognitive or perceptual act requires neuronal processing over a complex neuronal network, which will involve changing activity levels or computations at specific network nodes, but will also involve communication between nodes of the network. The classical single-cell physiology of Hubel and Wiesel, Mountcastle, and others (e.g., Hubel and Wiesel, 1962; Mountcastle, 1957), and more recently brain imaging through fMRI (e.g., Kanwisher et al., 1997), has led to great advances in our knowledge of which areas of the brain are specialized for which computations, and in some cases, the mechanisms behind simple neuronal computations have been at least partly elucidated (e.g., the formation of orientation tuning of V1 simple and complex cells, Hubel and Wiesel, 1962; Bullier and Henry, 1980; Alonso and Martinez, 1998; Alonso, 2002;). However, neuroscientific knowledge currently lags far behind on the question of functional integration, that is, how the outputs of multiple, parallel computations throughout the brain are integrated to guide flexible behavior. To have a complete account of brain function, it is necessary to understand both functional specialization – that is, which computations are happening where in the brain and how those computations are performed, as well as functional integration – how information is dynamically integrated and exchanged amongst the relevant nodes of the network. For most of the history of neuroscience (see Figure 1), due in part to the enormous success of pioneers such as Hubel and Wiesel and Mountcastle in employing single unit recordings to study the responses of single neurons in mostly primary sensory areas to simple sensory stimuli, the dominant theory of brain processing has focused on the role of 5
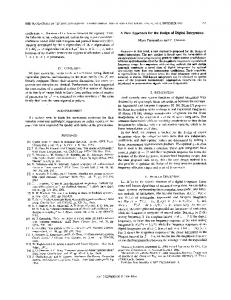
individual processing “modules.” These important advances have in large part been accomplished by research which has used a single electrode to study a single cell at a time. In the last twenty or so years, technological progress in recording and analysis methods (reviewed in Chapter 2), have made it possible to measure complex spatiotemporal activity patterns of many brain areas simultaneously. Interestingly, this methodological advance has co-occurred with (or has perhaps brought forth) the rise of the perspective within neuroscience that different perceptual and cognitive states are brought about by interactions within distributed, brain-wide networks. This represents a shifting in perspectives from functional segregation of specialized processing modules into the functional integration between those modules. This trend can be quantified using a PubMed search for the number of hits for the co-occurrence of the terms “functional integration” or “functional specializ(s)ation” (parenthesis indicates alternate British spelling preferred by some authors who originated the term, such as Semir Zeki) with “brain”, for specific year ranges. Interestingly, this search revealed that the term “functional integration” was the first of the two terms to be used, in a paper in 1958 by A. Imbriano on the autonomic neuroendocrine system (Imbriano, 1958). However, since that original paper and other publications also by Imbriano shortly thereafter, “functional specialization” has been dominant in every 5 year period, with the exception of the last 5 years (Figure 1). Therefore, in addition to studying how specific computations are performed, the focus of neuroscience is now shifting towards how those computations are integrated. To further underscore this point, in the last five years alone, 3,542 published papers used the terms “functional connectivity” or “effective connectivity”, terms that refer to methods that can be used to disclose the functional 6
integgration of innteracting brrain regionss (for a revieew of the fuunctional and effective connnectivity meethods and ttheir limitatiions, see Chhapter 2).
Figu ure 1. Numbber of PubM Med hits for the terms functional fu annd effective connectivitty since their introoduction intoo the neurosscientific litterature, in ffive year seaarch window ws.
To give a broad intrroduction too the problem m of functioonal integraation, and the w different bbrain areas are a dynamiccally coordinnated, this cchapter will be quesstion of how orgaanized accorrding to Davvid Marr’s ““levels of annalysis” fram mework (M Marr, 1982). According to M Marr’s frameework, in ordder to underrstand the fuunction of thhe visual brrain, must understtand it at thrree levels of or inndeed any complex funnction of the brain, we m anallysis, includding the: 7
Computational theory: What is the goal of the computation, why is it appropriate, and what is the logic of the strategy by which it is carried out? Representation and algorithm: How can this computational theory be implemented? In particular, what is the representation for the input and output, and what is the algorithm for the transformation? Hardware implementation: How can the representation and algorithm be realized physically? (Marr, 1982, p. 25)
Part II of this chapter will consider the computational level: which high-level computations is the brain performing? I will argue that at the core of many cognitive and perceptual processes is the need to adapt the computation depending on the context, and illustrate this point with a well-studied cognitive phenomenon, visual attention. Part III will consider the algorithmic/representational level, in which I will argue that oscillations may actually implement the underlying processes (grouping, routing, and gain control) that are required for performing context sensitive computations. Part IV will consider the physical level of hardware implementation, or in other words, the cellular and network mechanisms that generate oscillations. Finally, in Part V, I will summarize how each chapter of this thesis contributes to different aspects of the dynamic coordination question.
8
Part II: The Computational level First, let us consider the computational level, that is, what high-level computations does the brain need to perform? It is self-evident that the brain needs to perform context-sensitive processing – that is, an intelligent biological agent needs to combine his or her prior beliefs and knowledge about the world together with the immediate circumstances of the moment to generate behavioral outputs that are congruent with ongoing goals (survival, reproduction, happiness, etc.). This context-sensitive computation needs to occur at every moment in time, because sensory inputs are continuously changing. At the same time, the behavioral context in which those sensory inputs arise is also continuously changing. These two simple facts, that both internal and external states are in continual flux, mandate that successful biological systems must possess a cognitive system that is highly flexible and dynamic, capable of mediating a many-to-many mapping between sensory inputs and motor outputs. Furthermore, one very general consequence of context-sensitive computation within limited-processing systems (i.e., brains) is that not all sensory inputs can be processed at once. That is, the system needs to prioritize certain representations for enhanced processing. This is referred to as selective attention. Let us consider the case of visual selective attention as a paradigmatic example of context-sensitive computation. In the case of visual spatial selective attention, current models posit that the target of attention emerges out of computations that occur within prefrontal and parietal brain circuits, when attention is controlled endogenously (Hopfinger et al., 2000; Corbetta and Shulman, 2002). That is, these circuits perform the 9
computations that determine which object or objects in space will be the target of goaldirected attention. A popular metaphor in the attention literature is that attention is like a “spotlight”, illuminating some representations at the expense of others. For example, when driving a car, spatial attention very quickly jumps between being focused on the road, to various signs signaling speed limits and other traffic instructions, to the rear view and side mirrors. In this way, the frontoparietal attention control network continually adjusts where to place the “spotlight”. This control signal needs to be communicated to the visual system, so that it can actually inform visual processing. Indeed, the consequences of such top-down control have been extensively documented: numerous studies have shown that when an object is attended, neurons in visual cortex that represent the attended portion of visual space within their receptive field enhance their neuronal activity (e.g., firing rate) relative to other neurons, especially when multiple stimuli compete for access to the receptive field (Moran and Desimone, 1985; Desimone and Duncan, 1995; Luck et al., 1997; Buffalo et al., 2010). In some cases, attention can even act as a “gate”, essentially determining which stimuli are represented (Moran and Desimone, 1985). Specific visual representations within the visual system are therefore selected – at the expense of other representations – for enhanced processing. However, the mechanisms by which this control signal is implemented remain largely elusive. This is the core of the dynamic coordination problem, as it arises in the example of visual attention – how are dynamic links formed that allow top-down control to be exerted on specific neuronal populations, enhancing some links at the expense of others? This example illustrates the need for a cognitive system that very quickly decides which representations require enhanced processing (grouping), and that the results of 10
those computations are quickly conveyed to sensory processing centers (gain control), and that the enhanced processing of an attended representation is reflected in an appropriate motor action (routing). This type of processing implies a dynamicity of the functional links between the frontoparietal control networks and visual processing and motor networks, a dynamicity which could continually bring visual representations into and out of the attentional spotlight. Importantly, this example of visual attention is only one particular instantiation of a general problem that the brain faces – of establishing dynamic connections as a function of ongoing behavioral needs – in other words, of functionally integrating the activity of a disparate set of neurons. This functional integration will most likely depend on several fundamental operations, including grouping the relevant processing centers into a functional unit, routing information between them, and implementing enhanced gain control on selected representations.
Part IIIa: The algorithmic level: possible mechanisms for dynamic coordination The question of how this dynamic and flexible switching occurs brings us to David Marr’s “algorithmic/representational level” of analysis. Which algorithms has nature given the brain to enable it to function dynamically? In attempting to understand the possible answers to this question, it is useful to frame this problem with a metaphor. In physical systems with which we are familiar, the dynamic coordination problem finds some interesting parallels to the computer network of networks that is the internet. Both systems have a massive backbone of physical/anatomical connectivity, 11
essentially ensuring that just a few links are necessary to go from one point to any other within the system (http://en.wikipedia.org/wiki/Internet). Both systems are relatively robust to damage: because of massive interconnections and redundant paths between nodes, if a single computer or neuron fails, it would not affect the performance of the system, because there are many possible routes for information to flow. In the internet, in order for information to be effectively transmitted between computers, a communication protocol is required. The internet makes extensive use of TCP/IP as a communication protocol, ensuring that for each data packet that is sent, both the sender and receiver IP address are known, and also the relationship of one packet to the rest is defined, so that the receiver can re-assemble multiple packets and re-construct the original message when all packets have arrived. Furthermore, another interesting parallel between brains and the internet is that neither system has a single controller – in the internet, no single server decides how information will travel through the network nor who will communicate with whom at any particular point in time. Instead, the communication protocols allow multiple pairs of senders and receivers to coordinate transmission directly. These features of the internet allow information transmission to be highly dynamic (any two nodes can talk at any time), efficient and parallelized (no central coordinator), and robust to damage (many redundant paths). Of course, the metaphor between computers and the brain is not perfect, and such metaphors need to be interpreted with caution. Having said that, the metaphor helps to make clear that without a communication protocol, information flow within a complex network breaks down. This intuition likely applies to any complex network, which likely includes the brain: without a communication protocol, neurons would likely not be able 12
to exchange information rapidly and dynamically. In light of this metaphor, the dynamic coordination problem can be re-cast: what is the communication protocol of the brain, and which mechanisms might realize it? Such mechanisms must fulfill at least three basic criteria: (i), they must allow the brain to be flexible and dynamic – that is, the mechanism must be able to dynamically group different members and route information between them. In addition, it may be the case that multiple spatially-distributed populations would need to be simultaneously coordinated. (ii), these mechanisms must enable these links to be established and eliminated within the time scale at which cognition operates, within tens to hundreds of milliseconds (e.g., Busse et al., 2008). (iii), these mechanisms need to implement gain control, such that some populations are enhanced relative to others, resulting in enhanced routing between the relevant (that is, grouped) members. These grouping, routing, and gain control operations likely occur between multiple, spatially distributed neuronal circuits. Such dynamic coordination between distributed neurons would constitute what Donald Hebb called a neuronal assembly, by which he meant a collection of distributed neurons that cooperate to perform a particular behavior (Hebb, 1949). Note that an astronomical number of potential assemblies are possible at any moment due to the extensive distribution of anatomical connections and neurons that comprise the neocortex (Felleman and Van Essen, 1991). Therefore, the problem of how to establish the correct assembly (grouping), and to transfer information effectively between assembly members (routing) – is critical. Naively, one might say that there is no problem – spiking activity from neurons in one area travels through their axons to another area, causing depolarization of the target 13
neurons, which can then perform computations on their inputs within specialized microcircuits, and forward the outputs of those computations to the next area. In this way, all neurons that are anatomically connected within a subnetwork would form an assembly by virtue of becoming relatively depolarized compared to other neurons that are not in the assembly. By being closer to firing threshold, the assembly neurons would be more likely to exchange information. However, in this simple model, a problem emerges: how is the necessary selectivity of functional links (dynamic grouping) implemented? Implementing assembly selection with a rate code First, let us consider how dynamic coordination could be implemented between two simple networks using a rate code. Consider the simple network depicted in Figure 2a. Two subnetworks (network 1 and network 2) have interconnections within themselves, and connect to each other via a “higher-order” neuron, “X”. Assuming a rate code, is it unclear how network 1 could be selected or prioritized over network 2, or viceversa, because neuron X has equal connectivity to both networks. By increasing the mean activity (i.e., firing rate) of neuron X, due to its indiscriminate anatomical connectivity with other nodes, the activity of both networks would be non-specifically enhanced.
14
Figu ure 2. a, In this networkk topology, the excitability of Netw work 1 and 2 are controolled by a higher-ordder neuron X X, but due too its lack of specific anaatomical connnectivity, tthis topoology cannoot implemennt dynamic ccoordinationn. b, Networrk topology excitabilityy is conttrolled by tw wo higher-orrder neuronns, X and Y, which, duee to their moore specific anattomical connnectivity, caan implemennt dynamic coordinatioon. One opttion for a spiking model to overcom me this probblem and im mplement dyynamic coorrdination off the two nettworks is to have multipple higher-oorder neuronns, that eachh posssess a more specific anaatomical connnectivity, aas depicted in Figure 2bb. Competittive interractions betw ween neuroons X and Y could cause activity inn one of the two neuronns to dom minate the otther, which w would decidde which neetwork is sellected, as thhe winning nneuron wouuld cause ennhanced exciitability in oone of the tw wo networkss. In this moodel, the “com mmunication protocol” is implemeented as an eenhanced firring rate witthin the seleected 15
network, leading to enhanced excitability and therefore sensitivity of each of the neurons within the selected network to its inputs. Network selection is implemented through a separate set of higher-order neurons, with specific anatomical connections to the network for which it selects. At first glance, one disadvantage of this system is that it might require as many deciding neurons as there are possible decisions, because the decision is implemented via a specific connectivity pattern between the decider neuron and the network to which it connects. Obviously such a solution based on “grandmother” decision cells would not be viable for the brain, because the possible number of assemblies/decisions is larger than the number of available neurons. One possible solution to this problem is that many higher-order neurons could each connect to overlapping networks, and the necessary assembly could be selected by a coalition of many higher-order neurons. Indeed, there is evidence to suggest that in the prefrontal cortex, some neurons are broadly tuned and respond to a complex conjunction of features and task properties (Rigotti et al., 2013). By co-activating many such broadly tuned neurons, it is feasible that many arbitrary networks could be selected. Other options for dynamic coordination within a rate coding model are possible – for example, the neuronal code could be conveyed in two parts, in analogy to the internet – one part of a neural message would contain meta-information (a “header”) such as its source and destination, the size of the message, and its importance, and the second part would contain the content of the message itself. Alternatively, the communication protocol may not be explicitly encoded through a neuronal signal, but instead be implemented implicitly through the microarchitecture of connections – i.e., a particular 16
input would synapse on the dendritic arbor of a receiving cell, and in combination with multiple synaptic inputs from multiple sending areas, could implement a priority code, or signal the source of the message. Implementing assembly selection with oscillations An alternative, but not mutually exclusive proposal, is that the brain uses a separate mechanism for its “communication protocol”, distinct from the mean spike rate of any given neuron. This proposal states that neuronal oscillations could be a mechanism to solve the dynamic coordination problem (Gray et al., 1989; Varela et al., 2001; Fries, 2009; Buzsáki, 2010; Engel et al., 2010; Siegel et al., 2012). A neuronal oscillation, in essence, is a fluctuation in the excitability of a neuronal population that has a particular period length, and that repeats at least once (see Part IV for a discussion of the biophysical mechanisms that generate oscillations). The basis for these proposals is that neuronal oscillations can bring together disparate neuronal populations into transient synchrony, potentiating the links that engage in oscillatory synchronization. These proposals envision that spiking activity could more effectively propagate between areas that become engaged in synchronous oscillations (Fries, 2005, see Part IV for additional mechanistic details). In principle this mechanism could be highly flexible, because the properties of oscillations like their local phase relative to spikes, their amplitude, and their inter-areal phase alignment are not fixed properties, but dynamically change depending on many factors, including behavioral context (see Part IIIb for a review). All of these properties could contribute to dynamic coordination between neurons. Finally, because oscillations can occur at numerous frequencies, from under 1 Hz to several hundred Hz (Buzsáki and 17
Draguhn, 2004), it could also be a mechanism to enable numerous neuronal assemblies to be coactive, each with a separate time-scale of communication. In addition, there is a “many to one” relationship between the various oscillatory states that can be expressed by a particular network of fixed connectivity, meaning that many oscillatory states can be established by the self-generated dynamics within a given network (Battaglia et al., 2012). This generates an interesting possibility, that the ongoing, self-generated dynamics of the brain generate oscillations, which also assume a causal role in the system – the modulation of effective connectivity (the communication protocol). This would imply that the ongoing dynamics of the system would actually selfregulate the patterns of effective connectivity expressed at any given moment, acting as a form of “downward causality” (Thompson and Varela, 2001, see Chapter 8 for an indepth discussion). The conceptual advantages of dynamically coordinating assemblies with oscillations are depicted in Figure 3 in a toy network similar to the one considered previously. In network state 1 (Figure 3a), nodes A, B, and C, corresponding to network 1 (in blue) engage in oscillatory synchronization at frequency 1. Assuming that this enhanced synchrony causes an increase in the effectiveness of the connections between the network nodes that oscillate, then the connections between nodes A, B, and C would be enhanced relative to other connections (this is depicted in the figure by an enhanced thickness between the connections with enhanced connectivity and thin, dashed lines between weakened connections). In state 2 (Figure 3b), nodes A, B, and C no longer engage in oscillatory synchronization, but nodes D, E, and F (forming network 2, in red) do synchronize, this time at a higher frequency (frequency 2). Again, this enhanced 18
oscillatory coupling between nodes D, E, and F render the connections between these nodes more effective, leading to the selection of the red network over the blue network. This implicitly resolves one of the limitations of the previous example (Figure 2) that implemented dynamic coordination using only spikes, the problem of how to implement the selection of a specific network. Whereas previously, “higher-order neurons” were necessary to implement the required adjustment in gain between the two networks, by employing oscillations, the intrinsic dynamics of the system could enhance communication amongst a specific set of connections. Therefore, the higher-order neurons are no longer necessary – instead, what is necessary is that oscillatory synchronization is established within the relevant networks. Note that this doesn’t perfectly solve the problem, because now the dynamical pattern of oscillations needs to be explained – instead, the problem is shifted from the higher-order neurons to the oscillations.
19
Figu ure 3. a-d, E Examples off different ooscillatory sttates that coould supportt dynamic coorrdination assuming fixeed anatomiccal connectivvity betweenn the nodes and no diffeerence in thee mean spikke rate of diffferent netw works. In theese examplees, dynamic coorrdination is achieved thhrough oscillatory synchhronization of particulaar network nodes n at a particular fr frequency. N Note that muultiple frequuencies can co-exist, c as in subpanells c and d.
This posssibility, thaat the self-geenerated osccillatory dynnamics of thhe system actuually implem ment the seleection of a particular p neetwork, leadds to some oother advanttages: one is that multtiple networrks (e.g., funnctional asseemblies) at ddifferent freequencies caan be works operate at differennt co-aactive, as deepicted in the Figure 3c.. Because thhe two netw freqquencies, noddes A-C forrm network 1 and interaact at frequeency 1, whille simuultaneously,, nodes D-F F form netwoork 2 and innteract at freequency 2, with w little crrosstalk between thee networks, because theey are segreegated in thee frequency domain. 20
Furthermore, there is no longer the need to create the fixed, arbitrary partitions of nodes A-C into network 1 and nodes D-F into network 2. Instead, the intrinsically generated network dynamics determine which nodes participate in which networks, and therefore any arbitrary linkage of the nodes is possible, as long as a polysynaptic connection between the nodes exists. One possibility of such an arbitrary linkage is depicted in Figure 3d, in which nodes A, D, and F participate in one network at frequency 1, and nodes C, D, and F participate in another network at frequency 2. Note that many more arbitrarily complex networks are possible. Furthermore, an additional consequence of this scheme is that a single node can simultaneously participate in multiple networks – in this example (Figure 3d), nodes D and F participate in both networks, because they engage in oscillatory coupling in both frequency regimes. In summary, a communication protocol governed by oscillatory interactions would enable a great deal of flexibility in terms of which functional links could be established (grouping), and therefore how information could flow through the system at a given moment (routing). This grouping and routing of certain assemblies and not others would imply enhanced gain control of the selected assemblies. Importantly, this is accomplished without the need for a specific control center – instead, the intrinsically-generated dynamics, and the consequences for neuronal communication that they entail, are themselves the control signal. To give an example, a cognitive process like attention could exploit these oscillations by generating synchronization between the network nodes that represent the stimulus in the “spotlight” of attention (for a detailed discussion of attention and oscillations, see the following section, Part IIIb).
21
These considerations imply that oscillations could provide an elegant mechanism for achieving dynamic coordination – a mechanism that is internally generated and that can modulate which neuronal links are relevant as a function of the ongoing dynamics of that very same system. If this were true, then distinct patterns of oscillatory synchronization should be readily observed under various experimental conditions and cognitive/perceptual tasks. In this regard, there is an abundance of evidence to support an active role for oscillations in dynamic coordination, as it is by no means an exaggeration to state that virtually every cognitive/perceptual task has been associated with the presence and modulation of oscillations. To give a few examples: visual processing and feature binding in early sensory processing stages (Gray et al., 1989), visual attention (Fries et al., 2001), top-down and bottom-up attention (Buschman and Miller, 2007a), visual working memory (Tallon-Baudry et al., 2001, 2004), episodic memory (Fujisawa and Buzsáki, 2011; Watrous et al., 2013), cognitive control and its impairment in schizophrenia (Cho et al., 2006), spatial coordination in reach and saccade tasks (Dean et al., 2012), sensorimotor transformations (Buchholz et al., 2013), somatosensory processing and decision making (Haegens et al., 2011a), visual sensory evidence accumulation (Donner et al., 2007), visual awareness (Gaillard et al., 2009), and language processing (Hagoort et al., 2004). In the next section of this chapter, I will review some of these experimental results in more detail to characterize the presence, robustness, and modulation of inter-areal oscillatory dynamics under various experimental conditions – patterns which are likely to reveal whether oscillations are a viable mechanism for dynamic coordination.
22
Part IIIb: The algorithmic level: review of the evidence that oscillations subserve dynamic coordination Oscillations could subserve dynamic coordination in at least three different ways (Figure 4): one, different cortical areas (in this example, network nodes A-F each representing a different brain region or neuronal population) could form a network through oscillatory interactions at a specific frequency, as depicted by the red lines in Figure 4a. The effective strength of the connections between theses network nodes could be enhanced by increasing oscillatory synchronization. This is depicted as an increase in network coupling in task 1 (Figure 4a) compared to task 2 (Figure 4b), symbolized by the line thickness between network nodes. The hypothetical coherence spectrum (the coherence spectrum quantifies the strength of oscillatory interactions, see Chapter 2 for methodological details) between nodes A and B is depicted in Figure 4c and shows a doubling of coherence in task 1 compared to 2. This enhanced oscillatory coupling would implement dynamic coordination by allowing for higher information throughput between nodes A-E (again, see Part IV for mechanisms). An alternative mechanism is that the phase at which coupling occurs could be modulated (not depicted). The second option is that the modulation occurs through a change in the network nodes that participate in oscillatory interactions (Figure 4 d-f). Note that in Figure 4f, the coherence spectrum between A and B is peaked in task 1 but flat in task 2, indicating a lack of oscillatory interaction. A third option is that through frequency multiplexing, different tasks could recruit the required constellation of nodes by interactions at different frequencies (Figure 4 g-i). In this way, the same network might perform 23
different tasks depending on its frequency. This would result in a shift in the frequencies which show coherence between the two tasks (Figure 4i). Note that these three options are not mutually exclusive and indeed could be combined to form complex, dynamic spatial-frequency coupling patterns to implement different network configurations. In this way, each computation underlying a given task might have its own “spectral fingerprint” (Siegel et al., 2012). The Dynamic Coordination Through Oscillations (DCTO) hypothesis proposes that oscillations serve to mechanistically implement dynamic coordination, but it does not specify the exact oscillatory mechanism. Therefore, the DCTO hypothesis is best placed at the level considered in this section, the representational and algorithmic level, because the DCTO hypothesis suggests that oscillations implement dynamic grouping, routing, and gain control. If this is correct, it will rely on underlying biophysical mechanisms, which are considered in Part IV of this chapter. This implies that the DCTO hypothesis is distinct from another prominent hypothesis in the oscillations field, the Communication Through Coherence (CTC) hypothesis (Fries, 2005). The CTC hypothesis states that oscillatory coherence between two neuronal groups will mechanistically affect the communication between those groups. Within the DCTO framework, multiple algorithms which use oscillations are possible to implement dynamic grouping, routing, and gain control, of which CTC is considered to be one possible mechanism. The next section will now consider each of the oscillatory mechanisms considered in Figure 4 as possible mechanisms for dynamic coordination.
24
Figu ure 4. a-c, D Dynamic coordination tthrough chaanges in the strength of oscillatory couppling. The liines in subppanels a andd b indicate the strengthh and the preesence of oscillatory syncchronizationn between thhose nodes. A hypothetical coherennce spectrum m betw ween networrk nodes A aand B is shoown in subppanel c. d-f, Dynamic coordinationn through changees in the spattial pattern oof coupling. g-i, Dynam mic coordinaation througgh freqquency multiiplexing.
F 4 There iss evidence thhat each of tthe three meechanisms ddepicted in Figure conttribute to dyynamic coorrdination. Foor example, Fries and ccolleagues shhowed that selecctive attentiion stronglyy enhances loocal gammaa-band (30-100 Hz) synnchronizatioon betw ween spikes and LFPs inn area V4 (F Fries et al., 2001). Thiss enhanced ggamma spikkefieldd coherence was also suubsequentlyy shown to ppredict the annimal’s reacction time too an unprredictable chhange in thee attended sstimulus (W Womelsdorf eet al., 2005). Interestinggly, 25
the spike rate of those same units was not predictive of reaction time. There are at least two possible interpretations of this result: first, neurons in V4 synchronized their firing rate according to the local gamma rhythm so that they could be more effective in driving neurons in a downstream area that would act as a coincidence detector of gammaresonant incoming spikes. Second, that V4 and other areas of the visual cortex, or perhaps V4 and areas of the frontoparietal attention control network, were engaged in oscillatory coupling at gamma frequency. Subsequent papers have demonstrated strong evidence for the more interesting interpretation from the point of view of dynamic coordination, that the enhanced oscillatory coupling within V4 was part of a larger network. Gregoriou and colleagues (2009) simultaneously recorded LFPs and single units from areas FEF and V4 of the macaque monkey as they performed a very similar visual attention task (Gregoriou et al., 2009). Using this recording setup, the authors observed long-range gamma-band coherence between the two structures, and that this coherence was strongly enhanced by attention. Furthermore, this gamma-band coherence was present only between FEF and V4 sites with overlapping receptive fields. Importantly, the increase in inter-areal gamma-band coherence was observed not only between the LFPs of the two areas, but was also between spikes in V4 and LFPs in the FEF and between spikes in the FEF and LFPs in V4. This indicates that spikes from each area were mutually entraining (or entrained by) both the local and distant field fluctuations. The authors also examined information flow between the areas, and found that just prior to the animal’s attentional deployment to one of three gratings, information first flowed from the FEF to V4, consistent with a role for the FEF in directing spatial attention. A few milliseconds later, 26
the dominant pattern of information flow switched, with V4 driving FEF. These data support the interpretation that the FEF to V4 gamma interaction shortly after the cue may have been instructing local populations in V4 to enhance processing at the attended location, whereas the V4 to FEF gamma interaction after attention had been allocated maintained the sensory representation within higher areas. More recently, experimental results from two separate laboratories have converged on the finding that selective attention also effectively gates inter-areal gammaband synchronization between V1 and V4 LFPs (Bosman et al., 2012; Grothe et al., 2012), and between V4 spikes and LFPs in V1 (Grothe et al., 2012). These studies give evidence for the second mechanism (Figure 4 d-f), whereby different tasks use different networks, reflecting in an “all or nothing” gating of oscillatory coupling. In addition, these studies demonstrate the remarkable selectivity of inter-areal gamma-band synchronization, by showing that when two separate neural populations are each activated in V1 by separate stimuli, they are each capable of engaging in gamma-band synchronization with neurons in V4, which have larger receptive fields that can therefore be equally activated by either stimulus. However, selective attention to one of the two stimuli essentially decides (similar to an “ON/OFF” switch) which V1 subpopulation gamma-band synchronizes to V4. Together, these results support the proposal that a large-scale, dynamic network was established through gamma-band synchronization between nodes V1, V4, and FEF (and perhaps others that remain unmeasured), and that the strength of oscillatory coupling between the nodes of this network actually implemented the selection/prioritization of the attended stimulus. Importantly, the enhanced coupling reported in these studies was not a 27
weak modulation – instead, in the study measuring interactions between V4 and FEF, there was a doubling in the strength of interaction (Gregoriou et al., 2009), and in the studies measuring interactions between V1 and V4 (Grothe et al., 2012, Bosman et al., 2012) in a slightly different task in which attention had to work on a finer spatial scale, selective attention effectively “gated” the gamma-band inter-areal interactions and determined which networks were selected. This point is made even more clear by a subsequent study by Rotermund and colleagues, who report that not only the strength of the V1-V4 oscillatory coupling is enhanced by attention, but also the phase at which the coupling occurs (Rotermund et al., 2013). The authors used various features of the gamma-band response, including local signal power, inter-areal coupling strength, and inter-areal coupling phase, to train pattern classifiers to detect which visual stimulus had been cued for attention on a trial-by-trial basis. Impressively, the authors were able to make essentially perfect predictions of which stimulus was attended. To further investigate large-scale patterns of oscillatory phase and their relationship to different tasks, Canolty and colleagues studied the coherent patterns of neuronal spike times relative to the field potential recorded in several areas of the sensory-motor cortex of monkeys (Canolty et al., 2010). The monkeys performed two distinct tasks, which both required them to select targets on a computer display. The selection could be controlled directly by the monkey’s use of a joystick or through a brain computer interface trained on the firing rates of a population of neurons that were tuned to different movement features. The authors found that the neurons spiked at a preferred beta-band phase (Canolty et al., 2010). Across the population, the firing rate of a majority of single neurons (71%) was modulated relative to inter-areal LFP-LFP phase 28
relationships. This enabled the authors to construct a model that predicted the single neuron firing rate from the LFPs alone. Although there was a range in the exact predictions that were possible, the patterns of LFP-LFP phase coupling accounted for more than 90% of the variance in the spike rate of some neurons (Canolty et al., 2010). Furthermore, the large-scale LFP-LFP phase patterns that predicted spike rates were stable within a task, but assumed a different pattern when the monkey switched from the manual joystick control task to the brain control task, and then again remained stable (Canolty et al., 2012). These studies suggest that different oscillatory coupling patterns could in principle select different functional networks that are required to perform different tasks. In further support of this possibility, a separate study found that neurons in the prefrontal cortex of monkeys establish beta-band coherence to the LFP in a task-specific manner – in this study, monkeys were trained to perform two separate rules, and different neuronal ensembles established beta-band coherence depending on the rule to be performed (Buschman et al., 2012). These studies suggest that the particular oscillatory phase at which a neuron fires could be mechanistically used to determine its participation in a functional neuronal ensemble. In addition, it implies that the LFP phase at which a neuron fires must be read out by downstream neurons that must be equipped with mechanisms to interpret the LFP phase-modulated spikes. Indeed, modeling studies suggest that networks of neurons can be trained to recognize phase-modulated firing rate patterns (Masquelier et al., 2009). Next, I will review the evidence that oscillations achieve dynamic coordination by modulating the frequencies at which the relevant network operates. This possibility 29
entails that a functional network would operate at one frequency during task 1, and at a different frequency to perform task 2 (Figure 4 g-i). In support of this possibility, Watrous and colleagues found that in electrocorticography recordings in human epileptic subjects, that a hippocampal – parietal – prefrontal network exhibited low frequency (110 Hz) oscillatory coupling during episodic memory retrieval (Watrous et al., 2013). Interestingly, whereas enhanced coupling strength at a frequency centered at 8 Hz was able to distinguish correct versus incorrect trials, the frequency at which the inter-regional coupling occurred was modulated by the specific memory task that was performed. When patients were asked to recall the spatial details of a recently-experienced virtual environment, the network displayed coupling at 1-4 Hz, and when patients recalled the temporal details of the virtual environment, oscillatory coupling amongst the temporoparieto-prefrontal network remained, but was most prominent at a higher frequency of 710 Hz. Another study by Buschman and Miller (2007) found that inter-areal coherence between parietal areas LIP and prefrontal areas FEF and dlPFC was relatively enhanced at beta frequencies during top-down attention search compared to bottom-up attention (“pop-out”), and at the same time relatively enhanced at gamma frequencies during topdown attention search (Buschman and Miller, 2007a). These studies suggest that the specific frequencies that mediate inter-areal communication may change depending on task demands. Is there any evidence that oscillations are actually necessary for dynamic coordination? Evidence that is consistent with this notion comes from a rodent study, where Fujisawa and Buzsaki showed that goal-predicting PFC neurons are more strongly phase-locked to hippocampal theta than non-goal-predicting neurons, indicating that the 30
neurons involved in the relevant assembly for task processing were the neurons that engaged in network-wide theta-band oscillations (Fujisawa and Buzsáki, 2011). Furthermore, in monkey parietal cortex, Dean et al. (2012) show that only cells which are locked to the ongoing beta-band oscillation are able to predict the reaction time of monkeys performing a coordinated saccade and reach task. In contrast, neurons in area LIP which did not modulate their firing rate according to the phase of ongoing beta oscillation did not predict reaction time performance significantly above chance levels. Furthermore, as previously noted, Womelsdorf and Fries (2005) showed that gammaband spike-field synchronization of V4 neurons, but not the mean spike rate of the same V4 neurons, predicted reaction time to an unpredictable change in the attended stimulus. These studies provide some compelling evidence that in order for a neuron to effectively become part of the relevant neuronal coalition, it needs to engage in oscillatory coupling with the larger network. However, the evidence remains correlative in nature, because it is based on establishing statistical relationships between neuronal signals as a function of task and behavior. Together, the studies reviewed thus far establish the strongest correlative evidence to date for an intimate relationship between oscillatory patterns of coupling within a large-scale network and the dynamic coordination of that network. Furthermore, they establish evidence for each of the three possible mechanisms depicted in Figure 4 – that oscillations could change the inter-areal strength of coupling or the inter-areal phase at which coupling occurs (Figure 4 a-c), that the presence or absence of coupling would essentially select or prioritize one network over another (Figure 4 d-f), and that different tasks could involve distinct frequencies (Figure 4 g-i). 31
Causal evidence Thus far, it has been a largely unmet challenge in the field to show that neuronal oscillations are causally involved in linking cell assemblies necessary to accomplish a given task. Such evidence would require interventions in the relevant networks, in order to enhance or disrupt oscillatory interactions without changing other properties. Furthermore, it would be required to show that changing the oscillatory interactions in a specific way (of the various kinds that are possible, illustrated in Figure 4) would be necessary for task performance. So far, the most compelling causal evidence for this comes from several transcranial magnetic stimulation (TMS) studies in humans. Romei and colleagues (2011) studied whether repetitive, rhythmic TMS pulses to the parietal cortex in humans would affect performance on an attention task which required subjects to focus on local versus global stimulus properties in the presence of incongruent or congruent distractors (Romei et al., 2011). Romei et al. applied TMS stimulation to the parietal cortex at either theta or beta frequency, and this choice was motivated by a previous study that had linked activity at these frequencies to local and global visual stimulus processing (Smith et al., 2006). Interestingly, Romei et al. showed that under conditions involving salient distractor stimuli, parietal TMS stimulation at beta frequency enhanced processing of local stimulus features, and stimulation at theta frequency enhanced processing of global stimulus features. This dissociation between the frequency of stimulation and task-specific performance is strong evidence that specific oscillatory interactions are involved in specific tasks (Figure 4 g-i). In a similar approach, Chanes and colleagues applied TMS to the FEF of human subjects as they performed a difficult target discrimination task (Chanes et al., 2012). 32
Building on the results of an earlier study (Buschman and Miller 2007), the authors hypothesized that different frequencies would mediate different behaviors within the PFC. Therefore, the authors applied three TMS stimulation protocols as subjects performed the task: one protocol delivered TMS pulses at gamma frequency, the second protocol delivered them at beta frequency, and a control condition delivered the same number of pulses but with random timing. Strikingly, the authors found that while stimulating at beta frequencies improved the discrimination performance (measured by d prime), stimulating at gamma frequencies lowered the response criterion (Chanes et al., 2012). These results are in line with an interpretation that beta frequencies contribute to top-down signaling, while gamma frequencies signal the bottom-up presence of a visual stimulus. Furthermore, no behavioral modulations were found as a result of nonfrequency specific TMS, suggesting that the specific frequencies had specific mechanistic roles in different aspects of the task. While these studies make a compelling case that oscillations are causally involved in mediating task-specific performance, future studies will be required to actually impose a large-scale inter-areal oscillatory pattern and determine the subsequent effects on behavior.
Part IV: The physical level This now brings us to the most concrete level of David Marr’s levels of analysis, the “physical level”. The critical question is, given that oscillations are present and modulated under various behavioral and perceptual contexts, which physiological
33
properties of neuronal circuits generate oscillations, and how could oscillations modulate synaptic transmission between neurons? According to the conceptualization of this question by multiple authors (Salinas and Sejnowski, 2001; Fries, 2005; Haider and McCormick, 2009), the critical mechanistic question that must be answered is which synaptic and cellular mechanisms could perform "dynamic gain modulation", in other words, which local or network mechanisms could increase or decrease the probability of a particular cell or group of cells to fire given the same input. Cells with relatively enhanced gain (sensitivity to input) relative to others could form functional cell assemblies, more effectively influencing one another compared to other groups that have reduced gain, thereby achieving dynamic coordination. Haider and McCormick (2009) propose that the most likely mechanism to achieve dynamic gain modulation is an increase or a decrease in the average membrane potential of the cell. This is due to the nonlinear relationship between input (depolarization) and output (spike rate), which ensures that depending on a cell’s membrane potential, a depolarization of just 1 or 2 mV can have a large impact on its spiking probability, especially if the cell is close to its firing threshold (Haider and McCormick, 2009). One possibility is that network oscillations represent fluctuations in the subthreshold membrane potential, which would continuously bring the cell or group of cells closer to and further from its spike threshold. Indeed, there is evidence to suggest that intracellular potentials are coupled to the extracellular field (Fröhlich and McCormick, 2010). Therefore, by modulating the intracellular membrane potentials of a group of neurons, oscillations could bring a neuronal population closer to and further away from its firing threshold. If oscillations are bringing the membrane potentials of 34
disparate cell groups closer to and further away from firing threshold in unison, then the respective depolarized phases would provide “windows for communication” (Fries, 2005) and could thereby serve as a mechanism for “dynamic gain modulation”. Which cellular mechanisms actually generate these oscillatory periods of enhanced gain? Although the cellular mechanisms that generate oscillations are not fully elucidated, there is a relative consensus (Kopell et al., 2000; Tiesinga and Sejnowski, 2009; Buzsáki and Wang, 2012) about what kinds of networks and network properties are needed to generate fast (>20 Hz, “gamma”) oscillations, and therefore I will focus the following section specific on this class of fast oscillations. The most basic model of a gamma oscillation is a single pool of inhibitory neurons with self-connections, and is called the Inhibitory Network Gamma (ING) model. When the pool receives sufficient drive, the network of inhibitory cells fires, and this causes the population to be relatively inhibited. This inhibition has a particular decay constant, which is relatively uniform over the population, and that implies that all the cells will recover from inhibition at about the same time – when they recover from inhibition, they fire synchronously, which again applies powerful inhibition onto the network, and the cycle starts anew (Buzsáki and Wang, 2012). Of course, neuronal networks are also comprised of excitatory cells, and the Pyramidal Inhibitory Network Gamma (PING) model was developed to explain how network oscillations arise from interactions between excitatory and inhibitory cells (Kopell et al., 2000; Whittington et al., 2000). In this model, two pools of neurons, an E (Excitatory) and I (Inhibitory) pool are reciprocally connected and also have recurrent self-connections. In these models, the I cells represent a specific class of interneurons, the fast-spiking basket cells, which have fast membrane time constants and resonance at 35
gamma frequency (Cardin et al., 2009). The E cells fire, which excites a population of I cells. The I cells fire a volley of spikes back onto the E cells, and because the I cells synapse onto many E cells, and form strong synaptic connections, they deliver inhibition onto many E cells at once. Like in the ING model, the I cells have a membrane time constant which determines the period length and therefore the rhythmicity of synchronous IPSPs arriving onto the E cells from the I cells. Aspects of both the ING and PING models have found experimental support. For example, Cardin et al. (2009) delivered optogenetic stimulation to either excitatory (alpha Cam Kinase II positive) cells or inhibitory (Parvalbumin positive) cells in rodents. The authors stimulated these cells with periodic laser pulses at various frequencies ranging from 10 to 200 Hz. Interestingly, whereas stimulation of the inhibitory cells at gamma frequencies caused an increase in gamma-band LFP power, stimulation of the excitatory cells at those same gamma frequencies did not. This indicates that the inhibitory cells have a special resonance in the gamma range, and may have a special role in initiating and sustaining the gamma oscillation. Further in vivo evidence for PING and ING models comes from a study by Vinck and colleagues (Vinck et al., in press).In this study, the authors sorted extracellularly-recorded single neurons from monkey area V4 into putative inhibitory and putative excitatory cells, and examined the spike-field coherence of these two cell classes during a visual attention task. Before visual stimulation was delivered, but after an attention cue, the putative inhibitory neurons gamma-band synchronized to the LFP but not the putative excitatory cells, forming an ING rhythm. After both the attention cue and the visual bottom-up stimulus were presented, both putative excitatory and inhibitory cells gamma-band synchronized to the LFP, with the putative excitatory 36
cells leading the inhibitory cells, precisely as predicted by the PING model. Interestingly, while both cell types showed gamma-band synchronization to the LFP, the putative interneurons locked more strongly, again in line with a special role of these cells in establishing and sustaining the rhythm. In both the ING and the PING models, the oscillatory power in the LFP can be taken as a rough index for synchronous IPSPs onto pyramidal cells (Buzsáki and Wang, 2012), and the phase of the oscillation is an index for the relative excitability of that network. Therefore, within a gamma cycle, neurons that participate in the gamma assembly will oscillate between relative depolarized and hyperpolarized phases, thereby modulating the gain of that population. Another element is needed for this local oscillation to be used as an effective communication mechanism – the local oscillation must enter into a phase alignment with the oscillation of a receiving group of neurons. This coherence between populations can be established by entrainment – e.g., the receiving group of neurons would receive spikes with a particular rhythmicity, and in turn this would help to stabilize and entrain the receiving population. Assuming two populations were both oscillating and entered into a stable phase relationship, this would imply that spikes from the sender population would arrive at the receiver population at a particular phase – this phase relative to the local oscillation ensures a relatively excited (depolarized) or non-excited (hyperpolarized) state. By this mechanism, an input would be rendered relatively effective or relatively ineffective simply by modulating the phase difference between the two populations that communicate (Fries, 2005). Recently, this proposal, that the spike transmission between two areas can be modulated as a function of oscillatory phase, has received experimental 37
support: Jia et al. recorded from neurons with overlapping receptive fields in both V1 and V2 of anesthetized monkeys, and delivered visual stimulation of varying size and orientation (Jia et al., 2013). Interestingly, the authors showed that the particular phase at which a spike occurred relative to the V1 gamma cycle modulated the probability of whether neurons in V2 followed with their own spikes. Although a role for dynamic gain modulation has been most strongly established for gamma oscillations, a similar mechanism could also work for other oscillation frequencies from theta to alpha to beta to gamma – whatever frequency was present to provide the temporal “windows of opportunity” could essentially work - what is important to modulate network functional connectivity is that the gain modulation within the target neural assembly is "happening together" (David McCormick, personal communication). Indeed, it is also possible that multiple windows of opportunity are working simultaneously, through nesting of faster oscillations within phases of slower oscillations (Canolty et al., 2006). Finally, other mechanisms also exist to enhance signal transmission through oscillations. For example, one particular information stream could be protected relative to others, similar to a radio. Modeling studies show that this could be implemented in a relatively simple network of excitatory (E) and inhibitory (I) cells: one study shows that gamma oscillations could be used to mediate stimulus selection amongst competing inputs (Börgers et al., 2008). Building on this, Akam and Kullmann (2010) show that a simple network of coupled E and I cells can implement a band-pass filter to essentially “read out” an incoming spike signal containing both an oscillatory and Poisson (randomly timed) component. This study supports the possibility that oscillations could be used as 38
the “communication protocol”, because simple spike networks can be configured to read out the oscillatory component of a spike train and ignore other components.
Part V: How this thesis contributes to answering the dynamic coordination problem As methodological challenges have been one of the key bottlenecks to hindering progress on the question of dynamic coordination through oscillations, in Chapter 2, I review the recording methods that can be used to study the dynamic coordination problem. Also, I review the functional and effective connectivity methods that are used in this thesis to analyze multi-channel data and detect the presence of oscillations and oscillatory coupling. Each method has distinct advantages and disadvantages, and I will exploit data simulations to make these apparent. In Chapter 3, I apply these methods to high-density, large-scale electrocorticography (ECoG) recordings from two macaque monkeys performing a visual spatial attention task. This method was able to detect two distinct large-scale oscillatory networks. One, which rhythmically synchronizes at beta frequency and couples frontal and parietal cortices, interacts with the visual cortex in the top-down direction, and is enhanced under directed spatial attention. The second network oscillates at gamma frequency and couples visual and dorsal parietal cortices, signals information in the bottom-up direction, and is also enhanced under directed spatial attention. These results confirm two of the core predictions of the dynamic coordination through oscillations
39
(DCTO) hypothesis: one, that oscillations structure large-scale networks, and two, that these large-scale oscillatory interactions are modulated by cognitive variables. In Chapter 4, I describe an analysis of inter-areal oscillatory interactions as a function of the underlying anatomical connectivity between areas. This analysis reveals that oscillatory interactions at beta and gamma rhythms map onto two canonical counterstreams of information flow that have been identified by an extensive body of anatomical work: bottom-up and top-down directions of anatomical connections. The analysis reveals that bottom-up signaling is most prominently carried by gamma-band oscillations, and top-down signaling is most prominently carried by beta-band signaling. Together, these patterns of oscillatory interaction can be used to build a visual cortical hierarchy based on functional data alone. This functional hierarchy is partly stable across different task periods, likely reflecting the stability of anatomical connections on this time-scale, but it is also partly dynamic, reflecting the intriguing possibility that an area’s hierarchical position might be dynamically adjusted according to task demands. Therefore, oscillatory interactions between brain areas likely reflect the circuit properties within and between those circuits. In Chapter 5, I review aspects of neocortical microcircuitry that are canonical (repeating in many areas), with the goal of understanding which kinds of neuronal circuits generated the oscillatory coupling patterns observed in Chapters 3 and 4. A canonical microcircuit model is proposed from this analysis and is compared to the theoretically-derived canonical circuit based on predictive coding theory. In Chapter 6, two critical aspects of the model are validated – one, the need for segregation of pyramidal cells into superficial and deep layers, which
40
give rise to feedforward and feedback outputs, respectively, and two, the need to functionally segregate oscillations in different layers. In Chapter 7, I examine whether the Dynamic Coordination Through Oscillations (DCTO) hypothesis could already operate at a subcortical level, in mediating the communication between the lateral geniculate nucleus of the thalamus (LGN) and the primary visual cortex (V1). This analysis reveals that faster gamma-frequency rhythms are likely generated in the cortex. However, there is oscillatory synchronization at alpha and beta frequencies between the LGN and V1, and these patterns of directed interactions follow the rule of “faster frequencies feedforward, slower frequencies feedback,” which may be an important aspect of cortical circuits to segregate synaptic inputs from outputs (as reviewed in Chapter 5). Finally, in Chapter 8 I discuss the findings of this thesis in relation to the DCTO hypothesis, present challenges and to the DCTO framework and potential solutions to these critiques, and end with some more general considerations and suggestions for future research.
41
Chapter 2: Methods
Abstract The dynamic coordination through oscillations (DCTO) hypothesis reviewed in Chapter 1, while intriguing, has been difficult to study due to methodological limitations of conventional neuroscience methods. The challenges are great, and they occur at many levels, including recording methodology for measuring multiarea data, the acquisition and storage of high-bandwidth data, the computational resources necessary for data analysis, and the analysis, modeling, and interpretation of such data once it has been acquired. This chapter is organized in three parts. Part I will discuss measurement methodologies that can be used to study the DCTO hypothesis, and motivate the use of large-scale, high-density electrocorticography. Part II and III will review the analysis methods used in this dissertation to interpret this kind of data, which are delineated, here and elsewhere, into: functional and effective connectivity. In Part II, I review methods for functional connectivity, including coherence, phase synchronization, phase-slope index, and Granger causality. In Part III, I rehearse the fundamental concepts behind effective connectivity, and review a prominent method that assesses it, dynamic causal modeling (DCM). These methods each have their pros and cons, which I discuss and highlight using simulations. I also highlight how the analyses of this dissertation have dealt with the methodological concerns that arise in the study of the DCTO hypothesis. 42
Part I: The recording methodology problem To address the hypothesis that oscillations are a solution to the dynamic coordination problem, one must be able to record from multiple, distributed neuronal populations simultaneously, with both high spatial as well as temporal resolution. This has proven to be a far from trivial task. The temporal resolution, spatial resolution, and typical coverage of some of the most commonly used neuroscience methods are graphically displayed in Figure 1. Conventional microelectrode recordings offer good spatial and temporal resolution, but traditional approaches have sampled from only one or a few areas (however, more modern implementations of this technology are able to achieve a much greater coverage, e.g., Salazar et al., 2012). Functional magnetic resonance imaging offers full-brain coverage, and modern high-resolution techniques can achieve a spatial resolution down to the level of a macrocolumn, and can resolve layerspecific hemodynamic responses (Koopmans et al., 2010). However, fMRI sits low on the temporal resolution axis because the hemodynamic BOLD response implements a low-pass filter that obscures fast temporal dynamics. Moreover, the precise nature of the mapping between neuronal activity and the hemodynamic BOLD response is not fully understood (Logothetis et al., 2001). Non-invasive EEG and MEG offer good temporal resolution and coverage, but due to the spatial smearing of electromagnetic signals as they volume conduct from source to sensor, offer limited spatial resolution (Nolte et al., 2004). Therefore, a good trade-off between excellent spatial and temporal resolution, and relatively good coverage is high-density, large-scale electrocorticography (ECoG). These recordings are often 43
perfformed usingg electrode grids whichh are typicallly semi-chrronically im mplanted in hhuman patieents, for epiilepsy seizurre localizatiion.
Figu ure 1. Spatial resolutionn, temporal resolution, and coveragge of typicaal methods uused in cognnitive and syystems neurroscience inn comparisonn to large-sccale, high-ddensity ECoG G in monnkeys. Abbrreviations: ffMRI: functtional Magnnetic Resonaance Imaginng, ECoG: electrocorticogrraphy, EEG/MEG: elecctroencephallography annd magnetoeencephalogrraphy
44
These recordings can also be performed in animal subjects, where electrode coverage and density can be determined from experimental and not clinical considerations. ECoG recordings can be performed above the dura (epidural) or below the dura (subdural), and offer approximately an order of magnitude better spatial resolution (1-3 mm) compared to noninvasive EEG/MEG, depending on electrode size and inter-electrode spacing. At the same time, the recordings also provide good coverage, with current technology able to cover between half to approximately all of the superficially exposed cortex on one hemisphere (Rubehn et al., 2009; Shimoda et al., 2012). Therefore, these recordings offer the promise of being able to address the DCTO hypothesis, by enabling dynamic synchronization networks to be imaged throughout a hemisphere. The downside of the technique is that currently, it is capable of recording only local field potential (LFP) activity, but not spiking activity. Therefore, Chapters 3, 4, and 6 of this thesis will be based on data acquired with high-density, large-scale ECoG to address different aspects of the dynamic coordination problem as it pertains to large-scale brain networks. Of course, many questions can be answered with much more targeted recordings and therefore in Chapter 7, recordings from only two areas (LGN and V1) are used to test the specific hypothesis of whether corticothalamic interactions also display oscillatory synchronization. The electrocorticography recordings used in the analyses of this thesis were measured in two monkeys that were implanted with large-scale, high-density ECoG grids (Rubehn et al., 2009). 252 channels (1mm in diameter, 2-3mm inter-electrode spacing) were simultaneously recorded, affording coverage of between 12 to 16 distinct neocortical areas, depending on the cortical atlas and parcellation scheme that is used. 45
Thesse areas rannge from V1 in the occippital cortex to FEF in thhe prefrontaal cortex (Fiigure 2b aand d). Monnkey K was implanted i fo for five monnths and monnkey P for 111 months. Both B weree recorded pperforming a selective aattention tassk, which is discussed iin more detaail in Chap apters 4 and 5.
Figu ure 2. a, Reendering of tthe brain off monkey K.. Lines indiccate the surfface coveredd by the E ECoG grid and a the major sulci. Doots indicate tthe 252 subdural electrrodes. b, Enllarged layoout of the grid with the ccovered corrtical areas aand major suulci labeledd. Sulci abbrreviations, from f posteriior to anterioor: lus: lunaate sulcus, ioos: inferior occipital suulcus, sts: superior tem mporal sulcuus, ips: intraaparietal sullcus, cs: cenntral sulcus, as: arcuate sulcus, sas: spurr of the arcuuate sulcus. c, same as aa, but for m monkey P. d,, same as b, but monnkey monkeey P. The asssignment off cortical areeas was perfformed usinng the Saleem and Logothetis (20007) monkey atlas as a reeference, givving 14 areaas in both annimals. For a morre quantitativve approachh for atlas too anatomy cco-registratioon, see Chappter 4.
46
Part IIa: Motivation, intuition, and definition for functional connectivity methods Once such a rich spatiotemporal dataset is recorded, the next question is how to make sense of the data. This involves applying statistical techniques to test for the presence and modulation of inter-areal oscillatory coupling during different tasks. There are two main approaches to accomplish this: functional and effective connectivity. The key difference between them is that whereas functional connectivity describes the statistical relationship between time series, effective connectivity seeks to describe the influence of one neural system onto another using a generative neuronal model (Friston et al., 2013). In this section, I will review methods for functional connectivity. For a discussion of effective connectivity, see Part III of this chapter. Figure 3 presents a nonexhaustive taxonomy for functional connectivity methods.
47
Figu ure 3. A taxxonomy of m methods for quantifyingg functional connectivitty
These m methods can be generallly subdivideed into thosee that measuure directed interractions andd non-directted interactioons. Non-diirected meassures seek too capture soome form m of interdeppendence beetween signnals, withoutt reference tto the directtion of influuence. Direected measuures seek to establish a statistical s caausation froom the data that is basedd on the m maxim that causes preccede their efffects. 48
Within both directed and non-directed types of estimates, a distinction can be made between model-free and model-based approaches. The model-based approaches depicted in Figure 3 all make an assumption of linearity with respect to the kinds of interactions that may take place between two signals. The simplest measure for nondirected model-based interactions is the correlation function, which measures the linear relationship between two time series, and quantifies their shared variance (R squared). A more generalized approach that does not assume a linear relationship is mutual information (Kraskov et al., 2004), which measures the generalized (linear and nonlinear) interdependence between two or more time series using information theory. The methods described above work in the time domain, yet in order to study functional connectivity between different oscillatory components of signals, it is helpful to study neuronal interactions in the frequency domain by applying Fourier decomposition, wavelet analysis, or the Hilbert transform to a time series. These frequency-domain methods assume that a neuronal time series can be re-represented by an amplitude and phase at every frequency that can be estimated from the data. After the time series have been decomposed into their corresponding frequencies, a variety of techniques can be used to detect frequency-specific interactions between signals. The most widely-used method of these is coherence, which measures the consistency of phase differences and the amplitude correlation between two time series across trials at a frequency f. Therefore, one can think of coherence as simply frequency-resolved correlation (e.g., correlations between bandpass filtered time-series). Whereas coherence reflects the co-fluctuations of both phase and amplitude between two signals, other methods such as the Phase Locking Value (PLV) and the Pairwise Phase Consistency 49
(PPC) specifically estimate only the phase synchronization between two signals and disregard their amplitude correlation (Lachaux et al., 1999; Vinck et al., 2010). Each of the methods discussed thus far also have their directed counterparts. For example, the directed version of the correlation function is the cross-correlation function, which is computed by shifting the two time series with respect to one another and computing the correlation for a number of lags, with the traditional correlation corresponding to the value at lag zero. This measure can be effective to study neuronal systems containing strong, uni-directional interactions that exert their greatest influence at a specific time-delay (for example, directed monosynaptic connections from the LGN to layer 4 of V1), and in these cases, it allows the leading/lagging relationship between two signals to be determined (e.g., Alonso et al., 1996). However, the cross-correlation function becomes very difficult to interpret when applied to heavily recurrent systems with bidirectional interactions, i.e., the dominant scenario in the majority of corticocortical interactions. These types of interactions lead to cross-correlation functions lacking a clear peak, and with significant values at both positive and negative lags, indicating complex, bi-directional interactions that occur at multiple delays simultaneously (W. Martin Usrey, personal communication). To address this, other methods have been developed which assess the temporal precedence or information content in one time series that can be used to predict the other time series. For example, time-domain Granger causality fits an autoregressive model to the time series, with the goal of describing how a given time series relates to its own past as well as the past of other time series (see the section “Quantifying frequency-resolved, directed interactions” for a formal description of this method). Considering two time 50
series, X and Y, if the past of times series X carries information about the present state of Y that is not already contained in the past of Y itself, then we say that X Granger causes Y (Granger, 1969). This formulation of directed influences with an auto-regressive, model-based framework leads to several advantages over the cross-correlation function. One advantage is that the model is fit with interaction terms in both directions (XY and YX), which means that one can estimate the directed influences in one direction independently of the reciprocal direction. Second, the interpretation of a Granger causal influence in terms of a true causal relationship is more principled (although still limited), because it quantifies the amount of information content present in one time series that can improve the (linear) prediction of another time series, above and beyond what it already predicts about itself. Another advantage is that the strength of the system innovations (unobserved inputs) are estimated separately from the interaction terms, which allows one to decouple signal strength/amplitude from the connectivity estimate itself. Finally, Granger causality can be applied in the frequency domain to address questions about which specific frequencies contain the Granger causal influences (Geweke, 1982). Other methods have also been developed to study directed frequency-resolved interactions. For example, Phase Slope Index infers directional influences by multiplying the phase difference spectrum (which contains information about leading/lagging phase relationships) with the coherency spectrum (Nolte et al., 2008). Finally, model-free approaches are also able to detect directional interactions. Namely, transfer entropy was developed to apply a generalized, information-theoretic approach to study delayed (directed) interactions between time series (Schreiber, 2000; Lindner et al., 2011). Transfer entropy can be thought of as a “pure” implementation of 51
the maxim (first proposed by Norbert Wiener in 1956) that causes must precede and predict their effects, and thereby can detect non-linear forms of interaction which may remain invisible to other approaches like Granger causality or linear correlation. However, due in part to its generality, it is more difficult to interpret transfer entropy, and frequency-domain versions of it have thus far been limited to resorting to pre-processing tricks. For example, one can band-pass data at particular frequency ranges and then apply transfer entropy. While the model-free approaches may be useful in quantifying nonlinear neuronal interactions, this dissertation will rely on the model-based, linear methods, because they provide direct evidence for directed and non-directed frequencyspecific interactions and therefore can provide the necessary (but perhaps not sufficient) evidence in favor or against the DCTO hypothesis. Future work will be needed need to establish the extent to which nonlinear interactions between frequencies contribute to the DCTO hypothesis. Quantifying phase synchronization Many approaches exist for quantifying phase synchronization, and two of the most commonly used are coherence and phase-locking value. I will first explain the concept behind phase synchronization and then proceed to discuss the differences between these two methods. To understand the concept of phase synchronization, it can be useful to consider the “extreme cases” of either a perfectly synchronized phase relation or a perfectly random phase relation. Imagine two oscillators that have a consistent zerolag phase relation over many trials or observation epochs. This is depicted graphically in the time domain in the left panels of Figure 4a, where two signals, oscillation 1 and oscillation 2, are depicted for 4 trials. Each trial consists of one complete period of the 52
oscillation, and therefore the phase varies between 0 and 2pi. The two oscillations have the same phase and amplitude for 4 trials in a row – in other words, they display perfect phase and amplitude correlation. To depict the phase relationship across all trials at a frequency f, we can represent the phase difference between the two signals on a polar plot (Figure 4a). Because the phase difference between the two signals at frequency f is always zero and the amplitude between the trials and signals is constant, each trial contributes a vector of magnitude 1 pointing towards zero on the polar plot. The calculation of phase synchronization in this example is easy: it is simply the length of the resultant vector: the vector sum over the four trials, which has a length of 4, normalized by the total number of trials (4). This produces a phase synchronization value of one, indicating perfect synchrony at frequency f.
53
Figu ure 4. Phasee synchronizzation at freequency f inn the case off perfect synnchronizatioon at 0 phasse (a), perfeect synchronnization at pi/2 p phase (b b), and no phhase synchrronization (cc). 54
Figure 4a illustrates phase synchronization at a phase difference of 0, but importantly, phase synchronization can occur at any relative phase difference between the two signals – only the consistency of the phase relationship over trials is relevant. This is depicted in Figure 4b, which again shows two oscillators that have perfect phase synchronization at frequency f, but with a non-zero phase difference. Notice that the two oscillations are out of phase by pi/2, or 90 degrees. On the polar plot, the phase differences for each trial are again depicted using vectors, which again sum to a total vector of length 4, which when normalized by the total number of trials again gives a value of one (again, perfect phase synchronization). Now let us consider the opposite extreme – the case of no consistent phase relationship between two signals, which should lead to a phase synchronization value of zero. In Figure 4c, the two oscillations now have a different phase relation on each trial – a phase difference of zero on trial 1, pi/2 on trial 2, pi on trial 3, and 3pi/4 on trial 4. These respective phase differences are depicted in the polar plot. Notice how after vector summation the resulting magnitude in polar coordinates is zero – resulting in a phase synchronization value also of zero. These examples illustrate the two extremes – on the one hand, perfect synchronization, and on the other hand, a completely random phase relationship between two signals. Of course, in the brain we would expect a continuum between these two extremes. A total and complete synchronization between areas would lead to a maladaptive state (e.g., an epileptic-like state), whereas a complete lack of synchronization could only be detected with an infinite number of trials because of the 55
problem of sample size bias. Indeed, some authors have proposed that oscillations function in the brain in a “sweet spot”, not too synchronized to lead to a total break-down in the ability of a system to represent information, but also synchronized enough to represent a regime by which oscillations could contribute to information throughput (Brittain and Brown, 2013). This regime appears to exist at a (un-squared) phase synchronization value of about 0.2 – 0.4, which can also be interpreted to mean that the phase of one signal predicts about 5-20% of the variance of the phase in another signal. Phase relations can also be quantified by the coherence statistic, which can be thought of as correlation in the frequency domain. Therefore, coherence reflects not only the phase relationship between two signals, but also their amplitude correlations. In the examples that we have seen thus far, we have considered only phase, and have assumed that the amplitudes of each of the signals are unchanging and of unit length across the observed trials. However, the coherence function combines the phase dispersion of two signals with their amplitude co-fluctuations to generate a weighted vector-sum:
(1)
In Equation 1,
∗|
| ∗
∗
∗
is the Fourier transform at a frequency f of a time series , and *
denotes the complex conjugate. The multiplication of 56
by
∗
within the absolute
value function implements the weighted vector sum that reflects both phase and amplitude consistency. This vector is then normalized by the square root product of the power of the two signals (the denominator), which normalizes the vector to range between zero and one. Therefore, it is important to remember that while coherence is a valid measure for detecting the presence of synchronization between two signals, the interpretation of coherence can indicate both the presence of synchronization as well as the presence of amplitude coupling. It is a largely open question whether two underlying neuronal populations can engage in only phase-synchronization and not amplitude correlation or vice-versa, although in real data the two often co-occur. In addition, it is also a largely open question as to whether different underlying mechanisms contribute to phase-phase coupling compared to amplitude-amplitude coupling. Therefore, for the purposes of detecting inter-areal synchronization over large networks (Chapter 3), we have used the most general of the two methods, which is coherence. Quantifying frequency-resolved, directed interactions In this thesis, I will use Phase Slope Index (Chapter 7) and parametric (used in the simulations of this chapter) and nonparametric Granger causality (Chapters 3 and 4) to quantify frequency-resolved directed interactions. Phase Slope Index is a useful measure for detecting uni-directional interactions, and is very robust to signal to noise ratio differences in recordings (Nolte et al., 2008). It can be thought of as a frequency-domain version of the cross-correlation function: it simply weights the phase difference spectrum by the coherence. However, this method fails when assessing bidirectional coupling, because when two neuronal systems both influence each other at the same frequency, the
57
phase differences cancel out, and no directionality can be detected on the basis of the phase spectrum alone. Therefore, in cases of estimating bi-directional functional connectivity, Granger causality is the method of choice because it is based on estimating the directional interactions in both directions separately. Granger causality can be calculated from time series data either parametrically or non-parametrically (Figure 5). In this dissertation I will rely primarily on nonparametric Granger causality to furnish estimates of directed, frequency-resolved functional connectivity. Nonparametric Granger causality (GC) is only “nonparametric” insofar as it does not require fitting an auto-regressive model to time series data. Instead, one estimates non-parametric GC from a Fourier or Wavelet transform (Dhamala et al., 2008). Therefore, this initial step implies a decomposition of the original signal into a series of sine and cosine basis functions or wavelets, which is implicitly a model of the data. In Figure 5, the different steps are illustrated for calculating Granger causality from the original time series ( , parametric or nonparametric methods.
58
using either
Figu ure 5. The parametric p aand non-paraametric dataa processingg pipeline foor calculatinng Grannger causaliity from tim me series obsservations.
Granger caussality, one sttarts by fittiing an auto--regressive m model In thhe case of paarametric G to thhe time seriees. Equationn 2 gives thee general forrm for a bivvariate auto--regressive moddel:
59
(2) The first equation above specifies how X at time t is a function of its own past at several lags (from 1 to p, where p is the model order) as well as a function of the past of Y. The variance of the error terms, which are assumed to be of zero mean and Gaussian (
and
) of these bivariate models is then compared to variance of the error terms of the univariate auto-regressive model (
and
) that does not model X as a function of Y or
Y as a function of X:
(3)
If the variance of the error terms of the bivariate model ( ) is less than the variance of the error terms of the univariate model ( ), this implies that the past of Y has improved the prediction of the current state of X above and beyond the predictions about X based on its past alone, and therefore Y Granger causes X (Granger, 1969; Ding et al., 2006; Bressler and Seth, 2011). The reciprocal logic holds for determining the Granger causality from X to Y. 60
To gain further information about the causal structure in such a bivariate model, one can examine the magnitude and lags at which a given signal contributes to explaining itself (matrices A and D in equation 1 – the “auto terms”), and the other signal (matrices B and C in equation 1 – the “cross terms”). Importantly, a lagged interaction in the time domain will result in an interaction with a particular frequency profile in the frequency domain. Therefore, matrices A, B, C, and D, together with the variance and covariance of the model residuals (the noise covariance matrix, ), specify the power (frequency,
resolved auto-variance of signals X and Y,
, respectively) and transfer
functions ( ( )). A transfer function is a frequency-domain mapping from variable X onto variable Y, where, for each frequency f, the transfer function can increase or decrease the amplitude and advance or delay the phase. An example transfer function is depicted in Figure 6 for a simple case of unidirectional causality from variable X to Y.
61
Figu ure 6. A tim me and frequuency-domaain representtation of a trransfer funcction. In thee time dom main, the autto-regressivee model speecifies the laags at whichh one processses influences anotther. The coorrespondingg transfer fuunctions of tthis model can c also be ddepicted in tthe freqquency domaain, which shows s how the t amplitudde and phasse of each frrequency is moddulated as thhe inputs (inn this case, Y) Y pass throough the trannsfer functioon to becom me outpputs (in this case, X).
The noise covarriance matriix and the trransfer funcctions togethher specify tthe mathemaatical m of Grangeer causality: form
GC C
→
ln
( (4) | 62
|
Equation 4 can be understood in intuitive terms as follows:
ln
→
(5)
, where the denominator of Equation 5 can also be referred to as the intrinsic power. In this formulation, it is clear that if the causal power of X to Y is zero (X has not contributed any of its variance/power to Y), then the total power is equal to the intrinsic power, and the Granger causality from X to Y is zero (Geweke, 1982). On the other hand, if there is a causal interaction from X to Y, X will contribute some of its variance to Y, meaning that the causal power of X to Y will be greater than zero, and the right hand side of equations 4 and 5 will also be greater than zero (Geweke, 1982). In some cases, the Granger causality of X to Y and of Y to X will both be zero, but the shared variance or coherence between X and Y is non-zero. This can arise in the case of common input from a third variable (see section “the common input problem”). In these cases, this formulation of Granger causality treats such shared variance as the “instantaneous causality,” in other words, shared variance that is not captured by the Granger causal terms (Ding et al., 2006). This addition to the framework leads to two additional important relations:
→
,
→
63
,
(6)
, and
,
ln 1
(7)
Equation 6 introduces an additional term, the “total interdependence” by summing the two causal terms and the non-causal term, and Equation 7 establishes that this quantity is directly related to the coherence function (C) as a function of frequency (Ding et al., 2006). This has two important practical consequences: one, if there is a coherence peak at a particular frequency f (e.g., the two signals have shared variance at a particular frequency), that shared variance will be distributed in some mixture into the two causal terms and the instantaneous term. Conversely, if there is no coherence (no linear dependence between two signals at a frequency f), than there will likely be no Granger causality between the signals. Additionally, Equations 6 and 7 make it immediately clear that the phase synchronization analysis framework, quantified by coherence, and the directed influences framework, quantified by Granger causality, are directly comparable and both reflect different aspects of shared variance between signals that can be partitioned into undirected and directed quantities, respectively. Nonparametric vs. parametric Granger causality Granger causality can be calculated parametrically (using auto-regressive models, as discussed) or non-parametrically (without auto-regressive models). Both approaches have the same end goal, but they differ in how they calculate the noise covariance and transfer functions (see the right half of Figure 5). Nonparametric Granger causality is based on the key insight that the cross-spectral density matrix (which can be easily 64
obtained after applying a Fourier transform) is equal to the transfer function multiplied by the noise covariance matrix multiplied by the complex conjugate of the transfer function:
∗
(8)
Furthermore, Wilson (1972) first proved that theoretically, it is possible to factorize the cross-spectral density matrix into the noise covariance and transfer matrix by applying spectral matrix factorization (Wilson, 1972) – and therefore, the output of this operation provides the necessary ingredients for calculating Granger causality (see Equation 4, Dhamala et al., 2008). Calculating Granger causality using this nonparametric technique has several advantages to parametric estimation: first and foremost, it is no longer necessary to determine a model order. In the parametric case, the auto-regressive model is only defined up to a particular lag p (Equation 2) – and the particular choice of which model order is appropriate can be problematic, because it can vary depending on subject, task, complexity of the data, filtering considerations, and model estimation technique that is used (Kaminski and Liang, 2005; Barnett and Seth, 2011). In contrast, nonparametric Granger causality implicitly uses an infinite model order, because it is defined directly on the cross-spectral density matrix, derived from Fourier methods – which assume local stationarity – in other words, that signals can be modeled using a sinusoidal basis set that is valid for the entire length of data. In addition, the nonparametric framework allows Granger causality to be derived from multi-tapered Fourier estimates, which provide spectrally smooth estimates with low variance (Mitra and Pesaran, 1999). Also, this 65
enables the entire analysis framework, including the calculation of power, coherence, and directed interactions (Granger causality) to be derived from non-parametric spectral estimation techniques. Finally, the usage of nonparametric techniques for Granger causality has been proven analytically and with simulations to be identical to parametric Granger causality (Dhamala et al., 2008). However, the downside is that non-parametric Granger causality requires more data and a smooth estimate of the cross-spectral density matrix to converge to the correct result. Because of this, in practice, non-parametric GC is much less robust compared to parametric techniques. However, in all the cases in which non-parametric techniques are applied in this dissertation, I have taken special care to ensure that the estimates are derived from many thousands of trials and pre-processed with the appropriate amount of spectral smoothing using multi-tapers, which significantly alleviates these concerns.
Part IIb: Limitations and common problems of functional connectivity methods
The common reference problem Spurious functional connectivity values can be created by the usage of a common reference or as a result of volume conduction. This problem is depicted graphically in Figure 7a. Imagine two recorded time series, data 1 and data 2, that pick up the underlying neuronal activities of source 1 and source 2, which have each been recorded by referencing to the same reference channel, “R”. Because signal R is the reference for 66
bothh data1 and data2, its acctivity will bbe incorporaated throughh a linear mixture into activvity from soource 1 and source 2. Thhis means thhat the recorded signalss, data1 andd dataa2, partly refflect a comm mon componnent at zeroo lag and parrtly an indeppendent com mponent refleecting the uunderlying neuronal n actiivity (whichh can exist at a many lagss). Assuuming that an a oscillatioon in the 30--60 Hz bandd is present in both sourrces, we cann exam mine what hhappens wheen coherencce is calculaated betweenn data 1 andd data 2 wheen couppling between source 1 and source 2 either exiists or does not exist.
Figu ure 7. Illustrration of diffferent referrencing scheemes and hoow each affeects the calculation of coherence w with and withhout true neuuronal couppling. a, Thee case of unipolar v in thee absence off coherence. b, recoordings, whiich introducce spurious ccoherence values The bipolar derrivation techhnique, whicch largely reesolves the ccommon refference probblem (thiss is the referrencing scheeme used inn Chapter 3, 4, and 6). cc, the separaate referencee scheeme, which also is not ssensitive to common reference probblems (usedd in Chapterr 7). 67
In this simulation, when no real coupling is present between source 1 and source 2, there is significant artifactual coherence between data 1 and data 2, due to the common part of the signal (the reference). In this simulation, the reference was also assumed to have an oscillatory component – however, note that if the reference consisted of white noise, or a mixture of white and colored noise, than the respective coherence spectrum between data 1 and data 2 would reflect the underlying spectral shape of the reference – due to its mixture into both channels. This is a problem, because in the absence of any underlying neuronal interaction, a connectivity method should report a value of zero. When real coupling is introduced between source 1 and source 2, as one can see in Figure 7a, the coherence between data 1 and data 2 increases – this reflects the presence of both the common reference and real coupling. This simulation was performed assuming strong coupling between the sources, and in cases of weak coupling, the artifactual coherence may sometimes predominate – and obscure – the real coherence caused by true interactions. One solution to the problem is to record additional channels and perform bipolar derivation to remove the common reference, and thereby allow measures of connectivity to be calculated between “reference-free” bipolar derivations that do not share a common unipolar channel (Figure 7b). This procedure makes two assumptions: first, that the reference is equally present in the two unipolar channels that will be subtracted, and second, that each of the unipolar channels reflects a different mixture of the underlying neuronal sources – otherwise, the same logic behind eliminating the common reference through bipolar derivation would also result in a cancellation of the neuronal signal. In 68
Figure 5b each unipolar channel is depicted as reflecting the activity of an independent source, but each unipolar channel could also reflect a mixture of underlying sources, and the same logic would apply. In this scenario, the bipolar derivation removes the common reference (see the equation in Figure 7b), and the resulting bipolar signal is a subtraction of two local source activities. When coherence is now calculated directly between bipolar site 1 and bipolar site 2, it is not biased by the common reference, as shown in the lower panel of Figure 5b: when no coupling is present between the sources, coherence is effectively zero, but in the presence of coupling, coherence reaches a value of 0.5. A second possible solution to this problem is shown in Figure 7c, which is to separately reference each channel. In this case (lower panel of Figure 7c), there is again no artifactual coherence component, and the coherence estimates are slightly larger in magnitude compared to the bipolar case, even though the coupling strength is the same. This may be a result of the bipolar derivation partly also reducing “real” interactions, in addition to dampening the effects of the common reference. While the separate referencing scheme would therefore appear to be ideal, it may not be practical for largescale, high density recordings. The volume conduction problem Another major problem when attempting to quantify synchronization between two brain regions is that such estimates may be contaminated by volume conduction. Volume conduction (known as field spread in the case of magnetic fields) refers to the spatial spread of electric fields, which in the case of neuroscience measurements can cause one recording channel or sensor to pick up the activity of multiple neuronal sources. At its worst, this artifact creates purely artifactual coherence or phase-locking, meaning that the 69
presence of functional connectivity between two signals would indicate not the presence of neuronal interaction, but instead a bleeding of an unobserved source into the two channels. One property of volume conduction effects is that these can be assumed to occur instantaneously at time scales relevant for neuroscience. Therefore, the common reference problem and the volume conduction problem are conceptually similar – the difference is that in the case of a common reference, the reference can be assumed to mix into each channel with equal weight. However, volume conducted sources will appear with different weights in different channels – indeed, this is the key insight between many strategies for signal unmixing – methods which assume that the distribution of recorded channels will reflect a linear mixing of many underlying sources (e.g., Independent Components Analysis, Bell and Sejnowski, 1995). Field spread is less problematic when calculating spike-spike interactions, because spiking activity of individual neurons volume conducts only to tens or hundreds of microns – however, insofar as it does volume conduct over these short distances, this is a useful property which can been exploited in advanced spike-sorting algorithms, which attempt to detect a spike on multiple nearby channels (for example, in tetrode recordings), and use statistical methods to isolate spike waveforms from different channels that correspond to the same neuron (e.g., Chelaru and Jog, 2005). The problem is more acute when analyzing synchronization between two LFP signals, and much more acute in the case of assessing synchronization between MEG/EEG sensors. The reason is that the currents that generate local field potentials are more synchronous across space compared to spikes, and therefore generate stronger fields, which in turn also propagate over larger distances through neuronal tissue. 70
Currently, it is a relatively open question as to how “local” the local field potential is, but can in many cases be assumed to index mostly local neuronal activities immediately surrounding the electrode, because the amplitude of an LFP signal is inversely related to the distance between source and sensor (Buzsáki et al., 2012). The field spread is most problematic when performing non-invasive measurements, because the skull, CSF, and scalp contribute to further spatial smoothing of electric signals in the case of EEG, and the potentially large (many centimeter) distance between neuronal sources and sensors in the case of MEG means that signals can spread over a large distance – indeed a common practice in clinical applications of the event-related potential method is to measure brain stem evoked responses in infants using scalp EEG, which is only possible due to volume conduction. Therefore, a single underlying neuronal source will be seen at multiple EEG or MEG sensors – causing large correlation values between one EEG or MEG sensor and other sensors. Figure 8a quantifies the problem in a sample MEG dataset. Correlation was calculated between all possible noise-free MEG sensors (a total of 247 sensors), and the histogram of correlation values is displayed, which has a positively skewed distribution with a mean of 0.54, indicating that many combinations of sensor pairs share a large amount of variance due to volume conduction. Functional connectivity calculated directly between sensors would therefore be heavily confounded in this case.
71
Figu ure 8. Correelation struccture of all ppossible pairrwise combinations of cchannels forr diffeerent recordding techniqques. a, MEG G planar graadiometers ddata from a single subjeect, recoorded for 5 m minutes in a resting statte task. Largge correlatioon values annd positiveskew wed distribuution suggesst the presennce of volum me conduction. Data kinndly provideed by Giorrgos Michallareas. b, Unnipolar ECooG recordings show a m massive impprovement oover MEG G, halving tthe average correlation.. c, Bipolarr derivation results in a more normaal distrribution, cenntered approoximately att zero, indiccating very llittle volumee conductioon.
This prooblem can bbe approacheed either expperimentallyy or correctted during anallysis. Experiimentally, oone can avoiid the probleem altogethher by recordding subdurral or epiddural local field fi potentiaals directly from the surrface of the brain, as is performed with 72
electrocorticography (ECoG) or with penetrating microelectrodes. By doing this, one can record the fields before they volume conduct over large distances. This results in a signal that reflects more localized activity, with each channel reflecting more independent activity and sharing less volume conducted activity with its neighbors. This can be quantified by repeating the same correlation analysis that was applied to combinations of MEG sensors to all possible pairs of ECoG channels (from the array shown in Figure 2). The resulting histogram of Pearson correlation coefficients is shown in Figure 8b, and shows a distribution that is shifted to positive values, with mean of 0.27. This is already a huge improvement over the case of MEG recordings which have an average inter-sensor correlation of 0.54, two times the ECoG value. However, as discussed in the previous section (the problem of the common reference), some part of the correlation structure between unipolar channels recorded against a common reference will be artifactual. Therefore a more sensitive test for the true underlying correlation structure between neuronal sources is to compute correlations between all possible pairs of bipolar derivations (excluding bipolar derivations that share a common unipolar channel). The resulting histogram of correlation values is shown in Figure 8c, which reveals a distribution that is approximately centered at zero, with a mean of 0.004. This indicates that a large number of pairs of bipolar derivations contain independent information, with negligible amounts of volume conducted signals. Therefore, recording local field potentials with ECoG grids, in combination with bipolar derivation, largely resolves the volume conduction problem. Another way to deal with the volume conduction problem is by relying on corrective tools that try to “unmix” the signal or by studying only the correlation structure 73
that explicitly removes potentially spurious volume-conducted part of the signal. For EEG or MEG data, one approach is to first perform a source analysis, to estimate which specific neuronal sources caused the observed scalp-level data, and then perform connectivity analysis between the sources. Whereas this may partially alleviate the problem and allow particular pairs of areas to be studied with strong a prior hypotheses (Siegel et al., 2008), this also does not eliminate volume conducted effects in source space. Using this approach, what is typically observed is that the coherence or correlation between a seed voxel to the rest of the brain follows a spatial pattern that is inversely related to the distance from the seed voxel, such that nearby sources are strongly correlated to the source, and more distant sources are less correlated – this spatial decay of correlation corresponds simply to the fact that source localization does not completely remove the effects of field spread (Hipp et al., 2012). This problem makes it difficult to observe clear, distant peaks between cortico-cortical areas that can unambiguously be attributed to neuronal interactions instead of field spread. Thus far, the safest corrective method for dealing with this problem is to use the a priori knowledge that volume conduction effects are instantaneous and therefore become mixed into the recordings at zero lag. By disregarding the connectivity/phase synchronization at zero lag, one explicitly disregards the part of the correlation structure that could have been caused by volume conduction – popular methods for this include the imaginary coherence (Nolte et al., 2004), the orthogonalization approach (Hipp et al., 2012), and simply removing values that are at zero phase prior to calculating measures of interactions (Watrous et al., 2013). Unfortunately, while these measures remove potentially spurious effects of volume conduction from functional connectivity estimates, 74
they are also overly conservative, because they disregard real zero-phase neuronal coupling. Thus, these approaches do not separate real vs. spurious zero-phase synchronization and instead remove all zero phase relationships. This problem is especially acute because the original reports of oscillatory synchronization (between spike responses) reported zero phase coupling (Gray et al., 1989). Therefore, hopefully in the future additional methods will be developed to allow for a disambiguation between zero-phase correlations due to volume conduction vs. real neuronal interactions. Until then, the most straightforward and the safest way to approach the volume conduction problem is to minimize the problem by minimizing field spread at the sensor level, by recording LFPs with ECoG grids or penetrating microelectrodes. The common input problem Another problem in detecting true neuronal coupling from real data is detecting shared variance between two signals that is due to bidirectional or unidirectional connectivity versus shared variance caused by common input. Conceptually, this is similar to the volume conduction problem, with the key difference that common input from neuronal sources can occur with a time delay. For example, consider the generative model shown in Figure 9a. In this example, we consider the connectivity structure between three nodes, where nodes 1 and 2 are not directly connected but receive common input from node 3. In this example, we assume an auto-regressive generative model for the interactions, because these models can be used to generate simulated signals that reasonably approximate real neuronal signals (Ding et al., 2006). The equations in panel a of Figure 9 state that node three ( ) provides a weighted copy of itself to nodes 1 ( ) and 2 ( ) at time lags 1 and 2. Therefore, there will be shared variance between nodes 1 75
and 2 that is nott caused by their direct neuronal innteraction. A After generaating some we can simuulated data bby filtering white noisee through thee equations shown in suubpanel a, w calculate cohereence betweeen nodes 1-33. Subpanel b of Figuree 9 shows thhe respectivee ws a clear peeak at coheerence specttra. The cohherence specctrum betweeen nodes 1 and 2 show 40 H Hz, with a m maximum vaalue around 0.6. If we w were to interrpret this cooherence speectrum as evvidence of a neuronal innteraction bbetween noddes 1 and 2, it would bee a spurious inferrence. Therrefore, to aidd in the inteerpretation of o this coherrence spectrrum, we neeed to expllicitly consider the sharred variancee due to effeects of directted couplingg versus com mmon inpuut.
76
Figure 9. A simulation of the common input problem, a, the auto-regressive form of a model that simulates common input from node 3 ( ) to nodes 1 ( ) and 2 ( ). b, spurious coherence between nodes 1 and 2 caused by common input. c, Granger causal estimates detect the common input as distinct from directed interactions between nodes 1 and 2, both when the common input is observed (c) and when it is not (d).
This can be done by quantifying directed interactions using Granger causality, which can distinguish true, bi-directional neuronal coupling at zero-phase from zerophase coupling as a result of common input. Figure 9c shows the Granger causality estimates between nodes 1, 2, and 3, estimated from data generated by the model shown in subpanel a, using no a priori knowledge about which connections were present in the generative model. As is evident, by decomposing the undirected connectivity into directed connectivity using Granger causality, only connections with true underlying coupling (connections 31 and 32) survive, and the spurious connections (12 and 21) are suppressed. Importantly, the Granger causality estimates can detect common input even if it is from an unobserved source: in panel d of Figure 9, Granger causality is again estimated from the same data, but without observing the node that provides the common input (node 3). Again, the Granger causality estimates between nodes 1 and 2 are flat, because the shared variance is absorbed by the instantaneous term. Note that these simulations have been performed in the “best case scenario”, assuming that the common input is provided to nodes 1 and 2 with equal coupling strength, at the same time delay, and that recordings from nodes 1 and 2 are performed with an equal signal to noise ratio. In real data, as these assumptions are violated, Granger causality estimates will also diverge from the true underlying coupling. This is because a change in any of these parameters will affect how well the variance of node 1 77
can predict the variance of node 2 (or vice-versa), which in turn will modulate the estimation of Granger causality. The “worst case scenario” of this problem is modeled in the following section. The signal to noise ratio problem The formulation of Granger causality given in Part IIa of this chapter essentially states that one variable has a “Granger causal” relationship to another if the past of one time series can enhance predictions about another time series in the present. This definition appeals to our intuitive understanding that causes must precede, and in some way explain their effects, and also respects the arrow of time – that the past precedes the present which precedes the future. While this general approach is principled, when applied to real data, it can cause unexpected consequences and in some cases generate “Granger causality” in the absence of “true causality”. One example of this is can be seen when Granger causal estimates are derived from noisy data. Consider the model shown in Figure 10a: variables
and
are
generated by an auto-regressive process that says they are both a function of their own past at time lags 1 and 2 (the auto terms), and also a function of the past of the other variable (the cross terms), also at time lag 1 and 2. Crucially, the auto-regressive coefficients of both the auto terms and the cross terms are identical, and the variance of the innovations ( ,
) of both processes are also identical, meaning that the two
variables influence each other with equal strength. Therefore, a priori, Granger causality is by definition identical in the 12 direction compared to the 21 direction (where 1 stands for variable
and 2 stands for variable
). This is indeed the case, as when the
outputs of such a model are observed without measurement noise, illustrated in Figure 10 78
b-d. In this casee, as expecteed, both varriables have nearly idenntical powerr spectra peaaking at 400Hz (panel bb), have a ccoherence sppectrum thatt also peakss at 40 Hz (ppanel c), andd have apprroximately eequal Grangger causalityy at 40 Hz inn both direcctions (panell d). Note thhat the slighht differencee in 1 2 vs. v 21 Graanger causallity is due too estimationn error, whicch apprroaches zeroo as the num mber of realiizations of tthe model annd subsequeent observattions are rrepeated.
Figu ure 10. A siimulation off the signal tto noise ratiio problem, in which inn a, two noddes interract with eqqual reciproccal connectiivity strengtth, and the ddata is obserrved withouut (case 1) or withh (case 2) meeasurement noise. b, poower, c, cohherence, andd d, Grangerr caussality estimaates for casee 1. e, power, f, coherennce, g, Grannger causalitty estimatess for casee 2. 79
Now let us consider case 2, where we observe the same system, but in the presence of noisy measurements. In case 2, data is again simulated using the identical auto-regressive model as case 1. After the model is realized, additional noise is added to channel 1 (in this case, measurement noise was assumed to be white, with a variance of one) but not to channel 2. The first result of this manipulation is that the power spectrum of channel 1 becomes less peaked (Figure 10e), a result of adding power at all frequencies (i.e., white noise) to that channel. The coherence between the channels is also modulated by this manipulation, shown in Figure 10f. Interestingly, the peak value of coherence in subpanel f is nearly identical to the peak value in subpanel c, indicating that coherence may be robust to signal to noise (at least in this example). The problem is with the Granger causal estimates, shown in Figure 10g, which show a strongly asymmetric relationship, where 2 Granger causes 1 significantly more than 1 Granger causes 2. Evidently, what has occurred is that the additional noise on channel 1 has weakened its predictive power of channel 2, and the corresponding direction of Granger causality is weakened, causing the asymmetry. Note that this asymmetry is exactly in line with the definition of Granger causality, and in that sense is not “wrong” – instead, what it does show is a special case of divergence between “Granger causality” and “true causality”. The simulations shown in Figure 10 show the “worst case scenario”, when a massive difference in signal to noise ratio exists between channels. In real data, this problem can be addressed by ensuring that measurements are as noise free as possible, and that measurement noise does not vary over channels. For example, the experimenter can ensure that each channel is recorded with electrodes that have the same impedance and that are composed of the same materials. Combining this with amplifiers that have 80
the same gain for each channel and that introduce a minimal amount of noise in the A/D conversion step, this ensures that the noise properties of each signal are approximately equal. In addition, analytic approaches can also be used to correct for measurement noise post-hoc. For example, Nalatore and Ding apply an algorithm based on Kalman filtering and expectation-maximization to estimate and correct for measurement noise differences between channels, which to a large extent can correct for the problem, yielding Granger causality estimates that are not contaminated by noise (Nalatore et al., 2007). In an analogous approach, by using Dynamic Causal Models (DCM, described in the next section), the generative model can account for channel noise as an independent parameter from signal power, and therefore connectivity estimates should be more robust to changes in signal to noise ratio, although this remains to be demonstrated (Friston et al., 2012). In summary, while corrective techniques may potentially alleviate the problem, the concern is that after the measurement is performed, the exact mixture of “signal” and “noise” is in many cases unknown – while this mixture can be inferred from data and corrected for, the best solution would be to ensure as minimal a difference as possible at the data collection step.
Part IIIa: Motivation, intuition, and definition for effective connectivity methods In Figure 11, a taxonomy of techniques for effective connectivity, or the effective influence of one neuronal system on another, is illustrated. Causal intervention is the 81
“golld standard”” of effective connectivvity, becausee one can dirrectly intervvene in a system by aapplying electrical curreent or optoggenetic stimuulation in onne brain reggion, and theen meaasure the efffects of this manipulatioon on anotheer brain region. Howevver, another way to esstimate effective conneectivity is byy fitting a m model to obseerved neuroonal time serries, in w which the moodel approxximates the uunderlying nneuronal arcchitecture annd dynamics that geneerated the daata. By usinng this approoach, one caan estimate hidden neurronal param meters whicch are not accessible att the level off the data feeatures them mselves.
Figu ure 11. A taaxonomy forr effective cconnectivityy techniquess. Abbreviattions: DCM: Dynnamic Causaal Modelingg, NFM, Neuural Field M Models, NMM M, Neural M Mass Modells, ERP P, Event Rellated Potenttial, CSD, C Cross Spectral Density m matrix 82
Dynamic Causal Modeling (DCM) “What I cannot create, I do not understand.” - Richard P. Feynman Although other methods for effective connectivity exist, I will limit the discussion of this section to the framework of Dynamic Causal Modeling (DCM), a technique that has experienced much methodological advance in recent years, and has emerged as the most popular tool for effective connectivity analysis of brain imaging data. A commonality to these models is that they rely on a generative model for the data (David et al., 2006). A generative model specifies how an underlying system of coupled neuronal populations, through their dynamics and interactions, give rise to various observed data features. In other words, DCM works from the premise that in order to understand a system, one must be able to re-create its essential features using a model. In this way, it forces the experimenter to precisely specify which underlying model architectures generated the data. This approach stands in contrast to methods for functional connectivity, which attempt to derive the underlying causal structure by evaluating statistical dependencies directly between different time series. A typical pipeline To understand the essential difference between these two forms of analysis, a typical pipeline for functional connectivity and effective connectivity analysis is depicted in Figure 12. The critical difference is that the data features that are used in a functional connectivity analysis such as evoked responses (ERPs, e.g., Garrido et al., 2007), power or phase estimates at different frequencies from Fourier analysis (Chen et al., 2009), or coherence and Granger estimates from connectivity analysis derived from cross-spectral density matrices (Friston et al., 2012), can each be taken as a starting point for DCM. 83
From m the point of view of D DCM, thesee are observaations in need of explaiining in term ms of an uunderlying ggenerative m model.
Figu ure 12. Typpical pipelinees for functiional conneectivity and DCM. The typical end point of a functional connectivity c y analysis iss taken as a starting point, or data ffeature, to be fit by aan underlyinng generativve model in D DCM.
Therefore, the first step in a DC CM is to deffine the moddel space thhat will be teested. mal hypotheesis about thhe underlyinng causes off the Thiss is equivaleent to formuulating a form dataa. For exampple, a particuular data feaature (such as gamma-bband power or coherencce) mighht be causedd by particuular circuits with well-ddefined intrinnsic connecctivity (e.g., recipprocal connnections betw ween excitattory and inhhibitory cellls), or multipple such cirrcuits definned by cortiico-cortical patterns of extrinsic coonnectivity, or the interaaction betw ween intriinsic and extrinsic connnectivity andd neuromoddulators (for a generativve model of inter84
areal gamma- and beta-band synchronization, see Chapter 6). Crucially, in order to effectively apply DCM, one must have a well-defined hypothesis about what caused the data. Next, one must be able to propose precise models that each realize different hypotheses about the causes of the data. This means defining a generative model (see the next section on different generative models used in DCM) and specifying which intrinsic and extrinsic connections could have caused the data. Importantly, only models with a priori equal likelihood should be tested. The particular choice of the generative model combines the prior knowledge of the underlying system with the hypotheses that one would like to test. Crucially, this also involves choosing priors, which define the space of likely values that different model parameters can take. The next step is model inversion, in which each model is separately fit to the data, using a Variational Bayes algorithm (Friston et al., 2003), which finds the model parameters that best fit the data but that diverge as little as possible from their prior values. Finally, after multiple models have been fit to the same data set, one can assess which model is the most likely given the data – this step corresponds to Bayesian model selection, and in this way, one can determine which a priori hypothesis (or model) gives the best trade-off between accuracy and complexity. Therefore, an essential aspect to DCM is that it forces the experimenter to make his or her implicit assumptions explicit, because it requires each competing hypothesis to be specified and instantiated in a mathematical form. Generative models Figure 11 lists some of the different generative models that have been developed in the DCM framework for electrophysiological observations. The highest level 85
distinction is between phenomenological and biophysical models. Phenomenological models attempt to specify the underlying causal structure that generated a data feature such as a power time course (in the case of induced responses) or a particular phase relationship between two signals (in the case of DCM for phase). In this sense, this class of DCM models is similar to functional connectivity approaches, because both try to describe the data in terms of different data features. The main difference in the phenomenological case is that DCM still incorporates model specification, inversion, and Bayesian model selection. This allows competing models to be compared of varying complexity. In contrast, the biophysical DCMs have generative dynamics that result from parameterized cell ensemble interactions, with parameters that can be related to neurophysiological components such as time constants and receptor densities. In the case of DCM for Cross Spectral Densities (CSDs) for example, one can fit different microcircuit models, using the cross-spectral density matrix (CSD) as a data feature to understand which circuits may have generated the observed inter-areal phase synchronization (this analysis is performed in Chapter 6). Two different approaches are possible for modeling the spatial extendedness of a source, which are referred to as Neural Field Models (NFM) and Neural Mass Models (NMM). The main difference is whether they treat an observation as having a spatial extent or whether the activation is assumed to represent a single point. In Chapter 6, a NMM approach is used to model the synchronization between two distinct areas of the monkey visual cortex, V1 and V4. These circuits are each by themselves considered in isolation, in the sense that they have their own dynamics, which are partly affected by, 86
and partly effect, the dynamics of the other area. In contrast, a NFM approach can be used to understand the spatiotemporal filter properties of neurons in V1. This approach was recently taken by Pinotsis et al. to model how horizontal interactions in V1 may be modulated as a function of contrast (e.g., Pinotsis et al., 2012, Pinotsis, Brunet, Bastos, et al., submitted). These biophysical DCMs must have a dynamical model for neuronal interactions. These include convolution-based models and conductance-based models. Convolutionbased models (used in Chapter 6) are a good starting point for modeling a neuronal population: they approximate two of the most basic aspects of neuronal signaling, the transformation of inputs to outputs (the non-linear relationship between membrane potential and spike rate) and of outputs to inputs (the spike rate of the pre-synaptic population resulting in depolarization or hyperpolarization of the membrane potential of the post-synaptic population). Another class of DCMs model the specific conductances associated with different synaptic currents that are generated by the activation of excitatory AMPA and NMDA receptors and inhibitory signaling through activation of GABA receptors. These equations are based largely on Hodgkin-Huxley style neurons, with the difference that they are designed to model a population of neurons (Marreiros et al., 2009). Finally, one must decide which specific data feature will be tested (Figure 11, the lowest part of the tree) – all of these models can be applied to model ERP responses, power spectra, as well as cross-spectral densities, and therefore, it is the choice of the experimenter which data feature will be modeled. This choice depends on which data feature is most likely to disclose the underlying causal interactions in the system. 87
Therefore, DCM provides a unifying approach, because the same underlying biophysical model can be used to account for different properties of recorded time series. The dynamical model and the observation model One distinction that applies to any DCM is that the generative model for observed data is composed of two parts: the dynamical model and the observation model. The dynamical model is a series of differential equations that define the time evolution of states of the system x in terms of some function f of the current state x , the parameters of the model , and the model inputs u :
x f ( x, u, )
(9)
In this case, the particular kinds of states (x) will be determined by the choice of dynamical model (for example, a conduction-based or convolution-based model, a NMM or NFM model, as reviewed above). The parameter u specifies the inputs to the model, because typically, every modeled circuit also receives input from other un-modeled sources. These unmolded sources are represented by u . Finally, the parameters of the model and the prior variances of those parameters constrain the kinds of dynamics the model can express. For convolution-based models, includes the synaptic time constants, intrinsic and extrinsic excitability, time delays, gain parameters to determine the shape of the input-output function, and connection strengths. Importantly, the dynamical model also specifies the prior values of these parameters, which are captured by the prior mean and variance – these prior values embody our existing knowledge of basic biophysical and anatomical properties (e.g., time constants and laminar structure).
88
For example, in modeling the dynamics between visual areas V1 and V4 (Chapter 6), one important parameter is the time delay between inter-areal synaptic interactions. In this case, prior work indicates that the value should be between 5-20 ms, and this information can be used to set the prior mean and prior variance on the lag parameter. This means that model inversion will be penalized heavily if it needs to push this parameter value outside this range to explain the data. This is the essence of the Bayesian modeling approach – combining prior knowledge with existing data to get the best possible model fit while deviating from the priors as little as possible. Equation 9 fully specifies the dynamics of the system. However, in many cases one does not observe these dynamics directly. For example, in Chapter 6, a dynamical model is used that includes different cell populations for different layers, and the model is fit to electrocorticography data that is not laminar-resolved, but instead reflects a complex summation of activities of all cortical laminae. Therefore, in this case, an observation model is needed to specify how the dynamics of different cell populations are mixed to generate the electrocorticography signal. The general form for an observation model is:
y g ( x, )
(10)
Where y is the observed signal (or data feature to be modeled such as an ERP or a CSD), which is a function g of the underlying dynamics x, and the parameters of the observation model (in the example of DCM applied to ECoG signals, this would specify a filter defining how the dynamics of each cell population contributes to the observed signal). Together, the observation model and the dynamical model fully specify the generative model for a particular observation y. Importantly, this framework can be generalizable to 89
any kind of observation, as long as one can estimate how the neuronal dynamics cause the observed signal. For example, one could fit the same model to different data features such as fMRI BOLD responses, local field potentials, and calcium imaging data, as long as the observation model were adjusted for each measurement. Validation of DCMs Obviously, such a modeling approach as DCM is only as good as the models used to describe real neuronal dynamics, and only as good as the ability of the data to constrain model fitting. This means that practically speaking, one must be able to validate DCM – in other words, check it for internal and external validity. Otherwise, there is a danger of the approach generating a “garbage in, garbage out” situation. DCM can be validated in three ways, and these are referred to as face validity, predictive validity, and construct validity. Face validity refers to being able to recover model parameters that one knows to be true a priori. This is done by simulating data using a generative model in which the connection types and strengths are known, and then performing model inversion on the simulated data to recover those same model parameters. This is similar to the approach that was taken for assessing functional connectivity methods, in the simulations performed earlier in this chapter. Another approach to validate DCM is to establish predictive validity, or to test whether DCM can derive an established property of the system which we know to be true by other means. In Chapter 6, for example, we test predictive validity by showing that the correct feedforward/feedback anatomical connections can be inferred from DCM applied to cross-spectra recorded from V1 and V4. This means that a priori knowledge of the system (feedforward connections exist 90
from V1 to V4, feedback connections exist from V4 to V1) can be recovered by fitting the model to real data. Another way to test predictive validity is to pharmacologically manipulate the system and assess whether different pharmacological procedures, with known consequences for synaptic signaling, can be recovered by DCM (Moran et al., 2011). Finally, construct validity refers to the ability of DCM to converge on similar knowledge that is known from other methods. This form of validity is still beginning to be explored, as it is currently an open question as to whether Granger causality and DCM always converge to the same answer.
Part IIIb: Pros and cons of the DCM approach Advantages of the DCM approach One advantage of the DCM approach is that it forces the scientist who uses it to explicitly state his or her hypotheses and instantiate those hypotheses in terms of mathematical models. Competing hypotheses for the same data can then be evaluated using a Bayesian framework that applies a principled approach for assessing the tradeoff between model accuracy and complexity. In the functional connectivity approach, hypotheses are instantiated implicitly through the particular signal processing methodology that is applied and the particular kind of statistical test that is used. By forcing the models under consideration to be explicit, DCM forces the scientist to entertain all equally plausible causes of the data by specifying the model space to be tested. This forces one to be explicit about the specific circuits that caused the data, and therefore, enforces a more mechanistic interpretation of the data. 91
Another advantage of DCM is that it explicitly models the dynamics of the system (the dynamical model) separately from the particular way in which those dynamics are observed (the observation model). This means that in principle multiple kinds of data, with different observation models but the same underlying dynamical model, can be used to probe different mechanistic questions about the underlying circuits. It also implies that problem of signal to noise ratio, as we saw in Figure 10, should be to a large extent alleviated, because connectivity parameters and neuronal innovation or drive are modeled separately from the parameters associated with measurement noise. This may make DCM more robust at detecting true connectivity in the face of signal to noise ratio differences between channels in real data (compared to functional connectivity methods), although future simulation will be needed to confirm this intuition. Another conceptual advantage is that DCM can be used to model hidden sources, in other words, sources which may play an important role in the connectivity of the system but which have not been directly recorded. Recently, this has been exploited in a DCM study of the cortico-striatal loop, in which data was recorded from a few source areas of the loop but not all (Marreiros et al., 2012). A DCM was used to model this incomplete sampling of the data that contained all known anatomical connections and areas of the circuit, and successfully modeled the (observed) dynamics of this system, even though data was present for only a subset of the nodes. The model fits were highly accurate, and the parameters of the fitted DCM make specific predictions about which connections in the loop are most important for establishing communication and for exacerbating pathological beta band oscillations that were observed in the Parkinsonian state (Marreiros et al., 2012) – these predictions can then be tested empirically in further 92
studies. Importantly, in DCM, all source areas and their parameters are “hidden”, because they are not directly observed in the data but are instead inferred from model fitting. Therefore, conceptually, there is no distinction in modeling intrinsic and extrinsic connectivity parameters between areas with data and areas without data – the only difference is that in one case, data exists to constrain the parameter space. To give another example, the possibility of modeling unrecorded sources allows one to model the effects of a common driver to two areas, and by using Bayesian model selection, infer whether such a common input model or a direct connectivity model better explains the data (which would be another potential technique to deal with the common input problem). Of course, some data is necessary to perform DCM analysis, and when the data is too sparse model fitting will become under-constrained. Finally, the greatest strength of DCM is that it can be used as a “mathematical microscope”, allowing for inferences to be made about model parameters which are not directly accessible in the data features themselves. For example, it is not immediately clear how to relate observations such as power or coherence at a particular frequency to the activity of a particular cell population – however, by modeling such data features (e.g., power and coherence) using a generative model that contains this level of description, one can use DCM to estimate the underlying circuits that caused the data. For example, Chapter 6 uses DCM for CSD to make inferences about the activities of superficial and deep pyramidal cells in V1 and V4 and their inter-areal transfer functions. These inferences can then be checked by experiments that measure neuronal activity with a laminar resolution (Roberts et al., 2013). Disadvantages of DCM 93
As in any model-based approach, one is always at a risk of over-fitting the data – this can be a problem, because if a model is over-complex, then a particular dataset could be equally well-fit by any number of models, and in the end model fitting would teach us nothing. Therefore, model validation is an important step, to establish that the data features are indeed capable of constraining the model fits (face validity), and that the model can tell us something that we know to be true about the system but that is not directly accessible from the data (predictive validity). After having established DCM using these validation tests, one can apply it in a case to reveal new information – which can then be used to generate a new empirical experiment, yielding an ever-refined model or understanding about the circuits in question. The trick is to place DCM at the appropriate level, such that the models are not overly complex in the face of the available data. On the other hand, as data features become more advanced (for example, cellspecific or layer-specific recordings in electrophysiology), then those data features can be used to constrain more detailed dynamical models that contain more realistic biophysics. Therefore, DCM should be used to make more mechanistic inferences than what can be observed directly from the data, but without becoming over-parameterized. Therefore, DCM is not a “magic bullet,” and requires a careful consideration of which kinds of models will be tested under which kinds of data. DCM can be powerful when used to ask questions about a reduced model space, out of the vast space of all possible models, but is less useful for searching the entire model space (although recent developments in this domain are promising – e.g., Rosa et al., 2012). Lastly, to use DCM, one must have a great deal of a priori knowledge about the system, and therefore it is not a useful tool for exploratory data analysis. Therefore, when less is known about the 94
specific system, functional connectivity techniques can be applied, because they require many fewer assumptions. These data-driven approaches can then be used to inform mechanistic models of the underlying dynamics. In this way, both effective and functional connectivity can be used in an iterative, mutually-informative approach to gain more mechanistic insights into a system. Functional and effective connectivity analysis in this dissertation Indeed, this combined approach represents exactly the path of this dissertation. Chapter 1 states some basic predictions and hypotheses about which kinds of functional connectivity patterns should be present in data if the DCTO hypothesis is correct. Chapters 3 and 4 report several empirical findings that confirm some of the predictions from Chapter 1, but also reveal an un-predicted canonical pattern of oscillatory dynamics (beta signaling in the top-down direction, gamma in the bottom-up direction). Chapter 5 considers what the underlying circuits that generated such dynamics could be by considering the canonical properties of intrinsic and extrinsic cortical connections and predictive coding theory. Chapter 6 then instantiates these circuits in a DCM and validates the model. Chapter 7 returns to the data-driven functional connectivity approach to study interactions in a system (LGN-V1) which thus far has not been studied in detail in the spectral domain (in alert animals). In Chapter 8, a unifying framework is outlined which makes further predictions that could be used to inform future experimental and modeling work.
95
Chapter 3: Gamma- and beta-synchronized corticocortical networks mediate bottom-up and top-down processing1
Abstract The cerebral cortex is hierarchically organized, with a given level receiving both bottom-up and top-down inputs. While bottom-up inputs determine the characteristics of the classical receptive field, top-down inputs are thought to provide contextual guidance. However, the mechanisms by which these two canonical information streams interact remain largely unknown. To gain access to multiple hierarchically separated areas simultaneously, two monkeys were implanted with large-scale, high-density electrocorticography grids, thereby combining millisecond temporal and millimeter spatial resolution with coverage of large parts of one hemisphere. Here, I describe an analysis that reveals structured networks of oscillatory activity, and shows that a given neocortical area can synchronize simultaneously to distinct inter-areal networks at different frequencies. Beta-band synchronization mediated top-down influences and gamma-band synchronization mediated bottom-up influences. Furthermore, these synchronization-mediated influences are enhanced when they convey behaviorally relevant information. These findings suggest that oscillations at distinct frequencies
1 Bastos, A.M. (*), Bosman, C.A. (*), Schoffelen, J.M. (*), Oostenveld, R., Rubehn, B., Stieglitz, T., De Weerd, P., Fries, P. (in preparation) (*) Equally contributing authors
96
have distinct functions, and may functionally segregate top-down from bottom-up signaling through beta and gamma frequencies, respectively.
Introduction Brain-wide networks operating at a millisecond timescale are thought to underlie our cognitive functions, but due in large part to methodological limitations, have not yet been characterized in any detail. Brain imaging studies based on hemodynamic signals support the existence of brain-wide functional networks, but have only visualized such networks at low temporal resolution and have not linked these networks to underlying neurophysiological mechanisms (Fox et al., 2005). Neurons and areas within these networks likely cooperate through rhythmic synchronization in multiple frequency bands (Engel et al., 1991; Roelfsema et al., 1997; Von Stein et al., 2000; Varela et al., 2001; Fries, 2005; Buschman and Miller, 2007b; Pesaran et al., 2008; Gregoriou et al., 2009; Canolty et al., 2010; Bosman et al., 2012). However, limitations of current recording methods have restricted our ability to detect and investigate these putative brain-wide synchronization networks (Schoffelen and Gross, 2009; Hipp et al., 2012). In order to study the contribution of corticocortical synchronization networks to cognitive function, a method is needed to observe their spatial topographies, frequencies, directions of information flow and modulation under various behavioral contexts. While some of these properties of brain-wide networks have been observed with traditional brain recording techniques, the limitations of each method (see Figure 1, Chapter 2) has 97
made it difficult to observe them simultaneously. This in turn makes it impossible to observe the relations among those properties. To overcome these limitations, we implanted two monkeys with high-density, large-scale electrocorticography (ECoG) grids (Rubehn et al., 2009; Bosman et al., 2012), and measured neuronal population activity as local field potentials (LFPs) during performance of a visual attention task. This enabled us to quantify oscillatory interactions between all possible pairs of contacts spanning a large coverage, from V1 to FEF. To quantify the presence of non-directed oscillatory synchronization, we calculated coherence between all bivariate pairs of contacts. This revealed two spatially distinct networks – one in the gamma band and the other in the beta band. We quantified directed frequency-specific interactions between the networks by focusing on three areas, and this revealed that gamma-band influences were mostly bottom-up and beta-band influences were mostly top-down. Furthermore, we tested whether the strength of interactions between these areas varied as a function of attention, and we found that both beta and gamma-band directed influences were enhanced under directed attention.
Materials and Methods All procedures were approved by the ethics committee of the Radboud University Nijmegen, (Nijmegen, The Netherlands). Data analysis was done using Matlab (The MathWorks, MA) and the FieldTrip toolbox(Oostenveld et al., 2011).
98
Experimental paradigm The monkeys performed a visual spatial attention task. After touching a bar, the acquisition of fixation, and a pre-stimulus baseline interval of 0.8 seconds, two isoluminant and iso-eccentric stimuli (drifting sinusoidal gratings, diameter: 2 degrees, spatial frequency: 0.4-0.8 cycles/degree; drift velocity: 0.6 degree/s; resulting temporal frequency: 0.24-0.48 cycles/s; contrast: 100%) were presented on a CRT monitor (120 Hz refresh rate non-interlaced). One of the stimuli was presented in the lower right visual hemifield, contralateral to the recorded hemisphere, and the other stimulus was in the upper left visual hemifield. In each trial, the light grating stripes of one stimulus were slightly tinted yellow, the stripes of the other stimulus were tinted blue, assigned randomly. After a variable amount of time (1-1.5 s in monkey K, 0.8-1.3 s in monkey P) the color of the fixation point changed to blue or yellow, indicating the stimulus with the corresponding color to be the behaviorally relevant one. A trial was considered successful and the monkey was rewarded when it released the bar within 0.15-0.5 s of a change in the cued stimulus, ignoring the non-cued stimulus. In monkeys K and P, 94% and 84% of bar releases, respectively, were correct reports of changes in the relevant stimulus. The stimulus change consisted of the stimulus’ stripes undergoing a gentle bend, lasting 150 ms (Figure 2a). Each of the stimuli could change at a random time between stimulus onset, and 4.5 s after cue onset. Trials were terminated without reward when the monkey released the bar outside the response window, or when it broke fixation (fixation window: 0.85 degree radius in monkey K, 1 degree radius in monkey P). In ten percent of the trials, only one of the two stimuli was presented, to characterize responses to contralateral versus ipsilateral stimulus presentation (Figure 3 for both monkeys). 99
Some recordings were devoted to the mapping of receptive fields (RFs), using 60 patches of moving grating (Figure 1). Receptive fields were well-defined (Figure 1d) and stable across recording sessions (Figure 1e). Neurophysiological recordings Neuronal signals were recorded from the left hemisphere in two monkeys using subdural ECoG grids consisting of 252 electrodes (1 mm diameter), which were spaced 2-3 mm apart (Rubehn et al., 2009).The grids were implanted subdurally in two macaque monkeys under aseptic conditions with isoflurane anesthesia (Rubehn et al., 2009; Bosman et al., 2012). Intra-operative photographs were acquired for coregistration with the anatomy. Signals were amplified, low-pass filtered at 8 kHz and digitized at 32 kHz with a Neuralynx Digital Lynx acquisition system. Local Field Potentials were obtained by lowpass filtering at 250 Hz and downsampling to 1 kHz. Data recording sessions spanned 5 months in monkey K and 11 months in monkey P, and for this experiment yielded 8 sessions in monkey K and 13 in monkey P. Data analysis general Bipolar derivations were computed from neighboring electrodes by subtracting the time-series of immediately neighboring electrodes from each other, in order to enhance the spatial specificity of the signals and to remove the common recording reference. We refer to the bipolar derivatives as “sites”. This resulted in a total of 211 sites (=bipolar derivations) in monkey K (6 sites identified as bad) and 203 sites in monkey P (15 sites were identified as bad). The analysis used the time period from 0.3 s after the cue onset 100
(the change in the fixation point color) until the first change in one of the stimuli only for trials with a correct behavioral report. For each trial, this period was cut into nonoverlapping 0.5 s data epochs. For each site and recording session, the data epochs were normalized by their standard deviation and subsequently pooled across sessions. Power line artifacts at 50, 100 and 150 Hz were estimated and subtracted from the data using a Discrete Fourier Transform (DFT) filter, and epochs containing other artifacts were removed with a semi-automatic artifact rejection protocol. To avoid systematic differences in trial numbers and/or fixation position across attention conditions, we performed a stratification procedure that equated both the number of trials, and the distribution of eye positions. This resulted in 1,746 data epochs per attention condition for monkey P, and 1,937 data epochs per attention condition for monkey K. We report results after stratification. Results without stratification were not qualitatively different. Spectral Analysis Data epochs were multitapered using three Slepian tapers (Mitra and Pesaran, 1999) and Fourier-transformed. The epoch lengths of 0.5 s resulted in a spectral resolution of 2 Hz, the multitapering in a spectral smoothing of ±4 Hz. The Fourier transforms were the basis for calculating the power and coherence spectra, and for calculating the GC influence spectra through non-parametric spectral matrix factorization (Dhamala et al., 2008). We defined individual beta and gamma bands in each monkey by using a peak detection algorithm that fitted parabolas to the all-to-all coherence spectrum (Figure 12), and taking the full width at half maximum. This resulted in the following 101
bands: in monkey K, the gamma band was 65-83 Hz, and the beta band was 12-24 Hz. In monkey P the gamma band was 50-74 Hz, and the beta band was 6-20 Hz. In both monkeys, the gamma and beta band peaks were the only reliably detected peaks of the all-to-all coherence spectrum. Region of Interest (ROI) definition Electrode sites were assigned to different areas based on their positions in the surgical photographs relative to sulcal landmarks (Saleem and Logothetis, 2007). In monkey K, this yielded 37 sites in V1, 12 in V4, 9 in area 7A (Figure 8). In monkey P, this yielded 50 sites in V1, 14 in V4, 10 in 7A (Figure 8). Our results were robust to moderate changes of ROI definition criteria. Statistical testing Throughout, statistical testing employed non-parametric approaches, which avoid assumptions about the underlying distributions. We used a sign test to determine significant asymmetries in the directionality of GC influences between the V1, V4, and area 7A ROIs. For each combination of ROI pairings, we tested whether the distribution of GC influences across all inter-areal site pairs was consistently greater in the top-down versus bottom-up direction (or vice-versa), separately for the beta and gamma bands. The effect of attention on GC influences between the V1, V4, and area 7A ROIs was statistically tested with a permutation test (Maris and Oostenveld, 2007). To create the distribution under the null hypothesis that GC influences did not differ between attention conditions, we computed the difference in GC influence after randomly 102
allocating data epochs to the two experimental conditions, using 1,000 randomizations. We reject the null hypothesis and declare a difference in GC influence as significant if the probability of observing the difference under chance is less than 0.05. The same permutation test was used to test for significant power changes with attention. In all cases we performed a 2-sided test.
Results Electrodes in V1 showed well-defined visual receptive fields (Figure 1) strongly suggesting that a given electrode assesses neuronal activity primarily from the immediately underlying cortex, and that ECoG electrodes realized high spatial resolution.
103
Figu ure 1. a, Reendering of tthe brain off monkey P. Lines indiccate the coveered cortical area and major sulci. Dots indiccate the 252 subdural ellectrodes. b,, Power chaanges for vissual mulation conntralateral veersus ipsilateral to the E ECoG grid on o the left hemisphere. c, stim Stim mulation possitions (a tottal of 60) ussed during thhe receptivee field mappping task. d,, Receeptive fieldss for chosenn electrodes highlightedd in green inn panel a. e, Receptive fields f of tw wo sessions spaced 2 months m apartt, demonstraating stabilitty of receptiive fields annd thereeby of electtrode positioon.
104
Data weere recordedd while monnkeys perforrmed a task iin which theey monitoreed visuual stimuli (ssee Figure 2 and Materiials and Meethods for taask details).
Figu ure 2. a, Schhematic illuustration of task t design.. b, All posssible configuurations of cue c and stimuli. Thee stimulus ccolor and cuue color assiignments weere both couunterbalanceed acrooss trials. c, Experimentt events. Baaseline winddow was useed for stimullation to basseline anallysis (see Figure 3). A ttrial could be b a target fiirst or distraactor first triial with equaal 105
probbability. Triaals were connsidered corrrect if the m monkey releeased the levver betweenn 150 to 5000 ms after the target changed. Visual stimulation reliably enhhanced gam s mma power in both V1 and a V4 (Figuure 3) and reduuced beta poower in V4.
106
Figure 3. a, Percent change contrast for stimulation contralateral vs. ipsilateral, displayed topographically in the beta (12-24 Hz) and b, gamma ranges (65-83 Hz). c-d, Power change spectra for visual stimulation contralateral versus ipsilateral for example sites in area 7A, V4, and V1. The lines indicate the mean power ±2 standard errors of the mean (estimated with a jackknife procedure; due to small SEM, the lines are for the most part not separately visible). The color of the box surrounding each spectrum corresponds to the highlighted sites on the topographies. The gamma and beta bands are highlighted in light gray and light yellow, respectively. For monkey K, the contralateral stimulus was relatively close to the vertical meridian, resulting in gamma-band activation towards the posterior end of V4. f-j, same as a-e, but for monkey P
We first selected three sites (site = bipolar derivation from adjacent electrodes, see Experimental Procedures) in early visual (area V1), intermediate visual (area V4), and higher-order parietal cortex (area 7A). These sites are all in well-defined parts of the visual system (Saleem and Logothetis, 2007), that are well-covered by our ECoG grid in both monkeys, and have a clear hierarchical relationship to each other (Felleman and Van Essen, 1991). To investigate their interactions, we calculated inter-areal coherence spectra between these sites (Figure 4c for monkey K, see Figure 5c for monkey P). Dominant features in these spectra were peaks in the beta- and the gamma-frequency bands. We selected the V4 site as a seed and calculated coherence between this seed and all other sites in the grid. In Figure 4d, we color code each site in the grid according to its beta coherence to the V4 seed, and refer to it as the beta-coherence topography of the V4 seed. To exclude coherence values that could be contaminated by volume conduction, we mask coherence values immediately surrounding the seed. This topography reveals: a beta-coherence network that reaches up to frontal cortex and thereby across the entire part of the brain covered by our grid; is nevertheless spatially structured with a fine spatial 107
scale; appears topographically meaningful by respecting sulcal boundaries; links the V4 site to parietal and frontal regions. Next, we investigated the beta-coherence topography of the sites in areas V1 and 7A (Figure 4e and 4f for monkey K; see Figure 5e and 5f for monkey P). Strikingly, these topographies revealed beta-coherence
108
109
Figure 4. a, Rendering of the brain of monkey K. Lines indicate the covered surface and the major sulci. Dots indicate the 252 subdural electrodes. b, Enlarged layout of the grid with the covered cortical areas and major sulci labeled. Sulci abbreviations, from posterior to anterior: lus: lunate sulcus, ios: inferior occipital sulcus, sts: superior temporal sulcus, ips: intraparietal sulcus, cs: central sulcus, as: arcuate sulcus, sas: spur of the arcuate sulcus. c, Coherence spectra between selected sites in V1, V4, and area 7A. The beta (12-24 Hz) and gamma (65-83 Hz) bands are highlighted in yellow and gray, respectively. The V1 and V4 sites that we selected were amongst the highest stimulusdriven sites (see Figure 3). d-f, Topographical plots of the beta coherence network with respect to seeds in V4, V1, and 7A in monkey K. g-i, Topographical plots of the gamma coherence network with respect to the same seeds in V4, V1, and 7A in monkey K. See also Figure 5 for monkey P.
networks that shared much of the topographical structure with the beta-coherence network of the V4 site. Next, while keeping the same three sites, we investigated their coherence topographies in the gamma-frequency band (Figure 4g-i for monkey K; see Figure 5g-i for monkey P). These topographies revealed gamma-coherence networks that: were mostly different from the beta-coherence networks of the same sites; shared much of their topographic structure across the three sites; linked these sites to the visual occipital areas and dorsal parietal cortex; resembled to some degree the topographies of stimulus induced gamma-power change (Figure 3 for both monkeys).
110
111
Figure 5. Same as figure 4 but for monkey P. Within a given frequency band, coherence topographies were similar across seeds (Figure 4 and 5). This suggests that for a given frequency band, different seeds might generally have similar coherence networks. To test this and reveal the putative generalized beta- and gamma-band networks, we averaged coherence topographies across all seeds, separately for the beta- and gamma-bands. We refer to the average gamma- or beta-coherence topography as the gamma- or beta-strength topography, in analogy to the graph-theoretical notion of strength: in a graph with graded connection weights, the strength of a given node is the average of all its connections (Bullmore and Sporns, 2009) (Figure 6a and b for monkey K; see Figure 7a and b for monkey P). The strength topographies contained the dominant spatial structure that had already been evident in the coherence topographies of the three example seeds. This suggests that the spatial organization of the networks is present, to an extent, in a large number of all seeds. To highlight where the beta and gamma networks converge, we superimpose the gamma and beta strength topographies and color-code their conjunction in blue in Figure 6c for monkey K (Figure 7c for monkey P).
112
Figu ure 6. a, Toopographicall distribution of the beta (12-24 Hzz) strength network n in monnkey K. b,Toopographicaal distributioon of the gaamma (65-83 Hz) strenggth networkk in monnkey K. c, B Beta and gam mma strengtth networks and their coonjunction. See colorm map for scalee.
113
Figu ure 7. Samee as figure 6 but for monnkey P.
In both monkeys, m thhe gamma network n dom minates in V1, V the beta nnetwork in areaa 7A, and booth networkss converge in i V4. For ffurther analyysis, we deffined these aareas as ouur regions oof interest (R ROIs, see Fiigure 8 for R ROI definitiions) and exxplored the interi areaal interactionns between tthe ROIs.
114
Figu ure 8. a,b, Region R of innterest definnition for V11, V4, and aarea 7A for bboth monkeeys baseed on the atllas by Saleeem and Logoothetis, 20077.
mically, thesee areas havee a clear hierrarchical rellationship: V V4 is an Anatom interrmediate vissual area, abbove V1 andd below areaa 7A (Fellem man and Vaan Essen, 19991; Baroone et al., 20000). V4 likkely receivees top-down influences from area 7A 7 (Neal et aal., 19900; Markov eet al., 2011), and at the same time bbottom-up influences frrom V1 (Baarone et all., 2000; Maarkov et al., 2011). To iinvestigate w whether thesse counter-sstreaming influuences map onto the tw wo identifiedd strength neetworks, wee quantified frequencyspeccific Grangeer-causal (G GC) influencces for all thhree inter-areeal ROI pairrings. The G GC influuence of tim me series A oonto time seeries B quanntifies the vaariance in B that is not expllained by thhe past of B but by the ppast of A (D Ding et al., 2006). 2 This aanalysis revvealed a strriking doublle dissociatiion: While G GC influencces in the gaamma-band were bottom m-up, GC influences iin the beta-bband were m mainly top-ddown (Figurre 9 for bothh monkeys; sign 115
test performed separately for each inter-areal ROI pairing and frequency band, P