1712
JOURNAL OF COMPUTERS, VOL. 7, NO. 7, JULY 2012
I/O Behavior Characterizing and Predicting of Virtualization Workloads Yanyan Hu, Xiang Long, Jiong Zhang Department of Computer Science, Beihang University, Beijing, China Email:
[email protected],
[email protected],
[email protected]
Abstract— In virtual machine system, different workloads are consolidated into a single platform to fully utilize the hardware resources. However, the diversity and strong variation of applications always make it difficult to optimize the resource allocation and thus reduce the system performance and efficiency. Therefore, how to accurately analyze and predict the runtime behavior of applications has become an important basement for virtual machine system optimization. In order to study the characteristic and predictability of virtualization applications, this paper proposes a dynamic behavior characterizing and predicting methodology under Xen virtual machine. We analyze the characteristics of several typical virtualization workloads with fine temporal granularity and apply several online predictors to predict application’s runtime I/O behavior. Experiment results demonstrate that the I/O behavior of virtualization workloads can be efficiently predicted by using proper predicting model and configuration. With this result, we further investigate the possibility of virtual machine scheduler optimizing based on I/O behavior characterizing. Several important issues are discussed including I/O computing jobs isolation through asymmetric scheduling, VM dynamic migration based on execution phase tracking and co-scheduling of multiple cooperative virtual machines. Preliminary test results demonstrate that this approach could efficiently reduce the performance degradation caused by scheduling competition in virtual machine system. Index Terms— Virtualization, I/O, behavior analysis, predict, scheduler
I. I NTRODUCTION Virtualization technology offers many advantages to modern computing environment. By running multiple virtual machines (VMs) in a shared physical platform, virtualization enables high utilization of hardware resources. Many features such as live migration and easy restart of VMs also significantly improve manageability of largescale computing system. In virtualization environment, different traditional server applications are consolidated into a single physical platform to fully utilize the hardware resources. These workloads always have different runtime behavior and resource requirement. However, current virtual machine schedulers usually employ global-symmetric algorithms to force different workloads to compete for the CPU resources disorderly and thus cause serious performance interference [1], [2] which significantly reduce the system performance and efficiency. This work was supported by the National High Technology Research and Development Program (”863”Program) of China (2007AA01Z118).
© 2012 ACADEMY PUBLISHER doi:10.4304/jcp.7.7.1712-1725
In order to address this problem, previously proposed works have tried to classify applications into different categories(such as I/O-intensive and CPU-intensive ones) and encapsuled them into individual virtual machines [3], [4]. This approach attempts to employ the isolated computing environment provided by VMM to reduce the resource competition between different applications. However, most virtualization workloads contain I/O and computing operations simultaneously and their behavior always vary over time while exhibit complex characteristics. In this case, traditional workload classification at virtual machine granularity would not be accurate and flexible enough to reflect the actual resource requirement of different applications promptly. It could make the resource allocation strategy become either over-provisioned or overloaded and thus cause performance regression. Therefore, it would be challenging to properly optimize the resource allocation at virtualization environment. A possible solution for this issue is classifying applications at a finer temporal granularity (e.g. couples of scheduling periods) and dynamically allocate computing resources to specific workloads based on their current running states. In this case, the scheduler must be able to perceive the state variation of applications and adjust its resource allocation strategy promptly. Therefore, accurately characterizing and predicting the runtime behavior of applications would become a pivotal problem for intelligent and self-adaptive virtual machine scheduler design. Most of current research works about virtualization workloads concentrate on the performance analysis and scheduling algorithm optimization [5], [6], [7], [8]. The study of fine-granularity application behavior analysis has not been carried out thoroughly. At the same time, although application behavior analysis and prediction has been a common and efficient way to improve the efficiency of hardware system [9], [10] or to optimize the performance of traditional programs [11], [12], [13], none of these presented works specifically dealt with virtualization environment. Therefore, in this paper we propose a runtime behavior characterizing and predicting methodology for virtualization environment. We first build a test bed based on Xen virtual machine and collect the runtime information of several typical virtualization applications. Then we characterize their time-varying behavior and explore the predictability from several aspects including periodicity, state-transition trait and cooperative relationship cross
JOURNAL OF COMPUTERS, VOL. 7, NO. 7, JULY 2012
1713 Isolated Driver Domain
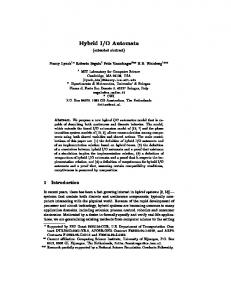
different virtual machines. After that, we describe several online predictors and compare their precision when they are applied into different cases. Test results demonstrate that the I/O state variation of applications can be efficiently captured and predicted by using proper predicting model and configuration. Based on these results, we further exploit the possibility of virtual machine scheduling optimization using I/O behavior predicting and execution phase tracking. We first construct a asymmetric scheduling framework under Xen-4.1.0 virtual machine and deploy two individual cpu subsets to undertake I/O and computing jobs respectively. Then we try to track different execution phases of applications based on their I/O behavior prediction results and migrate VMs cross different cpu subsets if we decide the system performance could benefit from this scheduling adjustment. Several important issues are discussed including the method of execution phase tracking, topology optimization of cpupool allocation and co-scheduling of cooperative virtual machines. Preliminary test results demonstrate that this approach could efficiently efface the competition between I/O and computing jobs and then promote the system performance, especially for some communication-intensive applications. The contributions of this paper are mainly listed as follows. First, we propose a runtime behavior characterizing and predicting framework for virtualization environment. Second, we discuss several important issues that affect application behavior analysis and predicting. Finally, we exploit a possible methodology of virtual machine scheduler optimization based on I/O behavior predicting and asymmetric scheduling. The remainder of this paper is organized as follows. We first describe our test environment and method of runtime information collecting in section 2. Then we characterize the I/O behavior of several representative virtualization applications and discuss their predictability in section 3. After that, we compare several online predictors and discuss the principal of predictor selecting in section 4. We further investigate several important issues of virtual machine scheduler optimization based on I/O behavior predicting and provide some preliminary test results in section 5. We introduce some related work in section 6 and finally conclude with a discussion in section 7. II. RUNTIME I/O I NFORMATION C OLLECTING Our application behavior analysis work is based on Xen-4.1.0 virtual machine which applies an IDD(Isolated Device Domain) device model to manage its I/O devices [14]. In this model, a virtual frontend driver in a domainU communicates with a corresponding virtual backend driver residing in the isolated driver domain(always Dom0) and forwards I/O requests to a native device driver. The frontend driver and the backend driver notify each other by an I/O event through event channel mechanism which is a virtualization of hardware interrupt. Each time an I/O request or response is sent, an I/O event is pent in the corresponding event channel and then delivered into © 2012 ACADEMY PUBLISHER
Guest Domain (DomainU) response response I/O Ring
Application
request request
Response event delivering
Response event handling Event Channels
Backend
Request event handling
Frontend Request event delivering
Physical Device
Figure 1. IDD Model of Xen Virtual Machine
the target domain when this domain is scheduled next time. Therefore, in Xen virtual machine, the I/O event behavior could exhibit the characteristic of I/O jobs intuitively. Some other virtual machine systems such as KVM [15] and VMWare ESX [16] also have similar I/O structure although their device models may have a little difference. For example, VMWare ESX server does not have an individual driver domain and manages native device drivers by VMM itself. However, they also apply similar soft interrupt mechanism to notify the GuestOS about the I/O operation state. Therefore, characterizing the I/O behavior of applications through I/O event information could be an universal approach for most virtual machine systems. In this paper, we applied a monitoring tool [17] to collect the I/O event information of virtual machines dynamically. This information is later used to characterize and predict the runtime I/O behavior of applications. III. V IRTUALIZATION W ORKLOADS B EHAVIOR C HARACTERIZING A. Test Environment In this section, we will characterize the I/O behavior of several representative virtualization applications to set the stage for I/O state predicting. Our test covers two typical industry-standard benchmarks including TPC-W and NPB-MPI. We ran these two benchmarks under Xen virtual machine and recorded the I/O behavior of applications by collecting their I/O event information with a time granularity of 100ms. All of our experiments were performed in a x86 server which has an Intel Q9550 quad-core processor, 4GB DDRII-800 memory, double RTL8169 1000Mbps Ethernet NIC and Seagate 1TB SATA hard disk. We ran Xen-4.1.0 virtual machine and used Domain0 as driver domain. Both Domain0 and DomainU ran Debian6.0 Linux distribution with Linux2.6.32 kernel. B. I/O Behavior of Typical Server Consolidation Workloads NPB-MPI: NPB-MPI is an MPI implementation of the NASA Advanced Supercomputing (NAS) Parallel Benchmark (NPB) [18]. It is a small set of programs designed to help evaluate the performance of parallel supercomputers. The benchmarks, which are derived from
JOURNAL OF COMPUTERS, VOL. 7, NO. 7, JULY 2012
250 200 150 100 50 0
50
100 Time (s)
150
200
I/O event frequency (times/100ms)
I/O event frequency (times/100ms)
1714
250 200 150 100 50 0
500 400 300 200 100 0
50
100 Time (s)
150
200
200 100
150
200
I/O event frequency (times/100ms)
I/O event frequency (times/100ms)
300
100 Time (s)
80 60 40 20 60 Time (s)
80
100
120
(g) I/O behavior of EP program
I/O event frequency (times/100ms)
I/O event frequency (times/100ms)
100
40
20
15
20
15
20
300 200 100 0
5
10 Time (s)
400 300 200 100
0
5
10 Time (s)
(f) Result zoomed into 20s
120
20
15
400
(e) I/O behavior of CG program
0
20
(d) Result zoomed into 20s
400
50
15
500
(c) I/O behavior of SP program
0
10 Time (s)
(b) Result zoomed into 20s I/O event frequency (times/100ms)
I/O event frequency (times/100ms)
(a) I/O behavior of LU program
5
120 100 80 60 40 20 0
5
10 Time (s)
(h) Result zoomed into 20s
Figure 2. I/O behavior of NPB-MPI benchmark
computational fluid dynamics (CFD) applications, consist of five kernels and three pseudo-applications. In this test, we selected four benchmarks including LU, CG, SP and EP. Test results of other three benchmarks (MG, BT and FT) were excluded here because their have similar behavior. We used the Class C problem sizes to achieve a proper data scale and total running time and tested each benchmark using 4 parallel computing nodes with each of them had one VCPU and 512MB memory. The I/O event frequency variation of each individual VM was recorded during the execution. We only demonstrate the result of primary node(DomainU 1) here because other computing nodes have very similar I/O behavior. We will discuss the similarity and correlation between the I/O behaviors cross different computing nodes in detail in section III.C. As illustrated in Figure 2, these programs exhibit sig© 2012 ACADEMY PUBLISHER
nificantly different I/O behaviors during their execution. For LU benchmark, I/O intensity keeps in lower level in most time while high-intensity I/O operations appear periodically. Conversely, the I/O intensity of CG benchmark always keeps in high level and only companied by transient low-intensity I/O load states. For SP benchmark, high and low intensity I/O load states appear alternately and the variation does not exhibit noticeable periodicity. The EP benchmark has little I/O operations during its entire execution. This behavior distinction actually reflects the communication activity difference between these parallel benchmarks. LU benchmark applies SSOR algorithm to solve regular-sparse lower and upper triangular systems. Computing nodes perform fine-granularity point-to-point communication during each iteration and thus cause con-
JOURNAL OF COMPUTERS, VOL. 7, NO. 7, JULY 2012
0
0.5
1
1.5
2 2.5 3 3.5 Frequency (cycles/sec)
4
1715
4.5
5
0
0.5
1
1.5
(a) LU program
0
0.5
1
1.5
2 2.5 3 3.5 Frequency (cycles/sec)
2 2.5 3 3.5 Frequency (cycles/sec)
4
4.5
5
4
4.5
5
(b) SP program
4
4.5
5
(c) CG program
0
0.5
1
1.5
2 2.5 3 3.5 Frequency (cycles/sec)
(d) TPC-W front-tier
Figure 3. Periodograms of NPB-MPI and TPC-W benchmarks
tinuous but low-intensity I/O operations. The periodic high-intensity I/O states are caused by data transmission at the joint of two iterations since result data need to be synchronized before starting the next step calculation. CG benchmark uses a conjugate gradient method to compute an approximation to the smallest eigenvalue of a large, sparse, symmetric positive definite matrix. Different from LU, it performs intensive irregular collective communication cross different nodes when executing sparse-matrix vector multiplication during each loop. Therefore, continuous high-intensive I/O operations are observed during the execution and periodic low-intensive I/O states always appear at the end of each iteration. SP benchmark solves multiple independent systems of non diagonally dominant scalar pentadiagonal equations. This program is used to test the balance cross communication and computing. Its communication is mainly composed of irregular point-topoint long message transmission and each process can perform computing work as soon as it receives data from other processes. Therefore, low-intensity I/O load states are always followed by irregular high-intensity I/O operations which demonstrate the transmission of messages during the execution. EP benchmark, as the acronym suggests, is an ”embarrassingly parallel” kernel. It requires virtually no inter-processor communication and only coordination of pseudo-random number generation at the beginning and collection of results at the end. Therefore, it produces little I/O operations during its entire execution. We further apply fourier transform to analyze the periodicity of different programs. Using 100ms sampling period, the range of frequency discernible is 0 to 5 cycles/sec according to the Nyquist rate. As illustrated in Figure 3, LU and CG programs exhibit strong periodicity just as our intuitively observation. This periodicity can be attributed to the execution iteration loops of these two © 2012 ACADEMY PUBLISHER
programs. For example, the frequency spectrum peak of 0.2 cycle/sec for LU and 0.29 cycle/sec for CG exactly match the iteration periods illustrated in figure 3(b)(about 5s, total 250 iterations during 1283s execution) and figure 3(f)(about 3s, total 75 iterations during 247s execution). This strong structural regularity could significantly facilitate the following I/O state predicting. By contrast, SP’s periodogram is a little unexpected. There is a peak value that reflects an implicit periodicity of 0.32 cycles/sec which is difficult to perceive from temporal behavior intuitively while could match the iteration period of SP program (total 400 iterations during 1473s execution). This implicit periodicity could also promote the precision of history predictors. We will demonstrate the effect of application’s periodicity for I/O state predicting through several experiments in section IV. TPC-W: TPC-W benchmark is a double-tier application based on the TPC-W standard [19] for an online bookstore. It is usually used to evaluate the performance of commercial servers. A TPC-W implementation always requires two software modules to support the test system and drive the benchmark: an frontend application server handling user sessions and a backend database server keeping merchandize information. In our test, we applied a TPC-W-NYU [20] test suit which is a fully J2EE compliant application to setup our test environment. We used JBoss 3.2.7 [21] as the frontend application server and MySQL 4.1 [22] as the backend database server. We deployed these two tiers into individual virtual machines which both have two VCPUs and 1GB memory allocation. Then we used the workload generator provided by TPC-W-UVA [23] to simulate multiple concurrent browser clients accessing the application from another physical client in the same local network. We ran shopping mix test for an hour with 100 parallel sessions and recorded the I/O event frequency variation of
JOURNAL OF COMPUTERS, VOL. 7, NO. 7, JULY 2012
1000 800 600 400 200 0
50
100 Time (s)
150
200
I/O event frequency (times/100ms)
I/O event frequency (times/100ms)
1716
800 600 400 200
0
2
600 400 200 150
200
I/O event frequency (times/100ms)
I/O event frequency (times/100ms)
800
100 Time (s)
8
10
8
10
(b) Result zoomed into 10s
1000
50
6 Time (s)
(a) I/O event frequency of front-tier
0
4
800 600 400 200
0
2
4
6 Time (s)
(c) I/O event frequency of back-tier
(d) Result zoomed into 10s
Figure 4. I/O behavior of TPC-W benchmark
both frontend and backend virtual machines with 100ms sample period. Test result is illustrated in Figure 4. Different from NPB benchmarks, the I/O event frequency of TPC-W test servers exhibit strong variation during the test. We analyze the periodograms of its I/O behavior and there are a cluster of peaks at high frequencies depicted in figure 3(d) which demonstrate a strong aperiodicity. This phenomenon is mainly caused by the diversity of online transaction server’s I/O operations which are composed of customer network access for the web server, disk operations for the database server and inter-VMs communication between frontend and backend tiers. On the other hand, the access requests from parallel browser clients also have several different types including browsing, ordering and shopping and the behavior of customers always have strong randomness. Therefore, intuitively it would be difficult to distinguish the regularity of I/O behavior of TPC-W severs. However, when we zoom our test result into a 10 second duration which includes 100 samples, we find the I/O load intensity will always stay in a stable state for several continuous sample periods. Therefore, although we may not be able to get as much benefit from the periodicity of TPC-W application as we did from NPB programs, we could still predict the I/O load states of TPC-W severs correctly and differentiate different execution phases if using a proper configuration. C. I/O behavior correlation cross virtual machines Besides the variation and periodicity distinction of different benchmarks, we also observed some noticeable relevance characteristic between multiple cooperative virtual machines. For instance, we zoom the test result of LU program into 10 seconds which contains 100 samples and © 2012 ACADEMY PUBLISHER
compare the variation detail of I/O behaviors of 4 computing nodes. As illustrated in Figure 5a, there are strong similarity between them. The only noticeable difference is the peak value of node1 at 3.7 second is not as high as three other ones and the intensity peak of node1 at 9th second appears about one sample period(100ms) later than three others. Similar phenomenon can be observed from other NPB-MPI benchmarks and front-tier and backtier of TPC-W benchmark. In order to provide a more objective measurement of this similarity, we compare the I/O behavior periodograms of these cooperating VMs and try to match the peak frequencies of each virtual machine to indicate how strongly the periodicity is related across cooperating virtual machines. As exemplified from figure 5b to figure 5e, although the relative amplitude of the peaks vary across different VMs, the approximate match rate across all cooperative VMs is on average of more than 80%. We also calculate the cross-correlation coefficient and get the similar result. This high matching rate indicates that the periodicity of I/O behavior is shared across all VMs which cooperate together during their execution. This phenomenon can be easily understood. For NPB-MPI test, several virtual machines were actually configured as a virtual cluster to undertake different threads of the same parallel program. These VMs communicate with each other to transfer intermediate data during the execution. Therefore, the network I/O behaviors of these VMs always exhibit strong dependency with each other. Similar situation also exists in TPC-W test since the web server and database server need to coordinate together to accomplish a customer request. This conformity could not only help us to enhance traditional predictors with precision and efficiency but also provide some possibility to optimize the virtual machine scheduling based
JOURNAL OF COMPUTERS, VOL. 7, NO. 7, JULY 2012
1717
I/O event frequency (times/100ms)
300 node1 node2 node3 node4
250 200 150 100 50
0
1
2
3
4
5 Time (s)
6
7
8
9
10
(a) I/O behaviors of LU program cross each computing node
0
1 2 3 4 5 Frequency (cycles/sec)
(b) Periodogram of node1
0
1 2 3 4 5 Frequency (cycles/sec)
(c) Periodogram of node2
0
1 2 3 4 5 Frequency (cycles/sec)
(d) Periodogram of node3
0
1 2 3 4 5 Frequency (cycles/sec)
(e) Periodogram of node4
Figure 5. Correlation of I/O behavior of cooperating VMs
on the correlation cross multiple VMs. We will elaborate our cross-VMs predicting mechanism in section IV.C and VM-Grouping scheduling optimization in section V.C. D. Disk and network I/O In above discussion, we did not explicitly distinct disk and network I/O. Actually, for NPB-MPI benchmark, only a little disk I/O operations are performed since reference data need to be loaded at the beginning of program execution. Most I/O operations are caused by network communication which transforms intermediate data cross cooperative virtual machines. This characteristic is very common in most network-based HPC applications. Compared to NPB benchmarks, the component of I/O operations for TPC benchmark is more complex. Since the web sever and database sever are deployed in individual VMs, the I/O operations of front-tier VM are almost completely caused by network communication while the back-tier VM needs to perform some disk I/O operations to load commodity and customer information from database. However, with the test running, the frequency of disk I/O operations of back-tier gradually reduced. This is because only a small quantity of commodity and customers information are deployed in database sever during our test and thus most of them can be cached into the memory. In practical use, the system might have no enough memory to cache all these data and periodic disk I/O operations would be unavoidable. In this case, we should cautiously distinguish these two kinds of I/O operations since they have totally different characteristic. © 2012 ACADEMY PUBLISHER
However, since the I/O intensity of disk access is much lower then the one of network communication in our study cases, we did not treat them separately in this paper. Actually, we think network I/O should have more influence to the performance of current virtualization-based applications since most of them are deployed through network. Most of current research works also proved that network latency is a critical issue that limits the perform of HPC applications under virtualized and cloud environment [24], [25]. On the other hand, compared to network transmission, the performance of disk access actually suffers much less from scheduling competition because of the existence of disk cache. Current research works about disk I/O mostly focused on the disk bandwidth allocation and Qos mechanism providing [7], [26]. Therefore, in this paper, we just concentrate our scheduling optimization on the promotion of network capacity and we will discuss this issue in detail in section V. E. summary In summary, our characterization finds that the I/O behavior of virtualization workloads have significant variability even at a coarse granularity. This variation actually reflects the running and communication characteristic of different applications. Some workloads such as NPB benchmarks exhibit strong periodicity because of their structural parallel programming paradigm. Therefore, it would be easy to accurately predict their I/O states and then provide some optimization for virtual machine
1718
JOURNAL OF COMPUTERS, VOL. 7, NO. 7, JULY 2012
scheduling. However, some other applications such as TPC-W servers have noticeable randomness for their I/O behavior. This irregularity could induce serious difficulty for our I/O state predicting and thus prevents further scheduling optimization. In the next section ,we will propose our methodology of I/O behavior predicting and introduce several typical predicting models and compare their performance for different applications.
Figure 2 and Figure 4, the amplitude of fluctuation always keeps under 50times/100ms when the I/O frequency keeps in stable state. Therefore, in this paper, we encode history I/O event frequency values at a precision of 50 times/100ms (i.e., a frequency value of 25times/100ms will be converted to state(1) while 125times/100ms will be converted to state(3)). We have experimentally verified that this configuration provides the best trade-off between sensitivity of state transition and predictor efficiency.
IV. I/O B EHAVIOR P REDICTING Currently, there have been a large number of studies that attempt to predict program behavior based on their execution information. Most of them classify the execution of the program into different states where each state is defined as a region of a program with relatively stable behavior [11], [27]. In this paper, we also adopt this way to predict I/O behavior of virtualization applications. We try to dynamically identify different I/O load states of workloads based on their I/O event frequency and then provide some guide for execution phase tracking and further scheduling decision. In this section, we first describe some important issues that affect the I/O behavior prediction and then introduce several online predictors which are applied to our study cases. We also discuss the behavior similarity between multiple cooperative virtual machines and propose a cross-VMs mechanism to enhance traditional predictors. A. Configuration of temporal and spatial sampling There are two important factors that affect the I/O behavior predicting: 1) the period of temporal sampling 2) the precision of spatial sampling. Ordinarily, finegranularity temporal sampling could provide more variation details while coarse-granularity temporal sampling could filter noise more efficiently and reduce the overhead of information collecting and analyzing. In order to achieve a optimal configuration, we changed the temporal sampling period from 50ms to 500ms and compared the visibility variation of program’s I/O behavior. Test results demonstrate that the detail of I/O state transition could be sufficiently exposed with the sampling period of 100ms while avoid inducing too much noise which could lead to some unnecessary state-transitions. Therefore, in this paper, we select a temporal granularity of 100ms as the sampling period. Besides the temporal sampling period, the precision of spatial sampling is another pivotal factor that affects the prediction accuracy. In our test, the I/O load intensity is described by I/O event frequency value which is continuous on real number scope. Although some simple statistic predictors(such as Last Value and Average(N)) can directly work on these value sequences, we need to convert them into discrete state sequences before applying some history-based predictors such as discrete Markov model and run length encode(RLE) predictor. In this case, the converting precision should be sensitive enough to distinguish different I/O load states while avoid overenlarging the capacity of state space. As illustrated in © 2012 ACADEMY PUBLISHER
B. Predictors comparison and selection Simple Statistics predictor: The most basic predictor we considered is the Last Value predictor. A Last Value predictor assumes that the program executes in a stable phase and that the current behavior will repeat. The prediction for the next interval is simply the last measured value. More sophisticated predictors use histories of metric values to smooth out noise and isolated peaks. A typical and most common-used instance is the exponentially weighted moving average (EWMA) predictor. Compared to normal Average(N) predictor which chooses the average over the last N values, EWMA places more emphasis on the most recent data. An EWMA prediction for the value is computed as: (1 − α)xn + α¯ xn−1 where xn is the n-th metric value, x ¯n−1 is the EWMA over the first n-1 values, and α ≤ 1 is the filter constant that determines the relative weight of older values compared to more recent ones. Simple statistics predictors are always used in reactive systems and the time-delay is an inherent defect of them. Therefore, although they can achieve well precision when applied to some littlevariation cases, they cannot perceive the state transition promptly. Markov predictor: Markov model is a classic predictor which has been widely used in computer architecture to predict both prefetch address and branch. The basic idea behind it is the next state of the system is only related to the last set of states. A Markov chain is a sequence of random variables X1 , X2 , X3 , ... with the Markov property, namely that, given the present state, the future and past states are independent. The first step for inferring the Markov model is to establish the state space which in this paper is determined based on the I/O event frequency. The second step is to construct the rate matrix - the matrix containing the rates for transition from one state to another - which is calculated based on history state sequence. This transition probability matrix is finally used to predict the state of coming duration. An important defect of standard Markov model is that it is not sensitive to abrupt state changing. Its prediction is based on the transition matrix which comes from the specific state sequence of last intervals. For some applications such as LU and CG, there are many sections of stable behavior interspersed with periodic abrupt state transitions. In this case, the Markov model could make incorrect prediction.
JOURNAL OF COMPUTERS, VOL. 7, NO. 7, JULY 2012
Run Length Encode predictor: Run Length Encoding (RLE) predictor [11] is another classic predictor used in computer science field. It is commonly used to compress continuous stable states and predict abrupt but periodic state-transitions. The basic idea behind this predictor is using a run-length encoded version of the history to index into a prediction table. The table reference is a hash of the state value and the number of times that this state has occurred in a row. The lower bits of the hash function provide an index into the table while the higher bits provide a tag. Each predicting period, the tag will be checked. If there is a match, the value stored in the table entry will provide a prediction for the state of coming duration. If the tag match fail, the prior state is assumed to be the prediction result for next execution period which means no state-transition will happen. The hash table will be updated in two cases: (1)state value changes which means state-transition happens; (2)tag match which means a table entry need to be updated. In the first case, we directly insert a new entry into the hash table since we want to predict this state-transition before its next happening. Execution intervals where the same state continuously occurs will not be stored into the table since they will be correctly predicted as ”last phase ID” when the table lookup missed. In the second update case where a tag match happens, we update the value of this table entry because the observed run length may have potentially changed. Compared to standard Markov predictor, Run-length predictor yields more efficient history encoding for programs with successive intervals of stable behavior. It could efficiently compress the data size of continuous stable state while keeping enough sensitivity to phase transition. Therefore, it would be more appropriate for those applications which always stay in stable state while companied by periodic but abrupt phase changing. Predictors Comparison In order to evaluate the applicability of different predictors for virtualized applications, we test the precision of four different predictors including: 1)Last Value; 2)EWMA(10) filter (α = 0.3); 3)Order(1) Markov predictor; 4)Run-length encoded predictor. For both Markov and RLE predictors, we apply a history size of 100. We test the precision of predictors with both entire state predicting and state-transition predicting. The entire precision is tested through the predicting hit rate which demonstrates the matching degree between prediction results and the actual ones. The precision of state transition depicts the sensitivity and temporal accuracy of predictors for state changing. A prediction of state transition is thought to be correct only when both origin and coming state match the actual ones. We apply all these predictors on five different workloads including LU, CG, SP, EP programs from NPB-MPI benchmark and TPC-W benchmark. For NPB-MPI benchmarks, we only test the I/O behavior of primary node because all other nodes have similar results. For TPC-W benchmark, we test the I/O state variation of front-tier and back-tier VMs respectively. All results are illustrated in Table I and Table © 2012 ACADEMY PUBLISHER
1719
TABLE I. E NTIRE PREDICTING PRECISION OF STATE VALUE
LastValue EWMA Markov-S RLE-S Markov-C RLE-C
LU 85.9% 88.0% 94.0% 90.1% 95.2% 92.4%
SP 49.1% 65.4% 84.8% 75.2% 87.0% 80.7%
CG 89.9% 84.5% 90.6% 89.6% 93.1% 90.6%
EP 99.6% 99.6% 99.6% 99.6% 99.6% 99.6%
TPC1 38.0% 72.6% 79.6% 68.0% 86.3% 69.6%
TPC2 40.1% 75.1% 70.8% 70.0% 74.1% 73.3%
TABLE II. P REDICTING PRECISION OF STATE - TRANSITION
LastValue EWMA Markov-S RLE-S Markov-C RLE-C
LU N/A 28.1% 48.0% 63.3% 58.9% 78.7%
SP N/A 19.0% 48.2% 58.7% 57.1% 68.8%
CG N/A 34.0% 49.6% 65.9% 62.4% 78.7%
EP N/A N/A N/A N/A N/A N/A
TPC1 N/A 18.4% 46.6% 58.9% 54.1% 61.0%
TPC2 N/A 16.2% 46.7% 57.4% 52.8% 61.2%
II (standard Markov and RLE predictors are referred to as Markov-S and RLE-S while corss-VM enhanced ones are referred to as Markov-C and RLE-C respectively). As illustrated in Table I and Table II, different predictors exhibit significantly performance distinction. As expected, Last Value predictor has the worst precision for both entire state predicting and state-transition predicting because of its reactive manner. Compared to Last Value predictor, another simple statistic predictor EWMA has better performance. However, its state-transition predicting accuracy is much worse then the ones of Markov and RLE predictors(about 23% and 36% lower respectively). This is because simple statistic predictors always use immediate past behavior as representative of future behavior and thus cause serious time delay. Therefore, this kind of predictors would not be suitable for virtualization environment where programs’ hebavior always exhibit strong variability during their execution. Standard Markov predictor has better entire-state predicting precision then RLE predictor since the latter one has stronger history persistence which could cause some erroneous prediction of state-transition. However, its sensitivity of state changing also leads to a better accuracy of state-transition predicting. The average precision of standard RLE predictor for state-transition predicting is 60.8%, about 13 percents higher than the one of standard Markov predictor(47.4%). This difference is more noticeable in those cases where programs have stronger periodicity and more long-term stable phases which followed by abrupt I/O-intensity changing such as LU and CG benchmarks. Since our purpose of I/O behavior predicting is tacking different execution phases of applications and providing direction for virtual machine scheduler, incorrect state-transition prediction could cause false phase tracking result and then leads to irrational scheduling adjustment. Therefore, the precision of statetransition predicting is actually more important than the one of entire state predicting. In this paper, we apply RLE model as our predictor since it has the best precision of state-transition predicting in our study cases.
1720
C. Cross-VMs predicting In section III.C, we have exploited the fact that periodicity tends to be shared across multiple cooperative virtual machines. These VMs always take I/O state transition simultaneously although their I/O intensities might have some difference. Therefore, in this paper, we construct a cross-VMs mechanism through integrating the history information among multiple virtual machines to promote the precision and efficiency of traditional predictors. In our design, we gather all prediction results from multiple cooperative virtual machines at each predicting period. If most of them predict a coming state-transition, we will revise the prediction results of those VMs which predict to keep in a stable state and update their prediction values to the last state-transition result that actually happened(e.g. a prediction result of state-keeping around current state(2) will be revised to a state-transition to state(3) if last statetransition happened at state(2) is targeting to state(3)). If there are only two cooperative virtual machines, we will trace their predicting accuracy for state-transition and make prediction decision according to the one that has better precision history. We evaluate this cross-VM mechanism by applying it to Markov and RLE predictors. Test result demonstrates that the precision of state-transition predicting got an obvious promotion. The average precision improvement of all five benchmarks with two predictors is about 9.2%. On the other hand, we also observe some difference between the precision improvements cross different applications. The average precision improvements of MarkovC and RLE-C are 10.9% and 12.8% when they were applied to NPB-MPI benchmark, while the same ones of TPC-W benchmark are only 6.8% and 3.0%. This is because the cooperative virtual machines running NPB programs almost have no other I/O operations besides their inter-VM communications through network. In this case, virtual machine’s I/O behavior significantly depends on each others’. By comparison, the I/O behavior of TPC-W virtual machines are much more complex. Besides the network communication between two VMs, the web server also needs to interact with clients while the backtier sever needs to access database. This I/O operation variety increases the randomness of I/O behavior and thus reduces the consistency between two TPC-W virtual machines. In this case, the precision promotion benefits from cross-VM optimization is much less noticeable than the one of NPB tests. We also tried to use the prediction result of one virtual machine to predict the I/O states of other cooperative VMs. However, for some applications, the I/O load intensity could vary over different VMs although they have similar periodicity and state-transition characteristic. In this case, simply using the I/O intensity of one virtual machine to predict other one’s could cause serious mean error. Therefore, in this paper, we only apply the crossVMs mechanism to enhance the predicting of statetransition. © 2012 ACADEMY PUBLISHER
JOURNAL OF COMPUTERS, VOL. 7, NO. 7, JULY 2012
D. summary In this section, we introduce several typical online predictors and discuss several important issues about I/O behavior predicting. Our tests proved that the I/O load state of applications could be efficiently predicted if using proper predicting model and configuration. With these prediction results, we could perceive coming I/O load variation promptly and then provide some directions for virtual machine scheduling to reduce the performance degradation caused by disordered scheduling competition. In the next section, we will propose our conception of virtual machine scheduling optimization based on asymmetric virtual machine scheduler and I/O behavior predicting and describe several important mechanisms that support our design. V. S CHEDULING
OPTIMIZATION BASED ON
I/O
BEHAVIOR CHARACTERIZING
Current researches have proved that the scheduling competition cross I/O and computing jobs is an important issue that causes the performance degradation of virtual machine system. In order to address this problem, we have applied a multi-core dynamic partitioning method to realize a asymmetric scheduling framework under Xen-3.1.0 virtual machine. This approach tried to isolate the negative influence to the computing jobs by scheduling I/Ointensive VCPUs on separate processor core which employs frequent context switch and event-prior preemptive scheduling algorithm. Although this method could address the performance interference issue in some degree, it also reduced the efficiency of scheduler because it just applied a simple reactive way to handle the I/O load variation of virtual machines: a VCPU migration is always instantly performed when an I/O event arriving. Since frequent VM migration could cause serious overhead especially when it happens cross different sockets, we should schedule VMs more cautiously to protect the scheduler efficiency while keeping enough sensitivity to the variation of I/O load intensity. In this case, accurate I/O state predicting and execution phase tracking would be very helpful for the scheduler to make correct scheduling decision. In last section, we have described our methodology of I/O state predicting and proposed several principles of predictor evaluation and selecting. In this section, we will further introduce the framework of our asymmetric virtual machine scheduler based on Xen-4.1.0 virtual machine and discuss how to perform an optimal scheduling decision based on the result of I/O behavior predicting. A. Asymmetric scheduler based on Xen virtual machine 4.0 and earlier versions of Xen virtual machine system employed traditional global-symmetric scheduler to manage VMs. Both the main scheduler framework and specific scheduling algorithm (such as Credit or SEDF) need to be modified to realize the asymmetric scheduling. Currently, the latest Xen-4.1 system provides a CPUPOOL feature which allows several individual cpupools coexist
JOURNAL OF COMPUTERS, VOL. 7, NO. 7, JULY 2012
1721
-./ 0123456758469 :;.?@AB
in the system. Each cpupool has specific quantity of CPU resources which are managed by its own scheduler and virtual machines can be migrated cross different cpupools. Although only Credit scheduler completely supports the CPUPOOL mechanism currently, most important management functions have been realized in Xen-4.1.0 system, including cpupool creating and destroying, processor resource adding and removing, VM migrating and etc. Based on this framework, asymmetric scheduling can be achieved in a more modular and graceful way. As illustrated in Figure 10, we increase a event-prior round-robin(RR) scheduler to Xen virtual machine and use it to manage a specific I/O cpupool. This scheduler applies frequent context switch to speed up I/O operations and schedules VMs in sequence according to their orders in scheduling queue. Beside I/O cpupool, there is another computing cpupool which applies default Xen-Credit scheduler to undertake virtual machines that perform less I/O operations. During system running, we trace the I/O load states of each virtual machine dynamically and consider to migrate them between I/O and computing cpupools if we predict their I/O load intensity will significantly change. Different from our past research work [17], the VM migration will only be performed when we believe the entire system performance could benefit from this scheduling adjustment rather than a single I/O operation could be accelerated. Therefore, this decision will be made based on the history analysis and prediction of application’s I/O behavior. We will detail our methodology of VM migration decision making in next section. B. Execution phase tracking and VM dynamic migration As illustrated in section III, the I/O load state of most applications always keep on stable state while transient variations only happen occasionally. If we can distinguish different execution phases of applications based on their I/O load intensity and schedule VMs on I/O cpupool only when they are in heaviest I/O load state, we can maximize the benefit from I/O scheduling and reduce the overhead of VM migration efficiently. To achieve this, we need to specify a proper threshold to differentiate heavy and low I/O load intensity and setup a proper condition for VM migration. Threshold of I/O load intensity: This threshold is used to decide whether a VM has been in heavy I/O load state and should be scheduled on I/O cpupool. Since the I/O load intensity of different programs have significantly difference and could vary over time, static threshold would be inappropriate. We have introduced that the principle of our execution phase tracking is maximizing the benefit of I/O speeding up while limit the frequency of VM migration, therefore the threshold setting should be able to maximize the I/O load intensity distinction between different execution phases. To achieve this object, we borrowed a idea of segmentation from digital image processing. The purpose of image segmentation is to © 2012 ACADEMY PUBLISHER
+,
012 456758469 45I;7J845D :;.