Department of Electronic, Electrical & Computer Engineering ... Panasonic⢠and Toughbook® are trademarks of the Matsushita Electric Industrial Co. Ltd.
WEARABLE COMPUTING FOR FIELD ARCHAEOLOGY By JAMES CROSS
A thesis submitted to The University of Birmingham For the degree of DOCTOR OF PHILOSOPHY
Department of Electronic, Electrical & Computer Engineering The University of Birmingham September 2003
i
Abstract Following a successful field trial in the Tiber Valley, just North of Rome in Italy, it became apparent that wearable computing could potentially have a major role to play in the collection of data on archaeological sites.
This work is focussed on providing in-field support for
archaeologists, by the application of wearable technologies. Since there are many technologies already in use for collecting information out in the field, this work attempts to provide the key to connect together all of these technologies. A wearable field assistant was seen as a sensible central technology round which to base an information and communications infrastructure that could ultimately lead to savings in both cost and time and would hopefully maintain or even increase the ability to record accurate data in the field. This study looks at the underlying technologies required to build a wearable system that will really have an impact on the way archaeologists work in the future. It investigates the traditional field methods employed on site today and attempts to introduce some tested solutions to some of the functions important to field archaeologists. An example application providing the freedom to sketch by hand, whilst still digitally communicate and collaborate with multiple field units on site, off site and even over the Internet in real-time is explored. Finally, current trends are explored in an attempt to see how this technology will affect the archaeologist of the future. It is the hope that this study will act as a useful resource for anyone looking to use such systems in the field.
James Cross 2003
ii
To my family.
iii
Acknowledgements I would like to thank all those who made this work possible. There has been a great deal of support from both my supervisors– Dr. Chris Baber and Dr. Sandra Woolley Thanks also to Professor Mike Sharples for being very flexible with money that was not mine. A big thank you also goes to the Institute of Archaeology and Antiquity and the Birmingham University Field Archaeology Unit (BUFAU) for their continued support in providing me with unsuspecting students and imagination. Thanks also to Professor John Hunter for creating the opportunities to build a real application for forensic archaeology, and his persistence in making it work. In particular I would like to thank Dr. Vince Gaffney (now the director of The Institute of Archaeology and Antiquity) for his enthusiasm, conversations, support and beers. I would also like to thank the technicians from the School of Engineering, and in particular to Warren Hay who persistently came through doing the job right, even if I did not know what I really meant: a real engineer. A big thank you also goes to Huw Bristow, a fellow wearable systems researcher who fixed this document too often. Finally yet importantly, I would also like to thank Trevor Francis, whose expertise in mathematics helped the development of the complex engines on which some of the software for this project relies. Thanks to everyone else who I have not mentioned that have given me support in the last two years, which have been especially difficult.
Adobe Acrobat™ is a trademark of the Adobe Corporation. Microsoft is a registered trademark and Visual Basic, Windows ™, Windows XP ®™and ActiveX are trademarks of the Microsoft Corporation. IBM™ is a trademark of International Business Machines Delphi is a trademark of Borland Software Corporation Panasonic™ and Toughbook® are trademarks of the Matsushita Electric Industrial Co. Ltd Pentium® is a trademark of the Intel Corporation All product names, services and trademarks identified throughout this work are trademarks or registered trademarks of their respective companies. They are used throughout this work in editorial fashion only and for the benefit of such companies. No such uses, or use of any trade name, are intended to convey endorsement or other affiliation with this work. The author is not responsible, nor in control of the content of any Internet resources referenced in this work.
iv
Chapter Contents
Chapter 1 Introduction ..............................................................................................................1 Chapter 2 Literature Review...................................................................................................19 Chapter 3 Wearable Computing Concepts ............................................................................71 Chapter 4 Experiments with Wearable Computing in Field Archaeology .........................95 Chapter 5 Annotation Systems..............................................................................................131 Chapter 6 A Local Positioning System and its Application in Field Archaeology ...........158 Chapter 7 Conclusions and Further Work ..........................................................................171 Appendix .................................................................................................................................186
v
Full Table of Contents List of Illustrations....................................................................................................................x List of Tables ..........................................................................................................................xii Chapter 1 Introduction ..............................................................................................................1 1.1 What is a Wearable Computer?....................................................................................2 1.2 Study Contributions......................................................................................................3 1.3 A Wearable System for Archaeology...........................................................................3 1.3.1 1.3.2 1.3.3 1.3.4 1.3.5 1.3.6 1.3.7 1.3.8
1.4 1.5 1.6 1.6.1 1.6.2 1.6.3 1.6.4 1.6.5
1.7
What is Archaeology?.......................................................................................................... 4 The Archaeological Questions............................................................................................. 6 Surveying ............................................................................................................................. 6 Site Recording ................................................................................................................... 10 Archaeological Contexts Recording.................................................................................. 11 GIS..................................................................................................................................... 12 Data Dissemination ........................................................................................................... 13 Archaeological Interpretation ........................................................................................... 14
The Potential for Wearable Applications ...................................................................15 The Wearable Role .....................................................................................................16 Wearable Computing for Field Archaeology – Research Questions..........................16 The Classification of Applications and Technology – Research Question........................ 17 Digital Field working Applications – Research Question ................................................. 17 The Anatomy of a Wearable Field working Device – Research Question......................... 17 Unlimited Technology – Research Question ..................................................................... 17 Other applications – Research Question........................................................................... 17
Thesis Structure ..........................................................................................................17
Chapter 2 Literature Review...................................................................................................19 2.1 Introduction ................................................................................................................20 2.2 Wearable Systems Past and Present ...........................................................................20 2.2.1 2.2.2 2.2.3 2.2.4 2.2.5 2.2.6 2.2.7
2.3 2.3.1 2.3.2 2.3.3 2.3.4
2.4 2.4.1 2.4.2 2.4.3
2.5 2.5.1
2.6 2.7 2.8 2.9 2.9.1 2.9.2
Early Wearables – The Tin Lizzy....................................................................................... 21 The StartleCAM (Tin Lizzy Variant).................................................................................. 24 Carnegie Mellon University Wearables the VuMan and Navigator Series....................... 25 The Rome Wearable Computer Essex University UK ....................................................... 27 Commercial Wearable Systems – Xybernaut..................................................................... 28 Via-PC Wearable Systems ................................................................................................. 30 Wearable System Specification Comparison ..................................................................... 33
Wearable system - usability........................................................................................34 Wearable System Interaction............................................................................................. 35 WIMP considered fatal...................................................................................................... 35 The Strength of WIMP ....................................................................................................... 36 Novel input methods .......................................................................................................... 39
How Context Awareness Helps Wearable Systems ...................................................41 Positioning Orientated Context Awareness....................................................................... 42 There Is More to Context than Location ........................................................................... 42 Visually Sensing Location ................................................................................................. 43
Imaging for Wearable Systems ..................................................................................44 How Imaging Has Increased the Bandwidth ..................................................................... 46
Wearable Displays – The Head Mounted Display .....................................................48 Designing For Small Screens .....................................................................................50 The Miniaturisation of Devices ..................................................................................51 Mobile Communications ............................................................................................53 Broadband Wireless for Mobile Applications ................................................................... 54 WiFi – IEEE802.11b – The Wireless Standard (2.4GHz) ................................................. 54
vi
2.9.3High Speed Wireless 2.4GHz and 5GHz Bands .............................................................................. 55 2.9.4 Bluetooth (2.4 GHz)........................................................................................................... 55 2.9.5 Cellular Communications.................................................................................................. 56
2.10 2.11
Using a Computer in the Field ...................................................................................57 Previous Attempts to use Computers in the Field ......................................................58
2.11.1 2.11.2
2.12
Previous Digital Field working Research - The MCFE Project .................................60
2.12.1 2.12.2 2.12.3 2.12.4 2.12.5
2.13
Brief MCFE Fieldwork Activities.................................................................................. 61 Published Work (MCFE)............................................................................................... 65 Stick-E-Note Software (Palm Pilot) .............................................................................. 66 Fieldnote (MCFE)......................................................................................................... 67 GPS Developments........................................................................................................ 67
The Impact of Technology on the Traditional Archaeologist ....................................68
2.13.1
2.14
Standard Hardware....................................................................................................... 58 Wearable Computing for Field Archaeology ................................................................ 59
Digital Photography...................................................................................................... 69
Keeping the Goal in Mind ..........................................................................................70
Chapter 3 Wearable Computing Concepts ............................................................................71 3.1 Introduction ................................................................................................................72 3.2 Why Classify? ............................................................................................................72 3.2.1
3.3
Weiser’s Mark ................................................................................................................... 73
The Wearable Technology Index ...............................................................................75
3.3.1 3.3.2 3.3.3 3.3.4
3.4 3.5 3.6
The Three-Level System..................................................................................................... 76 Low Power......................................................................................................................... 76 Medium Power................................................................................................................... 76 High Power........................................................................................................................ 77
Relative Power Consumption.....................................................................................77 Display Requirements ................................................................................................78 Attention Requirements..............................................................................................79
3.6.1
3.7 3.8
The Limits .......................................................................................................................... 80
Classification Discussion ...........................................................................................80 Mobile Computing to the Limit..................................................................................82
3.8.1 3.8.2 3.8.3 3.8.4 3.8.5
3.9
The Problem with Mobile Computing ............................................................................... 82 Five Key Problems with Current Mobile Technologies .................................................... 82 Power Management........................................................................................................... 83 Efficient Power Storage..................................................................................................... 85 Intelligent Use of Energy................................................................................................... 87
Advanced Thermal and Power Management .............................................................87
3.9.1 3.9.2 3.9.3 3.9.4 3.9.5 3.9.6
3.10
Heat ................................................................................................................................... 88 Reliability as a Function of Heat....................................................................................... 89 Danger to the Health of Skin ............................................................................................. 89 Heat Dissipation................................................................................................................ 90 Controlling Heat................................................................................................................ 90 Size Constraints ................................................................................................................. 91
The Battery .................................................................................................................92
3.10.1 3.10.2
What is a Cell? .............................................................................................................. 93 Making Better Use of What We Currently Have ........................................................... 94
Chapter 4 Experiments with Wearable Computing in Field Archaeology .........................95 4.1 Introduction ................................................................................................................96 4.2 The Rome Field Trial .................................................................................................96 4.3 The Wroxeter Field Trial............................................................................................98 4.3.1 4.3.2 4.3.3
The Field Trial................................................................................................................... 99 The Paperwork .................................................................................................................. 99 Digital Storage Considerations ....................................................................................... 101
vii
4.3.4Wroxeter Field Trial Hardware – The Panasonic Toughbook CF-07 .......................................... 101
4.4
Wroxeter Field Trial Software..................................................................................102
4.4.1 4.4.2 4.4.3
4.5
Textual Data Entry .......................................................................................................... 102 Graphical Data Entry – Sketches, Photographs and Maps............................................. 103 Mapping Capabilities ...................................................................................................... 104
Field Trial Results ....................................................................................................104
4.5.1 4.5.2 4.5.3 4.5.4 4.5.5 4.5.6 4.5.7 4.5.8
4.6
The Trial Computer System ............................................................................................. 104 Digital Image Capture..................................................................................................... 108 Camera Resolution Comparison ..................................................................................... 109 GPS in Practice ............................................................................................................... 110 The Digital Map .............................................................................................................. 111 Interaction ....................................................................................................................... 111 Additional Data ............................................................................................................... 112 Data Networking ............................................................................................................. 113
Wroxeter Results ......................................................................................................114
4.6.1 4.6.2
4.7 4.8 4.9
Good Points:.................................................................................................................... 114 Bad Points: ...................................................................................................................... 114
Evaluation of the Wroxeter Trial..............................................................................116 Field Data Collection Data Types ............................................................................116 Representation of the Data Collected .......................................................................118
4.9.1 4.9.2 4.9.3
4.10
List Information Representation...................................................................................... 118 Temporal Information Representation ............................................................................ 118 Spatial Information Representation................................................................................. 118
Building a Wearable Computer- The Chi-3 .............................................................121
4.10.1 4.10.2 4.10.3 4.10.4
Early Wearable Problems ........................................................................................... 124 The Chi-3 Design ........................................................................................................ 126 More Power Needs More Power................................................................................. 127 Building a Wearable – Summary ................................................................................ 129
Chapter 5 Annotation Systems..............................................................................................131 5.1 Introduction ..............................................................................................................132 5.2 To Annotate ..............................................................................................................132 5.2.1 5.2.2 5.2.3
5.3 5.4 5.5 5.6 5.6.1
5.7 5.7.1 5.7.2 5.7.3
5.8 5.8.1 5.8.2 5.8.3 5.8.4 5.8.5
5.9 5.9.1 5.9.2 5.9.3 5.9.4
The Annotation Process................................................................................................... 134 Computer Images............................................................................................................. 135 Image Annotation ............................................................................................................ 136
Digital Annotation of Image Data ............................................................................138 Basic Annotation ......................................................................................................138 Archaeological Annotation Imaging Requirements .................................................141 Digital Site Annotation Example – One Metre Squares...........................................141 Digital Site Annotation Software Prototype .................................................................... 143
Annotation Design – Archaeological Consultation & Previous Work.....................143 Interface – Touch Screen................................................................................................. 144 Annotation by Layers....................................................................................................... 144 Modes of Display and Interaction ................................................................................... 145
Experimental Time Saving Features – Geo-Rectification........................................146 Finite Element Methods................................................................................................... 147 The Linear Transformation ............................................................................................. 148 Quadratic Transformation............................................................................................... 148 Limitations....................................................................................................................... 151 Geo-rectification Summary.............................................................................................. 151
Archaeological Assistant Image Annotation Performance Study ............................152 Annotation Trial Description........................................................................................... 152 Experimental Procedure.................................................................................................. 153 The Manual System.......................................................................................................... 153 The Computer Assisted System ........................................................................................ 154
viii
5.9.5Annotation Trial Results................................................................................................................ 154
Chapter 6 A Local Positioning System and its Application in Field Archaeology ...........158 6.1 Introduction ..............................................................................................................159 6.2 How a Positioning System Works............................................................................159 6.2.1 6.2.2
6.3 6.4 6.5 6.5.1 6.5.2
6.6 6.7 6.8 6.9 6.10
Global Positioning System............................................................................................... 160 Differential Correction (DGPS) ...................................................................................... 161
A 3D Ultrasonic System...........................................................................................161 Applications..............................................................................................................163 Field Trials – Forensic Archaeology ........................................................................164 Results ............................................................................................................................. 166 Estimation of Error with LPS .......................................................................................... 167
Practical Issues .........................................................................................................168 Improving the System ..............................................................................................169 Constellation.............................................................................................................169 System Calibration (Automatic Calibration)............................................................170 Discussion ................................................................................................................170
Chapter 7 Conclusions and Further Work ..........................................................................171 7.1 Introduction ..............................................................................................................172 7.2 In-Field Task Findings .............................................................................................173 7.3 Study Outcomes .......................................................................................................176 7.4 What Still Remains Unanswered? ............................................................................178 7.5 The Ideal Wearable Assistant...................................................................................178 7.5.1 7.5.2
7.6 7.6.1
7.7 7.7.1 7.7.2 7.7.3
7.8
The Wearable Field Model .............................................................................................. 179 Other Applications........................................................................................................... 180
The Archaeologist of the Future...............................................................................180 Components of a Fieldwork Wearable Solution.............................................................. 181
Future Improvements................................................................................................181 Wireless Improvements.................................................................................................... 182 Screen Technology Improvements ................................................................................... 182 No Batteries? ................................................................................................................... 184
The Field Assistant of the Future .............................................................................185
Appendix .................................................................................................................................186 Appendix A Electronic Archaeology Workshop January 2001............................................187 Appendix B Archaeological Context Recording ..................................................................188 Appendix C Wroxeter Field Trial.........................................................................................190 Appendix C 1 Wroxeter field trial data framework ....................................................................... 190
Appendix D Local Positioning System.................................................................................192 Appendix D 1 LPS Transmitter ..................................................................................................... 192 Appendix D 2 LPS Receiver .......................................................................................................... 193
Appendix E the CHI-3 Design..............................................................................................194 Appendix E 1 Original Pencil Concept Artwork ........................................................................... 194 Appendix E 2 CHI-3 Cad Drawings.............................................................................................. 196
Appendix F Published References........................................................................................201
ix
List of Illustrations Figure 1 buried remains of the Roman settlement of Carnuntum near Vienna, Austria, made visible by a false colour infrared satellite image. [Geospace] .................................................................................................................................................................................................................. 8 Figure 2 Ground Penetrating Radar image (GeoModel, Inc 2000) ........................................................................................................................... 8 Figure 3 Overlaid remote sensing data [GeoSpace] ©GEOSPACE 2003 .............................................................................................................. 10 Figure 4 ArcView 8 can handle masses of information and display it graphically [ESRI] .................................................................................... 13 Figure 5 1986 - The IBM 5140 PC Convertible ® - for the first time, a PC that could be operated away from a power source, for a short while at least [IBM 5140]................................................................................................................................................................................................... 20 Figure 6 some of the Tin Lizzy hardware [Graphic Derived Fr. Healy 1998] ........................................................................................................ 22 Figure 7 Tin Lizzy wearable computer applied to a Cybernetic camera system [Healey 1998] ............................................................................ 24 Figure 8 the StartleCAM based on the Tin Lizzy [Healey 1998]............................................................................................................................ 24 Figure 9 CMU VuMan Wearable with the rotary dial [Smailagic 1993] ................................................................................................................ 25 Figure 10 the VuMan 3 being used for maintenance tasks; note it is controlled with a single rotary wheel [Smailagic 1993]............................. 26 Figure 11 the Rome Mk2 (Vase Lab Essex) it is almost five inches thick. It requires four boards for basic PC functionality. [Vase Lab]....... 27 Figure 12 Xybernaut at COMDEX [Comdex] ......................................................................................................................................................... 29 Figure 13 the MA TC (Mobile Assistant) [Xybernaut] ........................................................................................................................................... 29 Figure 14 the Xybernaut Poma™ [Xybernaut]........................................................................................................................................................ 30 Figure 15 field data collection for real estate management [ViA] .......................................................................................................................... 31 Figure 16 McDonalds Application [ViA] ................................................................................................................................................................ 32 Figure 17 A watch computer from Byte Magazine 1981 [Byte 1981] ................................................................................................................... 34 Figure 18 the Sony Ericsson T68, the First Picture Messaging Phone in the UK on T-Mobile (May 2002) [Bee Wireless]................................ 46 Figure 19 3’s 3G coverage (June 2003) [Three] ...................................................................................................................................................... 47 Figure 20 Mobile Phone Technologies approximately the same scale. (Approximate year of implementation circa 1985 left, 1992 middle, 2001 right) ................................................................................................................................................................................................................ 52 Figure 21 the Nokia 8210 circa 2001, was a victory for miniaturisation, but it could not get any smaller and still be usable. A traditional phone needs to bridge the gap between ear and mouth ...................................................................................................................................................... 53 Figure 22 Apple Newton Message Pad 130 [Newton] ............................................................................................................................................ 62 Figure 23 the Trimble lassen-sk8 GPS receiver has a remote antenna.................................................................................................................... 63 Figure 24 the FM256 Fluxgate Gradiometer- [Geoscan] ........................................................................................................................................ 65 Figure 25 Selective Availability effects before and after it was disabled ............................................................................................................... 68 Figure 26 Portable Computer with Integrated Fuel Cell System, The metal hydride tanks on the right and the 50W reactor on the left, almost as small as a normal laptop battery developed by LG Caltex. ..................................................................................................................................... 86 Figure 27 the widening power gap trend figures from [Lahiri 2002], [Udani 1996] (Figures for illustrative purposes only)............................... 88 Figure 28 A heat sink used to dissipate heat from a graphics card processor, notice the large surface area produced by lots of fins .................. 89 Figure 29 A Compaq IPAQ 3630 Lithium Polymer Cell encased in a folded aluminium bag, note the thickness little more than a 20 pence coin, rather than a cylinder or block.................................................................................................................................................................................. 94 Figure 30 Rome Field Trial – Forum Novum, Tiber valley - Italy 2000................................................................................................................. 96 Figure 31 Wroxeter [left] Wroxeter Boundary [right] ............................................................................................................................................. 98 Figure 32 the Paperwork .......................................................................................................................................................................................... 99 Figure 33 filling in an enclosure record in the field............................................................................................................................................... 100 Figure 34 the IBM 2.5" Hard Disk used in the Chi-3 holds 40 GB and is 9mm thick.......................................................................................... 101 Figure 35 the Toughbook System .......................................................................................................................................................................... 101 Figure 36 listing of possible finds .......................................................................................................................................................................... 102 Figure 37 Sketches and the Sketching Options...................................................................................................................................................... 103 Figure 38 First Contact (Wroxeter Video 0.07) Note the GPS and the Processor located on the back of the person on the far left................... 104 Figure 39 Taking a Picture was very difficult; the video was too slow (Wroxeter Video 3.51)........................................................................... 105
x
Figure 40 Rapid Form and Pen Based Data Entry (from Wroxeter Video 4.28)...................................................................................................106 Figure 41 Entering Data on the Move (from Wroxeter Video 8.04) ..................................................................................................................... 106 Figure 42 The paper was more difficult to handle in the field, and was often easier whilst sitting down. (From Wroxeter Video 28.36)........ 107 Figure 43 Form Based Data Entry – One of the Wroxeter Data Capture Screens ................................................................................................ 107 Figure 44 the National Grid in relation to Latitude and Longitude [Nat GPS] ..................................................................................................... 111 Figure 45 a Total Station optical measurement device (left), confused student (middle), archaeologist with the Toughbook (right) ................ 112 Figure 46 Some Data collected in Wroxeter (Geo-Referenced)............................................................................................................................ 119 Figure 47 the older Rome Mk2 is almost five inches thick. It requires four boards for basic PC functionality [VASE] (Vase Lab Essex)...... 121 Figure 48 the original prototype Birmingham wearable, only requires a single board so is much thinner and lighter, and has less interconnects to cause mechanical problems................................................................................................................................................................................ 122 Figure 49 the original wearable (front), Battery and PSU (top left), Head mounted display (upper middle). The system is belt mounted in this case; the weight distribution is fairly even with the battery on one side and the computer on the other. ............................................................ 123 Figure 50 Dr. Vince Gaffney, wearing the camera and belt mounted PC/104 based system; note the distribution of the weight around the belt. ................................................................................................................................................................................................................................ 123 Figure 51 Original concept pencil drawing drawn October 2000 (left), Solid Edge CAD drawing – drawn much later (right), many features were kept from the original rough sketch. ............................................................................................................................................................. 126 Figure 52 Machining the Chi-3 from a solid block, layer-by-layer on a CNC machine (left), a whole bin-liner full of swarf later – the finished Chi-3 wearable (right) ............................................................................................................................................................................................ 126 Figure 53 the wearable revolution, evolution. (From left to right) – V1 first prototype Pentium 166MHz 32Mb RAM, V2 Pentium 266MHz 64Mb RAM, V3 (Chi-3) and V2 Comparison, Chi-3 under the bonnet, Finished Chi-3...................................................................................... 127 Figure 54 5A PSU house shaped to fit the original internal casing....................................................................................................................... 128 Figure 55 the 700MHz Chi-3 being worn, including the pointing device, HMD batteries and audio capabilities .............................................. 128 Figure 56 Tekgear all the accessories one needs for a wearable system [Tekgear] .............................................................................................. 129 Figure 57 Image Metadata included in some JPEG images .................................................................................................................................. 136 Figure 58 Photofinder from the University of Maryland [Kang & Shneiderman 2000]....................................................................................... 140 Figure 59 Site Grid Layout, 1m square sectors [Drewett 1999] pp109................................................................................................................. 142 Figure 60 an example of a unit metre (1m) drawing frame [Drewett 1999 pp135] .............................................................................................. 142 Figure 61 Three different layers of annotations, the coins are separate vectors but are part of the same layer ................................................... 145 Figure 62 Right clicking within ten pixels of an annotation will display the annotation text even if the annotation is hidden........................... 145 Figure 63 Simple ground photo taken with a digital camera. (From Forum Novum – The Rome Trial)............................................................ 146 Figure 64 Actual geo-rectified destination image produced from the source image. ........................................................................................... 147 Figure 65 Perspective and its effects...................................................................................................................................................................... 148 Figure 66 Destination Image (square).................................................................................................................................................................... 149 Figure 67 Source Image with numbering points.................................................................................................................................................... 149 Figure 68 Quadratic transform yields better results............................................................................................................................................... 150 Figure 69 1m Square Mock Test Rig ..................................................................................................................................................................... 152 Figure 70 Actual Hand Drawn Sketch ................................................................................................................................................................... 153 Figure 71 the Assisted Drawing ............................................................................................................................................................................. 154 Figure 72 Mean Task Time Comparisons.............................................................................................................................................................. 155 Figure 73 Radar Plot of Accuracies (cm/object).................................................................................................................................................... 156 Figure 74 the minimum system for positioning ..................................................................................................................................................... 160 Figure 75 the LPS Proof of Concept System ......................................................................................................................................................... 161 Figure 76 Timing Diagram for a Four TX LPS ..................................................................................................................................................... 162 Figure 77 Part of the Software indicating the location graphically ....................................................................................................................... 163 Figure 78 the Virtual Cube - LPS transmitters located at the top.......................................................................................................................... 163
Figure 79 Site Layout - Transducers and Total Station ............................................................................................................................. 164 Figure 80 A simple coordinate conversions .................................................................................................................................................. 165 Figure 81 Lower torso measured with LPS............................................................................................................................................................ 166
Figure 82 comparisons of LPS and Total Station measurements ............................................................................................................. 167
xi
Figure 83 the author using the system (The actual grave cannot be shown) .........................................................................................................169 Figure 84 the Viewsonic Smart Display ................................................................................................................................................................ 183 Figure 85 Prototype Electronic Paper [Bell Labs] ................................................................................................................................................. 184 Figure 86 Original pencil artwork for the Chi-3 concept ...................................................................................................................................... 194 Figure 87 Original concept drawings, pencil artwork. The design chosen was the drawing on the top right ..................................................... 195 Figure 88 the Chi-3 Chassis- Items can be test fitted in the CAD package long before anything is actually manufactured. .............................. 196 Figure 89 the Chi-3 lid – visualisation is a key part in any design process, here we can see exactly what it will look like, including reflections, shadows etc............................................................................................................................................................................................................. 197 Figure 90 Fully Rendered concept drawing of the Chi-3 ...................................................................................................................................... 198 Figure 91 the fully assembled Chi-3 (not anodised), based around the 266MHz core. The 700 MHz version has a larger heat sink with a slightly modified lid. .............................................................................................................................................................................................. 199 Figure 92 the Micro-optical head mounted display (HMD) used as an option, together with the Plantronics digital audio headset and microphone. ............................................................................................................................................................................................................ 199
List of Tables Table 1 Various wearable system hardware comparison......................................................................................................................................... 33 Table 2 WIMP Components..................................................................................................................................................................................... 37 Table 3 Generic actions in HCI (Human-Computer Interaction) [Baber 1997]...................................................................................................... 38 Table 4 some examples of context-aware Applications .......................................................................................................................................... 42 Table 5 Relative Processing Requirements of three main categories of possible wearable application................................................................. 76 Table 6 Approximate Comparative Battery Lifetimes............................................................................................................................................. 77 Table 7 Logarithmic scales show that the relative power consumed by each class appears to be approximately logarithmic.............................. 78 Table 8 Reducing Power Consumption [Havinga 2000] ......................................................................................................................................... 91 Table 9 Example Camera Resolution Comparisons .............................................................................................................................................. 109 Table 10 Modifications to V2 to Chi-3 (V3), most other changes were cosmetic such as the art deco case design............................................ 125 Table 11 Total Station and LPS measured deviation............................................................................................................................................. 166 Table 12 Data Types............................................................................................................................................................................................... 172 Table 13 Wearable Field Applications summary................................................................................................................................................... 174 Table 14 the Main Context Record ........................................................................................................................................................................ 188 Table 15 Context Record - Soil Information.......................................................................................................................................................... 188 Table 16 Context Record – Cuts Information ........................................................................................................................................................ 188 Table 17 Context Record - Masonry Information.................................................................................................................................................. 189 Table 18 Context Record - Skeletal Remains Information.................................................................................................................................... 189
xii
Chapter 1 Introduction
Chapter 1
Introduction
1
Chapter 1 Introduction Wearable computing could have a major impact on the archaeological fieldworker of the future. With the benefits already offered by mobile computing and wireless networking, such systems could be in wider usage already. This thesis looks at the current state-of-the-art in ultra-mobile systems and wireless networking. Using this information, a number of studies of the application of such technology in the field are explored. Finally, using the lessons learned, it identifies key application areas and explores whether or not both the technology and the archaeologists are ready for such a system.
1.1 What is a Wearable Computer? Quite simply, if it is a computer that you can wear; it is a wearable computer. Undoubtedly, there are different levels of computing that could be worn from the simple watch with Tele-memo functions through to a three-dimensional virtual or augmented reality system. Whilst many aspects of wearable computing are up for debate, the principal meaning of a “Wearable PC” is quite well grounded. Mann [Mann 1997, A] suggests five characteristics of a wearable computer: 1. [It may be used while the wearer is in motion. 2. It may be used while one or both hands are free or occupied with other tasks. 3. It exists within the corporeal envelope of the user, i.e., it should not be merely attached to the body but becomes an integral part of the person's clothing. 4. It must allow the user to maintain control. 5. It must exhibit constancy, in the sense that it should be constantly available.] A wearable computer could be broadly defined as ‘any computing system that can be used whilst worn about the person without interrupting the user’s usual activities.’ Some people may shudder at the very idea of wearing a computer, and it must have crossed the reader’s mind: ‘Why would you want to?’ Computers are not clever devices; they are simply very fast at performing complex calculations and handling very large amounts of data. They can collect, process and sort data very quickly. For this reason alone, they are employed in large businesses that now have customer bases far too large to manage by hand, with far too many suppliers to manage by hand. It simply allows them to manage tasks that have become too big or too complex to be done by hand. A wearable computer would do a similar set of tasks for the user. It would allow them to cope with complex situations and process data that they would normally find difficult or even tedious. A wearable PC gives the user the ability to handle this information but also allows them to be free from a desk, thus, allowing the computer to be operated in situations where it could not have been applied before.
2
Chapter 1 Introduction However, many problems plague wearable systems in typical desktop usage scenarios.
The
computer simply cannot be used in a way consistent with the desktop paradigm. From the first wearable computer built in-house at the University of Birmingham, the case for wearable computing in general has expanded remarkably. Soon after the WearCAM [Cross 2000], found itself in use on a real archaeological site, recording images automatically. It soon became apparent that a wearable device had great potential on an archaeological site, with the possibility of far reaching implications for collecting data out in the field for a myriad of other similar applications.
1.2 Study Contributions This study aims to demonstrate a case for the integration of wearable and ultra-mobile technologies for use in the field to assist in archaeological investigations. It provides an overview of wearable computing research including the current state-of-the-art. In its aim to address the needs of the field archaeologist, new technologies and ideas are presented such as real-time annotation - the ability to annotate images captured out in the field and a positioning system that can be used in places where GPS and other surveying techniques simply cannot reach. It looks at how ideas such as these can be integrated to help support everyday activities carried out by archaeologists. In addition, the more practical aspects of building a wearable computer together with how to interact with them in a field working environment is discussed in detail, and provides a useful resource for anyone undertaking research in this area. This study provides a basis for new and interesting spin-off projects dealing in more detail with certain aspects of a wearable computer such as studying the role of context awareness – (a project that is currently making use of the Chi-3 developed in this work.) Other subtle technology developments such as the power supply design have already found uses in other peoples work. The contribution in terms of data collection for field archaeology can and are being put to use in other similar disciplines including forensic archaeology- the positioning system developed here has been tested for use on mass graves in the Balkans to aid repatriation of genocide victims.
1.3 A Wearable System for Archaeology One of the key aims of this work is to investigate the application of a wearable archaeological assistant. To do this effectively, one needs to study the traditional archaeological methods in place today. A digital field assistant will inevitably lead to a change in the way archaeologists currently work. Careful consideration needs to be made to allow for the integration of the traditional 3
Chapter 1 Introduction recording system in place. Rather than impose a new way of working altogether, a wearable assistant could have maximum benefit today by simply assisting in the current methods, thereby winning the support of those its introduction would affect. One of the best ways to do this is to do some real field archaeology. In order to get a feel for the work that archaeologists do in the field it was necessary to read some literature relating to field archaeology methods. It was not necessary to learn other aspects of archaeology as a subject such as knowing different archaeological periods for example as the scope is far too vast for a three year study, but a passing interest proved most useful. Real field experience proved the most valuable tool for getting a feel for the subject. The following is a brief look at the typical process in use on an archaeological site. In order to understand the application, one needs to examine exactly what archaeology is. The fieldwork process is discussed from the pre-field working stage, collecting archival information, through to the fieldwork itself, and finally to the final data dissemination and interpretation stage. Data representation methods such as GIS and the ever-advancing technology already available to the archaeologist are also discussed.
1.3.1 What is Archaeology? Ask any group of Archaeologists exactly what archaeology is and they will all have something different to say. It is not really the study of the past, for that is history; it is not really the study of humans in the past because that is anthropology. It is perhaps a study of a combination of several different disciplines in order to answer some questions about human activity that occurred in the past. Archaeology has been defined in many different ways in as many different texts in the past. As an example, Renfrew and Bahn chose to define it thusly: “Archaeology is a sub-discipline of anthropology involving the study of the human past through its material remains” [Renfrew and Bahn 1991]. One could say that archaeology is important to everyone and especially to one who feels their ancestors were important. Unfortunately, humans have a limited lifespan; consequently, material remains are the only remnants of our history. It is up to archaeologists, through careful collection of data from these material remains and through archaeological interpretation, to work out what previous civilisations were like. Sadly, if careful planning and recording of data is not carried out, details from the past will be lost forever, and this happens by accident everyday as ancient sites are destroyed in the name of progress.
4
Chapter 1 Introduction What is Field Archaeology? Drewett presents a very useful resource aimed specifically at field archaeology, which is extremely valuable because it does not require the study or a detailed knowledge of archaeology [Drewett 1999]. It acts as a guide to typical field archaeology techniques used everyday. From the outset, Drewett defines field archaeology as follows: “Field archaeology refers essentially to the battery of non-destructive field techniques other than excavation, used to locate areas of archaeological interest” [Drewett 1999 p3]. He then goes on to state that excavation is “one of the techniques available to field archaeologists and so is part of field archaeology” [Drewett 1999 p3]. It is important to appreciate that archaeological excavation is in itself destructive and that a great deal can be learned by using modern non-destructive and non-invasive methods of surveying together with observations such as landscape archaeology – the study of human activity by examining linear earthworks such as ridges, ditches and fortifications around settlements. Technology has allowed the development of more non-destructive techniques such as ground-penetrating Radar, other geophysics and satellite photography to name just a few. These all add to Drewett’s ‘battery’ of techniques available to archaeologists. The trouble is, the more technology involved, the more data is collected. Questions then need to be asked of the relevance and the eventual interpretation of this data in addition to solving problems of how to manage all of this data. In some cases, one could say that the data is beginning to shift from material remains, stored in a museum, to detailed site data stored in a digital form. The reader may well be wondering: ‘could it be that soon we will not even have to dig?’ This could indeed be the case on some sites, depending on how well non-destructive techniques can answer the questions that the archaeologist may have about a site. For the most part, it is still important to recover artefacts by excavation for studies that cannot be carried out remotely, such as the radio carbon dating of buried artefacts. An archaeological excavation sometimes begins as a continuation of previous work, sometimes it is just stimulated by interest and other times it is in the hope to answer some remaining questions from someone’s research. The key reasons for archaeological survey could be expressed as:
Because the site is interesting. As part of a process of exploration and data gathering. Because it is threatened. Accidental discovery
[NAMHO]1
5
Chapter 1 Introduction In some cases archaeological examination begins because the site has been scheduled for development, in this case the work is started in order to answer the question: is there any archaeology? In some cases old maps can be consulted and the areas geographic relationship to other nearby known sites of archaeological interest. This type of archaeological research is in some areas a legal requirement before a site can be developed.
1.3.2
The Archaeological Questions
Arguably, the single most important part of archaeological research for any site must be the forming of the archaeological research questions. The questions, perhaps decided upon after determining if there is any archaeology, usually form part of the project design. Hopefully, typical questions such as: “who lived here and when?” can be answered by using the plethora of methods that are available to archaeologists. When the questions have finally been answered, the work on that site can be said to be complete. It is important not to lose site of this main aim. If the questions have been answered and no excavation has taken place, then there is little point in going to the trouble and expense of a full-scale excavation. Therefore, excavation is not always a requirement. The project process is adaptive and the answer to one question may well give rise to further questions and could well require a different approach. Improving data collection in the field only serves to support the archaeological interpretation, without which, all the data collected is meaningless, no matter how detailed it may be. Andrews noted that archaeological projects are often organised in noticeably defined phases as listed below [Andrews 1991]:
Project Planning Fieldwork Assessment of potential for analysis Analysis and report preparation Dissemination After the project planning stage, the fieldwork can begin. Obviously, this stage can only be carried out on site. Unless very specific information is known about what archaeology is present, the site will have to be surveyed to reveal its hidden secrets.
1.3.3
Surveying
Field working can start as soon as the project has been planned, based on whether or not the site has been declared of archaeological interest, regardless of how or why. If the site is likely to show evidence of human activity in the past then a basic site survey can take place. In its earliest and simplest form, one method of surveying is known as field walking, the archaeologist just walks 6
Chapter 1 Introduction around the site of interest. By just walking around a site, an experienced archaeologist can get a feeling for the area and can learn a great deal. Human activity in an area is rarely accidental or random, but often based on the physical surroundings, or local influences such as:
It might be a good site for a hill fort. i.e. it is a hill with good visibility. It has a river close by. It has a natural protection from invasion from a particular direction or prevailing wind. Access to local resources. Known beliefs and traditions often affect the orientation and organisation of sites. One of the field studies carried out as part of this research included the recording of overview photographs and allow the archaeologist to annotate such findings. (See the Wroxeter Field Study in section 4.3 on page 98 for more details.) Aerial surveying is a powerful remote-sensing tool for surveying. Slight fluctuations in crop colours can indicate variations in the soils that have been caused by ancient human activity particularly at certain times of the year. Sub-surface walls or foundations will affect the drainage and therefore affect the height or colour of crops growing above them. This can clearly be seen from the sky under the right conditions. Therefore aerial photographs provide a key to the site and can also be used and overlaid cartographic (mapping) information. Traditionally the aerial photo would be of the old chemical process, and whilst this is still used for recording, digital photography is no stranger to field archaeology, and is often printed and used on site. Recently there have been advances in remote sensing from an aerial platform. Now not only can the site be recorded photographically from the air but also using systems such as LIDAR2 (Light Detection and Ranging) a Laser mounted on an aircraft can measure the ground level from a flyby in a raster scan configuration. This produces a very large amount of data potentially producing millions of data points. The data points will show the surface topography, and even more impressive is its ability ‘see’ through tree canopies showing the ground below, which can be an extremely valuable tool. This requires a lot of storage and the results often need to be interpreted before they are of any use in the field, because the results are 3D and difficult to visualise from a flat print out.
7
Chapter 1 Introduction
Figure 1 buried remains of the Roman settlement of Carnuntum near Vienna, Austria, made visible by a false colour infrared satellite image. [Geospace]3
There are also other aerial remote sensing tools capable of producing similar results and have similar processing and storage requirements, but will not be discussed here. Figure 1 demonstrates the awesome power of modern remote sensing technologies using aerial photography outside of the normal visible wavelengths. This infrared image shows the relative ground temperatures and emissivities; under the ground is a roman settlement, which would not otherwise have been visible. The data from all these forms of surveying need to then be overlaid accurately, otherwise it will be difficult to determine where and item of significance actually lies. Geophysics The study of geophysical data is an important part of the surveying. Geophysics is the remote study of the ground using various instruments. By remote, we also mean that it is non-destructive and does not require digging per se, only close contact with the ground.
Figure 2 Ground Penetrating Radar image (GeoModel, Inc 2000)
8
Chapter 1 Introduction GPR (Ground Penetrating Radar) is sometimes used and it has the ability to ‘see’ deep into the ground looking for discontinuities in the permittivity of the ground (the way it responds to electric fields). It can ‘see’ if the ground has been disturbed and gives some indication of the depth. This produces a 3D log of the permittivity of the ground. This 3D information can lead to masses of data. The data produced by this kind of scan often requires a specialist to interpret, and needs significant post-processing, all of which is done on a PC. In addition, when the data has been processed it is often printed out and used in the field. The results from GPR can be of more use than older geophysical techniques because it offers a third dimension to the data. Figure 2 shows a typical annotated GPR slice: Left to right is the distance travelled by the Radar along the ground. Vertically is a representation of what the antenna ‘sees’ under the ground and its depth. More frequently used, and the mainstay of British archaeology for more than half a century is ground resistivity.
Using probes of varying configuration and sensitive instrumentation it is
possible to measure the ground’s electrical resistance. The reading will show the resistance between the probes at a single point of measurement. Relative variations in ground resistance can often show where the earth has been disturbed because it has different moisture content. The readings must be taken at regular intervals across the surface of the site and the data must be logged somewhere. Hopefully it is then possible to put the data back together to form a map of resistance. It is quite easy to see how the data can lose integrity. In fact, it is even possible to get the data upside down and/or back to front. Further geophysics equipment is available such as the fluxgate magnetometer but there is little point discussing them here because the data requirements are all similar to that of the ground resistivity, essentially they will provide a measurement at a particular point on the ground, and by looking at the relative measurements, one can see objects or disturbances underground.
9
Chapter 1 Introduction
Figure 3 Overlaid remote sensing data [GeoSpace] ©GEOSPACE 2003
When the surveying is completed, the various sources of data can be integrated on a computer to provide a composite of the different types of measurements. Often, getting data to line up such as that shown in Figure 3 is quite difficult and often done using computers off-site perhaps in the postexcavation phase.
1.3.4
Site Recording
Drewett states that the recording of archaeological data essentially has four main elements 1. A written description of the site. 2. The drawn record. 3. A photographic record. 4. Material finds.
[Drewett 1999].
The written description of the site can easily be ambiguous depending on the site, and so it is important that the data is collected in a standard and structured manner. For recording data on site, the Sites and Monuments Record (SMR) is usually used and is often recorded on pre-printed forms that have to be filled out in the field.
10
Chapter 1 Introduction The Sites and Monuments Record The sites and monuments record is essentially a database of all archaeological sites and finds from a given area, which is maintained by the County Council and has been adopted by formal resolution. For example, the local council (Birmingham, West Midlands, UK) defines the sites and monuments record thus: ‘The West Midlands SMR (sites and monuments record) is a computerised database, which aims to record all archaeological sites and find spots within the West Midlands County. The area’s seven district councils fund it jointly. The existence of a countywide record, broadly compatible with other county SMRs, allows an assessment to be made of the regional or national importance of a given archaeological site. English Heritage will thus use the County SMRs as the principal source of information for the Monuments Protection Programme.’ [West Mids App 8]4 Traditionally all of this information would be kept in a large archive or museum. Nowadays, some information is kept in digital form alongside the traditional record; large amounts of digital information can be generated in the post-processing or publication stage. This hybrid format has the advantage that it maintains the original data but at the same time allows computer searches to be carried out.
1.3.5
Archaeological Contexts Recording
It is important the data for each archaeological context (finding) be recorded accurately and completely. Archaeological contexts are usually recorded on-site. In addition, there is often more than one sheet required for each archaeological context depending on what it is. The following is a brief representation of the minimum requirement, and some of the extra detailed information required. This then forms most of the written record of the site. 1.
Give the site a site code (or otherwise obtain one)
2.
Carry out a survey of the area to ascertain as much information about the archaeology below and above ground as possible. Place a trench in an area that has been targeted for its potential usefulness in answering an archaeological question
3.
The trench is given a unique number for the site. All the archaeological contexts in that trench will then be removed in the reverse order of its original deposition (as far as possible) and each context will be given a number and recorded as being above or below the contexts that are immediately above or below.
11
Chapter 1 Introduction 4.
Record each archaeological context A context can be: o A soil o A cut, e.g. ditch, foundation trench o A skeleton o Masonry
5.
The dimensions of each context are taken-
6.
Points are taken along every context to see height above sea level
7.
Plans of each context drawn, each given a number and cross-referenced with the contexts involved - this can be done by survey, the contexts have to be noted on site.
8.
A sample may be taken of the context- will be given a sample number and crossreferenced.
9.
While excavating soils, finds such as pottery will be put into bags and labelled with the context number. Any special finds (small finds) are given a separate number and crossreferenced.
10.
The section that the trench has cut through will then be drawn and the contexts that are shown are then labelled and cross-referenced with context description.
This involves
drawing or sketching accurately the side of a cut or the wall of a trench. A brief example of the information captured about each context can be found in the Appendix. (Refer to Appendix B Archaeological Context Recording on page 188)
1.3.6
GIS
GIS is frequently used to answer the question: ‘How will we organise the data?’ GIS stands for Geographical Information System. Goodchild has arguably the most cited description of GIS [Goodchild 1990]. Goodchild states that GIS is “a system to collect, store, manipulate, analyse & present spatially referenced data”.
GIS is perhaps the single most important element for a
computer-based database for archaeological purposes, and can be used for other purposes where spatially referenced data is important. Effectively a database needs to have a primary key with which to identify a unique record or piece of data. When the data represents finds that are spatially organised, the location can serve as the key. Each location is unique and therefore objects and finds can be organised according to their location. This has obvious advantages such as excluding 12
Chapter 1 Introduction all the data from outside the area of interest. GIS goes a long way to organising the data that is collected and making sure that it all lines up. However, it is poor when it comes to 3D data. Supposing a site has been surveyed producing a large image that represents the ground. The image could be radar or photograph based. One could now pinpoint any other piece of data that lies on the ground in that original survey image. The 3D problem occurs when the data does not lie on the ground. It could be beneath the surface in a yet to be excavated trench, or it could lie in a cave. GIS produces a 2D reference but has limitations with 3D information. Clearly two items, could occupy the same 2D (plan view) location and yet be vertically separated by several metres. One possible way round this is to produce 2D slices 1m apart. This is not ideal, however, because of undulations in the landscape, it becomes very difficult to keep data together and again one is faced with the problem of fitting the data to the database rather than fitting the database to the data. GIS therefore is limited in many cases to describing a 2.5D surface contour. It is able to show the surface but not information about what lies above or below it.
1.3.7
Data Dissemination
When data collection on site has been collected, the long exercise of post-excavation data dissemination begins in earnest. Some data and undoubtedly some interpretation will have taken place directly on site. It is after that all the data must be extracted and structured into some form of report. Often a great deal of this information can be graphed and visualized using large GIS (Geographic Information Systems) packages such as ArcView [ArcView]5.
Figure 4 ArcView 8 can handle masses of information and display it graphically [ESRI]6
13
Chapter 1 Introduction Post fieldwork is very much like planning the writing up of a Ph.D. It starts with a review of the primary research questions and then decides whether the data obtained is able to answer them. Most of the data will have been collected in accordance with the original research aims, but great flexibility is required, due to unexpected finds. The post fieldwork phase is performed back at base such as a university, as high-power computing facilities are often required. The post fieldwork phase can often be the longest phase, most drawn out and in some cases more expensive than the work in the field.
1.3.8
Archaeological Interpretation
Archaeology is not simply the recording of information in the field. Recording is merely a single step in the quest to answer the archaeological research questions from the project planning stage. There are reasons why the data is important as well as reasons why it is not, and these depend on the outcome of the excavation. Recent advances in surveying techniques allow a site to be recorded with unprecedented levels of detail, unthinkable a few years ago. A single LIDAR (Light based Distance and Ranging) survey taken from an aircraft can produce millions of data points of the site, building up a 3D picture of the terrain. From the point of view of sheer data volume, there is clearly much more detailed data than ever before and it is important data, but fundamentally, one should not loose sight of the original aims of archaeological work in the first place. Archaeological data is just data until it is interpreted. It is the interpretation of these archaeological clues left in the landscape, and material finds that leads to the answers originally sought. It is very important to note that regardless of how much information is fed into a database on an archaeological site, a computer cannot interpret the data, only process, organise or render raw data. Interpretation still requires a human with experience, for the time being at least. Archaeological interpretation is partly an art, using as many of the clues as possible to make an educated best guess as to what the data means. For example, only foundations may survive for buildings, so the archaeologist will have to make a best guess as to what the building may have looked like. This might require a detailed knowledgebase of similar surviving structures and knowledge of the structures of the time. Nevertheless, the outcome is only an interpretation. Whilst unprecedented levels of detail are now possible at the recording stage, some can often be confused and assume that all of this data is 100% reliable. Computer simulations of events can often be convincing; one can assume the interpretation of events is correct because the simulation takes away some level of imagination. There is a concern that too much detail may cloud the interpretation in some situations.
Computer simulations of architecture may well be very 14
Chapter 1 Introduction compelling and based on real data but, at the same time, they may well be wrong. It all depends on what one is seeking from the data in the first place.
1.4 The Potential for Wearable Applications Out in the field, a wearable device could potentially deliver in-field information and be used to log and interpret data in real-time. In the early stages of planning the excavation, old documents and records from archives could be digitised and stored on a computer, making it easier to find and cross-reference on site. It is highly possible that this could be a significant application for a field assistant – to hold previously recorded information about the site for reference on site. Using digital communications, image data as well as measurements and textual data could be transmitted wirelessly. Potentially, the aerial survey information could be relayed back to the ground from a digital camera almost immediately. A further application for the field assistant could then be to store the image from an aerial survey and have that cross-referenced with the other data. Other more complex forms of data can be collected from an aerial survey such as LIDAR, discussed earlier. This information cannot be viewed on a 2D paper print out and would need to be extensively processed, but a field assistant would allow this 3D information to be visualised more easily, allowing real-time manipulation of the 3D model on site to aid the archaeologists. There are also many other types of geophysical data that are collected in various ways. It can often be quite difficult to make sense of the information on site, and the readings will need to be processed in order to make a meaningful visualisation map. Typically, maintaining the integrity of the data and making sure the different layers all line up is an involved task. Using a field assistant with positioning capabilities could allow the field assistant to control the sample points, thus making sure the data always remains aligned. The previous sections have highlighted the need for large amounts of data to be collected and kept together. Data is used in at least four ways in the field. 1. Some information is collected before any fieldwork is carried out. Information such as maps, plans are usually organised in some fashion and taken out into the field 2. Data is then collected in the field adding to that already collected. The information collected in the field depends on the research questions, the site and the objectives.
15
Chapter 1 Introduction 3. Data is then removed from the site along with material remains to be processed afterwards back at base. 4. Back at base the information is then analysed in order to provide answers to the original questions of the site.
1.5 The Wearable Role A wearable information system potentially has most impact in areas 1 and 2 by providing instant access and visualisation of previously acquired data and can store new data from a range of different inputs. The data appears quite diverse, but arguably, there are only three types of data. 1. Textual data 2. Numeric data 3. Graphical (Audio / Visual) data Textual data can be used to represent descriptions of artefacts, worded descriptions of objects, the site and brief observations. It can also be used to record data that does not easily fall into categories, or for items that require extra description. Numeric data is required for measurements, plans and elevations etc. Numbers can represent measurements, spot heights, angles and coordinates on site. Visual data such as that recorded by the drawn or photographic record are required to be stored in a manner appropriate to the observations taking place. Visual data is often complex and is difficult to fuse with all the other data. Objects contained in the images are difficult to link to the observations about them. Some of the drawn record can be replaced or supplemented by modern surveying techniques. However, surveying techniques generally offer a less focused general view, whilst hand drawn diagrams and sketches can be much more focused, specific and flexible.
1.6 Wearable Computing for Field Archaeology – Research Questions The following are five research questions, from which the rest of this study is based. These questions form the basis of the argument for wearable computing in field archaeology.
16
Chapter 1 Introduction
1.6.1
The Classification of Applications and Technology – Research Question
Not all applications require the same amount of computing power to support them. Some tasks can easily be supported on a small handheld device (PDA), whilst computationally intensive tasks do require significantly more. Splitting the available hardware into three different levels, what are the advantages and disadvantages of using each level in a given situation? What are the differences in power consumption? Are any other factors affected?
1.6.2
Digital Field working Applications – Research Question
Some fieldwork tasks can already be integrated and run on PC hardware in the field. Does the nature of a wearable system affect the applications that one might choose to use and the way in which it is used? Annotation is extremely important and is currently best performed on paper, but can freehand drawing be supported and annotations still be searched and located easily?
1.6.3
The Anatomy of a Wearable Field working Device – Research Question
Hobbyists, researchers and even commercial enterprises have built many examples of wearable computing systems. What are the main requirements for a field working wearable application? What are the technical challenges, and can they be overcome with existing technology? Does the technology exist to build a fieldwork wearable system today?
1.6.4
Unlimited Technology – Research Question
Current computer technology trends dictate that processing power will continue to increase whilst cost and size will continue to fall. Recent significant increases in both local and long distance communications may have a significant impact on future systems. If technology were not an obstacle, how could a wearable computer system work for the archaeologist? What impact is this likely to have on the traditional archaeologist?
1.6.5
Other applications – Research Question
This study is concerned with the application of wearable computing systems in the field for archaeology. It is thought that many of the applications and findings will have uses in other situations as well. What other applications could make use of this technology?
1.7 Thesis Structure The remainder of this thesis is organised as follows.
17
Chapter 1 Introduction Chapter 2 includes a literature review, which looks at wearable computer systems in general and investigates the problems associated with their usage. Notable wearable research is investigated. The chapter looks at the various technologies that directly relate to wearable computing in a general sense and discusses some previous attempts by others to use such systems out in the field. Chapter 3 discusses some interesting findings encountered when different levels of computing power are considered for use in a wearable system – a three-tier classification index is discussed and some interesting trends develop. In addition, this chapter discusses the limitations imposed on wearable systems, and explores why some sensible compromises have to be made. Chapter 4 discusses some experiments carried out in the field and includes the results from three field trails conducted during this research. A great deal was learned out in the field. Details from these observations, such as the data collected, in addition to how the data can be represented are offered. Based on some of the findings from previous experiments, the design and building of a new wearable system the Chi-3 is discussed. Chapter 5 explores the development of one of the key requirements of a field-based data capturing system. The ability to annotate objects of interest and how to support freehand sketching in the most natural way are examined in this chapter. A novel annotation system is evaluated in user trials and the results are encouraging. Chapter 6 discusses a local positioning system that allows measurements to be made and objects to be captured in 3D. The local positioning system is a short-range acoustic based system that allows positioning information to be used in areas where global positioning and other measuring technologies cannot reach. It also explores a forensic archaeology application used to evaluate the system, and discusses how the practical shortfalls of the system can be overcome. Chapter 7 is a brief overview of the previous sections, presenting the findings from the study and how they can be used in archaeology and other closely related disciplines. This chapter attempts to build a sensible specification for a field working solution based on today’s technologies. Finally, it looks at what developing technologies could mean for our future archaeologist based on the findings in the present.
18
Chapter 2 Literature Review
Chapter 2
Literature Review
19
Chapter 2 Literature Review
2.1 Introduction Wearable computing by itself is an interesting topic, with systems developed for all manner of applications. This section, aims to bring together some of the key wearable systems and looks at the technologies that are both closely related to and influencing the current and next generation of wearable systems. This section also discusses why having a wearable computer is not a complete practical solution for field archaeology as there are many other aspects to consider. The social impacts as well as the human factors are equally important to consider – if they are overlooked, even the best system will not be adopted.
2.2 Wearable Systems Past and Present Wearable computing is not really a new idea, but its technical feasibility was a significant barrier to earlier adoption. Providing a computer system in a wearable format would have been impossible just a few years ago.
Figure 5 1986 - The IBM 5140 PC Convertible ® - for the first time, a PC that could be operated away from a power source, for a short while at least [IBM 5140]7.
In fact, among the first portable PC’s was introduced by IBM as recently as the mid 1980’s. Like the ‘IBM 5140 PC Convertible’. For the first time, this product allowed the use of PC power in areas where mains electricity was not accessible, free from the desktop. This was a quantum leap forward for mobile computing because just ten years earlier, most people would have considered a computer to be a large multi-roomed machine, only affordable to big companies. This machine, however, was portable. One can only use the term ‘portable’ very loosely, this machine would not have made a very good wearable – it was quite large and heavy weighing at least 6 Kg and costing as much as £2200 in 1986. The system was adopted to a limited extent, people saw the benefit that
20
Chapter 2 Literature Review it could bring to their work, even though it was awkward. It ran DOS (a Disk Operated System) which meant that copious amounts of disk swapping was required, just to get it going, which was slow and inconvenient; disk swapping on a wearable system could be tricky. Since then hardware has reduced in price, reduced in size and has increased in capabilities to such an extent that it can be built into a form factor small enough to be worn conveniently about the body such as the system demonstrated by the author with the WearCAM on the Rome field trial in 2000 [Cross 2000]. Being small has its obvious advantages and disadvantages, but being wearable has its own unique problems. Being wearable gives rise to all sorts of interesting problems that make it difficult to build a useful and usable system. Perhaps now, for the first time in computing history, we actually have enough technology. Getting enough computing power on the person is not a problem any more, depending on the application, and some users such as Steve Mann [Mann 1997 at al], for example, are happy to use an awkward text-based interface, to use the system as it is.
2.2.1 Early Wearables – The Tin Lizzy The Tin Lizzy [Tin Lizzy]8 was the Massachusetts Institute of technology’s (MIT’s) first attempt at building a general purpose wearable, and was built back in 1992 by Thad Starner and Doug Platt [Starner 1995] and [Starner 1999]. It was initially designed as a platform for general-purpose wearable computing applications, not built for any particular purpose. The Tin Lizzy was based around a PC/104 486 DX 100 MHz Ampro motherboard and offered fantastic adaptability. The PC/104 specification is essentially a complete IBM compatible PC motherboard that has similar dimensions to a 3.5” Floppy Disk. PC/104 boards feature a stack through bus, which means that it can be upgraded by adding more boards to the stack. This meant that Starner and Platt [Starner 1995] and others are able to adapt the hardware to any given situation such as the StartleCAM discussed in detail later. The Tin Lizzy gets its name from the Model-T Ford which was also said to be adapted to a variety of situations, it was the hope of Starner and Platt [Starner 1995] that the wearable would also be adopted and then adapted by others as well. The Tin Lizzy is arguably the standard by which many wearable systems are compared, and rightly so.
21
Chapter 2 Literature Review
Figure 6 some of the Tin Lizzy hardware [Graphic Derived Fr. Healy 1998]
The Tin Lizzy’s basic configuration in 1992 was: o 486/100MHz Ampro PC/104 core o Twiddler9 one-handed keyboard o Sony NP-F730 or NP-F950 Info-Lithium batteries o 16M RAM o 2 serial, 1 parallel port o 1.35GB 2.5" IDE Toshiba hard disk o 10 Hours battery life (unverified) By today’s standards the hardware seems quite low specification, but in 1992 a 486 100MHz would have been seen as sufficient for a desktop PC let alone a mobile device. The Tin Lizzy had a range of display options depending on the environment, some were better than others and arguably, the display technology was the least mature technology of the whole system. Fortunately, the systems universal standard VGA connector allowed it to be connected to any display as and when they became available. The Tin Lizzy could be connected to the following displays: o 720 x 280 monochrome Private Eye display o Micro Optical QVGA (320x240 Quarter-VGA) grayscale glasses display o Liquid Image M1 display QVGA (320x240 Quarter-VGA) grayscale The Lizzy was upgraded after some time to version 2.x and the maximum specification posted for the Lizzy was claimed to be: o 150 MHz Pentium 22
Chapter 2 Literature Review o 128Mb RAM o 6G hard disk (using two Toshiba 3Gb drives) o 3 camera video digitizer with 56001 co-processor Adjeco digitizer o CD quality sound/MIDI Crystal-MM sound board added to the stack o 56Kbps wireless Internet connection CDMA digital cellular service not available in many areas o Color VGA+ (640x480) resolution display The Tin Lizzy was a success in that it worked and was wearable. Thanks to the modular PC/104 based system, the system could be upgraded to the specification shown above and one would guess could be upgraded still further should the need arise. PC/104 boards are primarily designed for automotive of industrial control applications, and are therefore very robust indeed, which is ideal for wearable systems. Unfortunately, upgrade boards add significant thickness to the overall design. Back in 1992, the Ampro board was not a complete integrated system and required multiple boards to make a basic working system such as a VGA card. The Tin Lizzy is important to the history of wearable computing because it is one of the earliest modular wearable computing systems. For the rest of the wearable community the plans for building the Tin Lizzy were made available on the web, which undoubtedly helped move wearable computing and consequently the development of technologies such as Head Mounted Displays forward. In addition, the PC/104 architecture lends itself to great expansion possibilities and allows the system to be very adaptable. Before the Tin Lizzy, there were examples of wearable computing systems, but the method of choice was to ‘hack’ standard laptop hardware systems. This is not to say that hacking laptop hardware was not beneficial in its own way. Many research efforts still use laptop hardware today, knowing that hardware will be available. A laptop offers a convenient proof-of-concept platform for studies that investigate other aspects of wearable computing.
23
Chapter 2 Literature Review
2.2.2 The StartleCAM (Tin Lizzy Variant)
Figure 7 Tin Lizzy wearable computer applied to a Cybernetic camera system [Healey 1998]
The StartleCAM is related to the Tin Lizzy because it was based around the Tin Lizzy’s hardware architecture. Proposed by Healey and Picard [Healey 1998], the idea of StartleCAM was that the system would take pictures by being consciously or pre-consciously stimulated by a skin conductivity response [Healey 1998]. The basic Tin Lizzy hardware was augmented with analogue to digital converters connected via signal conditioning circuitry from skin conductivity sensors (see Figure 8). Instead of the user controlling image capture in the usual way (such as using a button), the wearable computer system’s electronics were used to perform real-time analysis of the skin conductivity of the user, thus triggering the capture.
Figure 8 the StartleCAM based on the Tin Lizzy [Healey 1998]
Under certain circumstances such as the user being ‘startled’ the users skin conductivity will change in a way that can be detected by the system and the software. This triggers the system to 24
Chapter 2 Literature Review capture pictures from the camera (which already has a history buffer of images from the last few seconds) and records them accordingly. The system can be wirelessly connected in order to share the pictures captured. The images could be shared on the Internet or amongst specific people. The StartleCAM is a good example of how versatile the PC/104 architecture is and it shows that realtime data could be collected and sent wirelessly to a remote location. It could be argued that the basic computer system itself was not very wearable (see Figure 8 above). It was believed that this could be improved given time and development.
2.2.3 Carnegie Mellon University Wearables the VuMan and Navigator Series
Figure 9 CMU VuMan Wearable with the rotary dial [Smailagic 1993]
The VuMan10 wearable system was designed at Carnegie Mellon University (CMU). There were three versions of the VuMan as well as some Navigator variants, the VuMan 1 [Akella 1992] 2 [Smailagic 1993] and the VuMan 3, with slight variations on each one such as ruggedised versions like the VuMan 2R for example.
The VuMan computers were mostly used as visualisation
platforms for a variety of situations. Using a simple method of input composed of only three buttons, the VuMan 1 could be used to navigate through a virtual blueprint of a house. The 1991 VuMan 1 [Akella 1992] was of semicustom design - based around a 80188 processor running at 8MHz, with a maximum of ½ Mb of RAM, consumed about 4W and weighed about 1.5Kg [Smailagic 1998]. The display used was a commercially available head-mounted-display (HMD) the Private Eye. This type of display is consistent with other wearables around that time. Creating a display is a complex task, and is in itself the subject of substantial research efforts at institutions such as Cambridge Display Technologies (CDT). Following the VuMan 1 was its newer cousin the VuMan 2 in 1993. The VuMan 2 [Smailagic 1993] was simpler and easier to build, yet at least twice as powerful. The VuMan 2 was a fully custom design – still based around an 80188 processor but increased to 13MHz; in addition, the 25
Chapter 2 Literature Review complexity was reduced from 24 to just five integrated circuits.
Despite the reduction in
complexity the memory was increased to support up to 1Mb of RAM, whilst at the same time reducing the power to just over 1W and the weight to 250g [Smailagic 1998]. The VuMan 2’s tasks included campus tour navigation and a maintenance assistant. Applications could be changed or modified by simply sliding in a different flash memory card. The VuMan 2 was further upgraded with the VuMan 2R variant, which offered a rotary dial similar to that used on the later VuMan3 instead of the three-button interface used on the VuMan 1 and 2. The 2R was also fitted with a more robust case, resistant to shock, vibration and moisture, suitable for more hostile environments. The 1994 third generation VuMan 3 was developed and shared some of its innovations with the 2R, from the second generation, and both were developed with a slight overlap. The VuMan 3 offered several technical enhancements that were available at the time, offering much more processing power, whilst taking advantage of power management techniques to reduce the power wastage. The VuMan 3 was based around an 80386 running at 40MHz which now could address up to 420Mb of RAM should it be required [Smailagic 1998]. The power consumption and weight had increased, but by a very much smaller margin when compared with its capabilities. The VuMan 3 was more flexible than its predecessors, as it allowed modular expansion capabilities with the addition of a further expansion slot.
Figure 10 the VuMan 3 being used for maintenance tasks; note it is controlled with a single rotary wheel [Smailagic 1993]
The range of VuMan computers is important because it charts the early to mid 1990s development of wearable computing systems. One of the most important outcomes of the research was the development of design methodologies for power management and rapid prototyping, something 26
Chapter 2 Literature Review that is of ever-increasing importance in modern wearable or ultra-portable computing devices. By observing the Carnegie Mellon range of devices develop over time, it is clear that real progress was made with the VuMan and Navigator projects. One of the best characteristics of these computers is their simplicity; whilst the underlying technology is based along the lines of a standard Personal Computer (known as x86 architecture) the computers themselves are relatively simple affairs, using only three buttons in the case on the VuMan 1 and 2, and a rotary dial on the 2R and 3 computers. There are many examples of attempts by others to create a generic wearable systems and even commercial examples, but the VuMan is very much intended to be application specific. Nevertheless, flexibility remains because the application can be changed by changing the flash memory card - a very desirable feature.
2.2.4
The Rome Wearable Computer Essex University UK
Figure 11 the Rome Mk2 (Vase Lab Essex) it is almost five inches thick. It requires four boards for basic PC functionality. [Vase Lab]11
At the Vase laboratory at Essex University, a wearables group started building their first wearable; the Rome (Mk1) and the later Rome Mk2. The core technology used was PC/104 like the Tin Lizzy. The system was based around a Cyrix 5x86 Ampro board, which allowed a memory capacity of 20Mb. The system was powered by two Duracell 3.6Ah batteries, of the type used to power video cameras. Linux RedHat version 5.2 was installed on the 1 GB Hard Disk. The system was controlled by the user using a Twiddler handheld keyboard and used a GPS receiver to obtain its location outdoors. One of the main issues with the design of Essex’s wearables was the fact that even the most basic configuration still required multiple PC/104 boards. This made the first Rome very thick, and from Figure 11, one can see it is so thick that it prevents the users arm from resting naturally. The early Ampro boards did not include the Graphics card which increased the thickness and lead to problems with the wearable being too thick and heavy. 27
Chapter 2 Literature Review
2.2.5
Commercial Wearable Systems – Xybernaut12
To some extent, a wearable computer with current technology is unlikely to become a consumer item and will remain in the domain of a specific group of users for some time to come until they become more user friendly. They generally fall into a zone of very application specific work such as maintenance or inspection tasks.
Even so, the potential market is still large enough for
companies such as Xybernaut to be successful. It could be argued that a traditional desktop computer, following the same lines, has only just been developed far enough to become a consumer product. Fortunately, modern electronics and operating systems have become more user friendly, and a greater number of users familiar with them, allowing companies like Xybernaut to exist. Xybernaut was founded in 1990 and since then, their real contribution to wearable computing has been their commercialisation success. Building a wearable computer is not necessarily the hardest challenge, but getting it to fit a customer’s specific requirement is - together with costly reliability and support issues. Xybernaut has published several case study reports with a list of successful applications that is constantly growing. o FedEx – parcel delivery o Education and classroom support, particularly for those with disabilities o Department of transport project management o Increasing customer service efficiency o Media and electronic news gathering o Increasing the productivity of military personnel in the field o The telecommunications industry A common theme to most of these applications is an overall increase in efficiency. The wearable systems seem to be able to bridge the gap that otherwise results in communication breakdown particularly in large companies. Currently Xybernaut have a range of different wearable computing devices, from large fully functioned machines, to very much trimmed down versions, depending on the requirements of the user.
28
Chapter 2 Literature Review
Figure 12 Xybernaut at COMDEX [Comdex]13
The Xybernaut MA® TC and MA® V devices are traditionally what one would consider a classical wearable computer, which is essentially a PC-based device in a wearable package. These devices are able to run full operating systems such as Microsoft Windows™ and thus offer compatibility with customers existing software and to some extent some of their existing hardware. Both the MA® TC and MA® V devices are able to support high-resolution SVGA (800x600) or higher displays as well as support a tablet-type attachment.
Figure 13 the MA TC (Mobile Assistant) [Xybernaut] 14
The TC is marketed as a transferable core enabling the user to take the ‘brains’ of the system with them and insert it into different docking stations so they have the entire PC with them wherever they go. Xybernaut have invested time and resources in numerous patents on this transferable core idea, but it is very difficult to see what advantage it has over a traditional laptop, which is significantly cheaper and more powerful and can be docked offering effectively the same. The TC can be worn in a variety of ways, in vests or belts, and supports a number of input devices from wrist-worn keyboards in addition to speech recognition. Consistent with the TC’s heavyweight application, it supports just about all of the modern digital interfaces that a customer may require including USB, IEEE1394, Serial RS 232, S-Video, PS2, audio and video ports.
29
Chapter 2 Literature Review In addition, Xybernaut offer smaller lighter weight devices such as the Xyberkids®, designed to be used by children as an assistive technology that is said to be able to grow with them. It is designed around the MA-V (mobile assistant five). The Xyberkids is specifically aimed at supporting the learning of a child with disabilities.
Figure 14 the Xybernaut Poma™ [Xybernaut] 15
Finally, the Xybernaut Poma™ (see Figure 14) is a very lightweight system designed to get away from heavy bulky computer systems. Clearly, it is far more limited than its bigger cousins are, and it even runs a lightweight version of the Microsoft Windows™ operating system – Windows CE™. Whilst being lightweight, it is more than adequate to give people access to the services and entertainment that they need or use most, it can play MP3 music, is able to play limited video and can access the Internet and Email. In many ways, it is essentially a PDA, like a Compaq Ipaq (personal digital assistant), with a head mounted display, and because of that it has novelty value. The problem is that Windows CE™ works very well with a touch screen interface, but using a spatially disconnected pointing device makes the interaction more troublesome. For displaying information however, it is ideal.
2.2.6
Via-PC Wearable Systems
ViA [ViA]16 was started in 1993 to provide wireless systems that can be used in a variety of situations. ViA have had commercial success in a number of areas. o Surveying and excavating o Field data collection o Inspection and maintenance o Customer services
30
Chapter 2 Literature Review
Figure 15 field data collection for real estate management [ViA]17
For real estate management, accurate measurements are required. Planning and design need to be completed as quickly as possible. ViA in conjunction with a real estate company were able to apply their wearable PC to assist in the tasks of integrating the measurement information as efficiently as possible, using real-time kinematic (RTK) survey-grade GPS systems. The most notable advantage of using this system (over and above the claimed 40% increase in productivity) is that the measurements are entered directly into a software package called PenMap [PenMap]18, a mapping and data collection application and was used on a sunlight readable hand held screen. ‘The mapping software and sunlight readable display allowed viewing of the field map immediately, thus allowing verification of the survey on-site and eliminating the need to revisit the site for any missed features’ [ViA Survey]19. This surveying was in many ways similar to that carried out by field-archaeologists, although not using quite so many data sources and thus is simpler. It does demonstrate that using such a technology in the field does indeed save time. An increase in productivity can mean several things for a team of archaeologists, it could mean shorter excavation times – leading to cost savings, or it could mean more data could be collected for better, more integrated data. ViA also assisted an excavation firm with the wearable technology [ViA Excavate]20. In this situation, the wearable computer system was used to communicate via a radio link to a robotic Total Station1. The wearable computer allowed them to do all their calculations on-site in real-time and in 3D. The data is entered by hand using a touch screen. ‘We’ve cut the time needed to stake a site [to] nearly one-half. This gives us a distinct advantage in the surveying business’ [ViA
1
A Total Station is an optical surveying device
31
Chapter 2 Literature Review Excavate]. Similar to the other surveying case studies, a clear increase in productivity appears to be the largest factor to the companies involved. ViA also has experience of in-field data collection [ViA Field]21. A farm in California grows over 50,000 trees, and they had a requirement to log data about each tree. In order to do this they required a system that could identify each individual tree. A solution included a touch-screen and wearable system attached to a GPS system. Using the same PenMap software used by the real estate company, the farm was able to track ‘variables’ for each tree, which allowed them to make ‘adjustments’ to help maximise production. In addition to all the survey data for archaeologists, is the requirement to log more detailed information with fine-grained spatial accuracy. Here is an example of such a system. This system employed a sunlight-readable touch screen display that was used as input in addition to a GPS receiver. Perhaps one of ViA’s most visible and interesting applications from a non-specialist’s perspective, is the McDonalds wireless ordering service. The McDonalds application is probably one of the most complete wearable applications.
Figure 16 McDonalds Application [ViA]22
The McDonald’s Corporation, Mobility Concepts and ViA, Inc. worked together to produce a point of sale computer system that incorporates a wireless link back to the main building. All the customer does is drive-in as normal, and the waitress walks round the cars taking the orders on what looks very much like the traditional order sheet (see Figure 16). However, she never has to walk back to the main building to pass the order on, it is already there as soon as it is created, over a wireless link. By the time the customer gets to the hatch, the order is ready.
32
2.2.7
Wearable System Specification Comparison Tin Lizzy
VuMan 1
VuMan 2
VuMan 3
Vase Rome
MA V (Xybernaut)
Chi-3 (Birmingham)
ViA II
Vintage
1992 - 1997
1991
1993
1994
1998
~ 2002
~ 2002
~ 2001
Tech
PC/104
Semi Custom
Custom
Custom
PC/104
Custom
PC/104
Custom
CPU
486DX 100MHz
80188 8MHz
80188 13MHz
80386 20MHz
Cyrix 5x86 133MHz
500MHz Celeron
PIII 700MHz
Crusoe 667MHz
RAM
32Mb
0.5Mb
1Mb
4Mb?
20Mb
128Mb
256Mb
64Mb
Storage
1.35Gb
Flash
Flash
Flash
1Gb
5Gb
10 – 60Gb
6.2Gb
OS
Linux and Emacs
-
-
-
Windows XP or Linux
Windows 2000
Weight
-
1500g
250g
800g
-
455g (chassis only)
710g (chassis only)
625g
Display
VGA
720x280
720x280
720x280
VGA
VGA touch screen or HMD
VGA touch screen or HMD
Battery
3400mAH Panasonic
None Specified
None Specified
None Specified
3600mAH Duracell 2x6V NiMh
Lithium-Ion
3600mAH 12V NiMh or Lithium
Power
5W +
4W
1.1W
2W
6W – 15W
-
7W – 12W
-
Mounting
Backpack
Belt
Belt
Belt
Belt
Belt
Belt Backpack
Belt
3 Button Control Flash Modules
Rotary Jog-Dial Control
GPS
Keyboard Firewire Audio
Digital Camera GPS and WiFi
GPS and other interfaces
Wireless Modem, 3 Button Control Skin Flash Modules Conductance
Table 1 Various wearable system hardware comparison
Digital or Analogue VGA Dual Battery
Chapter 2 Literature Review
Other
Linux RedHat 5.2 Windows or Linux
33
Chapter 2 Literature Review Table 1 shows a comparison between some of the wearable systems discussed in this chapter. The Chi-3 is a wearable system designed as part of this study (see section 4.10 on page 121 ‘Building a Wearable Computer- The Chi-3’). The Chi-3’s specification compares favourably with those of other systems including commercial systems. There is far more to consider, however, than just the raw processing ability of the machine in question. The VuMan 2, for example, has a very low specification in comparison with some of the later devices, but it also has a low weight and small power consumption to go with it. Some situations require nothing more than simple display of information or very limited input; the VuMan 2 would easily be able to cope with these requirements. The VuMan 2 is lightweight, and its low drain on batteries could be used either to keep the weight down (with smaller batteries) or make the batteries last longer. One could speculate that what this table shows is that different specifications are suited to different requirements. The Xybernaut Poma™, for example, is an unfair comparison with these systems listed above because it is designed for very light-duty work, performing only simple tasks. Nevertheless, this still leaves the problem of how to make sensible use of this computing power. The next section investigates why wearable systems can be difficult to use on the move, and looks at some of the work being carried out to try to overcome these difficulties.
2.3 Wearable system - usability
Figure 17 A watch computer from Byte Magazine 1981 [Byte 1981] 23
Figure 17 shows that it was long known that hardware would reduce in size, but try typing your name on this – you would need to use a toothpick.
Interestingly the desktop metaphor is
represented almost in its entirety. One of the biggest concerns with wearable systems is how to use them on the move; the reader may like to consider how they would be able to use a Laptop Computer whilst walking around a supermarket for example; not an easy task. Traditional pointing devices and keyboard approaches
34
Chapter 2 Literature Review have obvious limitations in a wearable system due to their size, and the posture required for their operation. In addition, whilst using head mounted displays such as those used on the Tin Lizzy [Starner 1995], Xybernaut’s systems and others, is the problem of hand-eye coordination whilst using a pointing device. Interaction is clearly hindered by this lack of coordination. For this reason and the fact that wearable systems always follow the user, researchers have identified that the wearable systems may benefit from sensitivity to the context in which it is being used [Schilit 1994 A].
2.3.1
Wearable System Interaction
There is growing evidence to suggest that wearable systems should be designed to minimise the burden on the user is a valid requirement assumption. It has been proposed by some such as Rhodes [Rhodes 1998], Laerhoven [Laerhoven et al 2000], Clark [Clark 2000] and others that the requirements for interfaces for wearable systems differ significantly from the familiar desktop paradigm. There are many novel approaches that try to reduce the amount of attention the interface requires as well as reduce the amount of physical manipulation and time taken to view information, such as Wearable Audio Computing [Roy et al 1997] where speech and stereo effects can be used for both input and output. One must not forget that some users of wearable computers particularly Steve Mann and Thad Starner, both well known in the wearable research community, prefer to use a text-based command driven interface. Opting instead to use EMACS as the interface for everything including web browsing, email etc. The GNU project defines EMACS as ‘Emacs is the extensible, customizable, self-documenting real-time display editor.’ It can be used almost as the sole interface, proving that a windowed based approach need not always be necessary.
2.3.2
WIMP considered fatal
There is growing evidence to suggest that the well-known windowed computer interface known as WIMP (Windows Menus Icons and Pointers), the type of interface used by Microsoft Windows™, is inefficient and the information could be rendered in a more appropriate way for wearable systems. Rhodes the author of ‘WIMP considered fatal’ [Rhodes 1998], Clark [Clark 2000], Newman [Newman 2000] and others agree that WIMP is not the way that (Wearable User Interfaces) are likely to develop. Clark asks, ‘what do we want from a wearable user interface?’ and argues for the demise of the desktop metaphor, at least as far as wearable user interface design is concerned. Both Clark and Newman proposed a new framework called Sulawesi – to support what is called ‘multi-modal interactions’ [Clark 2000].
35
Chapter 2 Literature Review Newman’s ‘Sulawesi’ [Newman 2000] supported by Clark [Clark 2000], represents an attempt to break away from the WIMP design to produce something that they feel is more suitable for a wearable system. In fact Clark goes so far as to state that ‘the desktop metaphor is totally inappropriate’ [Clark 2000] and agreeing with Rhodes [Rhodes 1998]. It could be argued that Sulawesi is a WIMP based environment. It is important to stress however, that Sulawesi is far more than that. The aim of Sulawesi ‘is to provide a "common" integration platform which will be flexible enough to encompass a wide variety of input devices, separating the service (agent) development from the input mechanism’. Therefore, it is a software framework for the services used by a wearable system as well. Whether or not one agrees with the underlying motivation that WIMP is flawed, is unimportant; it is very encouraging and healthy to see different ideas being developed.
Whatever methods are used to design new interaction methods, innovation is
undoubtedly a basic requirement. Perhaps one should ask why a windows based interface is so successful in the first place for its intended desktop application. One of the main arguments for a rethink of the WIMP paradigm is perhaps one of convenience, familiarity and overhead reduction. It seems that the more attention a user assigns to a wearable system the less they can assign to their ‘real-world’ environment, so the interaction with the wearable needs to be as minimal as possible. Some, like Schmidt claim the idea that the more the device knows about the user, the task, and the environment the better the support is for the user and the more the interface can become invisible or seamless [Schmidt 1998]. This inevitably leads to a system that becomes so embedded and fundamental to the individual concerned that it becomes an ‘invisible’ technology.
This invisibility is a concept that was
explored by Norman [Norman 1998] and Weiser [Weiser 1992], where the interface to a system becomes detached from the traditional screen and becomes embedded in the environment, simplifying interaction with systems. Norman felt that one ‘should be able to do tasks without learning a complex technology.’ – (one suspects, while trying to set the timer on a VCR, a task that can defeat even the most technically minded), and argued that any interface should be more natural. This seems at first to have questionable relevance to the previous discussion, but it does illustrate the need for an interface that is more natural and does not require a thick user manual, and that does not bombard the user with irrelevant minutiae.
2.3.3
The Strength of WIMP
So just what are the components of WIMP and can they be adapted for use on a wearable system?
36
Chapter 2 Literature Review Component
Description
Wearable?
Windows
Windows present information or a specific application in its own container. It keeps related objects together and windows can have modality or focus depending on the application or task that is in hand.
Yes
Icons
Icons are pictorial representations of an object or function. This reduces the user’s requirement for a memory model reducing memory recall. Some icons are common to many applications, which helps to reduce the learning curve.
Yes
Menus
Menus offer a restricted set of commands that can be context sensitive, helping both the user and the software manage the interaction.
Yes
Pointers
Pointers are used as a means of manipulating the windows, icons and menus.
No
Table 2 WIMP Components
From Table 2 we can see why WIMP works well on a desktop. In particular, the Icons and Menus are used to support user recognition of commands and tasks, and reduce the burden on the user’s own memory, reducing the need to remember ‘the software’. Often some tasks are very similar amongst different software packages, so the user can use new pieces of software once they get a feel for the interaction method. One could speculate that it is this familiarity that helped make WIMP so dominant, before WIMP was developed many software packages looked and acted very differently from each other. Three out of four components of WIMP can easily be adapted for use on a wearable platform; perhaps the only reservation would be to consider the reduced application area that is often available to mobile devices whether they use a small screen or a Head Mounted Display (HMD), which could keep it simple. Screen pointers on the other hand, offer a significant barrier to wearable systems, mostly, when the system employs a HMD. One solution is to keep the interface very simple. The VuMan range of systems discussed earlier, have either three buttons or a rotary device. This imposes limitations on the system but seems to work well for simple system interaction, such as scrolling through pages of a digital maintenance manual for example. Currently, the most commonly used operating system interface is a version of Microsoft Windows™ [Microsoft AT]24. Attached to most of the machines running this system are a mouse and a keyboard; these together with the display and the sound make up the interface between the user and the machine. Interaction like this seems natural to many who already use computers, perhaps because of familiarity and they learn it quickly and from an early age. Some argue, as discussed earlier, that this type of interaction is not ideally suited to wearable systems by virtue of
37
Chapter 2 Literature Review the WIMP interaction and organisation of information. Table 2 shows that the Windows, Icons and menus can still have a lot to contribute to wearable interfaces, but the problem is the physical ‘connection’ between the computer and the user. Human-Computer interaction (HCI) is an area of research that deals with these issues. Typically, a mouse is used to interact with the traditional WIMP system, but it is not the only form of pointing input that could be used. Table 3 shows ‘generic actions’ in HCI [Baber 1997]. It details some of the operations the user might like to perform using a pointing device, and explores how this could be achieved using a different method of input. Generic Action Select objects Dragging objects
Clicking on an item or selecting from list
Common Interaction Mouse Keyboard
Possible/new methods Pen Gesture
Copying files, moving files, moving a cursor
Mouse Keys
Pen Gesture
Description
Example(s)
Selecting objects on a display screen Dragging objects from one container to another
Changing orientation of objects
Altering the orientation of object(s)
Rotating object through any angle
Mouse
Pen Gesture
Editing data
Entering text and numbers, editing
Typing, naming or modifying information.
Keyboard
Audio command Pen
Table 3 Generic actions in HCI (Human-Computer Interaction) [Baber 1997]
The vast majority of users are confined to the mouse and keyboard approach as illustrated above, but increasing processing power has gradually enabled the user to make use of other inputs such as speech systems like Dragon System’s Dictate or IBM’s Via-Voice. Modern processors from the Intel Pentium™ III (year 2000+) and higher have provided the necessary processing power to recognise continuous speech input. In addition, developments in mobile phones and other low-cost signal processing systems have produced very low-cost dedicated speech recognition building blocks, which can simply be added to an existing design. Some recent mobile devices include pens that can be used directly on the screen such as Tablet PC’s and Personal Digital Assistants (PDAs). This is not particularly new, the Apple Newton project was started in 1990 and the first technically viable version was produced in 199225. However, acceptable handwriting recognition systems have been slow to develop, and often slower to write than pecking at a small screen based keyboard. The performance of a handwriting system is variable and largely down to the individual user concerned. The emphasis here has been training the users rather than the machine. Most people would agree that reading some handwriting is very difficult. Some people cannot even read their own handwriting. The problem is that some letters look very much like others, and in handwritten documents, one letter might look like a completely different one. This could in theory be corrected by using a dictionary of words that the software
38
Chapter 2 Literature Review can then use to self-correct using a given sentence structure, however, people tend to make notes on PDAs, which often means that complete sentences are not used. To get around this developers like Palm Inc. developed a graffiti method of input. This involves using an alphabet of strokes that closely resemble the actual alphabet but makes sure that different letters never look too similar. The clever part of the graffiti system is that all letters are created using a single action (with the exception of ‘x’) and so the user often finds that they have found the right graffiti action without having to learn it with just a few exceptions. Handwriting is only one part of interaction that needs to be performed to interact with a given system. Table 3 shows other interactions that are also required. An interesting observation from Table 3 is that the pen covers all of the generic actions, implying that a pen is sufficient for interaction with the screen for input as well as control. Thus one can see why the Tablet PC is a logical evolutionary step.
2.3.4
Novel input methods
Voice, keyboard and stylus (pen) are all input methods. The pointing device is normally not used as a data entry device, but as a manipulation device. As discussed in the last section, a pen may not only be used to manipulate windows and menus but could also be used to input data. It is also possible to control or manipulate a computer system with other methods that may not be as obvious. Sometimes the interface can be very simple such as the case of the VuMan wearable systems, which use only three buttons or a simple rotary dial. Many systems allow quite complex interaction with a very limited amount of buttons such as a television menu system or a mobile phone. In both cases, Up, Down, Menu and Select allow a complex menu to be traversed and values to be changed. A very simple interaction method can still allow complex communication. This is important because in a field environment, the user is unlikely to want to stop their primary task to clean their hands before attending to the computer. An extreme example of a complex and discreet communication that was demonstrated by a 19 year old student from the Massachusetts Institute of Technology who built a wearable blackjack card-counting computer as an assignment. The student used a concealed computer system mounted on the leg to count cards in a casino. The interface was a simple system of taps between him and the machine. He was ultimately caught by casino surveillance - infrared cameras picked up the concealed device. This, perhaps extreme example demonstrates that the input and output of a complex system does not necessarily need to be controlled by the user’s digits or displayed visually. It is well known that communication between humans is often far more than just words; Schmidt [Schmidt 2000] says that much of the communication is implicit. One might also argue that this applies more to informal communication. A simple subtle nod, wave, point or wink can add significant meaning, or may be redundant. Sometimes it can be difficult to explain an objects 39
Chapter 2 Literature Review location using only words. This can be achieved more effectively by pointing. In interactions between human and computer, it is possible for a computer to understand basic gestures. Thanks largely to the power of modern systems, there are an increasing number of demonstrations of gesture recognition and advanced interaction techniques such as those applications discussed by Gavrila [Gavrila 1999], the gesture pendant demonstrated by Starner [Starner 2000], which uses a camera to distinguish between hand movements, allowing commands to be issued. Recent systems are able to distinguish quite subtle cues such as body language. Body language and gestures can be taken and linked to the discussion of context-awareness like that discussed by Schmidt [Schmidt 2000] and many others. Schmidt’s paper ‘Implicit Human Computer Interaction through Context’ offers a vision showing this work to be important. Schmidt states that computers will be able to sense the situational context. Schmidt means that the input to the system is non-implicit but would still be understood. The implications of this work for the application of wearable computing for field archaeology, is that inputs from discussions amongst archaeologists and measurements could be understood by the computer as if it was another person watching the excavation. Already, work on systems that present previously used information has been demonstrated such as Rhodes’ ‘Remembrance Agent’ [Rhodes 1997]. The system remembers previously used documents and by sensing the current context tries to relate items that may have relevance. This could be driven by a speech input. Looking toward the future, one could speculate that a system could be a pro-active assistant. Should the archaeologist require some information, the question might have been heard by the system and if understood, the system finds related information and informs the user – like being interrupted by someone eavesdropping on a conversation, working along the lines of the Remembrance Agent. The term ‘wearable’ implies that a wearable computer is to be worn rather than handheld. Previously it was seen that some researchers found many traditional interfaces require too much interaction to be useable whilst on the move. For any future wearable system, this interaction overhead must be reduced to a minimum. It is clear to see that although ‘wearable’ does not imply it cannot be used by the hands, this type of interaction is going to be difficult for a number of reasons, especially in situations where both hands are required for safety reasons. The next section briefly discusses how context awareness is a method that should help make wearable computers easier to use in such situations. It is clear that interaction with computers is sophisticated enough at this moment in its level of control for standard desktop applications. It is however not suited to mobile applications whereas size and hands-free control are seen to be an important issue. There
40
Chapter 2 Literature Review are other methods of input, but this area still requires more work in order to make wearable systems easy to use.
2.4 How Context Awareness Helps Wearable Systems Context sensitivity helps to bridge an interaction shortfall by providing a system with limited awareness to a given usage situation. This means the ability to ‘know’ what is happening and respond automatically, thus, reducing the intervention required by the user by making decisions based on observations of the user and the environment. This will be important for any wearable computing system of the future because it is one of the only ways in which interaction is likely to work, especially when hands-free operation is likely to be required. Context is defined thus: Context: f, noun, date. 1568 1. The interrelated conditions in which something exists or occurs. 2. The parts of a discourse that surround a word or passage and can throw light on its meaning. 3. Circumstance Chen argues that although the concept of environmental context-awareness has been around for some time, it has not really been seen in consumer hardware, and is not yet available to everyday users [Chen 2000].
One could argue that context-aware menu design and the infamous
Microsoft™ ‘Paper Clip’, has clearly helped the use of complex systems [Lieberman 1997] they are effectively agents that provide only the help that is required depending on the context and so removing the complication of a very large manual or help system. It makes the use of a complex system easier by only providing prompts that are necessary, thus keeping the dialogue down to a minimum.
For current systems, from a human-computer-interaction point of view, these
enhancements are software only and stop at the screen. For wearable systems, it is generally agreed that context awareness needs to be extended beyond the limitations of the screen. This kind of situational and environmental context awareness could be termed hard-context-awareness, by way of the sensing being done to some extent with hardware sensing. For software only context sensitive systems, it might also seem sensible to call them soft-context-awareness. For future systems, an interface might be built using cues from both the hard and the soft context. One further important point to note at this stage would be the term ‘Archaeological Context’, which should not be confused with context awareness. An archaeological context refers to ‘the orientation and surroundings in which an artefact is found’.
41
Chapter 2 Literature Review
2.4.1
Positioning Orientated Context Awareness System
Purpose
Sensing Method
Context
Call Forwarding [Want ‘92]
Forwarding telephone calls to nearest phone automatically
Active Badge Network
Location in building
Cyberguide [Abowd ‘97]
A Mobile Context-Aware Tour Guide
GPS
Location in a city
PARCTAB [Want ‘95]
Infrastructure for applications depending on the users moving about in the office
Infrared
Location of user and resources
Active Map [Schilt ‘94]
An active map service that keeps clients informed of changes in their environment.
Network
Room location and resource location in building
FieldWork [Pascoe ‘97]
GPS annotation and other sensors in ecological and archaeological fieldwork
GPS
User location
PSA [Asthana 1994]
Personalized Shopping Assistance
Radio Based Micro-Cell
User location and location of goods
Table 4 some examples of context-aware Applications
Table 4, above, lists some of the applications presented by Chen [Chen 2000]. It is not intended to be an exhaustive list of all context aware applications research to date. Table 4 demonstrates that context, in many examples, is determined almost in its entirety by location sensing. It could also be argued, however, that the factor of time is omnipresent. Time would be recorded as a matter of course in many systems, for example, a file system normally includes the date and time a file was created, accessed and modified. With reference to the dictionary definition of context stated earlier; ‘The interrelated conditions in which something exists or occurs’ The key part of this definition would seem to be the word ‘interrelated’, which itself suggests that context is related to more than just one factor, indicating that many factors need to be determined for a given context, and that these factors are all important to distinguish context. This supports the idea that position alone is insufficient to determine context. In the course of a single day, one might have walked past the same location many times, but each time, the job in hand, is likely to be different. An application that relies solely on the position does not make a context sensitive application, though it might make it a navigation tool.
2.4.2
There Is More to Context than Location
Schmidt points out there is more to context than just location, the title of his important paper on the subject [Schmidt et al 1999]. In his paper, Schmidt identifies a number of different approaches to context sensitivity including a very simple sensing system that detects other environmental 42
Chapter 2 Literature Review contexts in addition to the user’s location. He presents a simple tilt-switch that can dramatically improve the user interface of a handheld system such as a PDA (Personal Digital Assistant) by rotating the display to match the orientation that the user is holding the device. It appears that the use of the term ‘context-awareness’ is often used carelessly, in that fitting a Global Positioning System (GPS) to any off-the-shelf piece of kit could give it added value and be called ‘context aware’. The definition of context in this sense would mean that the system would have to do more than just tell you where you are. For example, suppose that a wearable PC is telling you that you are 52° 55’55” North and 1° 22’22” West which just happens to be somewhere in Birmingham UK, it might be useful only if the user knows what the information is telling them. In addition, the previous definition of context “The interrelated conditions in which something exists or occurs” [see page 42] implies that position alone is insufficient. Therefore, it is important to consider how this information is relevant. GPS can be expanded and other information can be gained from the raw data producing secondary cues. For example, by measuring speed, the system might determine the user is walking, since there is a valid GPS signal, the user must be outside, and from the GPS coordinates, the system might determine that the user is approaching a large building of significance. Then it could display details about this building. Although limited, this kind of approach has been used on several systems such as interactive guides e.g. such as that presented by Cheverst [Cheverst 2000] - the GUIDE project and the WECA-PC (Web Enabled Context Aware – Personal Computer) from Birmingham, UK [Bristow 2000]. The WECA-PC now uses location in addition to posture, the user’s diary and time. Lpez [Lpez 1999] describes several different types of location-based systems such as infrared active badges [Want 1992], ultrasonic tagging [A. Ward 1997], PARCTAB [Schilit 1994] ultrasonic bats [Harter 99], and radio-based technologies such as the Bahl’s radar system RADAR [Bahl 2000] as well as the obligatory GPS.
2.4.3
Visually Sensing Location
Imaging is a popular characteristic that has been a part of many wearable systems, even when they are not for implicitly taking photographs.
Some researchers have attempted to use imaging
capabilities to deduce the location of the wearable system [Aoki 1999] and hence assist the determination of its context as previously described. Johnston discussed a variety of methods to determine the location of the system ranging from Global Positioning Systems (GPS), commonly used on wearables, to a vision based positioning system – VPS (Video Positioning System) which
43
Chapter 2 Literature Review uses a system of patterns and pattern recognition. The system works by recognising the patterns and thus obtains the location [Johnston 2000]. Vision has also been used in the opposite sense in a ‘Smart Environment’ whereby it is the environment that has the distributed vision system that can see the users or objects in its space. TRIP: A Distributed vision-based Sensor System described by Lpez [Lpez 1999] is one such system. TRIP (Target Recognition using Image Processing) uses the combination of visual markers (2-D circular bar code tags) and video cameras to automatically identify tagged real word objects in the field of view [Lpez 1999]. This can then be expanded to include tracking and orientation detection of objects and people. To conclude, it has been seen that location is very important in determining the context; however, it is not necessarily the only input required to determine the context accurately. A combination of factors seems to be the way context research is heading. Other situations might depend on the time and previous contexts, for example, rather than just the location to help determine the current context. It has been seen that imaging capabilities seem to be very widespread on wearable systems, and can be used to determine location.
2.5 Imaging for Wearable Systems There are a number of ways in which a camera attached to a wearable computing system can be used over and above just taking pictures. Many wearable systems have included a camera as a way of sensing context by position as previously described (See section 2.4.3 Visually Sensing Location), recording information and as a basis for augmentation. It appears that imaging devices have an important role to play in mobile devices. The proliferation of imaging devices such as digital cameras, videos and web-cameras has helped to make digital imaging a lucrative industry and driven down production costs significantly. This in turn has encouraged even more use of small inexpensive imaging devices. Traditionally Charge Coupled Devices (CCD’s) were used extensively and almost exclusively as the main imaging element in small cameras. Recently, some new methods for image capture have been developed to a level where they can make a real impact on both price and integration on new devices. The CMOS imager can now be produced at very low costs and has many advantages to the hardware designer making it easier to integrate. Litwiller describes a summary of the two technologies in this rapidly developing area [Litwiller 2001] and shows why CMOS is becoming more widespread and what it means for the industry in the near future; ‘CMOS imagers offer superior integration, power dissipation and system size at the expense of image quality, particularly in low light.’ It seems that whilst traditional CCD’s may offer superior imaging capabilities for high resolutions such as digital cameras, and in low light levels, for very small embedded systems the CMOS imager better suited due to its small size, weight, power usage and cost. ‘Most functions are integrated into the chip. This makes the imager 44
Chapter 2 Literature Review functions less flexible but, for applications in rugged environments, a CMOS camera can be more reliable’ [Litwiller 2001 pp2]. This means that one can expect cameras to find uses in all sorts of technologies in the future. Thanks to CMOS, adding a camera to a mobile phone adds very little to the cost of the phone, but increases the phone’s capabilities substantially. So why do so many wearable projects use imaging? This might have a great deal to do with early wearables such as the MIT Wear Cam (original) study conducted at MIT by the Mann [Mann 1992- 1997], other examples include the Startle Cam [Healey 1998] and numerous other examples of what can be achieved by combining imaging with a wearable platform. Wearable, or at least ultra-small imaging devices are an area of commercial interest. Casio [Casio]26 have produced a wearable camera wristwatch, although with limited capabilities, the watch has the advantage of being ubiquitous making it always available to the user without them having to get it out and switch it on. The success of such a device, it could be speculated, could largely be due to its social acceptance. The ability to be a fashion accessory at the same time increases the proliferation of such devices. Palm™ [Palm]27 users also have basic imaging capability in the form of the Palm-Pix which is a small digital imaging device that can be attached to the Palm™ range of PDA’s (Personal Digital Assistants), enabling the user to take quick snaps [Kodak]28. The true advantage to this over a small digital camera is that the target user base already carries around the majority of the hardware. In addition, the hardware has far more versatility than any camera. The user can attach the photograph to emails, beam it to friends, or even annotate an image with something they do not want to forget. Something that could not be done using any normal camera. The fusion of imaging with messaging has recently been introduced with an ever-increasing range of mobile phones and other portable electronic devices containing a camera. A picture says a thousand words – this statement is true in more ways than one. Sending a multimedia picture message from a mobile phone can easily use as much space as a thousand words, and the current mobile telephony system was never designed to cope with this kind of data. Hence the name SMS – short messaging service.
45
Chapter 2 Literature Review
2.5.1
How Imaging Has Increased the Bandwidth
Figure 18 the Sony Ericsson T68, the First Picture Messaging Phone in the UK on T-Mobile (May 2002) [Bee Wireless]29
Recently, even without a full third generation (3G) mobile telephony network in place, there have been examples of mobile phone multimedia messaging such as the T68 (see Figure 18). More and more users are taking advantage of picture messaging; it has become difficult just over a year later to find a phone that does not have some form of multimedia messaging capabilities. Picture messaging involves taking a photo with a very small CMOS camera mounted in the mobile phone or as a small plug in module, and then to transmit this picture to friends with phones that can read multimedia messages. The problems with such a technology are that both parties need to have the same type of hardware but thanks to the high rate of phone renewal and upgrades, many people change their phone frequently. Advertising would like to have people believe that the images are sharp and that the service is fast, unfortunately neither are true, but this is set to change.
46
Chapter 2 Literature Review
Figure 19 3’s 3G coverage (June 2003) [Three]30
To push network data rates even further is video messaging using the newer 3G networks (Third Generation). At the time of writing only a handful of phones have been capable of making use of video messages, and the 3G-infrastructure coverage is not extensive. The reader might like to compare the 3G-network coverage with that of the existing mobile network in Figure 19 (the darker areas are 3G coverage). Early adopters of the technology will have to make partial use of the existing network. The problem is that users cannot rely on the 3G coverage to send a video message, although the digital networks many people have now become accustomed to started out this way and now has extensive coverage. This higher bandwidth connection for mobile devices has indirect and beneficial implications for wearable and other mobile applications, provided that the cost comes down. Unfortunately, how well the population takes to 3G will also depend on the cost coming down. 3G has the potential to fill in the missing link between field-to-field and field-to-base communications. Thanks to imaging on mobile networks, the amount of bandwidth available is increasing for all mobile data requirements. This bandwidth was created to support the demand for the large amounts of data transfer required for images rather than text (SMS) messages, but importantly for users who require data links on the move, it will enable and in some part pay for this infrastructure. 47
Chapter 2 Literature Review
2.6 Wearable Displays – The Head Mounted Display Part of the discussion for adopting a new wearable user interface might have been based on the assumption that a field-working device, as with many other mobile devices, would be limited to a small screen. This is because typically with a wearable system, there are two main groups of displays that are available to the user. o A Head Mounted Display (HMD) o A hand-held screen Many peoples description of a wearable computer are likely to include a Head Mounted Display (HMD). It simply seems the right sort of display to use. For this reason, it is often thought of as the ultimate solution to the wearable computer display problem. However, it is very important to consider the implications that a HMD might have very carefully. It is clear that if the user’s field of view is restricted a dangerous situation could arise, possibly resulting in an accident; at best walking in to a lamppost, or worse getting hit by a car. Unfortunately, for the HMD, much research is showing that the HMD has serious problems associated with it. •
Field of view restricted or partially obscured
•
Increased risk to the user because attention is diverted
•
Interferes with everyday normal activities •
Sitting
•
Walking
•
Eating
In addition, more subtle and complex effects have been studied. The switching of attention from the real world to the HMD (virtual or synthetic world) can have a detrimental effect. McCann et al [McCann 1993] identified that near and far domain attention focus switching costs the user time and attention in both, leading to lower performance in both domains. Aside from the problems associated with a HMD giving rise to disorientation and sickness, McCann’s work was more involved with a Head Up Display (HUD) found in typical fighter aircraft. It was found that pilot tasks were impeded when the attention was changed frequently from near (the HUD) to far domains (the runway). It is logical to assume that the same effect would occur with a HMD because the attention of the user is required to alternate in a similar manner, and may even be exaggerated. However, the effects that the HMD has on the user appear to be far more involved than first thought.
48
Chapter 2 Literature Review Alfano [Alfano et al 1990] and [Sampson 1993] showed that restrictions on the field of view disrupts the eye-head coordination of the user and affects their perception of size and space leading to all sorts of unforeseen difficulties that might not at first appear to be caused by the HMD. The HMD effectively produces a monitor floating in free space in front of the user’s field of view. This monitor is fixed to the movement of the users head and not to that of the surroundings. The human body uses a variety of sensory inputs to derive its orientation and balancing mechanisms. If the information from the eyes is mismatched from the information of the inner ear - for example, this can lead to disorientation and is responsible in some cases for motion sickness. In our own studies carried out at the University of Birmingham, UK, using the Chi-3 wearable it was found that the use of a HMD to search for visual targets not only influenced perceptual abilities, such as people might miss some targets, but also impaired ability to recall targets later on. Thus the actual memory of the user was impaired. Interestingly it was not just impaired because of a reliance on the technology to spot the targets, but was impaired merely by the presence of the HMD [Baber et al 2001]. One could suppose that using a HMD that completely covers the user’s field of view but allows one to see through it might alleviate some of these effects. Unfortunately, this is very difficult to achieve. The forward field of view of a typical human is typically 200° [NRC 1997]. The NRC argues that from a range of displays tested the visual field of view typically fell in to the range of from 16° – 60°, which is significantly narrower. Although the usable visual range despite the peripheral vision is much narrower than the 200° prescribed here, it was shown that the narrow field of view, in real environments, could degrade performance on spatial tasks such as navigation, object manipulation, spatial awareness, and visual search tasks. In addition, it has been shown in studies at Birmingham that a monocular HMD lead to far greater head movement because the participants in the experiment had to move their head in order to view a target through a narrow display [Baber 1999]. Again, this could be attributed to the relatively narrow field of view presented by a HMD. Participants not using the HMD were observed to move their eyes in preference to their whole head. There have been a whole host of other observations that HMDs cause dizziness, sickness and headaches, due to a combination of factors and many of these effects are just beginning to be explored. The lack of relation to the HMD, the real world and the users input device such as a mouse or keyboard means that a HMD is only suitable for one-way visual information conveyance to the user rather than interaction in its traditional two-way sense. A typical form filling exercise is very difficult although not impossible with a HMD. A hand held display is far better suited to this 49
Chapter 2 Literature Review task. Unfortunately, on an ultra-mobile platform, a handheld display has limitations due to its size constraints.
2.7 Designing For Small Screens Designing a user interface for a very limited display area is a big challenge that is being tackled by many researchers. Landay argued as far back as 1993 that many developers keep trying to emulate the desktop environments on small devices, and suggested instead that the needs of the mobile user should be built upon, instead of stretching the desktop environment [Landay 1993]. Work in this area is very important especially for mobile devices; unfortunately, there are few examples of systems mainly because of the difficulty of making devices small at the prototype stage. Narayanaswami prototyped a ‘Smart Watch’, which had a small high-resolution display, for its size, 96x120 pixels [Narayanaswami 2000]. navigation.
This presented difficulties in displaying and
Using well-proven computing environments such as web browsers, they used a
common sense approach with a user-centred design process and user feedback. Web browsers seem to have become more widespread and thus present a familiar interface to many. Whilst screens still remain small, the usable resolution has increased and colour became available on mobile devices at the end of the 1990’s, making the screen easier to see and one could speculate that this allows more complex data to be rendered in a small space. Since about 1995, many people have become more familiar with using the Internet and its associated web browser interface. With the advances in communication technologies, mobile Internet access has been possible for some time, allowing users to access anything that can be rendered on a web browser. Jones presented a collection of findings showing that small screen affected comprehension and unfortunately, users were up to 50% less effective at completing tasks on the smaller screen [Jones 1999]. Jones then suggested guidelines with the aim to rendering information on a smaller screen more effectively, using meta-interfaces to ‘clip’ the information. He concludes that one of the largest difficulties with small screens is caused by the requirement to scroll because the window is so small. Thus different design methods might need to be explored. Perhaps, consistent looks and the feeling of familiarity are a key factor to the success of current systems. It seems a deviation from a familiar design immediately confuses a user - not because the system is badly designed, but because the user is already accustomed to another particular design. The input method used on Narayanaswami’s watch was limited due to size constraints, but it did use an interface along the lines of the simple, universal and yet powerful; [up], [down], [menu] and [select] – making limited input and navigation of complex menus reasonably intuitive. Often a
50
Chapter 2 Literature Review new menu driven device seems alien until a mental map has been formed in the imagination of the user of what the menu structure or tree looks like, and then it becomes far easier to navigate. Still with these problems, devices continue to shrink.
2.8 The Miniaturisation of Devices Perhaps one of the most important problems facing the design and implementation of wearable computing systems is one related to their size. Often with new technologies, the early prototypes are quite big and cumbersome and wearable computing is no exception. Early wearable computers such as the Tin Lizzy [Starner 1997] were indeed quite large and required a bag to fit all the pieces in. By contrast, some of the more recent systems such as Xybernaut’s Poma™ are considerably smaller, which should make it more convenient to carry round. One of the largest factors in gaining wider acceptance of new technologies appears to be making the technologies more convenient. In addition, one of the largest visible changes well known about electronic devices in general is that everything seems to get smaller. Computers used to weigh several tons and occupy large portions of buildings. Today, these are out performed by a single modern integrated circuit just a few millimetres in size. One can now carry 10 tons of yesterday’s computing power in your pocket – even control a moon landing craft with it. The very transistors inside these integrated circuits have fallen in size, leading to much lower power consumptions as well as higher speeds. These trends are set to continue for as long as manufactures can continue to make them smaller and use the same technology. Transistors used to be compared to the width of a human hair, which is significantly smaller than the valves of yesterday. Recently Sunlin Chou, general manager of Intel’s technology and manufacturing group was quoted, “Human hairs are no longer a sensible comparison.” A reasonable comment when you consider that Intel’s latest process produces transistors 50nm wide – that is half the size of the influenza virus. Transistors will continue to reduce in size and this leads to increasing complexities of integrated circuits. Gordon Moore, one of Intel’s cofounders inadvertently set a law now called ‘Moore’s Law’ by stating that the transistor density of integrated circuits would double every couple of years. In addition, doubling the number of transistors comes with a reduction in size, which leads to an increase in speed and capabilities of roughly double every two years [Moore 1965]. This famous observation was first made in 1965 and remarkably holds true even today, and incidentally is the oldest reference in this study, not many predictions or technologies have such longevity. So what can be done with this increasing complexity?
51
Chapter 2 Literature Review
Figure 20 Mobile Phone Technologies approximately the same scale. (Approximate year of implementation circa 1985 left, 1992 middle, 2001 right)
Miniaturisation has clearly revolutionised the technologies used today. Mobile phone technology is a good technology to observe the effects of mobile electronics. In a short time, they have gone from being very large, cumbersome and owned only by the few who could afford such things to being very small and owned by everyone who wants one. The mobile phone as a technology has gained increasing acceptance throughout its existence. In as little as fifteen years, the mobile phone has gone from being 3.8 kg and far too large to carry - to being 38g and being small enough to lose down the back of a sofa – that is a 100x decrease in mass. However, miniaturisation has its limits. If one imagines that such a technology could be reduced to any size, it does not necessarily solve many of the issues. On the contrary, it creates many of its own. The next problem, which seems fundamental, is that size is a design limitation within the current telephone concept. For some time, it has been the drive for manufacturers to reduce the size of mobile personal electronics such as the mobile phone. For example, the Nokia 8210x [Nokia]31. Yet reduction in size comes with a penalty. Depending on the device, a certain amount of information must be conveyed to the user. How the information is organised can have a marked effect on how quick and easy it is to use for both a new and experienced users. Typically, on a mobile phone, there is a set of menus and submenus, which allow the user to access a vast, increasing range of information and settings whilst maintaining a small screen. Some do this more effectively than others do. It seems that the best user experience is obtained from the simplest of interfaces.
52
Chapter 2 Literature Review
Figure 21 the Nokia 8210 circa 2001, was a victory for miniaturisation, but it could not get any smaller and still be usable. A traditional phone needs to bridge the gap between ear and mouth
In addition to the effect of the falling size of devices is one of affordability. To use the previous example of a large multi-roomed computer system, the cost of such a system would have been substantial. The equivalent processing power can now be obtained for just a few pence. With these trends in size and affordability, everyone is able to have access to computer system – if they need it. This also means that there is an increase in mobile technologies in use. However, defining ‘affordable’ is somewhat more difficult. Affordability, it could be argued, is closely related to how much need or demand there is for a particular device, together with how functional it is. This in turn leads to a larger demand and the cycle is complete. Not just mobile phones are becoming more affordable. In a recent market trends analysis, consumer laptop computers were found to be the fastest growing segment in the Personal Computing market [Garter and Intel March 2002]2. On the move, the requirements of a user are different to that of a static worker. Communication has become more and more important; this statement is qualified by the explosive growth of the Internet. However, how about communications on the move?
2.9 Mobile Communications Wireless communications have seen a great deal of development in recent years. According to the April 2002 issue of Wired magazine in 2002 there were about 120 public wireless access points available in New York City cafes, hotels and airports. That number rose significantly to 3700 in 2003 according to figures published by IDC [IDC 2003]3, indicating a large take up of wireless networking technologies. As of 2004 there are now commercialized access points appearing just
2 3
Gartner, March 2002 IDC 2003
53
Chapter 2 Literature Review about anywhere and everywhere, including every McDonalds restaurant, train station and airport throughout the UK and the wider world. On an archaeological site, if data is collected digitally on site using wearable computer systems, it could easily be shared among other users on and off the site. Undoubtedly, for a field-working environment, sharing of information in real-time is important as well as collecting and storing large amounts of accurate and important data. Using a computer to store vast amounts of data from a site collection and then downloading it later can be dangerous for precious data if the device becomes damaged. An on-site wireless network would negate the need for the system to carry around all this data. For this reason, it is imperative that some sort of wireless communications should be made available to the users on site, and possibly to connect the site to a remote base.
A
communications infrastructure might exist to allow pictures, documents, and measurements to be available to all in real-time, or it could be set up to allow constant telemetry from each mobile unit back to a base, or indeed a combination of the two, depending on the particular site under examination.
2.9.1
Broadband Wireless for Mobile Applications
Only recently has affordable broadband wireless become a reality. One might define broadband as any connection greater than 1Mbit/s. As recent as 1999 the fastest wireless local area network (LAN) networking device of the time was tested at The University of Birmingham as part of a final year MEng project [Schwirtz 2000], which was the 2Mbit/s Wave LAN system. This produced variable results, none of which lived up to the published capabilities. It did work well out in the field but indoors it struggled to get from one room to another. The system lacked a proper standard, which was ratified and is now known as IEEE 802.11b, which is a wireless version of the wired computer network protocols that has been in place for many years. WiFi (Wireless Fidelity) is an approval that is stamped on 802.11b equipment only if it also passes interoperability testing, meaning that it is guaranteed to work across different brands. This is important because systems such as the Chi-3 wearable use obscure wireless brands because it does not support PC-Cards. Ensuring that all cards comply with WiFi will ensure that they will still operate together.
2.9.2
WiFi – IEEE802.11b – The Wireless Standard (2.4GHz)
WiFi gives the system up to 11Mbit/s throughput, in theory, and can operate in a number of modes, most notably ‘Ad-Hoc’ or ‘Infrastructure’ mode, such as that discussed by Gurley [Gurley 2001]. In Ad-Hoc mode, a network of individuals can share resources and information freely, and come and go as required but in an infrastructure mode, each user has to be registered and have fixed
54
Chapter 2 Literature Review identifications. The former allows great flexibility and can be used to expand the existing LAN. Users should be free to roam about a site, indoors and out, up to 200m with the same connection capabilities as if they were indoors using an office PC. The practical implications for WiFi, makes for an ideal system for communications out in a field where users move about and have the need for sharing data; particularly in Ad-Hoc mode. Performance and security of WiFi are currently hotly debated; however, its performance is more than adequate for applications like field working, where there is unlikely to be many concurrent high bandwidth requirements.
2.9.3
High Speed Wireless 2.4GHz and 5GHz Bands
There are a number of situations where more than 11Mbits of bandwidth may be required. For example, streaming of live video from an inaccessible location such as a cave, or transferring large images or files such as a 3D surface scan. Despite IEEE801.11b being so new there are already faster wireless networking standards available, in the 2.4GHz and 5GHz band, called 802.11g and 802.11a respectively. The 802.11g standard allows wireless networks to transmit data at up to 54Mbps, uses the 2.4GHz radio band and is compatible with equipment based on the earlier 802.11b wireless standard. This is important because increasingly more devices are designed with 802.11b devices built in. A big difference with 802.11a is that it operates in the 5GHz frequency band with twelve separate nonoverlapping channels. As a result, you can have up to twelve access points set to different channels in the same area without them interfering with each other.
This significantly increases the
throughput the wireless network can deliver within a given area. In addition, RF interference is less of a problem because the 5GHz band is less crowded. Unfortunately, 802.11a is unlikely to be used in a field-working environment because: •
It is incompatible with 802.11b devices, some of which are built-in and so cannot be upgraded.
•
Devices in the 5GHz band typically have less range, which could be an issue on a large site.
In a number of wireless networking tests at Birmingham, it was seen that 802.11b whilst capable of 11Mbits frequently gives the user around 5MBits of bandwidth, and that 802.11g and 802.11a – capable of a theoretical 54Mb rarely exceeds 19MBit in practise.
2.9.4
Bluetooth (2.4 GHz)
Bluetooth is the term used to describe the radio-based short-range (up to 10 metre) frequencyhopping radio link between devices.
These devices are then termed Bluetooth capable 55
Chapter 2 Literature Review [PaloWireless]32. Bluetooth was pioneered in consumer products such as the wireless headset for the Ericsson phones [Ericsson]33. This shows the potential for lots of Bluetooth devices replacing traditional wired systems. For the archaeologist, for example, one could have a camera or a measuring device that could simply be picked up and it would function only when close to the user with no wires, and could interact with the wearable field device. The users could have many devices based on this technology, and here lies a potential problem. Bluetooth operates on the 2.4GHz band. Here the potential for interference is colossal, the main worry with Bluetooth is that it is often always active and some devices cannot be turned off, leading to interference with other technologies like WiFi and will be present on user devices whether they want them or not. Bluetooth is a complementary technology with WiFi and not intended as a competitor, so quite a lot of effort has been put into coexistence studies [Mobilian 2001]34. It has been stated that they should work together, but many bad experiences have cast doubt on this because a Bluetooth connection has been very difficult or not possible to get working in a wireless network enabled building. In addition, Bluetooth seems unnecessarily complicated. Essentially, Bluetooth is not a wireless networking system, but a system to replace wires for short-range hops of less than ten metres. It could however be used to allow wireless tools in the field, that way costs could be saved, users could simply share devices, pick up a device like a camera and it could then be used with whatever they are working with. A new second generation Bluetooth is planned. The industry is aware of many of interoperability problems, so it is the hope that Bluetooth-2 is much simpler and easier to use. If it is then one can look forward to many wireless tools that can communicate with each other over short range.
2.9.5
Cellular Communications
Based on the digital mobile phone networks, data transmission has been possible for some time using GSM/GPRS/3G/UMTS (900, 1800, 1900 MHz). Of course, no communications between users out in the field would be complete without a link back to base, whether it is close to the site, or in another country. Again, currently there is a small revolution-taking place in this area. Up until now the only approaches to remote data communication would be to use an expensive satellite link (1000 K bit/s or more), a line-of-sight microwave radio link or the painfully slow GSM (Mobile Phone) based system giving (9.6 K bit/s or less). For fieldwork, the team would need to do on-site processing in order to reduce their data to small enough chunks for transmission to base, wherever that might be. Using GSM, the maximum transmission rate would be a feeble 9.6 K bit/s. Long calls would be needed in order to send anything of even a modest size, much less have video and graphics. Out in the field a user might 56
Chapter 2 Literature Review wish to send back live video, pictures and results. Up and coming technologies like G3 (3rd generation mobile communications) might help to bridge the gap, and even the much slower but already available GPRS (a packet radio based always on system) may allow always on, high bandwidth communication sufficient for these type of requirements. [PCW, Oct 2001]35 3G, which has already been described is designed to be able to carry video messages and even high speed Internet. 3G Advantages 1. High bandwidth connection compared to GSM (traditional digital mobile phone networks). 2. Video and Email services can be provided with the link. 3. Always on connection means that data can be sent in packets when available. – Units can respond straight away, to data streaming backwards and forwards from the base. 3G Disadvantages 1. 3G offers up to 384Kbits. There are a number of factors that reduce this. 2. Bad licensing and market research has meant that companies need to recover £billions, making links expensive to use, especially in the short term. 3. Coverage is unlikely to be good out in the field. Problems might be encountered in remote locations and countries such as an archaeological excavation site in Rome. Might not be anywhere near coverage for such technologies and so may render them inoperable. 3G could well provide a solution to many of the requirements for connecting the field working system of units to a remote base. It is a little disturbing that interest has been very slight and the costs of licensing the technology to the operators may have damaged its viability. Current mobile telephony trends would seem to indicate that 3G should make an impact in the long term. But what do users out in the field really want from their computer system and how can they use it?
2.10 Using a Computer in the Field A great deal can be learnt by actually going out into the field with a best guess approach. It is unlikely that a system designed in this way will be any good, but it is a good place to start and it shows the pitfalls of the application of such a system. It was felt that it was important to read what others had already done, but also important to have experience of fieldwork firsthand. 57
Chapter 2 Literature Review Following the MCFE project review is an early case study of a field trial in Wroxeter, a typical Roman village. In this field trial, a positive attempt was made to computerise the sites and monuments record as well as an attempt to provide some support for in-field digital sketching, which, it was felt, was lacking in previous work. The hardware used was a Panasonic Toughbook CF-07 (Wearable).
This hardware was chosen because it alleviated much of the bulk of a
traditional laptop whilst providing a familiar but lightweight form based data entry device. Simply providing a computerised data entry device in the field is not as straightforward as it may at first seem and a number of very valuable observations were made.
2.11 Previous Attempts to use Computers in the Field One could assume that electronic field working is a fantastic idea, and that its application in the field is inevitable. However, to qualify this statement, one needs to consider exactly how a digital equivalent system is going to work.
2.11.1 Standard Hardware A standard laptop PC could, of course, be used as a replacement for the traditional paper-based data entry systems, as it clearly offers many advantages such as: o Data is preserved in a format that negates the need for it to be re-entered at a later stage. o Rich data types can be captured, including moving images and sound cues. o Data can be collected from digital sources such as geophysics equipment and aerial surveys directly. o Some data collection could be automated such as location, (This could be seen as a form of limited context-awareness or at least automatic assistance based on the observation being made). o Data in digital form can be relayed to a remote site in real-time, provision for in-field digital communications, not just data but also voice and video. o Digital data can be visualized more easily in established frameworks as soon as it is captured, allowing missing data to be identified straight away. o Data can be retrieved from a local or remote site if it was needed and communicated amongst users on site. o Multiple fieldworkers can be networked and share data on site. o Improved infrastructure for supporting email and web services in the remote site. o Data can be connected and cross-referenced much more easily and this linking can even be semi-automated. o Compatibility with existing methods (Software and Hardware Compatibility) laptops are directly compatible with the software and hardware used at base on desktop workstations. Both Laptop and Desktop can be running Microsoft Windows™ and the same software (Both operating system and application software)
58
Chapter 2 Literature Review o Dual purpose – same hardware can be used on and off the field, such as in a hotel at night or when it is too hot to work on site. o Easy to make copies of data. The disadvantages of using a laptop on site may be of real concern to archaeologists and may include: o Vulnerable to hostile conditions, failure can be caused by heat, moisture, physical shocks, or dust ingress, all of which are prevalent on a site. o Can have reliability issues, hardware failure can be expensive in terms of excavation time and cost, spares may be difficult to source in some areas where archaeological work is being carried out. o Rendered useless with a flat battery. o Battery life can be far less than a working day. o Bulky. o Heavy. o Hot. o Theft risk on some sites or if left unattended in a car or during measurements. o Requires both hands and cannot easily be used down a trench. o Rendered inoperable if dropped particularly in a mud or water filled ditch. o Expensive – some small teams may not be able to afford the equipment or software. o Display issues – fragile, difficult to keep clean and hard to see in sunlight. o Unsuitable for use in positions other than sitting or for very short periods whilst standing.
2.11.2 Wearable Computing for Field Archaeology So why use wearable computing for field archaeology? A wearable system can offer all the advantages of the laptop system and should by its nature be designed to circumvent the heavy and bulky issues, ideally leaving the hands free as much as possible. The latter is critically important in many situations on an archaeological site. The Chi-3 and its predecessor demonstrated that it is entirely possible to provide significant processing power about the person [Cross 2000] (also see section 4.10 on page 121). Modern hardware makes such a device relatively easy to make. How to harness this power is another problem. Reliability of the hardware in systems based on the PC/104 such as the (WearCAM and the Chi-3) has been proven excellent in situations of intense heat, dust, vibration, shock, electrical interference and other environmental factors that can often lead to the failure of non-hardened electronic devices. PC/104 boards are designed for industrial, military and automotive use, and consequently are hardened and tested specifically to be resistant to such factors. This coupled with the low-power requirements makes them an ideal core technology on which to base a field working computer system. The battery life can be engineered to provide a lifetime suited to the requirements. The benefits of such a solution could be engineered as a 59
Chapter 2 Literature Review reduction in the time taken to do the equivalent work by traditional methods. However, one could easily argue that it is the greater integrity and portability of the recorded data that is the biggest benefit. For a laptop, the battery is a fundamental limiting factor that limits the performance size, weight and longevity of the device, which despite years of developments, still lasts around the 2½ Hour mark. However, with a wearable system the battery can be heavier by virtue of it being distributed about the person, rather than a single lump that would normally have to be carried around by the user’s hands. Even if the ideal platform exists there are many other issues to be addressed, such as how to acquire the data, and how to make use of it in a field environment.
2.12 Previous Digital Field working Research - The MCFE Project Some of the most important work related to in-field data capture was conducted by Pascoe and Ryan [Pascoe 1997 A], [Pascoe 1997 B], [Ryan 1998 A], [Ryan 1998 B], [Ryan 1999 A] and [Ryan 1999 B] between 1996 and 1998. The MCFE [MCFE36] (Mobile Computer in a Fieldwork Environment) project is described by the team as ‘a mobile and context-aware computing research project’. It is some of the most recent, and includes studies from more than one area. Whilst the work is detailed, one feels it lacks enough information about the problems associated with electronic field working. Much of Pascoe and Ryan’s work tells a story of 1) How they viewed a problem, perhaps by going on site. 2) What they did in response to the problem. Their accounts rarely go into the details of specific problems encountered. We can often learn far more from failure than from success. A great deal of good work was done especially with a view to the way in which the information can be stored, and the work proved successfully that electronic field-working can be faster than its traditional paper-based counterparts for a number of different tasks. They paid little attention to the time saved at the end of the survey when the data was transferred to another system, which no longer needs to be done by hand and would also have saved significant time and effort. The emphasis of the research was on the development and application of data collection and fieldwork management tools. Following a research, develop, evaluate and improve cycle of prototyping, they went on many different field trials related to both archaeology and ecology. Whilst none of this work was conducted with a wearable computer in the classical sense, they did identify the problems associated with computer input and output in a field-based context. Pascoe and Ryan’s work is most closely related to this study as it discusses the development of a data collection system for use in the field.
60
Chapter 2 Literature Review
2.12.1 Brief MCFE Fieldwork Activities In September 1996, the group spent four days at Cottam in the Yorkshire Wolds. This was to observe archaeological excavations conducted by Julian Richards from the University of York. From this, they were able to identify some initial requirements for a limited range of fieldwork applications. o ‘Rapid, low precision, topological surveys of areas surrounding an excavation, to confirm or enhance existing topological data’ o ‘Recording of finds during field walking’ o ‘Control of sampling during field walking’ In studies with Birmingham’s first in-house developed wearable computer, it was also discovered that control of sampling rate was an important issue, reinforcing Pascoe and Ryan’s early work. In addition, during the workshop in January 2001 between our own archaeological department and English Heritage (see Appendix A Electronic Archaeology Workshop January 2001 on page 187), one of the needs identified was low precision surveys of a site. This was often needed to gain a quick overview of a site, and was conducted before any other work was carried out. Pascoe and Ryan went on to continue work in this area, up until 1998, but many feel that this work did not provide an adequate solution the need for a low-precision survey of a site before other work is carried out. In May 1997, Pascoe and Ryan’s work required them to attend some ecological surveys in the Mull, where a group were conducting bird censuses. In this study, they used a simple prototype of the Stick-E-Note system running on a Palm-Pilot. They found that time was of the essence, and that recording time and location automatically by using a GPS was a partial success, but required two people to make the observation successfully [Pascoe 1997 A]. They found that the location could be used as a data anchor as could any of the fields, such as the bird for example. GIS (Geographical Information System) is a term often used nowadays to describe a system of recording spatially referenced data (see section 1.3.6 GIS on page 12) and Pascoe and Ryan’s work in 1997 is an example of this kind of reference system. They quickly realised that the location could be used as a primary key to a database of spatial observations. Storing data in a spatially referenced database is a good way to store the observations, because filters can be constructed based on the approximate location of a record. Potentially a database could then store any amount of data, but would not overload the archaeologists on a particular site because only the data that was ‘close by’ and relevant would be visible. In August 1997, they took part in a Giraffe survey in Kenya. The people conducting the giraffe survey had previously seen the Stick-E-Notes system in the Mull earlier that year and they were 61
Chapter 2 Literature Review enthusiastic to use it in their study. The study involved observing the giraffes in the wild by logging sighting and location information. The Stick-E-Note still recorded on a Palm-Pilot and they could be viewed as pins in a map display using the location recorded from an attached GPS. They recognised the need for a minimal interaction interface [Pascoe 2000], which is an important concept that has also been explored by others such as Kristoffersen [Kristoffersen 1999] and widely accepted as a requirement for any ubiquitous system. It was seen earlier that minimising user-interaction could form the part of the basis for not adopting the WIMP interface on wearables and has been discussed by Rhodes [Rhodes 1998], Clark [Clark 2000], Newman [Newman 2000] and others. This is early documented evidence of the need for such an interface. Pascoe and Ryan found that there were issues getting the recorded information back to a desktop and making sense of it, and investigated the use of pre-recorded notes, thus reducing the intervention required in the field. Clearly, a requirement for any data collection system is that the information can be output easily. For the system studied here, the output of the system can easily be adapted to reflect the needs of the particular survey. However, for many archaeological surveys, the output has to relate to pre-defined data requirements such as the Sites and Monuments Record discussed earlier.
Figure 22 Apple Newton Message Pad 130 [Newton]37
In September 1997, Pascoe and Ryan attempted to use a slightly different system. They argued that the Palm Pilot had proved too restrictive. This time an Apple Newton messagepad was used (see above). This made use of a Trimble lassen-sk8 GPS receiver, which was combined to make field-notes [Ryan 1998 A].
62
Chapter 2 Literature Review
Figure 23 the Trimble lassen-sk8 GPS receiver has a remote antenna
The Trimble lassen-sk8 GPS receiver was chosen because it produced more detailed information about the satellites, and so allowed for post-processing correction to be performed. This could be loosely classed as a simple wearable computing system if only for the reason that it does fit in the pocket when not required. The system was a prototype and ‘with only a restricted subset of the functions’ that had been identified in earlier trials. They recorded details of buildings, other features and ‘the location and subject material of numerous photographs’. The plan was to incorporate this into a ‘GIS (Geographical Information System) based spatio-temporal database’, which is just an awkward way of saying a database of photographs that can be queried by location. For more information on why GIS is so fundamental to archaeological studies, see section 1.3.6 GIS. September 1997 saw another archaeological field trial, in Seville, Spain. This was based on a ground survey, the need for which had been identified in their earlier trials. Their main task was ‘to shadow conventional recording methods’ with the long-term goal of being able to improve efficiency. They found that rapid recording of objects was necessary in this case not because the archaeology would walk off as it did in the ecology surveys, but because of the shear volume of material to be recorded. It was of the utmost importance to get accurate Differential GPS (DGPS) information, but they found that no cost effective differential signal could be received (see section 2.12.5 on page 67). A wide range of information was collected; including detailed photographic records and finds at set sampling points. They transferred the electronic information to a desktop PC and compared it with IGS RINEX data, which allows it to be corrected by post processing. Differential correction is usually transmitted by a fixed DGPS station that constantly monitors each GPS satellite’s signal and produces a differential atmospheric compensation signal for each satellite; in this case, it seems they were too far from any differential correction sources. Between July and September 1998, they returned to Kenya, as part of a vegetation study. It was important to be able to accurately distinguish an individual tree so it can be found later. The problem with physical tags attached to the tree is that baboons kept stealing them. For this study, they simply needed to record very simple information about an object and store it with an accurate
63
Chapter 2 Literature Review GPS location so it can be flagged up later when they visit the same tree. This particular trial was used to expand on the concept of the MAUI (Minimum Attention User Interface). Their MAUI solution ‘involved a question-by-question mode of data collection, rather than forms.’ Data was entered using the thumb of the hand that is holding the Palm Pilot, hence leaving the other hand free to use binoculars or hold on to other items like trees. They argued that this is the group’s first attempt at a pro-active interface design instead of the traditional ‘fill in what you can’ type of interface. This could be better than the traditional interface, as with similar studies, it was noticed that sometimes users only fill in some of the data or make the briefest of notes. A proactive approach may take longer, but it could ensure that nothing is missed out. It would be less flexible, but higher integrity. Finally, Pascoe and Ryan touched on a two-way data flow system, by extending the Stick-E-Note architecture to allow the identification of Rhino footprints. Not only would it allow the entry of such information but also used rudimentary pattern matching to help identify individuals thus being used to display data in the field. Being able to display geo-referenced data in the field has enormous benefits as it is like a database that is self-driven. All the user needs to do is physically approach a virtual tag and the information will be displayed. There are many examples of systems that display geographically relevant data, such as the Cyberguide [Abowd 1996] and Bristow’s WECA-PC [Bristow 2001], for example. In September 1998, the group visited Italy in an attempt to try to store more information that could be used and grouped together. Here a combination of approaches was used to record geophysical data from a Geoscan Fluxgate Gradiometer. This is interesting because most magnetometers are often sensitive to anything metal in the location, including items such as small rings or even ear studs. Here they claimed to have used a Toshiba laptop to record spatially the information from the fluxgate. They also used the old Stick-E-Note software once again to record more details in a spatially referenced surface record. They found that using an Apple Newton messagepad running TrackMan and tracker software, they could survey an area the size of 30 Hectares in 4 days. In this survey it was found, aside from the technical evaluation, that archaeologists were enthusiastic and embraced the technology, saving them lots of time and the need for complex surveying methods.
64
Chapter 2 Literature Review
Figure 24 the FM256 Fluxgate Gradiometer- [Geoscan]38
October 1998 in Andalusia, Spain, they used a system to ‘record the location from which key photographs had been taken’. The final MCFE field report comes from the French Alps in 1998 and was documented by Jason Dyke working on the VFC (virtual field course) project. The GPS and the Stick-E-Note software [Pascoe 1997 B] was used ‘to record the location, bearing field of view and other information about digital images and video.’ Unfortunately, GPS cannot provide the orientation data, only a bearing of the receiver, if it is moving. This was the first stage of a 3D computer construction of the site, but unfortunately progress seems to have stopped at this point. Nevertheless, many of the observations and methods described in their work is valuable information for the integration of computers in the field. Extensive 3D reconstructions were performed shortly after for Stonehenge from research at Birmingham University. This work is detailed in the work ‘Stonehenge Landscapes: Journeys through Real-And-Imagined Worlds’ [Exon, Gaffney 2000]. From a field-based data collection point of view, obtaining and assembling the data from such an exercise proved an immense task, which could have benefited from the logistical aid of an in field assistant to help manage data collection.
2.12.2 Published Work (MCFE) Much of the published information from the MCFE project relates to the data structure, and how it can be kept up to date using SQL (Structured Query Language) with complex Databases [Ryan 1999 A]. Pascoe’s earlier work relates to context awareness, but in later work, there is little evidence of using much environmental context information, other than location.
65
Chapter 2 Literature Review
2.12.3 Stick-E-Note Software (Palm Pilot) The stick-e-note software is available for download from the MCFE Internet web site [Stick-enote]39. The software works with versions of the Palm-Pilot platform. Stick-E-Map, Stick-E-Pad and Stick-E-Plates. Stick-E-Plates allow the user to create the data fields that they will use on their record form. It allows a custom name for the field, and then a range of data types. The data types it can handle are: •
Bearing
•
Boolean (Yes or No)
•
Date
•
Line of Text
•
Location
•
Note Pad
•
Number
•
Pick List
•
Sub-Note
•
Time
This effectively allows the user to create a new database of any complexity they wish. This ability to edit the fields in use on the fly is arguably, what makes Stick-E-Note so versatile, and it was used extensively. Any data type that is not catered for could be supported with a line of textual data. With such a simple set of data types coupled with the ability to enter free text, it can handle most situations, where more complex data types such as images are not required. This simple software was used in many diverse situations, from field archaeology to ecology studies and the key to its usefulness lies in its simplicity. Details on the stick-e-note architecture were published by Pascoe [Pascoe 1997 A]. The map part of the software allows the Palm-Pilot to be connected to a GPS receiver. This will then collect the location information, which enables the data to be referenced to location. Dissemination of the data looks to be possible in a couple of ways. 1. The data can be read on the device as the user walks around the site. As they approach a location, the note for that location can be displayed. A sort of spatial Stick-E-Note. 2. The data can also output to a regular desktop PC. It can then be imported to Access or Excel and processed in a similar manner to data collected in the field, using traditional techniques (Paper and Pen).
66
Chapter 2 Literature Review
2.12.4 Fieldnote (MCFE) Fieldnote, as discussed by Ryan, [Ryan 1999 B] was the product of two years research and field trials in Kenya, Spain and Italy. It was essentially the sum of all the previous work with the StickE-Note and other ideas being brought together in a slightly more powerful package and platform. The system was not a wearable system in the classical sense, but as a system that could be used out in the field (portable). Arguably, the single most important outcome of this work is the claim that using ‘the system demonstrated, that it is possible to collect more data more quickly than would have been possible using conventional paper-based methods.’ One of the suggestions for following work was short range for in-field communications using adhoc networking, and to continue work on the minimal attention user interface concept. Fortunately, constantly evolving technology and mobile networking requirements has meant that ad-hoc networking in the form of IEEE802.11b (WiFi) is now relatively widespread and therefore lowcost, whereas it would not have been in 1999. The platform for the Fieldnote software has since been discontinued for some time. Today there is much more use of more modern Pocket-PC’s such as the Compaq IPAQ and other similar PDA’s which is a quantum leap forward in technology from the Apple Messagepad which sadly has now been relegated to museum status [messagepad]40.
2.12.5 GPS Developments Much of the MCFE work relied heavily on GPS for obtaining its position, the accuracy of which was always an issue. For modest GPS accuracy requirements, post differential corrections may no longer be necessary as of 1st May 2000. Selective Availability (a deliberately introduced positioning error) has been discontinued meaning that deliberately induced errors of more than 100m have been reduced to less than 10m in many cases and typically, with a clear view of the sky, can be far better. As of early 2002, this kind of accuracy can be obtained at very low cost, costing less than £100 ($160). Figure 25, below, shows the effective increase in accuracy as the US government turned off Selective Availability.
Before midnight there were significant errors, however, without Selective
Availability the drift has been reduced drastically. Selective Availability is never likely to be reimplemented, and GPS will only become non-functional to civilian receivers in the event of a major war.
67
Chapter 2 Literature Review
Figure 25 Selective Availability effects before and after it was disabled
Using carrier-phase measurement survey-grade GPS systems, users are able to pinpoint their location to centimetre accuracy most of the time. As well as using the satellite’s digital signal to produce a location fix, they are able to make use of the actual carrier signal. The carrier is more detailed than the signal, and allows finer grained measurements to be taken. Kinematic and RealTime Kinematic GPS or post processing allows a mobile unit to measure its location accurately with respect to a stationary system provided that a signal lock is continuous. Therefore, the accuracy of survey grade GPS can be very high and cost is the main limiting factor for such systems.
2.13 The Impact of Technology on the Traditional Archaeologist Archaeology is a very traditional discipline. Undeniably, the implications of applying a computerbased approach to archaeological methods go far beyond just spending money on a combination of software and hardware. No one would argue that computers have already had a big impact on just about every aspect of modern life including archaeology. Whether it is welcomed or not or affordable is another matter. In an initial workshop initiative that took place in January 2001 (see Appendix A Electronic Archaeology Workshop January 2001 on page 187), it became apparent, that there was a concern that some computer systems in archaeology could be detrimental to the future of traditional archaeology. It was felt that the students might start to loose the ‘art of archaeology’. Arguably, this will always be a concern when a new technology is adopted and there will always be those who can see the benefit, and those – perhaps the inevitability. There will be traditionalists who will 68
Chapter 2 Literature Review not want to adopt new methods. That is not to say that archaeology is a techno-phobic discipline, it is far from that, but like any other discipline, some standards remain that are largely historic. As an example, just a few years ago colour photographic evidence was frowned upon. This seems unreasonable in the modern age, but comes about largely from historic reasoning; originally, colour film was seen as inferior to black and white because of its increased grain size and lack of colour precision. This carried on for a long time, even though it is clear to see that later colour film was indeed better resolution than the black and white film of the past. With the digital equivalent, a similar predicament arises.
2.13.1 Digital Photography Arguably, digital photography is among the first of a new generation of real-time digital technologies finding its way into mainstream archaeology. As such, it is interesting to chart its progress. Digital photography is important because it offers new working practises as well as support for well-established practises.
Some argued that digital photographs simply did not
produce enough detail (resolution) when compared with black and white film, or colour film until about the year 2002 – as was the argument with colour film over black and white before that. There will always be debate about how many million pixels (mega pixels) of resolution are required to be equivalent to film. Often early digital cameras were let down by poor lenses and battery lifetimes. Based on this argument, it is easy to see how to fall in to the trap of being concerned about the technology and its specification rather than what the actual application of the technology is, and its relevance. Perhaps some archaeologists will sign up to the belief that digital photographs can be used in any and all situations, but then again, maybe it should be noted that digital photographs offer different advantages and lend themselves to situations in a different way. Few would argue that the great thing about digital photography is the ability to take almost unlimited photographs for little change in cost, and this is of great benefit. In an ideal world, we would like far better data fusion, and this means doing things digitally, because only then can very large amounts of data be handled efficiently. There is no reason at all why traditional photographs cannot be used along side digital and in some cases it could still be used for very important finds but it is difficult to keep everything together. Just like the digital camera, a field assistant would offer the ability to review recorded information straight away, and this, perhaps is its most important advantage.
69
Chapter 2 Literature Review
2.14 Keeping the Goal in Mind It is important to recognise that sometimes the quest for better accuracy can get in the way of the actual reasoning behind the measurement. Dr Vince Gaffney stated during lengthy discussions at the workshop “It is tempting to measure everything in super-fine detail and then hope that inspiration for interpretation will follow, invariably it will not.” One should not forget the purpose of the research in the first place.
The next chapter looks at the wearable computer concept as a whole, it hopes to determine how much computing power we really need for a given application, and looks at how different levels of processing power affect more than just how much you can do and how fast you can do it. It also looks at why there is a limit to any sensible wearable system.
70
Chapter 3 Wearable Computing Concepts
Chapter 3
Wearable Computing Concepts
71
Chapter 3 Wearable Computing Concepts
3.1 Introduction Many forms of the same technology come with different levels of flexibility and specification. Whilst it is true that for many years, computer hardware lacked the performance to match the software’s requirements, not all computing jobs require the power of a super computer. There are many examples of lower end systems such as the Xybernaut Poma™ presented in section 2.2.5 page 28. The Poma™ is specifically designed as a ‘thin’ assistant. Rudimentary web browsing and email only requires a low-end system and that is adequately catered for with the Poma. Being such light-duty offers the advantages of keeping the system lightweight and long battery lifetimes. There is no need to have a high-end Pentium™ based system for such simple applications. Many other consumer products come in various levels, or models of differing specification, which usually include a cost vs. performance trade-off. In many situations, the lower specification offers shortterm cost advantages such as purchase price and reduced long-term running costing. This chapter investigates a classification system applied specifically to wearable technologies based primarily on their relative processing power. There are some interesting observations that start to fall in line with the classification system, some of which appear counter intuitive. These observations may have implications on the design and application of a particular type of system.
3.2 Why Classify? Where did wearable computing come from? Necessity being the mother of invention, it almost seems inevitable that one finds a problem and then builds a solution based on existing technology. The problem of providing computing power on the move has many solutions, one of them is wearable computing, others are PDA’s and laptop computing. Wearable computing is one solution to the requirement for mobile hands-free computing. It was almost inevitable that some sort of wearable computing device would emerge eventually, and in a world dominated by IBM compatibility, the solution was likely to be the same. Wearable computing, it seems, was born out of evolution rather than its own revolution. It makes sense then, for early wearable computing to be nothing more than standard computer hardware adapted to be body worn. Wearable computing came from and then created a need to carry more and more processing power about the person and has the advantage that it is ever-present or ubiquitous. Many past examples of wearable computing projects such as the Tin Lizzy, the VuMan, Essex’s Rome wearables and nearly all others have resulted in increasing performance for each generation. However, one must ask the question: is such a large amount of computing power really justified? Some situations might need real-time 3D modelling such as augmented reality requires a high-specification computer, but for simple data collection, such power seems out of place. 72
Chapter 3 Wearable Computing Concepts Undeniably, each generation of computing devices get smaller, smarter and cheaper, to such an extent that computer hardware is becoming more embedded into everyday items and some like Normal and Weiser saw it one day disappearing – visibly at least [Norman 1998, 1999], [Weiser 1991]. Otherwise ‘dumb’ everyday objects are gradually turning into ‘smart’ objects, ‘normal’ appliances start to think and communicate with other equally sneaky objects even the humble kitchen toaster is now computer controlled.
Wearable technology can simply be embedded
intelligence in normal clothing. A wearable technology does not necessarily have to be a computer in the traditional sense, but could be any technology that integrates, assists or augments the normal way of life for an individual. In this context, one feels it necessary to use loosely the broadspectrum term ‘Wearable Technologies’ to encompass all these types of integration.
3.2.1
Weiser’s Mark
In the late Mark Weiser’s insightful paper ‘The Computer for the 21st Century’ written in 1991 and before, he effectively coined the term ‘Ubiquitous Computing’. He described three different levels of lab prototypes, each with increasing size and complexity of function [Weiser 1991]. Weiser was talking about ambient technologies and in ways similar to Norman and his invisible computing work, Weiser was discussing an environment where this computing power was everywhere, thus; ‘ubiquitous computing’ was born.
He envisaged a three-tier system, which described three
different components of his ‘active’ environment: 1) Tabs: post-it scale 2) Pads: paper or book scale 3) Boards: blackboard scale He thought of these devices in terms of equivalent media, such as post-it notes, books or blackboards and in some ways, this helps with the familiarity aspect that seems quite important for users to relate to. Each level would have increasing functionality. Weiser foretold of a three-tier communication infrastructure, with a high speed wired connection, ‘tiny’ range and longer range wireless communications.
His insight has been realised over time with High-speed wired
connections together with ‘tiny’ range – Bluetooth and longer-range communications in the form of GSM or Wireless Networking. Wearable context-awareness and ubiquitous computing in Weiser’s sense are related but are total opposites. Whilst Weiser’s ideas are related to an environmental computing infrastructure sensing the user, wearable computing is related to computing assistance placed on the user sensing the environment. Weiser’s multi-levelled approach runs neatly in parallel with a similar system for wearable devices, and is equally as valid in the 21st century as it was in the 20th century.
73
Chapter 3 Wearable Computing Concepts The whole concept of a wearable computer introduces many problems in addition to usability problems. It is highly probable that a solution does not exist for all of them. Maybe wearable computing should stop trying to try to be like a desktop PC on a wearable platform, and instead embed the technology in a way that it assists the user seamlessly like in Norman and Weiser’s visions – rather than offering new problems. It is clear that in the last two years or so there has been a subtle shift in wearable research. Researchers noted that users were unable to divide their attention between a wearable system and the real world without distraction or performance degradation particularly whilst using Head Mounted Displays. Rhodes [Rhodes 1998], Clark [Clark 2000] and Newman [Newman 2000] and others have all stated the case for an interface more suitable for use on the move and less like a desktop computer. This is particularly important when the user needs to look out for real-world obstacles. The moment one walks head-on into a lamppost, as was discovered with Bristow’s WECA-PC trials [Bristow 2001] in Birmingham; this becomes immediately obvious, once the stars have cleared, and persisted with subsequent trials in 2003. There are of course other examples of wearable devices that are less obtrusive. Smart Jewellery is just one example of an uncomplicated wearable technology. Smart jewellery is technology that can be embedded into a ring or broach and looks good as a fashion statement as well as being functional such as acting as a wireless key. Devices like these have been discussed by authors like Lamming and since then there have been examples of smart jewellery capable of directing a PowerPoint presentation amongst other simple tasks [Lamming 1994]. The number of devices that can assist the every day user without impeding the user’s normal activities are enormous. Wristwatches with value added functions have already become successful navigation aids, mobile communications and memory aids. Even a device as small as a pedometer (for the measurement of walking distance) could be construed as a form of wearable computer, even if it contains little more than a battery and a relatively pathetic chip, it is still a computer in the fact that it computes distance or calories burned. In direct contrast, there are those like Steve Mann who aspire to become permanent Cyborgs. For them, (most) everyday situations in life exist with the assistance of a computer [Mann 1997 A & B]. They become so reliant on the technology, always using the Head Mounted Display instead of their own eyes, that they can become dependant. Whilst this example is extreme, it illustrates a completely different level of wearable computing, which is inherently much more immersive. Wearability has significance that extends far beyond just being an object like a traditional computer. Often something that is worn for a long period of time feels like a part of you, some jewellery like watches, rings and bracelets are permanent fixtures.
A favourite watch being 74
Chapter 3 Wearable Computing Concepts repaired can feel like a part is missing. Perhaps one could speculate that through the ages many different peoples have embraced wearable artefacts, to keep them close. So something that is wearable could be seen as more significant that its function would ordinarily dictate.
3.3 The Wearable Technology Index When trying to classify a system, or set of systems, it could be done with many levels, and categories with subtle changes, often with so many levels it is difficult to declare an object in one category or the next. However, it is nearly always possible to boil it down to just three levels in a way sympathetic to Weiser’s vision (see 3.2.1 on page 73 ‘Weiser’s Mark’). There are many different types of ‘processors’ that are in common use today. Some are general purpose, like those found in desktop PC’s. Some are application specific such as those found in mobile phones. Some are specifically designed for high performance with very limited range of calculations, such as digital signal processors whilst some are designed for very low power usage, where performance is not seen as an issue but battery life is, such as the desktop calculator. The processor has driven the digital revolution and is usually central to the device it controls. More recently however, there is increasing use of embedded processors specifically designed to add smartness and control to systems wherever they are. 32-Bit CPUs, once found only at the heart or cutting-edge of high performance computers have been developed so much, that they are being integrated in ever-larger numbers into cars and household appliances. It was found that regardless of the actual CPU involved some interesting trends become evident when the processor is categorised by relative performance. The only constraint to this classification system is that it must be used in a wearable device. For a progressive scale of processing power, a three-level system was chosen. These levels are based on processing power alone.
At first thought, it seems very short-sighted to base a
classification system on processing power alone, and could be argued that it would quickly date and become a worthless exercise. However, from this, other characteristics seem to follow suite and some interesting trends arise. The table below illustrates a broad, perhaps unrefined comparison of some typical examples wearable applications, and categorises them based on the level of processing required. This table represents a simple beginning of the categorisation that the rest of this section is based upon.
75
Chapter 3 Wearable Computing Concepts
3.3.1
The Three-Level System Low – Simple (Mono-functional)
Medium (Poly-functional)
Very High – Complex (Multi-functional)
Low rate data capture
Audio Communication
Real-time 3D processing
Medical logging devices
Surveying (Capture)
Video Communication
Telemetry (sensors)
Image capture
Real-time data rendering
Fashion accessories
Navigation
Complex database queries
Smart devices
PDA’s
Terrain modelling
Timepieces, basic Tele-memo watches etc.
Small database Information Retrieval
Large Database Pattern Matching
Simple communication
Collaborative working
In field processing
Table 5 Relative Processing Requirements of three main categories of possible wearable application
The categories presented here can be approximately divided by the type of CPU (Central Processing Unit) they employ. Although individual technologies will continue to evolve, the basic requirements of each category remain the same. When this work was published [Woolley 2003] we opted to expand the index to include flexibility into the equation, the PPaFF (Processor Performance and Function Flexibility) as the flexibility of function was also seen to be scaled with the original system based on processing performance alone.
3.3.2
Low Power
For low processing applications, embedded microcontrollers such as the Microchip PIC41 range or other very simple microcontrollers could be used. They offer very simple specific tasks with very little or no memory space or speed which is sufficient for very low-cost but otherwise smart devices. Examples of devices in this category are athletic transponders, accelerometer/low rate data-capture such as ambulatory blood pressure monitoring and smart jewellery. These items may include a simple display such as a LED indicator or a numerical LCD (Liquid Crystal Display) or might just be a remote sensor communicating with a larger network – a smart device that talks to a larger system.
3.3.3
Medium Power
These could be defined as low-specification embedded processors rather than microcontrollers, higher complexity than those at the lower end, and sufficient for simple interactive devices. These would typically include larger memory spaces and perhaps some more complex communication abilities. Examples – DragonBall™ processor used in Palm™ handhelds amongst others, Strong ARM®™ used in Pocket PC’s, at this level LCD displays tend to become graphical (dot matrix) and are able to display low-resolution graphics. Interaction can be from a simple menu based 76
Chapter 3 Wearable Computing Concepts system, or from a small touch screen on some of these devices. Until recently, displays in this category were still limited to greyscale.
3.3.4
High Power
High specification general-purpose microprocessors such as Pentium™ class or higher, dedicated ASICs (Application-Specific Integrated Circuits) or DSPs (Digital Signal Processors), offer superior performance and memory space capabilities. These are required to handle high-powered extremely complex computational real-time tasks like 3D applications, natural speech recognition and other tasks normally associated with a more involved desktop-based computing platform. In addition the display requirements become larger, perhaps Super VGA (800x600 dots with millions of colours), extending to far higher resolutions with billions of colours.
3.4 Relative Power Consumption What seemed interesting about this classification is that traversing the levels has a strong effect upon other aspects of the device, such as power consumption and display complexity. Typically, in mobile devices, a trade-off has to be made against performance and battery endurance. For this example, consider the capacity of a single typical alkaline AA battery, the type used in television remotes, personal stereos etc. Typically a cell of this type has a capacity of between 2.5 and 3.0 Amp-Hours at 1.5V, this equates to about 4.5Wh, which is approximately 16,200 Joules of stored energy. Technical aspects aside for a moment, and we could just measure (or estimate) the length of time the cell could power a device. Given the power drawn by the device and ignoring the fact that the battery would be incapable of supplying that much power (energy per unit time). Processing Power
Cell longevity (Approximate life)
Low
Days: 1 week to several weeks
Medium
Hours: Perhaps one working day eight hours or more
High
Minutes: Perhaps 5 – 10 minutes or less.
Table 6 Approximate Comparative Battery Lifetimes
It is quite difficult to see the relationship between these in terms of hours, but graphically, it can be seen that the relationship is approximately logarithmic. This was unexpected until the data was graphed.
77
Chapter 3 Wearable Computing Concepts Cell Lifetime 1000
Logarithmic
Hours
100
10
1
0.1 low
medium Category
high
Table 7 Logarithmic scales show that the relative power consumed by each class appears to be approximately logarithmic.
This could have a marked effect on the design of a wearable system; it shows that it is very important to select the right technology for a given application because the power requirements vary by an order of magnitude. At first it might have seemed that the ‘low’ category was closer to the ‘medium’ than ‘medium’ was to ‘high’ but here; clearly, this is not the case. One feels that social acceptability may be in someway linked with the success of the device. This in turn is linked to reliability, and in some cases battery life (see section 3.8.3 Power Management on page 83). As recent as the early 1990’s, mobile phones were like some sort of hungry pet, that needed constant feeding, usually in the form of a charger, and this applied then and still applies today to Laptops, which despite over 15 years of development still have approximately 2½-hour battery lifetimes. As soon as battery life becomes longer, devices seem to become more mainstream and more widely adopted.
3.5 Display Requirements From the definition of ‘Low’ (section 3.3.2 on page 76), it can be seen that many applications of this type would have very small displays, and in some cases no display, in the traditional sense other than some simple indicator such as a single LED (Light Emitting Diode). For example, for a very small system designed to record movement, no display is necessary.
The data can be
disseminated later from a remote terminal and viewed or relayed in real-time to a larger system. However, a watch with Tele-memo functions would contain a very small screen suitable for just a few characters such as a name etc. the size of which can often be frustrating rendering it unsuitable for all but the most determined user and for a limited range of tasks. 78
Chapter 3 Wearable Computing Concepts Further up the index to those in the ‘Medium’ class (section 3.3.3 on page 76), it seems that many systems employ a screen sufficient to display much more and maybe even colour. This of course adds a limitation to the device, as the screen must be large enough to display enough information, yet small enough to be convenient. From a technical standpoint, this type of display would normally be a dot matrix. A dot matrix type display can display graphics and thus is much more flexible in terms of display capabilities, than a fixed numeric or alphanumeric display. The display is often the deciding factor for devices in this category. Too small and the device could be seen as less useful or usable. Too large and the device is unlikely to be adopted, because it becomes too large to be comfortably carried everywhere and is likely to be left behind, where it cannot do its job of assisting the user. Finally, for applications that demand much higher levels of processing such as the augmented reality example (see section 3.3.4 on page 77), the most complex display systems are required, usually in the form of a HMD (Head mounted display). This then requires an additional level of complexity, the need for head tracking and accurate overlay of information onto the background image. Many head mounted displays come in VGA (640x480) display sizes and more recently considerably higher and with colour.
3.6 Attention Requirements Immediately one can see a further trend developing as one heads up the Wearable Technology Index. The user’s level of intervention and attention requirements increase dramatically. It seems that the smarter a device gets, the more attention is required from its user. This means a very smart device might become problematic; just how smart is that? Regressing back to the data logger example, systems at the ‘low’ end tend to require little or no user intervention; these kind of devices are often designed to do tasks independently or autonomously, allowing the user to continue with separate, normal and everyday tasks unimpeded. The watch example measures time, something that the user would otherwise find difficult to do by any means other than just guessing. The user only needs a glance to find the time, and many examples of more complex watches always default to showing the time for this reason. It also illustrates that it is not always necessary to have the information draped in front of the user at all times, one can often tell the time from an analogue watch or clock without looking directly at it. However, a ‘medium’ classification example clearly requires the user to hold a screen. Now, not only is it requiring more user attention, but it is occupying the user’s hands as well. One finds that using a device such as this is difficult on the move while walking and in some countries, illegal
79
Chapter 3 Wearable Computing Concepts whilst driving.
Therefore, standing still or sitting might be a requirement if the interaction
involvement becomes still higher.
The size of the screen and the limitations of the input
mechanism mean that long or complex data entry is not an easy or enjoyable experience, and if more complex data entry were required, a more complex data-entry system such as a keyboard would be required. These are available for some Personal Digital Assistants. If one has gone this far, then why not sit down at a desk with a cup of coffee and use a normal desktop PC instead, if one was available? ‘High’ level examples often require that the user look through some sort of display device, physically hold a tablet or otherwise interact with the system in a more involved manner than the lower levels. In addition, the system usually comprises of a complex system of interconnections and other items, which further impede the user and perhaps reduce reliability. If the system has too many interconnections, it may reduce the convenience of the device, making the user less likely to set it up. One could suppose that many users fail to adopt a PDA after a novelty period, just because it is slightly too large. If this is true then a more complex wearable system has a disadvantage to start with, more so with non-professional users.
3.6.1
The Limits
It seems that the more processing power used, the more interaction is required. This then begs the question: how much processing power is required for a sensible wearable system given that we already have a fundamental limitation on the level of interaction that can be afforded? The logical approach may indicate that the processing power needed depends solely on the application. However, typical office applications no longer require the processing power of modern PC’s but interaction quickly becomes an unpleasant task when confined to the smaller screen of a PDA. It might look like a step backwards in terms of functionality, but the enhanced portability gains can often outweigh the lack of features – consider the Xybernaut Poma™ (discussed in section 2.2.5 on page 28).
The Poma™ has very limited functionality but has the advantage of being very
lightweight and long running. In addition, there is nothing to stop the work being produced on a desktop PC, only read and edited on a smaller machine, which can be done anywhere.
3.7 Classification Discussion The most interesting result of this classification exercise is that it illustrates that the more processing power carried about by the person, the more it requires the attention of the user, which at first thought appears to be counterintuitive. So what can be done in such cases?
80
Chapter 3 Wearable Computing Concepts In the near future, more wearable technologies will be powered by context awareness. The ability to sense the current context means that the machine is able to make a best guess as to the user’s intensions, without explicit user intervention. A combination of this with other traditional interface designs may be the way forward and is further evidence that Rhodes [Rhodes 1998], Clark [Clark 2000], Newman [Newman 2000] and Schmidt [2000] and supporters are well founded with their ideas suggesting that wearable user interfaces need to take advantage of other context cues from the environment. Exactly how much processing power is required to sense context is a question that cannot be answered in the short term.
Answering this question forms part of ongoing research at the
University of Birmingham, Essex and at other institutions. Newer systems are only just taking advantage of the extra information available from their surroundings and so far can only really be used in application specific areas because of the complexities of determining context in even the simplest of daily situations. Weiser’s ubiquitous computing concept could help by providing an active environment, effectively reversing context awareness by providing an environment that responds to the context of the user. Indoors, a system could be built that allows the two systems to communicate, providing better integration. Outdoors in applications such as field working, this is unlikely to be a viable solution and complex infrastructure setups should be avoided. One further issue is that keeping the intervention down to a minimum may possibly limit the number of sensible applications where a wearable system is ultimately suitable. The classification seemed to reveal the trend that the more processing power available to the user, the more the user needs to interact with that system. The user of a wearable system in a situation such as field archaeology has a fundamental limitation on the interaction that can be afforded so the user’s attention is typically regarded as a scarce resource. Attention switching between tasks has an associated cost in performance as shown by MaCann’s and others research (see section 2.6 Wearable Displays on page 48). The archaeologist’s hands are required for excavation and safety, thus the interaction with the field assistant is fundamentally limited. If the relationship identified in this classification exercise is correct then the consequence is that the field assistant has to either fall into the medium category with power similar to PDA’s or context awareness has a very much larger role to play in reducing the interaction level to that of the medium level for a system that is more complicated
Computing on the move obviously has to have limits. The next section looks at the mobile computing experience, to see what can be learned to aid the design of newer systems. 81
Chapter 3 Wearable Computing Concepts
3.8 Mobile Computing to the Limit Typically, mobile devices such as Laptops, all share a common working paradigm. They all look similar, have similar specifications, run similar software and are used in a similar manner and because of this; they share the same problems. In this section the design of a wearable computer’s closest relative, ‘the laptop’ will be discussed with its faults, in an attempt to learn from them and to build a better wearable. In addition, the remainder of this chapter looks at the important engineering challenges that surround the construction of a wearable computer, including the crucially important power management.
Finally, the construction of the Chi-3, a wearable
computer that was designed and constructed in Birmingham as a test platform, is presented.
3.8.1
The Problem with Mobile Computing
Laptop computers are mobile computer systems designed to give a user access to the same files and computing environment that they are used to using on a desktop computer whilst on the move. It can easily be argued that they are far from perfect and many are just far too large and heavy to be carried everywhere. In order to design a better mobile device, be it a wearable or a laptop, we must first look at the problems of the typical laptop. By asking some users at random, although not an exhaustive or scientific study, did highlight some common problems associated with laptop computers in general.
3.8.2
Five Key Problems with Current Mobile Technologies
1) Battery Life – often too short, never get full usage out of it. 2) Weight and Size – too big and too heavy to carry around. 3) Display size and Visibility – sometimes the display is a little small and too hard to see outside or in bright environments. 4) Too many wires and adapters – a separate bag of adapters, power supplies and cables is often required every time the system is used in a remote location. 5) Too Hot – laptops often get very hot and can be uncomfortable if actually used on the lap. Whilst mobile computing used to be about compromise, such as small black and white screens and low performance, modern equivalents have performance that often equals that of a desktop Personal Computer, at least when it is connected to a power supply.
At first glance, the
82
Chapter 3 Wearable Computing Concepts specification of the latest machines seems to be about the ultimate performance. However, this performance comes at a price. Battery lifetimes are getting worse in spite of much thinner higher capacity batteries. The reason for this is related to how the power is used in a modern system and will be discussed later. The weight and size of machines seems to be very slowly increasing from about 2.5Kg in 2001 with 11” screens, to 3.5Kg with 15” screens in 2003. When looking for a small lightweight machine, the choice is very limited, and then there are problems with lower performance. On a typical day at a conference when presenters arrive, it is amusing to watch the great mass of power adapters and cables grow out of the nearest power socket, many do not trust their machine’s battery to go the distance, even for a short presentation. On the way back from the day’s activities, they might try to do some work on the train. Using a laptop actually ones lap presents its own problems, as some machines now get far too hot and uncomfortable to use, instead requiring a table to work on. The short and sometimes unpredictable battery life times and the high temperatures of the machines in question are both issues related to power management.
3.8.3
Power Management
Just a few years ago, a mobile phone struggled to last a few hours without a battery charger at hand, even with an extended and often heavy battery. These days, one can expect up to couple of weeks out of a single charge. This has been due, in some part, to developments in batteries. Cheaper, lighter Lithium-Ion cells and similar chemistries have helped, but has not been the key to increasing the battery life and thus system run time between charges. Reducing the power required by a mobile device is possible by making intelligent use of the energy available. For fieldwork, the last thing on the users mind should be how long the batteries are likely to last. The WearCAM proved that considerable processing power could be achieved with a running time of up to eight hours [Cross 2000]. Eight hours should be considered the minimum requirement, and allows the use of a device for one whole working day without a recharge being required. Battery life and runtimes are increasingly important, as more information is stored digitally and used on mobile devices. In the past, a flat battery in a survey system, for example, would have meant that measurements would need to be taken some other way. Unfortunately, a flat battery would mean no access to data and the archaeologist cannot continue at all. So where does the energy go in a wearable system and what are designers doing to improve the situation? Fundamental laws of physics dictate that energy cannot be destroyed only exchanged from one form to another. Therefore, almost all of the energy used by a computer system is converted to heat. If no heat were produced, the computer would consume no power. Under the 83
Chapter 3 Wearable Computing Concepts lid of a typical computer system, this power is dissipated in a number of ways. In 1995, Welch identified the main culprits of power consumption and showed that if one can reduce the power used by the system, the batteries could be made smaller, last longer or a combination of both, which perhaps, goes without saying [Welch 1995]. His paper includes references to reducing power consumption of the CPU by reducing the frequency and the operating voltage although this certainly will not be linear as Welch’s formula suggests. Since 1995, there has been a reduction in voltage supplied to computer main processors combined with speed ‘throttling’, such that some systems do halt the processor albeit briefly during times of reduced load. Some mobile systems reduce the processing speed all the time while operating from batteries, using a speed-stepping system. This coupled with hard disk drive spin down scheduling routines and suspending all or part of the system contributes to the conservation of energy. Since Welch’s paper was published, designers of hardware and software have been working to reduce the power required by such devices as a matter of progression, driven by regulation from governments and environmental groups. Power consumption, it seems, was not thought of as an issue in early computing especially where mobility was not an issue. One of the key problems in system wide power saving is that modern systems are multitasking, which makes it more difficult to determine when a part of the system is not used, or is unlikely to be used in the near future.
Welsh [Welsh 1995], Ellis [Ellis 1999] and others including
manufacturers like Toshiba, Microsoft and Intel corporations identified the need for an API (Application Programming Interface) for making the best use of power in a multitasking environment. ACPI (Advanced Configuration and Power Interface) was a standard ratified in 1996 to provide vendors of hardware, specifically PC hardware as well as the software to control the power consumption by producing a universal system to disable and power-down devices when they are not in use. This standard was meant to replace both APM (Advanced Power Management) and the now infamous PNP (Plug and Play) architecture, allowing the PC to reduce speed, power-down components, switch off monitors and allow it to resume without lengthy boot routines. Until 1999, many manufacturers had made a bit of a mess of implementing it fully until it was amended. The latest standard for ACPI allows machines to suspend all operations to the hard disk. Meaning lengthy boot times can be avoided altogether, such as the Windows XP™ hibernation mode. The reliability of a successful suspend and resume can still be a little variable if not all system components are fully compliant. The power saving from a desktop users point of view is largely unnoticeable, the only difference users are likely to notice is longer battery lifetimes on laptops and perhaps slightly longer to resume from a screensaver than normal. Avoiding the boot routine can be very beneficial to a wearable system. The device can be suspended to disk, using no power at
84
Chapter 3 Wearable Computing Concepts all and then can restart in just a few seconds. This often results in large savings, if there are extended periods of non-usage. The power saving effects on battery life can be quite dramatic and as an example, the Chi-3 current consumption drops from 1.2A without power management enabled to 0.4A in Windows with ACPI enabled and the system is idle. This reduction of 2/3 makes for a significant increase in battery lifetimes, for example a 3-hour battery could now last up to 9 hours without any increase in weight. However, it should be noted that this saving is only the reduction of wastage and so most savings are made when the computer less than 100% busy. Should the system be required to do some complex processing such as video compression, the consumption would rise to 1.2A. Fortunately, for many tasks such as data entry, the system is not busy most of the time and so significant savings in battery power are realised. Whilst this covers some aspects of mobile computing power management, other devices have benefited from much improved efficient design for power conversion, from the variable battery voltage supply to the regulated system supply. The use of switching power conversion schemes has increased the efficiency of such designs from older linear conversion of 40% up to a switchedmode conversion efficiency of up to 95 % as was seen with both the WearCAM [Cross 2000] and [WECA PC]. The components used in switching supplies have reduced losses significantly. In addition, increased switching frequencies have enabled much smaller, lighter and more energy efficient designs. This is important because it means that a greater proportion of the battery power is being used to drive the computer. Some of the very latest designs of mobile phones like Nokia [Nokia]42 have very efficient use of energy particularly in the standby mode. These switching supplies have allowed a standby mode strategy where the switching conversion only fires occasionally to top-up the phones systems known as pulsed frequency modulation conversion (PFM). This approach is now being seen on other similar devices like PDA’s. Thus, power is drawn from batteries in short bursts with relaxation times in between.
3.8.4
Efficient Power Storage
Mobile electronics need a source of power. This has traditionally been primary (non-rechargeable batteries) and more recently, secondary (rechargeable batteries). Primary cell chemistries such as alkaline batteries are a relatively mature technology and have a relatively high capacity when compared with rechargeable cells. Rechargeable cells include, in chronological order, Lead-Acid, Nickel-Cadmium, Nickel-Metal Hydride, Lithium-Ion and the newer Lithium-Polymer. Perhaps an interesting observation about these technologies is when arranged in chronological order they also
85
Chapter 3 Wearable Computing Concepts appear to be in density order, Lead-Acid being very dense and heavy, Lithium being very light weight. In addition to the rechargeable batteries are new and developing techniques for storing power suited to different applications. For example, the owner of a mobile phone might have a need for emergency power and to provide this there are now chemical packs that can be exposed to the air and used to charge the phone. Electric Fuel [Electric Fuel]43 produces a range of products, which may be suitable for future mobile products and already one can buy disposable fuel cells lasting up to 21 days, although this is only twice as good as standard rechargeable batteries and is wasteful (environmentally). It must be noted that these cells should not be confused with the fuel cells that are fuelled by methanol or other hydrogen rich fuel. Methanol powered fuel cells are another technology that is currently being miniaturised to such an extent that fuel cells will be available to fit inside traditional laptops and other mobile electronics, and could make a real impact on the design of wearable computing systems of the future. The run time and energy density is no great leap forward, because of the space required for the reactor but they do have one extremely desirable feature; they can be refilled by simply transferring a liquid back to the tank. Instead of a 3-hour recharge, refilling is done in just a few seconds. Therefore, for an archaeological system of units out in the field, a quick trip back to a car to refill the device is not going to be a major problem. It could be done whilst having refreshments – or just topped up. Environmentally these types of power sources are very sound, making use of a simple reaction combining Oxygen and Hydrogen through a membrane to directly generate electricity, producing only water vapour as a waste product, and the fuel can be readily made from plants or even water.
Figure 26 Portable Computer with Integrated Fuel Cell System, The metal hydride tanks on the right and the 50W reactor on the left, almost as small as a normal laptop battery developed by LG Caltex.44
86
Chapter 3 Wearable Computing Concepts Recently it was announced that laptop fuel cell technologies are being trialled in laptops by the military where they claim superior battery life and most importantly they can be recharged (or refilled) in seconds. [PCW October 2001]45. The liquid fuel contains a tremendous amount of energy, which can easily be transferred by just pouring it in. A useful analogy would be electric vehicles. A battery-powered car requires a substantial recharge period. A traditional car has more range and has the advantage that it only takes about 2 minutes to completely refuel, and of course, you might only need to put enough fuel in to get you home – something that is tricky with batteries.
3.8.5
Intelligent Use of Energy
Following Welch, and Ellis’ proposals [Welch 1995], [Ellis 1999] for power management, from a hardware point of view there are several viable approaches to save power usage. The methods of saving power range from the complex CPU throttling to simply switching off devices when they are not in use. Some devices however, should receive uninterrupted power such as GPS receivers; otherwise, the cold start time (from being completely switched off) can be substantial. Some have theorised about complex algorithms to switching off devices like Hard Disc drives, but it has been shown that none are any better than simply cutting power after a pre-set period of inactivity. [Welch 1995] Awareness to managing energy allows devices to run much longer and produce much less heat without major changes or significant loss in performance. In the design of future systems it is imperative that consumption is reduced to very small levels, using more aggressive power saving protocols, allow disabling devices on demand. Development in this area is continuous and systems can be made smaller on the basis that the batteries and hence the power required is reduced.
3.9 Advanced Thermal and Power Management Kawa points out that one of the drives for better Power Management in the design of mobile systems is because there is a widening performance gap between the power consumption of a given system and the energy store available to run it [Kawa 2001].
87
30
350
20
250
10
150
0 1984
1989 Power (W)
1994
1999
50 2004
Energy Density (Wh/kp)
Power (Watts)
Chapter 3 Wearable Computing Concepts
Energy Density (Wh/kg)
Figure 27 the widening power gap trend figures from [Lahiri 2002], [Udani 1996] (Figures for illustrative purposes only)
Whilst computers have been advancing at a fast and ever increasing rate from a performance point of view, batteries have been improving only steadily. The power gap illustration shows the specific energy density (energy available from a given mass) has improved, perhaps, two fold in a ten-year period. By contrast, the consumption of processors in general has raised considerably more [Lahiri 2002], [Udani 1996]. This kind of increase in power cannot continue especially in the domain of mobile devices because there is a limit to the power that can be consumed by a mobile device. Supposing a new fuel cell was developed, tomorrow that would be able to produce 1KWh/kg; this could only be used to increase the runtime of the device, it could not power increasingly power hungry systems. There are fundamental reasons why consumption has to be curbed.
3.9.1
Heat
The fundamental problem is one of dissipation - energy has to go somewhere; conservation of energy dictates that the energy transferred from the battery by the system is dissipated as heat, as previously described. There are three ways in which the heat can be dissipated; o Conduction o Convection o Radiation Typical cooling methods employ a combination of these methods. A simple heat sink is effectively a heat exchanger that radiates the energy into the surrounding air. The amount of heat that can be radiated depends on the surrounding air temperature known as the ambient temperature and the surface area.
The ability to transfer heat is normally expressed as how many °C (Degrees
Centigrade) the device will raise given one watt of power. For example, a 2.0 °C/Watt heat sink at 20 °C ambient will rise to 40 °C if attached to a device that is dissipating 10W. 88
Chapter 3 Wearable Computing Concepts
Figure 28 A heat sink used to dissipate heat from a graphics card processor, notice the large surface area produced by lots of fins
Heat sinks are a good way to remove heat from a particularly hot component because it has no additional energy cost.
3.9.2
Reliability as a Function of Heat
The lifetime of integrated circuits is inversely proportional to temperature. There are a number of ways in which heat affects the internal workings of an integrated circuit. Thermal expansion effects cause a distortion in the substrate and active regions of a semiconductor device. Differing thermal expansion coefficients can lead to enormous mechanical stresses building up in the materials. Eventually this can lead to cracking and premature failure due to open or short circuits. Rapid heating or cooling can introduce thermal stresses. Also high temperatures may change the properties of the actual causing unpredictable effects that manifest themselves as random data errors within complex processing and RAM structures. What this means for computer design is that the cooler the device operates, the better the reliability is likely to be.
3.9.3
Danger to the Health of Skin
A badly designed system producing too much heat could have other more serious impacts over and above just being wasteful and unreliable. Recently there have been reports of people actually getting burns injuries from a laptop, even through clothing [Ostenson 2002] and possible long-term damage to the skin after extensive prolonged heat contact. It is especially important to consider the effects of localised heating of the skin, when designing a wearable computer system, because the term ‘wearable’ implies that the system is most likely to be worn closer to the skin than other systems.
It is difficult to determine the temperature that can cause burns, because there is
significant variability in the type of skin, the thermal conductivity of the hot object, the heat capacity of the hot object and the time taken to cause a burn, which is a function of the heat transfer efficiency between the object and the skin. Caution needs to be exercised in the design of electronics that are mounted so close to the skin, because a much lower temperature for prolonged 89
Chapter 3 Wearable Computing Concepts contact could cause a burn or other significant damage, and if the temperature rise is slow, the user may not even notice it. For this reason the temperature of a wearable device should be kept as low as possible.
3.9.4
Heat Dissipation
Naturally, a hot surface (hotter than the environment in which it is used) will cause air currents to circulate, hence giving rise to convection. This is why it is important to let air circulate a device. Conduction is also employed in many mobile devices by the use of heat spreaders and to some extent forced-air-cooling (a fan). Forcing the movement of air over a hot surface increases its ability to dissipate heat substantially, even without huge air movements. However, in mobile devices, this method has an additional cost; the energy required to run the fan. A fan is quite impractical because it has to draw air in and expel hot air, this could be problematic if clothing gets in the way. It is common sense, but increasing the surface area is a way of increasing the heat dissipation without an additional energy cost. Typically, mobile devices employ heat spreaders to conduct heat away from local hotspots at the expense of heating everything else up. These heat spreaders are nothing more than sheet aluminium in the base or chassis of the machine, which also acts as a convenient electrical shield and mechanical mounting.
3.9.5
Controlling Heat
Interestingly the colour of a component can make a very large difference to the amount of heat it can dissipate. Emissivity is a measure of the emission efficiency, which is how well a material emits radiation. This effect was noticed on the original WearCAM wearable computer when using thermal imaging. If all of the components are the same temperature, some appear hotter than others. As a rough guide, the blackness of an object determines its emissivity. A black surface such as anodised black could have an emissivity of 0.95 i.e. 95% whilst a polished aluminium surface might have only 0.05 i.e. 5%. So for optimum heat dissipation, black is better. Some high specification machines increasingly use heat pipes. Heat pipes are interesting devices that are extremely efficient heat conductors, they can conduct heat relatively long distances with almost ideal characteristics, allowing a heat sink to be mounted in the best place and still retain the processor in a sensible location. This has advantages over heat spreaders, as it need not emit heat along its length like a heat spreader. Heat pipes use a chemical based system that evaporates a substance, drawing in heat energy as it does so and then condensing at the other end, losing its heat payload. It soaks back down a wick back to the ‘hot’ end where the process is repeated. The process is powered by heat, so requires no extra sources such as electricity and their use in systems
90
Chapter 3 Wearable Computing Concepts like air conditioning can result in dramatic efficiency gains, so they are much more than just a heatconducting lump such as a copper rod. Heat pipes have been reducing in size, weight and cost, making them a realistic alternative for future wearable systems.
3.9.6
Size Constraints
Unfortunately dissipating heat still has its limits; there is only so much heat that can reliably be removed from a system of finite size. The heat sink in Figure 28 shown on page 89 is comprised of many fins in order to maximise the surface area. If the area for dissipation is reduced, then the temperature rise for a given thermal input power is increased. This can be illustrated using a standard 60-Watt domestic light bulb analogy. An electrical appliance such as an audio amplifier dissipating 60 Watt might get warm, perhaps 30°C. However, a light bulb filament, which is much smaller, is still dissipating the same heat, but is so hot that it glows white-hot i.e. 3000°C or more. So the smaller the area available for dissipating the heat the hotter it becomes. For a mobile system, the size is a design constraint so the temperature can only be reduced by reducing power consumption. Thus, if the size is a design constraint, the power dissipation limitation is also imposed as a constraint. This is why mobile devices cannot continue to use more and more power. If the power consumption becomes too high, then the system simply gets too hot and may malfunction or cause injury to the user. So far, mostly methods of dissipating the heat have been discussed, but the root of the problem is the ever-increasing power consumption in the first place. Most modern technologies are based on CMOS (Complementary Metal Oxide Semiconductor) technology for almost all of their integrated circuit’s. Havinga studied system wide power losses in a computer system [Havinga 2000], the largest factors of power consumption from the CMOS devices typically used can be reduced in the following ways: Reduction Method Reduce effective capacitive loading of circuit pathways
Ceff
Reduce supply voltage to active device
V
Reduce the operating frequency
F
Reduce general activity, i.e. be more efficient
α
Table 8 Reducing Power Consumption [Havinga 2000]
The power dissipation is a function of all the factors shown in Table 8 in some way. Not necessarily a linear relationship but reducing any of these factors to zero should reduce the overall dissipation to zero.
91
Chapter 3 Wearable Computing Concepts Among the largest heat producers is the main CPU (Central Processing Unit), so it would make sense to locate this device at the edge of a unit where the heat can be dissipated most effectively. Unfortunately, the board level copper tracks coming from the CPU are also large dissipaters of heat because of capacitive effects. The capacitive loading effects on the tracks cause them to dissipate energy in proportion to the clock speed F, the voltage V and the activity. Shorter narrower tracks have less capacitance, as an added bonus in that they reduce propagation delays too, so make for faster designs.
Due to the nature of the capacitance, the more times they are charged and
discharged the more energy they lose. It is primarily a change of state that causes losses and is wasteful, so the less remote transactions from the CPU the better. Using cache memory structures close by reduces the number of remote transactions and thus reduces heat.
Some such as
McGaughy, have even argued the case for putting the processor in the actual RAM structures [McGaughy 1996]. Single chip systems would mean little or no external circuitry, and these are becoming increasingly more desirable, especially as it offers substantial cost savings as well. In the near future, we can expect to see many more systems built on a single chip, which will reduce heat, power consumption and cost. Reducing the clock speed can reduce power consumption of a device for the same reasons as the tracks, because the transistors also act like capacitors. However, it is not necessarily beneficial because it takes longer to process information, in some circumstances the energy required to complete a specific job may even increase - given the fixed power consumption of other parts of the system. Reducing any of the items above will inevitably reduce the power consumption. However, it turns out that in battery-powered devices, the energy available from the batteries actually changes depending on how it is drawn.
3.10 The Battery Various cell chemistries are in wide use now. There has been a move away from Nickel-Cadmium based cells because of environmental concerns (Cadmium is very toxic), and developments in Lithium-Polymer cells have produced very small, lightweight batteries. The batteries can make a large difference to how well a mobile device is received by the public as seen with mobile phones (see section 2.8 on page 51). Short life times, expensive replacements, heavy and bulky batteries are undesirable in any situation. For use out in the field, a battery can be the single biggest cause of problems; a flat battery on a field computer renders the entire system useless. The battery could be seen as a single point of failure. Low temperatures can also affect batteries adversely. What is
92
Chapter 3 Wearable Computing Concepts needed for field devices is a battery that can last a whole working day, can be quickly recharged, that is not too bulky and that has a reasonable cycle lifetime. So given a finite energy reserve, what can we do to make the best use of its energy reserves? To answer this, we need to look at how the battery works.
3.10.1 What is a Cell? A cell is a relatively simple concept, the basic elements of which have not changed for several hundred years. A cell consists of an Anode (+), a Cathode (-) and an electrolyte between them (in a sandwich configuration), in which ions (charges) move between the electrodes.
In a Li-Ion
(Lithium-Ion) battery, oxidisation of the Lithium Anode creates Li+ (a positively charged ion), which travels through the electrolyte where it undergoes reduction at the cathode. This charge movement is a seen as a current outside the cell, which drives the load, and powers our fieldworking device. When there are no places left for reactions to take place, the cell is effectively discharged. Fortunately, by reversing the current (charging) the reactions are reversed. The process is effectively the same for all cell chemistries except fuel cells. Lithium-Ion cells are more expensive than the older Nickel based, partly because they must be carefully charged since they can be destroyed very easily if over charged, sometimes with devastating consequences. The most recent technology coming into common use is known as Lithium-Polymer.
The
advantage is that the polymer is dry and very mechanically robust. It is therefore lighter and a great deal thinner than other cells. It has no need of a big metal container; it can simply be composed of a thin (1mm) flat bag. In Figure 29 a battery used inside a Pocket PC is shown. The pack also includes a thermal fuse and smart charging and ‘fuel gauge’ circuitry. It is rated at 3.7V 1000mAh equivalent energy of two AA batteries but less than 3mm thick.
93
Chapter 3 Wearable Computing Concepts
Figure 29 A Compaq IPAQ 3630 Lithium Polymer Cell encased in a folded aluminium bag, note the thickness little more than a 20 pence coin, rather than a cylinder or block.
Buchmann states that due to the nature of the dry electrolyte, the cell can be constructed in any shape or size, even rolled up. Therefore, in theory it can be embedded into the case of a device, the handle or even clothing. Although such batteries are still a few years away, they are none the less a possibility [Buchmann 2003]. Embedding the battery into otherwise empty or unused spaces could be a major benefit in the near future. We could envisage a wearable computer whose case is actually the battery.
3.10.2 Making Better Use of What We Currently Have The capacity of a battery is very much up for debate and the effective capacity of a battery depends a great deal on the manner in which the battery is used. For Lithium based chemistries, the best capacity is seen when current is drawn in bursts, leaving the cell recovery time in between heavy loading periods [Lahiri 2002], [Panigrahi 2001].
The next chapter looks at some field trials with wearable computers and discusses the results. The results are then used to find out what the requirements of a typical field working wearable system are. This chapter also looks at some of the design stages required to build your own wearable
94
Chapter 4 Experiments with Wearable Computing in Field Archaeology
Chapter 4
Experiments with Wearable Computing in Field Archaeology
95
Chapter 4 Experiments with Wearable Computing in Field Archaeology
4.1 Introduction This chapter discusses some experiments carried out in the field and includes the results from three field trails. A great deal was learned out in the field. Details from these observations such as the data collected as well as how the data can be represented is also presented. Based on some of the findings these experiments, the design and building of a new wearable system the Chi-3 is discussed.
4.2 The Rome Field Trial
Figure 30 Rome Field Trial – Forum Novum, Tiber valley - Italy 2000
The WearCAM was constructed as part of a Final Year Project at the University of Birmingham. The WearCAM was the first wearable system to be made in-house at Birmingham. Despite the WearCAM’s name, it should be noted that it is a different system to that described by Mann et al [Mann 1997], [Mann 1997 B]. Like other wearable systems such as Starner and Platt’s Tin Lizzy [Starner 1995], [Starner 1999], the wearable computer was constructed from a PC/104 based technology. However, unlike the Tin Lizzy, the newer more up-to-date hardware allowed a single board system to be constructed.
This made the system much smaller, lightweight and belt
mountable. Negating the need for the cumbersome bag used by the Tin Lizzy. The board used in the WearCAM is an industrial board, particularly hardened for use in environments of vibration, dust and extended temperatures. This made it an ideal candidate for use out in the field. For the 96
Chapter 4 Experiments with Wearable Computing in Field Archaeology first study, the WearCAM was taken out to an archaeological site at Forum Novum in the Tiber Valley, Italy [Cross 2000]. Figure 30 shows the wearable computer being trialled by Dr Vince Gaffney; note the balancing of the belt-mounted device on the right and the battery on the left. The purpose of the Rome trial was: •
To test the hardware in a very hot and dusty environment
•
To log pictures of the archaeologists activities
•
To discuss collaboration between Electronics and Electrical Engineering and the School of Archaeology
•
To investigate practical wearability issues out in the field
•
To help design the next generation wearable that would become the Chi-3
•
To study archaeological field methods
The original system used an image acquisition program running under Microsoft Windows 98™. The computer then took pictures every twenty seconds from a camera mounted on the cap of the archaeologist. During the day, the archaeologist, Dr. Vince Gaffney, pictured in Figure 30 on page 96, walked round the entire site talking to the student archaeologists whilst they were performing their tasks. The computer provided a complete pictorial record of the walk round, and operated well, without a glitch even when exposed to the 40°C Italian heat. Whilst the computer did its intended job satisfactorily, it did have some problems that needed to be addressed. •
The system had no display making it difficult to diagnose or be sure it was operating successfully. Although this was the intended mode of operation.
•
The focus of the camera was difficult to check without a reasonable display
•
The wires out of the computer itself were located in a position where it could snag on doorways etc.
•
The routing of the wiring altered the way the archaeologist moved.
•
The camera mounting position was good but the method of mounting needed refinement.
•
Removal of images was a slow process, using the network interface.
•
System was not that useful.
Clearly, the system provided only a limited visual record of the walk around the site, as its only application. This simple task showed that such a system could be worn on-site, providing the future potential to do more useful work for the archaeologist. In addition, there were many problems as detailed above that needed to be addressed from a hardware perspective whilst addressing the software. In the field, a great deal was learned about the application of this type of technology. There were examples demonstrated of laptop hardware that had succumbed to the heat and dust. Despite the 97
Chapter 4 Experiments with Wearable Computing in Field Archaeology systems inherent lack of usefulness it was the first trial and the visit was worthwhile. Successful from the point of view that it had demonstrated that wearable hardware could be made to fit on an archaeologist without hindering them unduly and it could operate in the heat and environment. It was soon realised that there was potential for such a device to aid in the detailed data collection on archaeological sites.
4.3 The Wroxeter Field Trial The Wroxeter field trial is an example of coarse-grained data collection whilst walking round a site. Collecting data whilst walking round a site is not a task suited well to laptop hardware.
Figure 31 Wroxeter [left] Wroxeter Boundary [right]
The Department of Archaeology at the University of Birmingham runs post-exam courses every year to help their first year undergraduates gain some valuable fieldwork experience because field archaeology experience cannot be taught in a classroom any more than learning to drive a car. It was felt that it would be a good opportunity to test a simple field-data capture system on some innocent participants. Wroxeter is a site belonging to English Heritage, a site that is based around an ancient Roman settlement. On the site there are quite a few obvious ruins and plenty of information for visitors. For the intrepid young archaeologists, there are many features hidden in the landscape away from the central settlement that indicate ancient human activity that are not so obvious to the untrained eye. Walls, mounds or ditches form linear earthworks, which change over time as areas are developed and they often surround roman settlements. Archaeologists must investigate these landscape features by doing a walk round the site. Normally this process would involve a group of people with a map, GPS, camera and large amounts of forms to fill in. On the way round, when they discover a feature they feel is important, they must record its location accurately together with 98
Chapter 4 Experiments with Wearable Computing in Field Archaeology as much information as they can. This is usually supported by photographs, which are stored for later retrieval.
4.3.1
The Field Trial
The benefits of a computerized system in this type of investigation are quite clear. There is no need for separate components, such as a GPS, maps, pens, cameras and armfuls of paper. All of which become a problem particularly when the weather does not cooperate. Wind and rain all make the experience interesting while walking through miles of farmland, climbing fences and gates; any system has to be extremely rugged, more so in fact than the user –when the students break – at least they repair themselves.
4.3.2
The Paperwork
Figure 32 the Paperwork
Figure 32 shows the paperwork involved in a typical survey. The record sheets consisted of the following on this occasion: A: a general map of the area B: a detailed glossary of terms to be used with: C: more detailed maps of the area D: the observation form E: enclosure record details F: enclosure record Items D, E and F are usually unique to a single observation, so the archaeologists must walk around with many copies of these. A single observation requires about a dozen sheets of paper plus a further five sheets or so for each observation. Typically, a survey could include forty observation 99
Chapter 4 Experiments with Wearable Computing in Field Archaeology points, and so it quickly becomes a difficult experience, particularly if one is not very organised. The students had particular trouble locating the correct sheet on which to record information. Later, they discovered that it was almost impossible to find the correct sheet again, as they had become out of order. In one case, some of the sheets were lost to nature. In addition to the papers, a camera and a GPS receiver are used in order to gather information. It was the purpose of this field trial to see how effectively this data collection task could be performed on the hardware – a Panasonic Toughbook Wearable system. A direct quantitative comparison between a paper based system and a computer-based system is always difficult because the observation process is substantially different.
Figure 33 filling in an enclosure record in the field
Clearly there is a great deal of information that needs to be recorded, and it is important to try to maintain the integrity of this data. This information will then need to be extracted back at base and in most cases entered into a computer. This poses further difficulties, such as figuring out which picture belongs to which piece of information. This type of information could be captured directly in the field, which would preserve its integrity. As field trips can be time limited and expensive, access to the data in the field offers further advantages of cost saving and speed. The students often find themselves entering the same data on the paper sheets when the surroundings have not changed that much between observations. By providing drop-down boxes or the equivalent, the data entry process can be vastly speeded up- a suitable technique would be similar to Pascoe and Ryan’s pre-filled in data capture forms.
100
Chapter 4 Experiments with Wearable Computing in Field Archaeology
4.3.3
Digital Storage Considerations
Figure 34 the IBM 2.5" Hard Disk used in the Chi-3 holds 40 GB and is 9mm thick
The capacity of a typical mobile 2.5” hard disc, (at the time of writing) typically 10 – 60 GB, is vast in terms of storage for textual information.
60 GB of textual information is an
incomprehensibly large amount of text. The entire contents of a library would easily fit even before redundancy removal or compression. Therefore, the capacity of hardware even of the present day is easily capable of storing much more information than just the forms, and could include, images, sounds and data from other capture devices. The only data type likely to occupy fast proportions of the drive is likely to be video footage and one could argue that if video footage is a problem then it can easily be kept on a dedicated device.
4.3.4
Wroxeter Field Trial Hardware – The Panasonic Toughbook CF-07
Usually with wearable systems, a Head Mounted Display (HMD) is the display of choice with a pointing device of some form. However, for in-field data entry, it is thought that this is not really appropriate particularly in light of the research discussed earlier about the pitfalls of such technology. There is a spatial dislocation between the pointing device and the HMD that makes selecting boxes problematic and slow. The users will be entering a great deal of data in a standard form, such as the sites and monuments record. It can easily be argued that a touch screen is the most appropriate for this task as it is the closest digital equivalent to a paper form. When input from more than one person is considered; the screen can simply be handed to another participant.
Figure 35 the Toughbook System
101
Chapter 4 Experiments with Wearable Computing in Field Archaeology The Panasonic Toughbook CF-07 comprises of a ‘brick’ processor module (its dimensions happen to be exactly those of a typical house brick), operating at 300MHz it works with a wireless sunlight readable touch screen that can be operated at up to 100m from the processor module. This offered several configuration options: The wearer can have both the display and the computer. They can pass it on if required. Alternatively, the processor could be worn by someone else or even located in a car on site. The benefit being that each location can easily be tested for its suitability. The display has three ports; power, serial and wireless. The power is purely for recharging the unit, but if battery life is found to be too short, some sort of external power source such as a fuel cell or a battery could be attached if required. The serial (RS232) port offers flexibility, providing data acquisition capabilities remotely from the processor. Currently, the only reason to carry the processor is the requirement for live image capture via the USB (Universal Serial Bus port).
4.4 Wroxeter Field Trial Software The field trial software was developed specifically for the Wroxeter field trial. The software was written in Borland Delphi for no specific reason other than a handy image capture program had just been written for some other work. The sites and monuments record is a standard data format requirement that the software must be able to output. For this trial, there was a detailed list of options for each element exactly like the paper-based system (see Appendix C 1 Wroxeter field trial data framework on page 190). In addition, the system was designed to handle free text, basic sketches and rudimentary mapping functions.
4.4.1
Textual Data Entry
Figure 36 listing of possible finds
Basic data entry was performed by selecting from drop down menus. The entire system including text boxes, the data and their contents can be configured by text-based configuration files. This allowed the software to be extended easily to accommodate additional data in the field. Text could be added to extend the data at run time also – once learned, a new type of find then is available for later observations. Data entry for these boxes requires an on-screen-keyboard because there is no 102
Chapter 4 Experiments with Wearable Computing in Field Archaeology physical keyboard, and this produces quite acceptable results and is reasonably quick to use for short text descriptions. Pen (handwriting) entry was far too slow in this case for text recognition to work. The data for each observation is then saved to a file as soon as the next observation is invoked. Some of the data entry acquired automatically to further save time in the field such as the location, which was obtained from a standard GPS receiver.
4.4.2
Graphical Data Entry – Sketches, Photographs and Maps
Figure 37 Sketches and the Sketching Options
Sketches were seen as important because they allow great flexibility in the recording task. In addition, sketches are also important for collaborative work allowing one individual to convey ideas to another. Sketches can be very simple affairs (see Figure 37), showing something specific. In the Wroxeter software, sketches could be drawn freehand using the guidelines on the grid provided. Sketches could also be drawn on top of a photograph from the attached camera or on top of the digital map provided. This offered abilities that they could not have with the paper-based system, and they did make use of them. Photographs and maps could be imported into the sketch before the sketch was made allowing the user to annotate the image. Unfortunately, annotations cannot be separated from the image; the output is saved as a composite bitmap only. (For more information on more advanced digital annotation as a field application, see section 5.3)
103
Chapter 4 Experiments with Wearable Computing in Field Archaeology
4.4.3
Mapping Capabilities
The software included a basic map of the Wroxeter site but the resolution of the map was not sufficient for navigation or detailed enclosure records (i.e. down to a single field).
Ideally an
Ordinance Survey map would have been far better suited to this type of application. A navigational overlay would have been helpful, as would a graphical view of where the observations were obtained. There are no technical limitations of the mapping capabilities, but like any map system, it depends only on the quality of the data that is available. Using the GPS, it is possible to create a map from scratch by simply walking round the perimeter of a site. Large monuments or features like hedges and rivers could easily be drawn by simply walking along them. It would then be trivial to reference data within this ‘homemade’ map.
4.5 Field Trial Results The purpose of the trial was to observe the way in which the device would be used and to observe the practical issues of wearable computing in a field environment. As an early trial, the system represented a best guess of the form a field-working device could take based on reasonable assumptions. Wroxeter proved a good site and offered a range of interesting impediments such as animals, nosey farmers, mud, tall grasses and fences. Therefore, it was a good opportunity to observe the effects of these on the data collection process. For samples of the data recorded, refer to Appendix C Wroxeter Field Trial on page 188
4.5.1
The Trial Computer System
Figure 38 First Contact (Wroxeter Video 0.07) Note the GPS and the Processor located on the back of the person on the far left.
104
Chapter 4 Experiments with Wearable Computing in Field Archaeology Out in the field, the computer system was well received. The system was arranged so that one person had the processor unit and the GPS, whilst another had the display (see Figure 38). Initially, there were a couple of minor technical difficulties that had not been anticipated, such as Microsoft Windows™ detecting the GPS on start up as a mouse, this was easily corrected. At the start of the survey, the students did not understand how to use the system at all, despite the fact that instructions were displayed on the start-up screen; they just would not read them out in the field. Following a brief (30-second) demonstration, it was found that they quickly became competent within about 3 minutes. It was seen that many additional practical field tasks were demonstrated to the students in the field.
Figure 39 Taking a Picture was very difficult; the video was too slow (Wroxeter Video 3.51)
About five minutes into the survey, the students were found to be entering data with remarkable speed. It was assumed that they would not be able to enter data at the speed of an experienced operator but they were filling in data quickly, perhaps because of their familiarity with Microsoft Windows™. A number of observations were also made regarding the way in which the students used the interface; it was noted that when an item did not apply, the students found that they could abort an entry by tapping elsewhere on the form. Using a pen on a screen differs from the traditional mouse interface that most users are used to, in that tracking of movement only occurs on contact with the screen in this case so dragging and similar operations are carried out in a slightly different manner. Fortunately they required no help with this.
105
Chapter 4 Experiments with Wearable Computing in Field Archaeology
Figure 40 Rapid Form and Pen Based Data Entry (from Wroxeter Video 4.28)
However, the students’ obvious familiarity with Microsoft Windows™ meant that they had no difficulty with the interface, even when using the display in the field. In addition, it was also noted that the students were adding data whilst walking along, after their last observation, such as adding data that was perhaps, less important and easy to remember, or just making little adjustments.
Figure 41 Entering Data on the Move (from Wroxeter Video 8.04)
This behaviour was certainly not seen whilst using the paper system, where the students preferred to sit down on the grass to write information, however, in both cases both the screen and paper were used to refer to whilst on the move. When walking round they would refer to whichever map was closest to hand. It seems that the students were able to accept information on the move quite easily.
106
Chapter 4 Experiments with Wearable Computing in Field Archaeology
Figure 42 The paper was more difficult to handle in the field, and was often easier whilst sitting down. (From Wroxeter Video 28.36)
When the students returned to the University, they then had to reassemble the data that had been recorded. Although no formal analysis of this stage was performed, it is an important part of the whole system. The observations from the computer could simply be extracted by attaching the network cable, then the data can be read as simply as copying a directory of files containing all the observation and image data. For the paper system, they would need to find the sheets and make sure they are in order, and then find or process any pictures that they have taken and assemble all of this on a computer. This meant that the data had been copied at least once by hand, which takes time and could lead to errors. In addition, the digital or traditional photographs would not be linked or annotated in any way so some of their importance is potentially lost.
Figure 43 Form Based Data Entry – One of the Wroxeter Data Capture Screens
107
Chapter 4 Experiments with Wearable Computing in Field Archaeology
4.5.2
Digital Image Capture
Pictures for the observations were acquired using a Philips WebCam (see Figure 39); this particular WebCam is of a superior quality using a CCD capable of up to 1024x768 (XGA) resolution, which is important for still photographs. Pictures could be captured to help support the observation or they could be captured and then sketched on directly. There were a number of problems with the image acquisition that made the use of these pictures very limited in practise. The camera was connected to the processor unit via a 5m wire meaning the operator of the wireless screen, did not necessarily have the camera. Composing an image usually involves a user looking through some sort of viewfinder and then taking a picture when they are satisfied with the picture. In this case, however, the viewfinder and the camera were separate, which meant that the picture was very difficult to compose (refer to Figure 39 on page 105). To add to this dilemma, the display was very bad at displaying the images. The display is a sunlight readable display, which means that it can use external light sources to augment the built in back light. This gives a reasonable result, which is visible from complete darkness to direct sunlight. However, the display is also a wireless display, using a low bandwidth connection (in video terms). One of the trade-offs to get acceptable response of the display is to cut the number of display colours, to less than 256. This was fine for black and white text, but the images were very difficult to see, with significant blocky banding. In addition, because the display is trans-reflective, intermediate colours (grey scales) look different in different lighting conditions, which make the pictures very hard to see, without holding the display at strange angles. The touch screen overlay is formed by vacuum-deposited aluminium between two plastic sheets. This deposition forms a resistor that is bridged whenever the screen is touched and this is how it determines the location of the stylus. This works fine in practise, however, there is another object that uses vacuum deposited aluminium – a mirror. Therefore, there is a great deal of reflection from the screen that can, in certain circumstances, make low contrast areas of the screen difficult to distinguish between. There were a number of instances where the picture capture was found to be fine on return to base, but was thought to be of no use when it was taken in the field since it looked too dark or blocky. Perhaps the most interesting issue of picture composure is that under normal circumstances, the simplest of viewfinders is sufficient. If one has an older camera, there is no way of viewing the resultant picture until it is developed; yet generally the user is confident that the picture taken is correct. In this case, a viewfinder was included on the wireless display, and in many ways, this made the issue far more complex. The mounting of the camera is quite important for field use. For the original Rome field trials, the camera was mounted on the forehead of the archaeologist. It was thought that this was less flexible, but compared with the Wroxeter field trial, it was better. 108
Chapter 4 Experiments with Wearable Computing in Field Archaeology Finally, the pictures could be used for sketching and annotation. The students were able to grab an image from the camera and use that as a basis for their sketch. This worked fine with the exception of adding text. They assumed that because they could draw on the picture, they would be able to write on it, and this could have worked, but the touch screen response is a little too slow for writing text. They did, use it in this manner a number of times and this is a limitation of the system that can be easily overcome in the future by using a faster sample rate. Writing text on the image is not ideal, as it cannot be automatically searched later, it would have been better to use the text fields provided. However, there is then a difficulty relating the text to objects in the picture. It was evident that there needed to be a better way to tag objects in the picture with textual data without altering the picture. This kind of annotation would be useful for all sorts of situations, but would need to retain flexibility. Sometimes the user wanted to tag a very small region, and in other cases draw on a very large object such as a river. Interestingly, the students used the pictures in a way that was not anticipated, but which may be important for a future system. The students often decided to take pictures of distant objects, such as a hill-fort, pointing out that it is visible from a point in the boundary; this is important from the point of view of landscape archaeology.
4.5.3
Camera Resolution Comparison
It would be possible to have a wireless camera, but this would limit the capture to standard television resolution with current technologies. Arguably, not nearly enough for publishing or detailed work, but perhaps sufficient for getting an overall impression. The table below shows a quick comparison of different imaging sources that could be used out in the field, together with their respective resolutions. Camera Type
Interlaced
Resolution
TV
Yes
720x576
Wroxeter WebCam
No
640x480 – 1024x768
3 Mega Pixel
No
2169x1440
Table 9 Example Camera Resolution Comparisons
The field trial demonstrated that different resolutions work well for different situations. A standard television image is interlaced and with a maximum resolution of 720x576.
The interlacing
produces a combing artefact that can be undesirable in still images, particularly if the subject or the camera is moving, even a small amount. The Wroxeter video itself was recorded with a broadcast quality triple CCD (one for Red, Green and Blue) digital video camera, and figures such as Figure 39 on page 106 are examples of the quality from this kind of camera, in contrast Figure 41 on page 109
Chapter 4 Experiments with Wearable Computing in Field Archaeology 106 shows part of an image produced by a 3 Mega Pixel digital camera. The digital camera is not interlaced resulting in a crisper still image and its 3 Million Pixels contains a great deal more information that the video. This will produce much larger images, which can no longer be live across a network. The screen itself on the Toughbook is 800x600 pixels, and so a high-resolution image must be resized to fit in the first place. For the study, 640x480 was chosen as it fits easily on the screen with space for toolboxes etc. The image quality from the WebCam was not as good as it could have been because it was, at the end of the day, a low-cost WebCam. A camera designed for video differs in design from one designed for still imaging, in much the same way as a digital flat panel differs from a digital video monitor – one is designed for motion at lower resolution, leading to larger faster elements, and the other is designed for resolution. The system would work well with a digital camera with multiple Mega pixels capabilities that can write its image directly to the HDD of a host PC if one were available.
4.5.4
GPS in Practice
The Wroxeter system used a GPS system mounted on the top of the backpack used by the person with the Processor unit. This recorded the position of the team as well as the direction, speed and height. This information was used to augment the images and observation data automatically. The advantages were that the team did not need to acquire this information separately, which previously took a great deal of time, approaching several minutes when using the paper system. These particular students were not comfortable using paper maps. The direction data does not work in the manner with which one might hope. GPS is not capable of determining the direction one is facing, but can only work out the direction whilst moving because it knows the bearing of previous locations – known as the heading. Once the students discovered this, they used this to get the bearing of landmarks by simply walking towards them from where the observation was taken. It is quite amusing to note that they did not consider that the GPS information was acquired from the backpack, so the student was running round with the display, wondering why the direction was not changing. This is an interesting example of how distributing a system can be confusing from the user’s point of view. The GPS simply reported the position as Latitude and Longitude. This is not compatible with the National Grid reference system that archaeologists traditionally use (see Figure 44). Conversion between the coordinate systems is possible but non-trivial because regions overlap and coordinates repeat. The Wroxeter software did not support the conversion process. In the future, it would be advantageous to support other grid systems.
110
Chapter 4 Experiments with Wearable Computing in Field Archaeology
Figure 44 the National Grid in relation to Latitude and Longitude [Nat GPS]46
4.5.5
The Digital Map
The integrated map presented some issues that could be addressed in future trials. The map consisted of a simple bitmap of the area that had been added to the software. This map was of limited detail and really only showed the whole area, so it was found that the students preferred to use the more detailed paper maps, for all but general navigation. In addition, when pointing things out to each other, they also used the paper, presumably, because they thought that not everyone could see the screen when crowded round it. The former issue could be resolved by adding more detail to the map with a simple zoom function, or variable detail. Perhaps the largest failing of the students on this exercise (yes the students can be blamed) was that they seemed to have no sense of direction or scale whatsoever. Since the system is using a map and a GPS in the software, there is no technical reason why a simple navigation system could not have been implemented with the exception of time and complexity. In this case, with the time scales allowed, this function was omitted, but in future, a map could be augmented with a large ‘X’ to mark their current location. Is this making it too easy for the students? Navigation is an important task that could easily be assisted by the computer, which might be particularly on large sites such as this – covering several miles.
4.5.6
Interaction
Perhaps the most rewarding part of this study was the fact that the students liked the system and used it properly, putting effort into making it work, they even figured out ways to work around some shortcomings, on their own - which is very encouraging. In this situation, the students 111
Chapter 4 Experiments with Wearable Computing in Field Archaeology seemed to apply common sense and solved problems on their own. There are obvious limitations to the system, but they were much more involved in the task than they are with the traditional paper equivalent situation.
From the video of the study, it seems that they worked well whilst
unsupervised, and managed to collect useful information, something that does not come easy for first year students when they are unsupervised, particularly after the intense examination period. It is also interesting to note that one student in particular liked to take care of the data entry, the others helping with the navigation, camera and the questions. A single individual can easily use the system alone, but it worked well with more participants, each helping the user select the most appropriate answers for a given question.
Overall, they did not really find the equipment
cumbersome, even though it was not ideally suited to the task. There are a few things that need to be checked in the future, such as clearance whilst climbing large gates because they preferred to climb over the gates rather than trying to open old and rusty mechanisms. This leads to a backpack based system being vulnerable to contact with the gate, which can be clearly seen on the video footage.
4.5.7 Additional Data
Figure 45 a Total Station optical measurement device (left), confused student (middle), archaeologist with the Toughbook (right)
During the Wroxeter study, just a small portion of the information was captured, and even some of this information was not captured because the pre-defined answers did not necessarily correctly describe every situation. It is important, therefore, to realise that any field-based system needs to be flexible and must be extensible. Perhaps the system should be a learning system, one that builds 112
Chapter 4 Experiments with Wearable Computing in Field Archaeology its own structure as more data is collected. The fieldwork involved many groups of students all given different tasks ranging from the work for this study, to geophysics and surveying using optical range-finding equipment such as the Total Station (see Figure 45). The data collected is stored in different locations until it is reassembled back at base, in this case back at the University of Birmingham.
4.5.8
Data Networking
The Panasonic Toughbook consisted of a processor core unit and a wireless display, which included a touch screen. The two devices are linked via an IEEE 802.11b (WiFi) standard wireless network (see section 2.9.2 on page 54). This type of network has the ability to communicate up to several hundred metres in the field. In the archaeological field trial, the distances covered meant that the processor core had to be carried with the group. If the survey was to take place in a confined area, then the processor core could easily have been left stationary, in a car for example. The range limitation of WiFi could potentially be a problem in the field. Fortunately, it is possible to ‘Turbo charge’ a wireless LAN to extend its range up to 16Km (10 Miles) by using higher gain antennas. This would produce a narrow coverage area (beam) that would limit its usage or require tracking of the mobile units, but this sort of arrangement could be used to link stationary multiple field units separated by larger distances. In this case, a USB camera was used to take pictures, and requires more bandwidth than the wireless connection supports in addition to that used by the display itself, so it was necessary to connect the camera direct to the Processor core and hence carry the core. In the Wroxeter field trial described here, we saw a single group of students operating a device and slowly building up the information as the survey progresses. In some situations, it would be beneficial to share this information with others. Supposing a particular activity such as trench digging cannot be done until the information from Geophysics is complete. It would be beneficial for this information to be available as soon as possible; otherwise, it would be difficult to know where to dig the trench. If all parties concerned were working on the same site with a computer system, it would make sense for the information to be shared via some form of networking. A traditional approach to this might be to write or sketch some information on a sheet of paper and then to pass this on to another member of the team, a networking method known as ‘Sneaker Net’. As mentioned earlier, it is a goal of this work to try to capture as much information as possible and to allow it to be used as efficiently as possible, as quickly as possible, hopefully – negating the need for it to be processed at a remote location.
113
Chapter 4 Experiments with Wearable Computing in Field Archaeology Referring back to the statement of data types: ‘data comes in three distinct types Numerical, Audio/Visual and Textual.’ one can clearly see that Graphical information storage is already possible and more than satisfactory. Numerical data processing and storage is what computers handle natively, and Textual data storage, searching and processing is very well developed. So every type of information that is likely to be encountered out in the field, with the exception of tangible artefacts, can already be stored digitally and transported over wireless networks in the field – So why are they not doing that already?
4.6 Wroxeter Results One does not expect the trial to be a complete success and what follows is a listing of observations from the trial. The points, both good and bad, together form a very useful set of observations that can assist future developments.
4.6.1
Good Points:
o The system was reasonably intuitive, once a quick demonstration had been made. o The display could be seen well even in direct sunlight for text. o The GPS worked correctly, but it was a little slow to respond to track changes. o Sketches were possible. o Sketches on photos were possible. o Battery life was short but lasted the duration. o The display was fairly lightweight, but can still make the hand ache. o The wireless connection worked. o The map worked well for a general view of the site. o All group members stuck to the task in hand. o Users familiar with the Microsoft Windows™ environment. o Touch screen seems to work well without much instruction. o Reasonably quick to learn. o Data quicker to input than thought. o Data entry while walking was no problem, and not expected. o The students collected 18 observations by contrast in the same period; the group using paper collected only 4 observations.
4.6.2
Bad Points:
o The observation flow could be improved. o The camera was too difficult to use. o The camera was separate and scene composure was hard. o Pictures could not be seen well at all. 114
Chapter 4 Experiments with Wearable Computing in Field Archaeology o The map lacked sufficient detail – needed a zoom. o The observers needed to be shown where they were on the map. o The users needed a compass. o The system in the backpack was vulnerable to fences. o Pen input too slow for writing directly on sketches. o The GPS causes problems with windows on boot-up. o Choices were not really applicable in many circumstances. o Only one person really doing all the work. o Favored by some more than others. o Direction possibly inaccurate for picture tags, such as taking a picture to the right. o Group members cannot all view the screen at once. o Often difficult to relate a description (annotation) to an object in a photo.
In addition to the observations of the computer-based system in the field, a number of very important observations were made for the paper system. It can always be argued that many of the observations for both the paper and the computer-based system are because of the student’s lack of field working experience. Observations of the paper system: o The paper system was easier to sketch on, however sketches were not accurate. o The paper system was not as well received. o Too many sheets of paper. o Wind made paper difficult to handle. o Paper hard to write on in the field. o Paper too bright to look at for some people in direct sunlight. o Grid reference hard to obtain when one cannot read a map. o Lack of inspiration leads to blank sheets. o No sense of direction in the field made even worse with paper. o Need multiple sheets, leading to problems in the field. o No structured approach to data collection. o Typically more easily side tracked. o Data entry whilst walking: not possible. o Cannot keep sheets together. o Lots of sheets were not filled in at all (wasteful). o Only 4 completed records, which is poor in comparison with the computer assisted system
115
Chapter 4 Experiments with Wearable Computing in Field Archaeology In addition to the observations made for the general data collection, the field trip was also a good opportunity to look at other aspects of archaeological fieldwork. In particular the electronic measurement equipment provided some inspiration, because the outputs could easily be used directly in the field (if a computer were used) to map and help interpret the results. Surveying equipment: o Geophysics can produce serial RS232 data that can be integrated in to a field system. (Resistivity). o Surveying measurement equipment produces data that can be captured and shared amongst mobile computer users almost as soon as it is generated. o Survey equipment produces extra levels of software that may be unnecessary, it is possible that an integrated system can be used that would act as a common interface for a range of electronically based in-field tasks. o There is a need for quick aerial overview – Live images, or terrain modeling; sometimes a quick overview of the site can be very important for ‘getting one’s bearings’.
4.7 Evaluation of the Wroxeter Trial The field based computer system worked quite well in the field, and even non-specialist users seemed determined to overcome many of its shortcomings. A quantitative comparison of the traditional system versus the computer system is difficult based on the different capabilities of the two systems. The paper based data collection lead to four complete observations. Whereas the computer based system lead to eighteen observations; which is encouraging. This result could be more to do with the group than the actual collection capabilities of the device, but even discounting the numbers, many of the other observations about the system in general, were extremely valuable.
4.8 Field Data Collection Data Types The field environment, offers a plethora of ‘little bits’ of information that for archaeology must all be carefully catalogued and stored in an efficient manner. It can be referenced or recovered later in its entirety. The data types fall into three distinct areas, thus: 1. Numerical Data: a. Site measurements. b. Finds measurements. c. GIS Coordinates. d. Height information. e. Other quantifiable metrics. f. Site measurement. 2. Textual Data: 116
Chapter 4 Experiments with Wearable Computing in Field Archaeology a. Description of finds. b. Description of site. c. Other descriptions. d. Sketch and photo textual annotations. 3. Audio / Visual Data: a. Aerial views. b. Audio descriptions. c. Geophysics data. d. Map data. e. Object photographs. f. Site photographs. g. Sketches. h. Video. How can this information be most efficiently, collected, stored and used? Efficiency could be defined in a number of different ways. For field archaeology, one might argue that an efficiency gain could be defined in relation to the speed of acquisition, the speed at which the data can be accessed, and how small it can be stored. Equally valid is an argument that judges the efficiency of such a system by the ease of data recovery. In order to make the system as efficient as possible one could suppose that we want it to operate as fast as possible without sacrificing accuracy. To save time some items could be collected automatically. This requisite can be satisfied since some of the data acquisition devices such as GPS (Global Positioning System) are collecting a continuous feed anyway.
The instantaneous position can be recorded, and the
dynamics such as speed and direction can be used in order to add some awareness to the user’s current context. Logging speed and direction of movement allows the system to be able to determine the current position but also a prediction of future positions. It can also determine how fast the user is moving, and this can help work out whether they are walking, running or stationary. This could help the system minimise the amount of user intervention required. As stated earlier it is thought that current interfaces that are highly interactive are not ideally suited to a wearable situation where the user needs to concentrate on other issues; rather it is better for the system to take a proactive approach. For example, it could be prudent to assume that if the user is travelling slowly then the surroundings are more important than if the user is running about. Conversely, if a user is running, they are unlikely to want to be given detailed information about every square metre on a site.
117
Chapter 4 Experiments with Wearable Computing in Field Archaeology
4.9 Representation of the Data Collected The data collected consisted of text information, some pictures and sketches, some numeric information and the position at which all this was taken. As a matter of course, the system would also record the date and time of the observation data, and thus the order.
4.9.1
List Information Representation
Data can be shown in a list and could then be sorted alphabetically, numerically etc. This is a quick method of representing the data that allows easy recovery only if two conditions are met. 1) You know what you are looking for. 2) The total relative amount of data is small.
4.9.2
Temporal Information Representation
Normal computer filing systems often have a time stamp on every file. This is often a good way to limit the number of ‘hits’ on a query, since one could limit the data shown in a query to be that which was collected before lunch, for example. However, it will only work if everyone knows when the data was collected, and this specificity is likely to degrade over time as it relies on an individual person’s own memory.
4.9.3 Spatial Information Representation Spatial representation of data is a smart way of showing the stored data, particularly for archaeological use. Data collected can be visually shown on a map as an icon or some other representation. Even in a very large database, one could extract the data they need by looking only at a small region of interest. Therefore, a database could hold information about thousands of objects on many sites, and it would only show the ones of interest. This ought to work well in a system that collects GPS data.
118
Chapter 4 Experiments with Wearable Computing in Field Archaeology
Figure 46 Some Data collected in Wroxeter (Geo-Referenced)
The Wroxeter study software logged the location of each observation, which can then be plotted on a map. To indicate that an observation has taken place, a simple cross or flag could be used. Simply pointing to the cross would then allow the user to view that data. This approach is not new and works well. However, being able to make use of all captured data immediately on site between systems of networked wearable computers is a concept that could be extremely beneficial. For example, user (a) collects data for the east of the site and user (b) collects data for the west of the site; both users can see and access all the data represented on the map. This kind of organisation is essentially a geo-referenced annotation system, or a GIS-based annotation system. Clearly, annotation is a very powerful way of recording a wide variety of little bits of information especially if they do not conform to a known form. In some cases, it is not necessary to include a large amount of information. Simply marking an object in a photo or an object on a map can have a great benefit. It was seen in the Wroxeter trial that the annotation provided was not sufficient, because it was difficult to relate the annotation to a specific object in the photo (See section 4.6 Wroxeter Results on page 114). The only way to solve that problem would have been to have a single photo for each specific object of interest. This is both inefficient and would not preserve the spatial relationship between objects effectively.
119
Chapter 4 Experiments with Wearable Computing in Field Archaeology When recording information on sites such as the Wroxeter site, forms are often used to record on. Forms offer a great way of obtaining structured information from an individual or an event. They work so well because the entrant is constrained to only enter the data that the form will accept. There is often little scope for flexibility. Typically, in situations such as the Wroxeter field trial, this flexibility is offered by the inclusion of a box labelled ‘notes’. From the Rome field trial and through the electronic field working workshop in January 2001 (see Appendix A Electronic Archaeology Workshop January 2001 on page 187) and the Wroxeter field trials, it was found that annotation could be one of the most important applications for any field working device. The annotation provided by the Wroxeter field trial was an essential step, but it did not allow the flexibility or speed of annotation.
120
Chapter 4 Experiments with Wearable Computing in Field Archaeology
4.10 Building a Wearable Computer- The Chi-3 In 2000, work was undertaken to produce a wearable platform with imaging capabilities. This was the first attempt at The University of Birmingham to create an in house wearable computer system. At the time, there had been various other similar wearables built at other universities, mostly in the guise of modified laptop hardware that was made wearable using a backpack or something similar. That architecture of choice was undoubtedly the x86 architecture, well known amongst nearly everyone as the humble desktop PC. However, the operating system of choice seemed to be a form of Linux. This choice is well known amongst hobbyists and developers because of its ease of integration and development potential. However to the majority of computer users of the time it was virtually unheard of and much less well known than Microsoft Windows™. From 1995 onwards Windows™ had come a long way towards making things simple for the user, and by 2000, plug and play had made things even simpler, by making the addition of new hardware and capabilities as simple as just plugging it in. At the time that the WearCAM was built, this level of flexibility was only available with windows and its ability to support USB, leaving Linux behind. The first prototype used a PC/104 based motherboard as its main backbone. A similar approach to earlier wearables such as the Tin Lizzy [Starner 1997]. PC/104 boards are all the same dimensions and they have a stack-through capability, meaning that more than one board can be stacked. This has the enormous benefit that allows the expansion of the system to include just about any type of hardware imaginable. Many manufacturers of desktop hardware also make the same cards for the PC/104 platform.
Figure 47 the older Rome Mk2 is almost five inches thick. It requires four boards for basic PC functionality [VASE] (Vase Lab Essex)
121
Chapter 4 Experiments with Wearable Computing in Field Archaeology The early Essex wearables were comprised of up to four boards. The main board was an Ampro based 486 motherboard, which required multiple cards to operate. Whilst the multiple cards can be a benefit for expansion, this early system required multiple cards for a basic system. Much like the Tin Lizzy.
Figure 48 the original prototype Birmingham wearable, only requires a single board so is much thinner and lighter, and has less interconnects to cause mechanical problems.
By contrast, the first Birmingham wearable used the much newer single board Pentium™ from the Swiss manufacturer DigitalLogic47. This allowed the Birmingham wearable to be very much smaller, lighter and lower power consumption than the Tin Lizzy or the Essex wearable. The single MSMP5s board included all that was necessary to build a wearable with the exception of the power supply module and the hard disk. As part of the undergraduate efforts, a micro power supply was designed and built as well as a rudimentary enclosure including the hard disk and was about 3cm (1 inch) thick. The original wearable was based around the Pentium™ core. With a little bit of work it was possible to get the device to successfully run Microsoft Window 98™. It is, perhaps, safe to say that this was one of only a few non-commercial wearables to run a Microsoft operating system. The board itself also contained a video input frame grabber that was able to capture Televisionquality images from an external camera. One of the original aims of the WearCAM was to provide ubiquitous imaging capabilities to the user [Cross 2001]. At the time, digital cameras were expensive and had severe limitations on the size and the amount of images that they could capture. The WearCAM device was capable of capturing as many images as required for a variety of applications. Some simple software was developed for the system to allow capture of images automatically, either at regular intervals or on demand. The device was somewhat over-powered for its use as an imaging device. The cost of the main board was actually comparable to digital cameras of the time, yet its processing power for size and power consumption opened up all sorts of other interesting possibilities.
122
Chapter 4 Experiments with Wearable Computing in Field Archaeology
Figure 49 the original wearable (front), Battery and PSU (top left), Head mounted display (upper middle). The system is belt mounted in this case; the weight distribution is fairly even with the battery on one side and the computer on the other.
The WearCAM produced a great deal of interest in wearable computing, which it was thought, required more investigation. On the one hand, an extremely powerful ultra-mobile very rugged processing device, on the other, we have a demanding application that had exactly those requirements.
Moreover, data collection and dissemination in the field is a very useful and
universal concept.
Figure 50 Dr. Vince Gaffney, wearing the camera and belt mounted PC/104 based system; note the distribution of the weight around the belt.
Early work, such as that carried out in Rome, proved that it was possible to provide on body processing performance rivalling that of a desktop computer, and that it was both possible and
123
Chapter 4 Experiments with Wearable Computing in Field Archaeology entirely feasible to have an archaeologist wear this technology even on such a hot day. In addition, the hardware itself did not suffer any problems as a result of the heat. Some time later, the WearCAM was to be used as part of a ‘children as photographers experiment’. The children were taking part in an action adventure week camp in Osmington located on the South coast of England. On this camp, the children get to try abseiling, rock climbing and similar activities. The WearCAM was to be used in a similar fashion to the Rome fieldwork, simply taking pictures at regular intervals to provide a record of the children’s activities. Again the device was not doing anything more sophisticated than taking pictures, it did prove a useful insight into the use of such a device in a reasonably difficult context. The system needed to be unobtrusive and lightweight enough not to hinder the children. Here it had been shown that the weight of the device even when worn by a child, was still not a problem or major hindrance. The children were required to have both hands free due to the nature of the activities involved, and at no point did the hardware present a safety concern in that respect. Essentially the test was a success and provided an accurate recording of the activities of the children.
4.10.1 Early Wearable Problems The largest problem by far was the design of the casing from a safety point of view. The original casing was made from 22 gauge folded aluminium sheet, essentially a modified off-the-shelf project box. The sides of the box had sharp edges because it was essentially punched from a flat sheet. This is a safety hazard should someone fall awkwardly on the device, which is a real possibility in situations such as the ‘children as photographers’ project. The PSU and connections also gave problems, leading to reliability issues, and spontaneous rebooting of the system, which was somewhat intermittent and very difficult to trace. The University of Birmingham has some advanced technical workshop facilities, so using state-ofthe art CAD packages and some of the best technicians, and a little imagination; the system was redesigned to overcome most of these shortcomings. Table 10 shows some of the problems together with the solutions that were employed.
124
Chapter 4 Experiments with Wearable Computing in Field Archaeology
Problem PSU voltage drop problems between the regulator and the board. Enclosure had sharp edges and mechanical instability. High surface temperature after prolonged use. Intermittent connection problems. Thermal expansion problems related to the hard disk drive. Missing ports required for networking and USB connectivity.
Solution Integrated the PSU into the main chassis removing the need for cabling. Prototyped a casing machined from a solid block of aluminium. Increased the surface area and anodise it black to emit heat more efficiently. Replaced connectors with better ring-locking water and snag proof connectors. Use a gasket mounting for the drive to allow thermal expansion. Added the ports.
Table 10 Modifications to V2 to Chi-3 (V3), most other changes were cosmetic such as the art deco case design.
The original switched mode power supply unit (SMPSU) was a separate box taking an unregulated battery supply voltage input and supplying a stable regulated 5 Volts at up to 3 Amps for the wearable. The device is a high-speed switching supply to get high efficiency in the conversion process. However, the DC-link from the PSU to the WearCAM runs down a cable, and hence has some losses as well as emitting fields that can interfere with neighbouring radio systems, an Electromagnetic Compatibility Issue (EMC).
Given that the wearable needs very accurate
regulation, in the order of 5%, the DC-link and any bad connections are a potential point of failure and a major contribution to the reliability issues experienced in the ‘children as photographers’ trial. Perhaps the problems did not show on the Rome trial, because the connections were newer. Integrating the design into the housing of the Chi-3, eliminated these connectivity issues, resulting in better performance, lower loss, better cooling, lower electromagnetic emissions and far better reliability.
125
Chapter 4 Experiments with Wearable Computing in Field Archaeology
4.10.2 The Chi-3 Design
Figure 51 Original concept pencil drawing drawn October 2000 (left), Solid Edge CAD drawing – drawn much later (right), many features were kept from the original rough sketch.
It was thought that a well-designed wearable would be a worthwhile endeavour because many researchers in the area have used either a modified laptop, fitted in a backpack, or simply used ordinary laptops as their investigations and did not put emphasis on the hardware itself, but in the application. It was felt that the wearable was part of the application and that a solid platform would provide a research tool for other projects and investigations into wearable technologies at The University of Birmingham. Following this work, the design was indeed used by another researcher H. Bristow who made the Chi-3+, a specifically enhanced version to investigate context-sensing arrangements.
Figure 52 Machining the Chi-3 from a solid block, layer-by-layer on a CNC machine (left), a whole bin-liner full of swarf later – the finished Chi-3 wearable (right)
The CAD package allowed parts to be test fitted and manipulated well before anything was actually made. It is possible to see exactly what it will look like, minimising wastage and maximising workshop facilities (see Appendix E the CHI-3 Design on page 194).
126
Chapter 4 Experiments with Wearable Computing in Field Archaeology Machining the casing from a solid block using a CNC machine allows the casing to be made exactly as intended from the designs, see Figure 51.
Figure 53 the wearable revolution, evolution. (From left to right) – V1 first prototype Pentium 166MHz 32Mb RAM, V2 Pentium 266MHz 64Mb RAM, V3 (Chi-3) and V2 Comparison, Chi-3 under the bonnet, Finished Chi-3
When the new Chi-3 was completed, it had a faster core than the original WearCAM operating at 266 MHz. However, technology moving on in just the short time it took to develop the Chi-3, it was now possible to increase the core speed to 700MHz (260% increase) using a mobile Pentium 3, the memory to 256Mb (400% increase) and the Hard Disk up to 30Gb (500% increase). The justification for the increases was largely due to a new operating system Windows XP™ becoming available soon, and its little brother – Windows XP Embedded™ (XPe). Windows XP offers many advantages to ultra-mobile devices as it can suspend to disk using software, reducing start up times, and can support many more imaging and other attachments.
4.10.3 More Power Needs More Power The 700MHz main board, on average, does not consume much more power than the previous 266MHz board of the previous wearable design, however, because of the increased clock speeds, the transients can lead to more than the 3-Amp limit imposed by the original PSU. It was decided by measuring the current consumption of the newer PIII board that a PSU that could deliver up to 5A would be required. Increasing the power output of the original PSU was not an option because the switching device did not have the power handling capability, so a new design was required. For an increased output power, the input and output bypass capacitors would be experiencing a larger ripple current, the PCB tracks would need to be thicker and wider and the inductor would also need thicker windings. This inevitably means that the size of the overall unit would need to be increased but would still need to fit in the Chi-3 enclosure.
127
Chapter 4 Experiments with Wearable Computing in Field Archaeology
Figure 54 5A PSU house shaped to fit the original internal casing
A house shaped design allowed for this and provided a reasonably logical arrangement of components with the input on one side and the output on the other. Further advances were made by using three input and output capacitors in parallel, hence decreasing the ripple current through each to 33%, whilst decreasing their effective series resistance to 33% also (a desirable property), which allowed the overall design to remain small and much more reliable in the long run. Other advances included a tidy soft-start up which was controlled by an RC (resistor capacitor) network on the enable input. This allowed the input filter stage to settle before conversion takes place, which resulted in a much more stable system on start up with far less chance of the system failing to start. The differences in performance from the old 3A regulator to the newer 5A regulator were quite astonishing; the 5A system was easily capable of driving substantially more than 5A and was able to run with relatively low dropout characteristics, allowing less batteries to be used.
Figure 55 the 700MHz Chi-3 being worn, including the pointing device, HMD batteries and audio capabilities
Overall, the Chi-3 represented the solution to quite a few of the problems that were associated with its predecessor. The single biggest limitation of the current hardware is the single USB channel. The Chi-3 can support audio, wireless networking and imaging capabilities, but sadly it cannot cope with all of these at the same time because the USB is limited to 12 Mbit/s in total. There are however software workarounds that allow all the devices to be connected and to use each one at 128
Chapter 4 Experiments with Wearable Computing in Field Archaeology once. Adding wireless LAN capabilities to the Chi-3 is as simple as plugging in a USB wireless LAN device. With the wireless LAN in place, it was possible to use one of the wireless screens used on the Panasonic Toughbook. This allows the Chi-3 to be used with a HMD and a wireless display simultaneously, meaning the user can just pick up a tablet when required. It was thought that this would be useful and provides support for some of the annotation exercises (see section 5.6 on page 141).
4.10.4 Building a Wearable – Summary Building a wearable is an interesting exercise to undertake, because without this practical aspect, one would not be aware of all the bits of hardware and other projects that are being conducted around the world.
Figure 56 Tekgear all the accessories one needs for a wearable system [Tekgear]48
There are so many wearable system being made by individuals working alone as well as research institutions that there are companies like Tekgear49 (shown above) that specialise in wearable electronic products. In addition to off-the-shelf systems, they provide the low-level OEM (Original Equipment Manufacturer) parts such as the display module shown above. It is still better to develop the actual computer core in house such as the Chi-3 because then it is more suited to a particular application and is far easier to modify for the designer.
129
Chapter 4 Experiments with Wearable Computing in Field Archaeology The next chapter develops one of the key requirements identified from the field trials – the need to support freehand annotation and sketching out in the field. It discusses the design of a system to support such activities and evaluates it with a user trial.
130
Chapter 5 Annotation Systems
Chapter 5
Annotation Systems
131
Chapter 5 Annotation Systems
5.1 Introduction Sketching and annotation are a very important part of field archaeology. This has been observed on a number of archaeological sites and forms the basis for much of the subsequent interpretation and publishing. In 2001, a specifically organised workshop was held to discuss electronic field working (see Appendix A Electronic Archaeology Workshop January 2001 on page 187) and annotation was specifically identified as a basic requirement of any data collection system for archaeological use. Its usefulness stretches from the initial site survey right through to excavation and later when all the data has been collected, it can be used to help develop interpretations of the archaeological information. So what is annotation and why is it so important? an·no·ta·tion n. The act or process of furnishing critical commentary or explanatory notes. A critical or explanatory note; a commentary. \An`no*ta"tion\, n. A note, added by way of comment, or explanation; -usually in the plural; as, annotations on ancient authors, or on a word or a passage. n 1: a comment (usually added to a text); [syn: note, notation] 2: the act of adding notes [syn: annotating]
5.2 To Annotate Annotate comes from the Latin ‘to note down’ or a ‘note mark’ on something. Conventional paperbased documents are relatively easy to annotate. The simple underlining of a word in a passage changes the document by tagging that word with some importance, and distinguishing it from the rest. This might on its own be ambiguous, so annotations that are more comprehensive may take the form of little notes. To a student, annotations are a very important learning and study tool. Whilst trying to learn a complete chapter in a book (a daunting task), the student might add a line coming from a sentence and then add a little note. When it comes to revision time, the annotation will act as a memory aid, reminding the student of what they were thinking at the time. In fact, it could be said that annotations are important tools for making sense of complex information of any type – be it text, spreadsheets, mathematical equations etc.
132
Chapter 5 Annotation Systems The power of these little notes is further enhanced by them being placed in precisely the right place in a document. If the note is written on a separate document, it loses its potency. This means it is important to annotate the document directly and be able to write on it. Annotation is something that most people will have used at one stage or another, without any tuition and often without giving it a second thought; it just seems to be a natural thing to do. Maps and photos can also be annotated, but some people often prefer not to deface them permanently, perhaps opting just for a small mark on a map. In some cases, adding a mark on a map is the only way some people will find something again later. ‘X’ marks the spot. ‘Digital documents are superior in many ways to their paper counterparts. They are easier to edit, reproduce, distribute, and search than paper documents. While these advantages have led to the dominance of the digital format for document preparation, paper still provides much functionality that is simply unavailable via the digital medium. An important class of capabilities that exploit the special affordances of paper is annotation. By annotation, we include a large variety of creative manipulations by which the otherwise passive reader becomes actively engaged in a document. For non-recreational reading, active engagement with the materials is a key part of understanding.’- [Phelps 1997] Phelps argues that annotation of digital documents is largely unavailable, but recent touch screens have made flat panel screens that behave much more like paper, touch screens can be handled and manipulated using very similar actions to actual paper. So making the actual document behave more like paper is a software issue.
Importantly, Phelps states that for maximum benefit
annotations should behave like paper. So is it possible to have annotations that are intrinsically superior to their paper counterparts? There is no reason why annotations cannot be sorted, reproduced, edited and distributed just like the digital documents they belong to and thus it could be argued that digital annotation has the ability to be more powerful than the paper counterpart. ‘Annotation is a key means by which analysts record their interpretations of a particular document; in fact, annotation often acts as the mediating process between reading and writing. Analysts generally do not take notes by writing their observations down on a separate sheet of paper or in a text editor... Instead, they mark on the documents themselves. ... Post-Its ... highlight segments of text ... marginalia ... automatically marked text... These marking practices increase the value of the documents to the analysts and form the basis for their personal and shared files. ... Paper is a valuable medium for recording many types of annotations not readily recorded in a digital medium.’ – [Levy 1995] 133
Chapter 5 Annotation Systems Levy states that annotations increase the value of the document. Levy also argues that paper is a valuable medium, and digital counterparts have some way to go to match paper’s inherent convenience. Fortunately, digital paper is closer than it was in 1995. Annotation of digital documents depends largely on the content of the digital information. A widely used example of a system that provides annotation capabilities is Adobe Acrobat™ with its Portable Document Format (PDF). Adobe [Adobe]50 has become one of the most popular archival formats for the Internet, Datasheets, on-line journal catalogues and other large computer-based databases of documents. Acrobat can provide direct authoring support for new texts as well as old scanned texts and publications. Old textual information may be scanned into Adobe PDF Writer in a raster (bitmap) format, and can then be converted using a plug-in to create editable text. This process also allows the document to be archived in such a fashion that it can be searched in online databases. Newer documents are usually created digitally and subsequently can be exported directly and retain all of the source information and links. In order to be searched, the PDF needs to contain data in the form of text; a raster format is of no use because it is just a bitmap, which does not contain words. Thus, these types of documents cannot be searched for words unless they have been converted to an editable text format using an OCR (optical character recognition) package or similar. The Adobe Page Capture plug-in provides such a conversion capability for Adobe PDF. This is important because it is highly likely that old documents will be used on an archaeological investigation in the field such as old maps and documents and they are likely to be of more value if they could be searched in addition to browsing.
5.2.1
The Annotation Process
A classical annotation interface that most people will be familiar with may be adding notes in the margin of printed matter or underlining words. Often whilst demonstrating a concept, one will draw very rough sketches, and draw maps, routes or other information, marking only the important features (such as the name of a pub) on the route. This method could also be seen as an advanced concept. By only marking objects of importance, the person is consciously deciding what is most important, and creating a document with variable degrees of focus or resolution with enhanced regions of interest. Both Phelps and Levy argued that annotation was not available with digital medium. This is not quite true, or at least it is no longer true. Wolfe stated that some ‘annotation technologies can accept input from any combination of the following: keyboard (typed annotations), microphone (voice annotations), mouse or drawing tablet (freehand drawing), or stylus combined with a digital display device – such as the PalmPilot™ (freehand drawing on the primary text).’ - [Wolfe 2002] 134
Chapter 5 Annotation Systems This is true; however, image annotation opens up all sorts of interesting problems. One could just draw directly on the image, but contrast ratios and backgrounds may interfere with the readability of the text and the annotation need not necessarily be text; it could be a line or a cross. If the image is of a raster format (such as a bitmap) then the annotation would consist of bitmap image data too, and this is indistinguishable from the original image from the computers point of view unless it was stored on a separate layer. The Wroxeter trial showed that the annotation should be kept separate from the original photograph, and this would enable multiple annotations for each photograph, which is a clear benefit. The problem comes about from how the annotation is stored. If it is just a scribbling then it has little meaning to a database and would be difficult to search for, without complex pattern matching techniques. IBM’s QUBIC (Query By Image Content) system might be able to take a rough marking and try to pattern match the annotation with a large database of images as described by Flickner et al in 1995 [Flickner 1995]. However, the annotations are much easier to search for if a combination of marks are related to textual descriptions. There are a number of ways to achieve this.
5.2.2
Computer Images
Text is very easy to search in a computer program; all that is required is a 100% correlation between two text strings. It is also possible to have close matches, i.e. less than 100% but digital images are very different. It is not possible to perform a text search or matching exercise and it is very computationally difficult to scan the image for recognisable content. Computers are just not very good at recognising objects in images unless they know specifically what they are searching for. Perhaps people are so good, because we have years of knowledge, with many little bits of information about the world around us that we can make 3D sense of 2D images. The ‘QBIC System’ is able to match similar content but it does not understand the content of an image. With the hundreds of obscure images of the ground that will invariably be generated on an archaeological site, even a non-specialist human analyst is unlikely to be able to recognise features. Simple queries could be executed on a large group of images to find images that are all similar, all green or all have square objects for example. Undoubtedly, this has some benefit but is best suited to looking for simple things in large databases of images of perhaps more obvious subjects. This is interesting but only of limited use to our archaeologists, at least until the technology improves to the point that free-text searches can be used with a higher degree of specificity such as “Find me all the pictures that contain that stone and that tree” or “show me all the pictures of that trench taken from over there”.
135
Chapter 5 Annotation Systems This kind of search is possible, provided that the images contain enough metadata. That is, descriptions about the image, or data about the data.
Figure 57 Image Metadata included in some JPEG images
Some descriptors are automatically provided these days by a digital camera (see Figure 57) and other image sources. In this example the make and model of the camera is recorded as well as various camera settings, but it does not include at least automatically, the content of the image. For completeness, this kind of metadata is supported in Windows XP, but earlier operating systems and painting or graphics packages will lose the metadata as soon as any changes are made to the image and it is re-saved.
5.2.3
Image Annotation
A more structured approach to generating the annotations ought to help in the dissemination of the data at a later stage. Like anything else, it is best if the annotations are captured regularly and only when necessary. Belated annotation of images is likely to result in some loss of information as the archaeologist may have forgotten some items. This is where digital annotation has a distinct advantage because it can be done in real-time on site and whilst the subject matter is actually present. Image annotation opens up other difficulties such as how to attach the actual meaning or notes to certain objects in a picture, sketch, map or drawing.
Whittington proposed a measure of
‘granularity’ as one of 12 measures he used for the comparison of text or web based annotation systems [Whittington 1996]. This concept of granularity basically identifies how localised an 136
Chapter 5 Annotation Systems annotation can be. In some systems for annotation, the users can only add notes that relate to the whole document, making it course grain, such as the image metadata described earlier. On the other hand, for text, some allow annotations to be inserted anywhere, even between words; such systems are said to be fine grained. This concept was initially applied to text-based systems, but it makes sense to apply it to images too. Arguably, a fine-grained system is superior to a course grained system, although some properties of an image may be global to the whole image. The metadata contained in Figure 57 on page 136 clearly relates to the entire image; if the metadata had said, ‘Top fuelled Dragster’ which is what only part of the actual picture contains; that information would only relate to a small portion of the image. In this case, there is a requirement for the image to contain information about objects in the scene in addition to information that relates to the whole image. Images are not constrained to the domain of photographs captured via a camera.
Our
archaeologist’s maps are vitally important and these can also be annotated in the same way. Thus by sketching or adding text, the user can furnish the map with newly discovered information or even test out theories they might have regarding some of the archaeological interpretation. It is quite clear that whilst wearable imaging is a very worthwhile application, it is the real-time annotation aspect that provide added value for in-field systems. There is some limited support already for basic in-field annotation. One could use existing software such as Adobe Acrobat™ for example. An image, particularly a photograph, is a two dimensional representation of a three dimensional world. Consequently, objects in the foreground can conceal other objects. This makes annotation of real-world scenes difficult from a single perspective. Tasks such as drawing a circle round an object can be difficult if it is wholly or partially obscured behind another object. Presumably, there needs to be a distinction between multiple objects in an image, which of course, is the whole point of annotation, but what can be done for overlapping objects? For an annotation experiment - the ‘bean experiment’, (see section 5.6 on page 141) there are a number of object types that need to be recorded. Some of which are placed behind others. Archaeological sites are often known as ‘digs’, if for no other reason than they are often seen to be continually excavating a scene. Generally, the further down the site is excavated, the further back in time the artefacts become. Therefore, the annotations could represent a temporal separation, with their 2D spatial relationships preserved. Each layer could represent a different chronological period such as 100 years per layer.
137
Chapter 5 Annotation Systems The layered approach also lends itself quite neatly to identifying different classes of contexts. So all pottery finds could be on a layer only for pottery, metal on another and so on. The advantage of this is that it makes later dissemination of the finds very much easier to process. Composite sketches of finds could be made from the layers; also, the layers would also make accessing a database of finds easier. For example, an archaeologist would then be able to run a query that would allow them to pick out the locations and orientations of all pottery finds on a particular site to get an overall distribution. This task would be time-consuming using traditional methods, but electronically it would be very quick especially if all the pottery finds were located on their own unique layer.
5.3 Digital Annotation of Image Data Annotation of images can be a time consuming and fiddly job. Previously, it has been shown that there are clearly problems associated with trying to attach textual data to an image. Firstly, the data are in different formats, so the text would need to come as an extension to the image data, and therein lies a problem with disassociating the image with the text, should the image be postprocessed. Secondly, it was said that image data does not really make sense to a computer with current technology because they lack the necessary understanding of what we call ‘the real world’ therefore unless very specific information is provided and sought, a computer cannot make sense of it. In the Wroxeter field trial, some data was captured automatically, some was entered by hand and some was missed off altogether. Archaeology has a requirement for lots of different types of image annotation, from field walks and general landscape archaeology, to the very large detail of excavation and plan-view sectioning, which is often used and vastly dependant on the site.
5.4 Basic Annotation So what does the annotation of an image entail? One form of image annotation might be to add text to it. This would increase the meaning of the image by tagging or explaining a captured object that might otherwise be indistinguishable from the rest of the image. Nevertheless, simply adding text still requires some form of marker to where that text belongs in the image.
A typical
annotation might be to ring an object on a photograph or map with a pen. This allows others to see straight away the point of interest. Pushing pins into a map is also a good way to mark a point of interest. The problem is that many annotations added to a photograph would quickly lead to overcrowding. Previous studies have included investigations into how to get labels to fit random in an efficient 138
Chapter 5 Annotation Systems way have been conducted in the past by cartographers (map producers).
Such methods are
discussed by Imhof and others [Imhof 1975]. Simply put, a name for a feature such as a road has to follow some basic rules to avoid confusion. For example, the label needs to be added close to the road, perhaps running along it, but cannot cross other names or be upside down etc. This turns out to be a non-trivial task; the problem was recently revisited with studies dealing with mapping the internet – a structure of unimaginable complexity, which is constantly changing, a map that arguably has little meaning [Dodge 2001]. Fitting labels on to a map or image has maximal benefits whilst trying to gain an overview of a situation, but rapidly runs into difficulties when the number of annotations becomes too large for a given image size. Far better then to have some sort of dynamic detail control. This means that one can see more and more at increasing magnification levels. Microsoft Autoroute™ (a computer mapping application for navigation use) is a good example of this. With the map of the entire UK, it would be pointless to include the name of every street at once, unless there is a chance that it is of any use or readable. This works simply by having different nested levels of naming. When zoomed out, only major towns are visible, zoom in and perhaps more towns appear and so on. At full magnification, all the information is visible. A good example of a freely available image annotation package for large groups of photos is that of Photofinder developed at the University of Maryland Human Computer Interaction Laboratory, which started out to identify people in pictures [Kang & Shneiderman 2000]. Using a large database system, they introduced a method they called ‘Direct Annotation’. This is effectively the same as using a pushpin (thumbtack) on a photograph to identify someone. The database contains a large table of people’s names, from which the annotations can be added to the image using a ‘drag-and-drop’ approach. This produces a signpost over the head of a person in a photo. The annotations can be hidden. A single annotation could be isolated, but this does not appear to be an option. The advantages of using Photofinder are:
139
Chapter 5 Annotation Systems 1. Large amounts of images are more manageable, because the annotations can be searched. 2. Drag-and-Drop Interface means that text does not need to be entered which could be useful in a field when direct text entry is quite difficult. 3. Allows annotations to be hidden. Its disadvantages include: 1. Only allows objects to be pinned with a name, no other text or data can be attached. 2. No option to single out annotations. 3. Instability problems – seems quite dated now, but development is said to be continuing. 4. Requires huge desktop real estate. 5. No detail selection control. 6. Cannot draw or sketch objects like the river in the Wroxeter field trial.
Figure 58 Photofinder from the University of Maryland [Kang & Shneiderman 2000]
No detail control can often mean an overload of overlaid information on the image. To be readable, the text has to be larger than a minimum size and if confined, it has to be small. There is only a finite amount of text that will fit. Moreover, the text will obscure the background image significantly. How much the image is obscured together with how much it actually matters are questions that are specific to the image under annotation. Whilst Photofinder is a useful project and has some interesting uses, it does not allow the freehand annotation, such as the requirement to add a river to a map or to draw round an object in a photograph; however, it is one of the closest fits to the requirements.
140
Chapter 5 Annotation Systems
5.5
Archaeological Annotation Imaging Requirements o Real time in field capture system. o Direct image capture capabilities. o Free hand annotation by way of drawing specific features. o Landscape Scenes e.g. earthworks. o Map annotation. o Scale drawing annotation. o Plan views. o Integration of other image data such as geophysics. o Collaborative imaging working with other units. o GIS overlay capabilities. o Stitching together multiple images.
A layered approach to annotations appears to be a very powerful concept, one which should allow a much greater complexity to be handled without overloading the user with a huge web of unreadable text or scribbles obscuring the image. Pushpins are a useful way to annotate precise objects, however, in the Wroxeter field trial; the annotation of a river flowing through the scene was shown in the illustration (see Figure 46 on page 119), but would not be possible using pushpins. Therefore, free hand annotation and sketching would be a great way to allow this.
5.6 Digital Site Annotation Example – One Metre Squares Annotation of various scenes was seen as a key application for field archaeologists, and for the first time, it should be possible to do it in real-time. There are many other situations where being able to annotate real-time images and share them with others, perhaps remotely would be of enormous benefit. One feels that quite complex information can be conveyed in this way perhaps helping assist people who are performing tasks remotely. One of the time consuming jobs on an archaeological site often includes the scale drawing of areas of the site. Drawings are often used in place of photographs because it gives the archaeologist more active control over what is to be recorded. Sections, plans and artefacts are often drawn by hand and on site. The annotation study is primarily concerned with the sketching of 1m squares on the ground, but it could easily extended to draw sections if required.
141
Chapter 5 Annotation Systems
Figure 59 Site Grid Layout, 1m square sectors [Drewett 1999] pp109
Drewett’s field archaeology book provides a suitable reference for how this work is usually carried out [Drewett 1999]. “The area to be recorded is” divided “into 1m squares with string and nails” [Drewett 1999 pp134]. The square location is carefully recorded. The drawing normally consists of a one metre square that is divided up into ten or twenty centimetre sections using string. Finally, the drawing can take place; this is done ‘by eye’ and to scale on a drawing board. Typically, the drawing is 1:10 scale. “Plans should ideally be drawn with north at the top” or otherwise clearly indicated.
Figure 60 an example of a unit metre (1m) drawing frame [Drewett 1999 pp135]
142
Chapter 5 Annotation Systems “Individual stones should be drawn, not just blocks of masonry. Different types of stones used in a wall or elsewhere can be recorded with different coloured pencils. Slopes, however, like a ditch edge, require conventions. Sloped are usually illustrated by using hachure.” [Drewett 1999 pp134]. The level of detail recorded is often left up to the discretion of the archaeologists involved. The process is undertaken ‘by eye’. This means that the location of individual contexts are an estimate. When a particular plan drawing attains a certain level of complexity, it will become very difficult to isolate items of interest, just as any other image with too many annotations. So different colours can be used to help. In addition, using multiple layers of transparencies can help with keeping types of contexts together. A multi-layered approach like this enables better querying and filtering of the database at a later stage. The multilayered approach makes for a powerful tool as it allows different information to be displayed depending on the requirements for the current work, as well as composite (more than one layer) to be easily displayed on demand.
5.6.1
Digital Site Annotation Software Prototype
Following the Wroxeter trials it was decided to create an application specifically for digital site annotation, using as many of the lessons learned from field trials and the recent study of field working methods as possible. It was originally envisaged to have a 1m x 1m scene with objects, such as beans (hence, – Thebean project name) etc. To replace the traditional paper approaches with and a new software approach.
5.7 Annotation Design – Archaeological Consultation & Previous Work The Wroxeter field trial demonstrated the difficulty involved with attaching meaning to an object in the scene. This was overcome by creating a new image for each object of interest in the scene. Therefore, for a river scene, there would be a picture showing the river, one showing the bank etc. The annotation consisted purely of a single piece of text attached to the image. Unfortunately, the annotation or scribble becomes part of the image and obscures background features. Here, with the bean study, the annotations would need to be kept separate. One should be able to take a picture and draw upon it as if it were a piece of paper. It was shown earlier that it seems that annotation works best when it behaves most like a piece of paper. So with the closest form of digital paper (a flat panel touch screen), it was thought that one could reap the best of both worlds – the convenience of traditional paper, with the power and benefits that digital documents allow.
143
Chapter 5 Annotation Systems
5.7.1
Interface – Touch Screen
The Wroxeter field trial used a 21cm (8.4”) trans-reflective wireless touch screen. The video information at 800x600 pixels, 8-bit colour depth, was sent over a wireless IEEE802.11b connection. This meant that the screen update was quite sluggish, because it does not make use of the later remote terminal protocol that Windows XP uses for its newer Smart Displays. This made drawing on the display slow and instead of nice rounded features, the display tended to produce straight lines between sample points instead. The preview window for the live video image was problematic, reproducing poor colour and very slow updates; again this was because of the colour depth, protocol and bandwidth issues. The video cannot use lossy compression because it is a digital display, unlike video that only needs to be an approximation. This display issue can be partially resolved by using a digital panel that is directly attached to the host PC, or by using a faster wireless link. Technical aspects aside, the screen offered a practical and reasonable working area of 21cm (8.4”) diagonally, about the same size as an A5 sheet of paper in landscape orientation. The screen was a thin client, meaning that it does not contain any processing power, keeping it lightweight. In Wroxeter, the students did not have any problem adjusting to the touch screen at all. Something very similar was chosen for the bean project.
5.7.2
Annotation by Layers
Annotation by layers is a powerful concept, for a number of reasons. It immediately gets round problems of too much information and overcrowding on an annotated source image by allowing control of what is displayed on which layer. It does, however, require that the annotations are kept separate from the image. Therefore, they must be stored in separate a memory or file to the image and displayed as an overlay on demand. For this trial, the images were stored as standard JPEG compressed images, whilst the annotations were stored in a separate text-based file. The header of the file contained the annotations so that the whole file does not need to be parsed for search purposes. Below the annotations in the file, is the data containing the annotation vectors. Each vector can be split into multiple vectors, so that multiple objects such as stones or coins of the same type can be individually marked, yet be part of the same layer of annotation. Annotations can then be drawn on an overlay and turned on and off as required.
144
Chapter 5 Annotation Systems
Figure 61 Three different layers of annotations, the coins are separate vectors but are part of the same layer
5.7.3
Modes of Display and Interaction
The idea of trying to label an image with text directly has many problems, not least for ensuring the non-overlap or crowding issues are avoided as discussed earlier for cartography. Instead, using a different colour for annotation of each layer in addition to a number helps to keep the meaning of the layer apparent as well as ensuring that the image does not become too overcrowded. The text description does not appear on the sketch at all. Automatic display of text annotations was thought to be a good idea, because the annotations will appear on the image only when the mouse is pointing to specific portions that are annotated.
In this way, the detail follows the focus.
Annotated areas would be shown as annotated by a colour or line, but individual texts or other attachments would not be shown unless specifically selected (see Figure 62). This was designed to work similar to the ‘tool tip’ text concept used frequently in Microsoft Windows™ applications.
Figure 62 Right clicking within ten pixels of an annotation will display the annotation text even if the annotation is hidden.
This worked well on a desktop PC but right clicking was tricky with the passive touch screen provided on the Panasonic Toughbook hardware. Fortunately, newer active touch screens such as those found on the tablet PC’s work even better. Unfortunately these were introduced after the work on this project was completed.
145
Chapter 5 Annotation Systems
5.8 Experimental Time Saving Features – Geo-Rectification If a wearable computer were always to be available on site (ubiquitous), it would make sense to make use of its enormous capacity for completing computationally intensive tasks in addition to providing infield communication and data handling support. One of the problems with many of the technologies currently used in the field is a lack of integration. So in addition to the annotation used by the bean study, further automatic enhancements were included in the annotation software. On an archaeological site, many methods can be used to fit images to a known baseline. Typically, when the archaeologists arrive back at base they are able to stretch photographs, Geophysics and maps to fit to the same scale. The bean provides the ability to sketch plan views by annotating geo-rectified ground images taken in the field. In addition, the software will allow also the annotation of any image or map. The images can then be queried by the annotation content. It was found that this could really be a very powerful tool for a range of uses, not least limited to archaeological studies. Other uses could include vehicle accident investigation and forensic crime scene recording for example. The georectification engine allowed the user to take a digital picture of the ground such as that shown in Figure 63, and create an overhead view as illustrated in Figure 64.
Figure 63 Simple ground photo taken with a digital camera. (From Forum Novum – The Rome Trial)
It should be noted that it was not normal for such an oblique photo to be used for anything more than just a general impression or overview of a site. However, it was clear with the correct transform that even this image could be converted into a geometrically accurate image. Georectification is not a new concept but is reasonably simple to implement. The geo-rectification engine and techniques can be used to fit any square data to a known square baseline.
146
Chapter 5 Annotation Systems
Figure 64 Actual geo-rectified destination image produced from the source image.
The geo-annotation system was subject to trials and compared with a group of people using traditional pen and paper to draw a range of artefacts from a metre drawing square such as that shown in Figure 64. It has to be stressed that the geo-rectified image was intended to construct a tracing image on which the users could draw their own interpretation of the objects in the square metre. It was found that the rectification worked well enough and the objects could actually be measured from the georectified image with reasonable accuracy (Parallax effects permitting).
5.8.1
Finite Element Methods
The source image exhibits a number of distortions from an image taken from directly above the subject. Indeed, even an image taken from directly above (the normal) would exhibit distortions that would depend on the camera lens, such as barrelling. Barrelling is a distortion that causes square objects to bulge; the effect increases with distance from the centre of the photo and is dependent on the lens used. This effect can be minimised using a good quality lens with an appropriate focal length. A fish-eye lens gives an extreme example of barrelling where straight objects near the edge of the photo become distorted. Cameras will often have this effect to some extent, but it will not normally be that noticeable, but is still relevant if measurements are to be carried out from photographic evidence. As the angle becomes more oblique, the effects of perspective will increase. For the one-metre square, the sides will appear narrower in the background than they do in the foreground. The sides and all other objects tend linearly to a ‘disappearing point’ in the distance. The perspective distortion also has another distance related effect that means that a straightforward linear ‘stretching’ transform does not work. In addition to perspective, the image will invariably contain skew and rotation caused by imperfections in the user’s alignment with the subject.
147
Chapter 5 Annotation Systems
5.8.2
The Linear Transformation
Figure 65 Perspective and its effects
If one was to use a linear transform, perspective remains a problem. Figure 65 shows that the effects of the vertical lines in the source image have been corrected. Using a simple linear transform shows clearly that the coin in the background of the test image appears vertically shorter than the one in the foreground. The horizontal lines are straight but not evenly spaced. Note also that there is also a small barrelling effect that can be seen in the source (left) image, which manifests itself as very slightly curved lines. The transformation used here was a linear interpolation using the four corner points and transforming the mesh onto a square 640x640 pixel destination image.
5.8.3
Quadratic Transformation
A curvilinear transformation of the image can be performed using quadratic interpolation techniques from the finite element method, details of which can be found in Zienkiewicz’s finite element methods reference book [Zienkiewicz 1989]. The theory behind the transform is quite straightforward, the shape functions can be derived or used directly as shown. The template is taken to occupy the unit square from (0,0) to (1,1) in a coordinate system (ξ , η) , and scaled accordingly. Thus, if the rectified template image has dimensions w × h pixels,
ξ = i ( w − 1) , η = j (h − 1) , where (i , j ) are the pixel coordinates.
148
Chapter 5 Annotation Systems
K2
K1
K3
i j K4
K8
K7
K6
K5
Figure 66 Destination Image (square)
One is aiming for is a mesh transformation to stretch the distorted square in the source image to the square output image. This is valid because we know that the photograph is of a metre square. A quadratic function is valid because of an inverse square relationship between the apparent size of objects and their distance from the observer.
A quadratic template function can be generated
provided that we know the centre points of the square sides. This makes sense on inspection because just knowing the corners would not allow for the perspective effects. It would be possible to simplify the system further by using only two of the mid side points as the linear transform works fine in the other plane. However, skew and alignment effects would be exaggerated. In the original image, the eight positions of the corners and mid-sides of the template are determined as ( x k , y k ) , for k = 1,2,..,8 , numbering the points in a clockwise direction starting from the corner corresponding to (ξ , η) = (0,0) .
x y
K1
K2
K4
K8
K7
K3
K6
K5
Figure 67 Source Image with numbering points
The transformation from rectified (ξ , η) to original ( x , y ) coordinates is performed using the interpolation, so for each pixel we need to calculate the weighted sum of the contributions from all of our corner and midpoints (k) the x coordinate is obtained thus: 149
Chapter 5 Annotation Systems 8
x=
∑N
k (ξ , η) x k
k =1
(1)
With a similar equation for y. The individual ‘shape functions’ (Nk) are given by:
N 1 (ξ , η) = (1 − ξ )(1 − η)(1 − 2ξ − 2η)
(2a)
N 2 (ξ , η) = 4ξ (1 − ξ )(1 − η)
(2b)
N 3 (ξ , η) = ξ (1 − η)( −1 + 2ξ − 2η)
(2c)
N 4 (ξ , η) = 4ξη(1 − η)
(2d)
N 5 (ξ , η) = ξη( −3 + 2ξ + 2η)
(2e)
with N 6 , N 7 , N 8 obtained from N 4 , N 3 , N 2 respectively by interchanging ξ and η These are worked out from the eight reference points (k). Thus, for each pixel in the rectified image, we can calculate the values for the shape functions and sum their weights together as shown in equation 1.
Figure 68 Quadratic transform yields better results
The transform engine is very robust and it can be shown that simply reversing the order of the points will reflect the image, rotating the points will rotate the image, choosing points inside the image will zoom the image and choosing random points yields some very interesting results particularly when photographs of people are concerned. With some practice the function can be used to geo-rectify a number of objects. Buildings photographed from the ground can be georectified to get a square-on photograph. Sections (the sides of a trench) can be photographed from the top resulting in a photograph of the section that is impossible to obtain any other way because the apparent observing point would be inside the opposing wall. In addition, since there are now 150
Chapter 5 Annotation Systems eight reference points, barrelling is vastly reduced if the centre of the reference square is close to the centre of the source image.
5.8.4 Limitations The process itself is sensitive to height fluctuations. For flat subjects, the resultant image is correct. However, different spot heights will experience a distortion in proportion to their heights. The cause of this effect is the result of the image being taken from the side. This ‘Parallax’ effect cannot easily be corrected with this simple transform and must be taken into account when using the resultant images. Sometimes the resultant image does not look natural because one can see the side of objects, which would not normally be possible from directly above; see the coins.
5.8.5 Geo-rectification Summary For a given source image, a reference square with eight points is required in order to satisfy the geo-rectification algorithm. These eight points allow the shape functions to be calculated, and then the source pixel can be calculated from the weighted sum of each of these shape functions. The eight points on the source image can be located by using a one metre square frame placed on the ground, something that is already present on archaeological sites. This process is to be performed on-site and can be done by simply taking a photograph of the frame using a digital camera and then identifying the eight points manually by pointing to them on the touch screen. The software then has the information it needs to produce the plan view. This program was prototyped in Microsoft’s Visual Basic, because it allows such rapid prototyping and easy access to imaging devices. Future possibilities for the software could include automatic location of the eight points by making them bright blue for example. Taking many photographs of a site, of neighbouring cells (squares) and trying to fit them together would normally lead to errors that would soon accumulate over distances and create significant errors. However, if each square is geo-rectified then these errors will no longer accumulate, as each square is square. In this case, the application of this algorithm is to create a large database of one-metre surveys and to allow them to be stitched together, allowing the data to be displayed spatially in a variety of ways.
151
Chapter 5 Annotation Systems
5.9 Archaeological Assistant Image Annotation Performance Study
Figure 69 1m Square Mock Test Rig
The purpose of geo-annotation exercise is to investigate the relative performance of traditional field working practises with those of a computerised system. On an archaeological site, an area of interest, perhaps for excavation is often divided up into 1 metre squares. Typically, each individual square is then drawn by hand onto a scale drawing. Different objects such as bones, coins and pottery can all be used to make up a composite drawing. In some cases, it is very important to record the locations of objects accurately because excavation by its very nature is destructive and the information is lost if it is not accurately recorded. Combining the two requirements for this task gave rise to novel annotation software that can be used in a variety of ways.
5.9.1
Annotation Trial Description
In this trial, a user is required to take a photograph of the square metre. The software automatically takes a digital photograph of the square and using a process called geo-rectification, creates a plan view of the square. The intention is to create a geometrically accurate tracing image on top of which the objects can be drawn by hand using a computer touch screen. This means that the user does not need to perform any measurements, and can simply draw round an object of interest. The annotation software maintains the original plan view and stores each type of object on a separate layer. The touch screen interface is intended to allow drawing to feel quite natural. It was also found that the more like paper it is the better the annotation and sketching is likely to work.
152
Chapter 5 Annotation Systems
5.9.2
Experimental Procedure
Figure 70 Actual Hand Drawn Sketch
To investigate the performance of the computerised system, two measurements were made in order to make an evaluation, the time taken to make a drawing and the accuracy of the resultant drawing. The users who were involved in the system were then split into two groups. One group was asked to create a drawing manually – (the manual paper method). The other group was asked to perform a similar task on the computer system. Eighteen undergraduate students took part in this study (mean age 22 years; 15 male and 3 female). Participation was for course credits on a first-year ‘Interactive Systems’ degree. Participants were allocated to condition on presentation to the experimental laboratory, with the proviso that conditions alternated in order to minimise possible order confounds.
5.9.3
The Manual System
A scale drawing is normally made of the square metre by hand. This traditionally involves having a pre-drawn grid and clear acetate sheets on which to draw each of the three layers, in this case – pottery, coins and bone.
This arrangement was used for the manual paper condition.
The
participants were then asked to draw a representation of the archaeological test site on the acetate using a different colour for each layer and to draw it as they see it. They were then timed, without their knowledge. There were not given any more information exactly how to draw the sketch. This was left up to the discretion of the participant.
153
Chapter 5 Annotation Systems
5.9.4
The Computer Assisted System
Figure 71 the Assisted Drawing
The computer-assisted drawing involved more steps. Firstly, the participants were required to use the attached digital camera to take a photo of the square to be drawn. Then they had to choose an option to geo-rectify the image. After which they had to manually show the corner and centre points, eight in total for the grid. The computer then created a plan view for them to draw on. They were then asked to draw each layer in exactly the same way as the manual group, but instead of using different sheets of acetate, they simply had to add another layer to the drawing using the software. They were also timed for the complete task with a standard stopwatch. To measure the accuracy, the drawing was split up into the 34 objects it contains, numbered 1 through to 34. The outlines for these objects were taken to be the perimeter of the objects. A reference drawing was then carefully constructed using the photograph taken in Figure 69 and carefully measured. The drawings for each participant whether manual or computer generated were then overlaid, and the maximum displacement of any part of an object was measured for each object and recorded in centimetres. This process was intensive, and only produces an estimate. There are other ways to measure accuracy such as the centre of the object, size or RMS to name but a few. However, these are difficult to calculate on a hand drawn picture, and would have been prohibitively time consuming with little consequence to the significance of the results.
5.9.5
Annotation Trial Results
The results were encouraging for both the time taken to complete the task, and the accuracy gained in the task.
154
Chapter 5 Annotation Systems Time
Mean task time (s)
10 8 6 4 2 0 Manual
Computer
Figure 72 Mean Task Time Comparisons
Participants using the paper took an average 7.86 (± 2.76) minutes to complete the task compared with an average 4.57 (± 0.78) minutes for the device condition. A Mann-Whitney test showed that the results are significant (z = 3.005; p


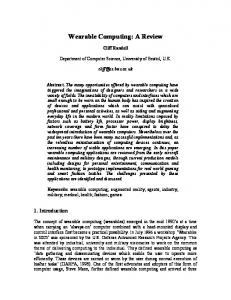
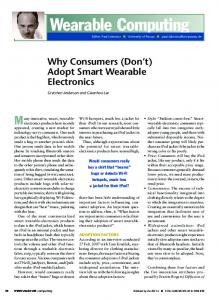

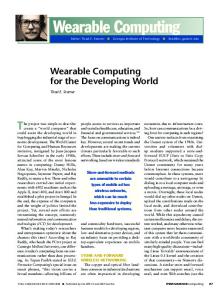


![Human-powered wearable computing [PDF]](https://m.moam.info/img/260x300/human-powered-wearable-computing-pdf_6492e0e2098a9e634c8b45eb.jpg)


