stress studies obtained with these methods were compared to the values from the .... To apply the ICA model to cardiac P
This article has been accepted for publication in a future issue of this journal, but has not been fully edited. Content may change prior to final publication.
1
ICA Based Automatic Segmentation of Dynamic H215O Cardiac PET Images Margarita Magadán-Méndez, Anu Juslin, Sergey V. Nesterov, Kari Kalliokoski, Juhani Knuuti, Ulla Ruotsalainen
Abstract— In this study, we applied an iterative Independent Component Analysis (ICA) method for the separation of cardiac tissue components (myocardium, right, and left ventricle) from dynamic positron emission tomography (PET) images. Previous phantom and animal studies have shown that ICA separation extracts the cardiac structures accurately. Our goal in this study was to investigate the methodology with human studies. The ICA separated cardiac structures were used to calculate the myocardial perfusion in two different cases: 1) the regions of interest were drawn manually on the ICA separated component images and 2) the volumes of interest were automatically segmented from the component images. For the whole myocardium, the perfusion values of 25 rest and 6 drug-induced stress studies obtained with these methods were compared to the values from the manually drawn regions of interest on differential images. The separation of the rest and stress studies using ICA-based methods was successful in all cases. The visualization of the cardiac structures from H215O PET studies was improved with the ICA separation. Also the automatic segmentation of the volumes of interest seemed to be feasible. Terms— Image segmentation, Component Analysis, MBF.
Index
P
Independent
I. INTRODUCTION
Emission Tomography (PET) H215O imaging offers the possibility to quantitatively estimate myocardial perfusion, one of the most important functional parameters of the heart. H215O is an ideal perfusion tracer, because it is freely diffusible, its kinetics is independent of changes in myocardial metabolism, and it has a short half-life, allowing sequential measurements with a low patient dose. Analysis of OSITRON
Manuscript received August 28, 2007. This work was supported by TEKES Drug 2000 technology program, Tampere Graduate School of Information Sciences and Engineering (TISE), Graduate School of Tampere University of Technology and the Academy of Finland, project No. 213462 (Finnish Centre of Excellence program (2006 - 2011). Margarita Magadán-Méndez. is with Tampere University of Technology, Institute of Signal Processing, P.O. Box 553, 33101 Tampere, Finland. Tel: (+358)3115 4347. Fax: (+358)3115 3087, email:
[email protected] Anu Juslin and Ulla Ruotsalainen are with the Tampere University of Technology, Institute of Signal Processing. Sergey V. Nesterov, Kari Kalliokoski and Juhani Knuuti are with the Turku PET Centre, University of Turku, Turku, Finland. Sergey V. Nesterov is also with the I.M. Sechenov Institute of Evolutionary Physiology and Biochemistry, RAS, St. Petersburg, Russian Federation.
studies performed using H215O PET is, however, a challenging task. Since the tracer is freely diffusible, the radioactivity uptake is distributed evenly in the cardiac region and blood so that the contrast of the raw PET images is low and, therefore, it is difficult to identify different tissue structures. In addition, various noise sources from acquisition to image reconstruction affect the data: partial volume effect (limited acquisition resolution), spill-over (radioactivity contamination phenomenon produced by strong surrounding radioactivity sources), cardiac motion, respiratory and potential patient movement, as well as the inherent noise that any reconstruction method entails. All the above mentioned effects produce blurred PET images, making any analysis difficult. The quantification of myocardial perfusion requires measurements of the time activity curves (TACs) from the left ventricular cavity and the myocardial tissue. The TAC is calculated from a defined region of interest (ROI) in the corresponding tissue. To ensure true perfusion values, accurate definition of the ROIs is needed. Traditionally, the ROIs have been manually drawn on the differential images. The differential images have been constructed by the subtraction of the first time-frame images from the last timeframe images to enhance the contrast of the myocardium. An average position of the tissues is provided by the differential images. The criteria for choosing the frames and for drawing the ROIs are subjective and lack uniqueness. To improve the analysis of H215O PET images, computer-based techniques have been developed. In our earlier phantom studies, we have shown that with independent component analysis ICA [1] the segmented volumes of the cardiac structures correspond well the simulated volumes and positions of these structures [2,3,4]. The ICA separation was tested with various levels of simulated noise and movement. We have also made preliminary tests with ICA on healthy volunteer data [3]. Earlier, ICA has been applied and evaluated in H215O cardiac PET dog studies [5, 6]. In these studies fixed thresholds were used to define the left ventricle TAC. In human studies, ICA has been used with manually drawn ROIs [7]. In this study, our aim was to investigate the use of the ICA method for human data and improve the suitability of the method for drug development and possible clinical use. We were interested if more accurate separation of the tissues would have an effect
Copyright (c) 2007 IEEE. Personal use of this material is permitted. Authorized licensed use limited to: Chang Gung University. Downloaded on June 23, 2009 at 09:22 from IEEE Xplore. Restrictions apply.
This article has been accepted for publication in a future issue of this journal, but has not been fully edited. Content may change prior to final publication.
2 on the quantitative blood flow values of the whole myocardium. Using ICA for real human data, the main problems are optimization of the initialization and reproducibility of the results. The ICA maximizes a cost function, and the maximization depends on its initialization. With changing initialization we can obtain different separation results, not all of which are optimal. To improve the reliability and reproducibility of the separation results, in this study we used an iterative process to calculate ICA. Instead of calculating ICA once with fixed initialization, we calculated it several times with different initial settings using ICASSO software [8]. From these results it was possible to select the best separation result of each component for further analysis. In this way, the visualization of the right and left ventricle and myocardium becomes reliable. We also present a novel automatic method to segment volumes of interest (VOIs) from the separated component images for the left ventricle and whole myocardium. The VOI selection was based on the calculation of the most statistically representative tissue elements from the ICA separation results of the left ventricle and myocardium (voxels with higher probabilities of belonging to the tissue component), individually, for every case. We tested the proposed methods with 25 rest cases and six adenosine-induced stress cases. The result of the automatic VOI method was compared to the conventional manual method by calculating the myocardial perfusion using the same compartment model. In addition, we compared the perfusion values from the manually drawn ROIs both on the ICA separated component images and on the differential images. II. MATERIALS AND METHODS A. PET studies The data consisted of twenty-five H215O dynamic cardiac PET rest studies and six adenosine-induced stress studies in healthy female volunteers. The volunteers were examined in a supine position using a whole body GE Advance scanner (General Electric Medical Systems, Milwaukee, Wisconsin, USA). A transmission scan was acquired before an emission scan. For every positron emission tomography study, 700 to 900 Mbq of [15O] H2O was injected over 20 seconds. The acquisition of the serial transaxial cardiac tomographic images was started (14 x 5-second frames, 3 x 10-second frames, 3 x 20-second frames, 4 x 30-second frames). After a 10 minute period to allow for radioactivity decay, the adenosine infusion (140μg/min/kg) was started, and a dynamic PET scan similar to that at rest was performed. All acquired data were dead time decay, and photon attenuation corrected and reconstructed using the 2D-OSEM method [9] producing 128 x 128 x 35 images with volume voxels of 4.30 x 4.30 x 4.25 cubic millimeters.
B. Independent Component analysis Separating unknown source signals from known mixtures is called the Blind Source Separation Problem (BSS). Independent Component Analysis (ICA) is a method that offers the possibility to solve the BSS problem provided that: 1) independent sources generate statistically independent signals, 2) the number of observed linear mixtures is at least as large as the number of independent source signals, and 3) no more than one of the sources has a Gaussian distribution [1]. A basic description of the BSS problem supposes that there are m independent source signals s1 , s2 ,..., sm and n linear combinations
of them ( n ≥ m ), called
x1 , x2 ,..., xn
mixtures:
xi = ∑ j =1 aij s j for all i = 1,..., n
(1)
m
Using vector-matrix notation, x = ( x1 , x2 ,..., xn )
T
is a
vector of the mixtures, and s = ( s1 , s2 ,..., sm ) is a vector of T
the sources.
The matrix
A = (a ij ) n×m , also called the
mixing matrix, contains weighted contributions from every source signal to each mixture. Then the mixing model is written as (2) x = As , where A and s are unknown. It is possible to find a solution to this equation on the basis of the three previously mentioned data assumptions. Assigning an initial value to the mixing matrix A, the solution consists of an iterative process for finding the best mixing matrix for the given measurements x. The found A produces the Gaussian minimization of the data, for example maximizing its negentropy [10]. The less Gaussian the data distributions appear to be, the more independent [11] from each other they are. An ambiguity in the solution of the ICA problem is that there is no way to determine the order of the sources or their magnitudes. C. Applying ICA to PET data To apply the ICA model to cardiac PET images, we first pre-processed and reorganized each 3D time-frame image data set to interpret them as a linear combination of the independent tissue radioactivity concentrations. Any rearrangement (bootstrapping) of the elements in these row vectors will represent the same 3D image as long as the rule to reorder them is known. The order of the index can be changed due to the independency of the sources at each time-frame. We assumed that there are three different tissue maps (independent structures) in our data. Let s RV , s LV and s M be the unknown random variables that represent the different tissues: right ventricle blood pool (RV), left ventricle blood pool (LV) and myocardial tissue (M), respectively. Then each
Copyright (c) 2007 IEEE. Personal use of this material is permitted. Authorized licensed use limited to: Chang Gung University. Downloaded on June 23, 2009 at 09:22 from IEEE Xplore. Restrictions apply.
This article has been accepted for publication in a future issue of this journal, but has not been fully edited. Content may change prior to final publication.
3 time-frame image can be represented by:
x1 = ARV ,1 ⋅ s RV + ALV ,1 ⋅ s LV + AM ,1 ⋅ s M x2 = ARV , 2 ⋅ s RV + ALV , 2 ⋅ s LV + AM , 2 ⋅ s M , ! xn = ARV ,n ⋅ s RV + ALV ,n ⋅ s LV + AM ,n ⋅ s M
(3)
where AT , i represents the contribution of the measured radioactivity concentration of the tissue T to the image data at index i , and T ∈ {RV , LV , M } is one of the three cardiac structures. We assumed that inside the same tissue the time-dependent behaviour is similar during the whole acquisition, while different tissues behave differently. The information in one voxel represents a linear combination of different structures during the acquisition. The ICA separation is an iterative process that maximizes the statistical independence among the components to be separated, while searching for the mixing matrix. ICA uses the dynamic information assigned to the voxels. The separation results are a probability map of the three structures, corresponding to the separation of the three different sources, called independent component images. The mixing matrix entries correspond to the weights or contributions that the structure supplies to the measured data at different frame-times.
software [8] we made fifty computations of ICA separation with different random initializations for every data set. In the ICASSO tool, the separation results (estimations) are clustered and the center of the clusters is defined. The nearest component result to the center of each cluster was selected as the most representative for the corresponding component tissue. For clinical use, the iterative computation of the repeated ICA separations needs to be done in a reasonably short time. For this reason, we chose to use the FastICA algorithm, which is a fast iterative algorithm based on a fixedpoint algorithm [10]. The search is based on the maximization of the negentropy [10] of the data. The combination of ICASSO and FastICA was used in this study for all ICA separations.
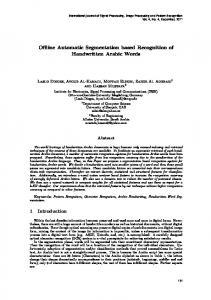
D. Implementation The proposed methodology is shown in Fig. 1. A detailed description of the steps is given in the following sections. 1) Masking of cardiac region from transmission images: The presence of the tracer injection site as a signal source in the image interferes with the ICA separation process of the cardiac PET data. Also, the similarity in the perfusion of the liver and the myocardial tissue makes the separation difficult. To produce better separation results, we generated a 3D mask to reduce the field of view so that only the cardiac region was included, leaving out the injection source site and most of the liver tissue. With this masking our assumption of having only three structures to be separated from the images also becomes more valid. The volumetric mask was extracted from transmission images using the deformable models [12]. 2) Separation of the cardiac tissues and reliability of the ICA separation results: The masked dynamic 3D cardiac PET images were reorganized, converting each 3D time-frame image into its vector form to interpret it as a linear mixture of the independent tissue radioactivity concentrations. The data were whitened, and reduced to three components by using Principal Component Analysis (PCA). Especially in the medical applications, it is important to obtain accurate and unambiguous results from the separation process. To find optimal initialization and to assess the reliability of the separated components, using ICASSO
Fig. 1. Overview of the steps applied to dynamic cardiac H215O PET data to automatically calculate the myocardial perfusion values.
3) Order of the components: Each mixing matrix column corresponds to the estimations of the dynamic behaviour of the radioactivity distribution of a separated component (3). The radioactivity concentration reaches the maximum at different time for different tissues. In the cardiac region, the radioactivity is detected first in the right ventricular blood pool and then in the left ventricular blood pool. We detected the time of the two peaks, which corresponds to the known order of the three components corresponding to the three physiological cardiac tissues. 4) Automatic extraction of VOI (ICA-VOI): To extract VOIs from the separated component images, a descriptive
Copyright (c) 2007 IEEE. Personal use of this material is permitted. Authorized licensed use limited to: Chang Gung University. Downloaded on June 23, 2009 at 09:22 from IEEE Xplore. Restrictions apply.
This article has been accepted for publication in a future issue of this journal, but has not been fully edited. Content may change prior to final publication.
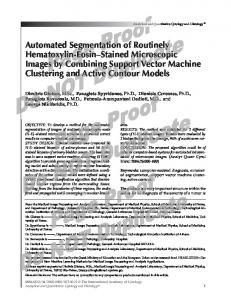
4 sample of elements from the left ventricular component image and the myocardial component image were selected fully automatically. After the ICA separation, each component image is composed of the relative probability values of the voxels to belong to one of the structures. These values were ordered first in descending order, after which the maximum curvature point of the ordered histogram was calculated. All the voxels with intensity values higher than this curvature point have a high statistical probability of belonging to this tissue, then forming the volume of interest (VOI). The left ventricular VOI was extracted first. We considered the bottom part of the left ventricle VOI as a natural restriction level for the localization of the myocardial VOI. The myocardial VOI was calculated in the same way. In Fig. 2 we plotted an example of the calculation of the VOI. The extracted VOIs are related to the physiological characteristics of the corresponding tissue component images, and the segmentation is based on the statistical probability of the separated 3D component image. For all the calculations we assumed that the volumes of the tissues were less than 300 ml [13]. 5) Manual ROI drawing on the differential images (ROI): To draw ROIs in dynamic H215O cardiac PET studies with the conventional method, a careful visual inspection and selection of the differential images has been applied. The differential method is typically performed by summing up the first timeframe images (representing the blood pool) and the remaining later time-frame images (representing the whole volume of water distribution), and then subtracting the early image from the second image. It is also possible to adjust the cut-off frame and to give different weight to the summed images before subtraction. In this study, the manual ROI drawing was done
a)
b)
around the whole myocardial wall (including the lateral, anterior and septal regions) on 1 to 4 transaxial cross-section images of the differential image set by an expert (S.Nesterov). In addition, to obtain the arterial input function a ROI in the left ventricular area was drawn.
Fig. 2. Example of calculation of the myocardial VOI. The intensity values of the myocardial component were first arranged in descending order. All the voxels on the left side of the maximum curvature point made up the VOI, being the voxels with the highest probability of belonging to the myocardial tissue. In this case (data09), the number of voxels in the myocardial VOI was 674, corresponding to a threshold of 61.66% of the maximum intensity from 4000 voxels (approx. 300 ml).
6) Manual ROI drawing on the independent component images (ICA-ROI): The left ventricle component image and the myocardial component image were shown to the same expert. By visual inspection, manual ROI drawing was performed similarly for the same planes as in the conventional ROI drawing process.
c)
d)
e) f) g) h) Fig. 3. The transaxial cross-sections of the 3D ICA component images and the automatically extracted myocardial VOIs from the same subject. For the rest case (data09): a) the blood pool of the right ventricle, b) the blood pool of the left ventricle, c) the blood pool of the myocardial tissue component, and d) the myocardial VOI on the ICA component, with total myocardial VOI volume of 52.34 ml (674 voxels) and, respectively, for the stress case (data28) e) cf. a) , f) cf. b) , g) cf. c), and h) cf. d) with a total volume of 76.58 ml (986 voxels).
Copyright (c) 2007 IEEE. Personal use of this material is permitted. Authorized licensed use limited to: Chang Gung University. Downloaded on June 23, 2009 at 09:22 from IEEE Xplore. Restrictions apply.
This article has been accepted for publication in a future issue of this journal, but has not been fully edited. Content may change prior to final publication.
5 TABLE 2 QUANTITATIVE MYOCARDIAL PERFUSION VALUES, ADENOSINE-INDUCED STRESS CASES
7) Calculation of MBF: The same compartmental model [14] was used to calculate the myocardial perfusion values in all the cases. The implemented model corrects the spillover and partial volume effects from the original data. 8) Comparison and Statistical test among the three different methods: The perfusion values resulting from all the methods were compared with each other. The statistical analysis for the quantitative results for rest studies were performed with SAS statistical package version 8.2. The statistical difference between the results was studied using analysis of variance (ANOVA) with mixed model pairwise Tukey-Kramer post hoc test. Differences were considered statistically significant at the 0.05 level. Bland-Altman analysis was used to study agreement between the ICA-based and the conventional methods. III.
RESULTS
The ICA separation of cardiac components (ventricles and myocardium) was successful in all the 25 rest and six pharmacological stress cases. The mean processing time to perform the iterative calculations of the ICA separations with TABLE 1 QUANTITATIVE MYOCARDIAL PERFUSION VALUES, REST CASES INTENSITY> = ROI ICA-ROI ICA-VOI MAX(MYO) % data01 92,17 78,53 71,54 46,78 data02 69 63,12 67,23 48,85 data03 101,37 101,24 99,88 47,11 data04 *) 85,67 85,77 50,87 data05 88,24 74,13 70,36 57,83 data06 94,04 84,54 84,78 54,36 data07 *) 85,89 79,08 44,15 data08 111,84 78,06 84,57 53,10 data09 80,11 76,94 80,25 61,66 data10 57,2 60,2 74,50 53,59 data11 95,62 86,97 62,94 50,61 data12 85,57 84,47 60,70 61,87 data13 90,87 77,68 100,23 54,72 data14 *) 127 78,30 54,50 data15 67,49 59,68 80,75 52,00 data16 68,13 52,19 64,10 57,87 data17 79,74 73,92 65,42 62,83 data18 64,94 53,78 48,86 61,52 data19 73,21 63,74 60,59 56,74 data20 75,07 52,01 45,68 59,78 data21 92,94 84,11 91,06 65,21 data22 89,8 64,72 65,71 55,93 data23 *) 95,05 70,48 57,69 data24 84,85 76,89 56,61 60,81 data25 76,48 71,12 50,72 65,06 m
82,79
76,47
72,00
55,81
σ
13,51
16,78
14,61
5,79
success rate
84 %
100 %
100 %
INTENSITY> =
ROI
ICA-ROI
ICA-VOI
data26 data27 data28 data29 data30 data31
296,22 309,55 449,32 356,87 500,50 300,40
339,85 272,15 401,50 366,59 295,46 251,30
275,59 273,27 317,91 169,08 258,48 126,41
50,93 60,03 60,3 58,99 54,21 35,58
m
368,81
321,14
236,79
53,34
σ
86,52
57,98
73,01
9,45
MAX(MYO) %
ICASSO was 25 seconds (on a 3-GHz Pentium processor with Matlab). The quantitative myocardial perfusion values are shown in tables 11 and 2. With the conventional method we did not succeed to construct differential images, where the myocardium was visible, in 4 rest cases. In two more cases it was not possible to draw a septal ROI. The visual result of the separations is shown in Fig. 3. In addition we show the automatically extracted myocardial VOIs for rest and stress studies of the same subject. TABLE 3 REGIONAL QUANTITATIVE MYOCARDIAL PERFUSION VALUES REST STRESS REGION
Anterior Lateral Septum
ROI 84 ± 16 83 ± 14 87 ± 32
ICA-ROI 84 ± 17 82 ± 19 75 ± 17
ROI 392 ± 93 373 ± 93 294 ± 68
ICA-ROI 333 ± 81 368 ± 78 301 ± 90
The average perfusion value for the whole myocardium at rest for the conventional method (ROI) was 82 ml/min/100g, for the ICA-ROI method 76 ml/min/100g, and for the automatic ICA-VOI method 72 ml/min/100g. For the stress cases the average perfusion value for the conventional method (ROI) was 368 ml/min/100g, for the ICA-ROI method 321 ml/min/100g, and for the automatic ICA-VOI method 236 ml/min/100g. These preliminary results showed that the ICA separation can also be used successfully for the pharmacological stress data. Regional (anterior, lateral, septal) myocardial perfusion values with ROI and ICA-ROI methods are shown in Table 32. One of the ICA-ROI perfusion values of the rest cases was noticeably higher than the others (127 ml/min/100g). Statistically, such a high value could be considered an outlier, but earlier studies have shown that absolute perfusion in healthy humans at rest can be between 50 and 200 ml/min/100g [15]. In addition, our test data 1 The units in all the tables are ml/min/100g. The standard deviation σ and the mean value m do not include the marked fields in Table 1. 2 Data values expressed as mean ± standard deviation. In two cases (data05 and data08) was not possible to draw a septal ROI.
Copyright (c) 2007 IEEE. Personal use of this material is permitted. Authorized licensed use limited to: Chang Gung University. Downloaded on June 23, 2009 at 09:22 from IEEE Xplore. Restrictions apply.
This article has been accepted for publication in a future issue of this journal, but has not been fully edited. Content may change prior to final publication.
6
a)
c)
b)
d)
Fig. 4. a) The range and distribution of the myocardial perfusion values (ml/min/100g) for the compared methods. The boxes indicate the lower quartile, median and upper quartile values. The star (*) represents the unexpected high flow value (127 ml/min/100g, data14). b) The correlation of the MBF values obtained using the ICA-ROI and ROI methods (y=8.6+0.81x; r=0.95, p=0.3211) with standard error estimation (SEE) 33.1, c) ICA-VOI and ROI (y=25.85+0.55x; r=0.93, p=0.0132), with SEE 32.2, d) ICA-VOI and ICA-ROI (y=21.87+0.66x; r=0.93, p=0.1715), with SEE 30.3.
consisted of female volunteers, and the mean baseline perfusion for females has been shown to be higher than for males [15]. The ICA-ROI and ROI methods were strongly correlated (Fig. 4.). Nevertheless, the high perfusion values of the few stress cases, considerably affect the correlations. The statistical test showed that the two ICA-based methods did not differ significantly (p=0.3211), and nor did the conventional ROI based method and the ICA-ROI method (p=0.1715). The ICAVOI method was statistically different than the ROI-based (p=0.0132). There was systematic negative bias in the BlandAltman analysis between the proposed ICA-based and the conventional methods (mean differences: ICA-ROI vs. ROI 19 (SD of 41), ICA-VOI vs. ROI -39 (SD of 65)) for the whole data set (rest and stress). However, the standard deviation of the myocardial blood flow was very large for the conventional method, especially for the stress cases. Visually, the ICA method enhanced the contrast of the whole myocardial tissue better than the differential method (Fig. 5). In particular, the septal region was more visible in the ICA component image than in the differential image. For this
reason, the manually drawn myocardial ROIs also differed considerably when the ROIs were drawn on the ICA component image or the differential image (Fig. 6). The comparative plot of the myocardial and the left ventricle time activity curves obtained with the conventional ROI method and ICA-ROI method (Fig. 7) for the same case. In 22 cases, the manually drawn myocardial ROI on the differential image was misplaced in the septal region, and in three cases, the
a) b) Fig. 5. Myocardial a) differential image and b) separated ICA component image from the same study and the same transaxial plane (data03).
Copyright (c) 2007 IEEE. Personal use of this material is permitted. Authorized licensed use limited to: Chang Gung University. Downloaded on June 23, 2009 at 09:22 from IEEE Xplore. Restrictions apply.
This article has been accepted for publication in a future issue of this journal, but has not been fully edited. Content may change prior to final publication.
7 differential image did not visualize the septal region at all. The ICA-VOI-based method used the whole 3D component image to extract the TACs for the input function and myocardium, whereas the manually drawn ROIs were placed only on the selected 1-4 transaxial planes. The VOIs for the left ventricle and myocardium were automatically obtained in each individual case. We also investigated how, the automatically obtained threshold relates to the percentage of the maximum intensity value of the component image. For the myocardium, the threshold was on average 55 (+/-5) % and for the left ventricle 54 (+/- 10) % in the rest studies (last column in Table 1). The threshold for the stress cases for myocardium was on average 53 (+/- 9) % and for the left ventricle 51 (+/4) % (last column in Table 2).
Fig. 6. Myocardial ROI tissue from the same study and the same transaxial plane (data01), drawn on a) the conventional differential image, b) the ICAseparated component image, and c) both ROIs overlapping. It is clear that the septal region from the conventional ROI fell into the left ventricular blood pool. This was a typical case and probably the main reason for the higher MBF values using the ROI method (conventional).
IV. DISCUSSION Some important considerations should be taken into account when applying a statistical method such as ICA to real PET image data. One is that our finite-sized data (number of voxels and time frames) is an approximation of the reality, limiting the accuracy of the estimation of the components. Although in future a better acquisition resolution could partly reduce the errors entailed by the finite data, the high noise contamination in the data affects the separation results [2]. Additional difficulties may arise specially in the cardiac measurements because of heart movements and individual variances in the structure and function of the heart. Another important fact is that the real data may not strictly follow the assumptions for the ICA model: truly independent sources of which only one has Gaussian distribution. Because of these inaccuracies the cost function used in ICA may have many local minima and the algorithm could get stuck in a local minimum. In this study, we wanted to improve the reliability and repeatability of the separation results by using an iterative approach called ICASSO in the calculations [8]. ICASSO randomly initializes the ICA separation algorithm in the repeated estimations of the independent components. The procedure selects the best representation for each individual component image (right ventricle, left ventricle and myocardial muscle) from the iterative evaluations. This provided high statistical reliability for the estimations. Because the processing time needed for the selected ICA
implementation, FastICA, is very short, this is a reasonable approach to improve the stability of ICA separation even in a clinical environment. The same iterative approach was also applied to test the optimum number of components. The result was three, which is the same as the intuitive assumption. The advantage of ICA is that the solutions are unique for each initial set of conditions [16]. Another option for the separation could be Factor Analysis (FA) [17, 18, 19, 20]. The major drawback of FA is that the solutions are not mathematically unique, needing extra constraints in the cost function to find an optimal solution. FA gives different results in different executions of the algorithm, even if the initialization is the same. With this reliable ICA separation we were able to introduce an automatic method for the segmentation of the threedimensional VOI of the left ventricle and myocardium from the corresponding component images. The aim was to select automatically a descriptive sample of voxels from the left ventricle and the myocardial tissue without subjective selection of parameters. We assumed that by ordering the intensities of the corresponding component images in decreasing order we would have a graph showing the probabilities of the voxels belonging to a certain component. Because the intensity values have no real meaning they were scaled as percentage of the peak intensity. Instead of using a fixed threshold in the selection as in earlier studies, we used the turning point of the decreasing curve of the intensities. Thus, the selection is adaptive to the individual component image. In the earlier studies, the amount of voxels has been selected via a pre-defined average threshold. In the studies applying factor analysis in the separation, the threshold for left ventricle has ranged from 50% to 90% of the maximum value (for left ventricle in H215O studies, 50% in a dog study [6], for 13N-ammonia human cardiac studies 90% [17], for 18FFDG human cardiac studies 80% [17]). In these studies, the separation result was used to scale the left ventricle timeactivity curve to achieve the input curve for the model calculations, and the myocardial TAC was defined from the
Fig. 7. Time Activity Curves obtained with conventional ROI method and ICA-ROI method for the same study (data03). Clearly the spill over effect is more present in the conventionally obtained myocardial TAC.
Copyright (c) 2007 IEEE. Personal use of this material is permitted. Authorized licensed use limited to: Chang Gung University. Downloaded on June 23, 2009 at 09:22 from IEEE Xplore. Restrictions apply.
This article has been accepted for publication in a future issue of this journal, but has not been fully edited. Content may change prior to final publication.
8 manually drawn ROI. With the ICA separation method used in the H215O dog studies, thresholds of 50% and 70% have been reported for the left ventricle [5, 6]. In human cardiac studies, and especially in the myocardium, there are no previous studies on the threshold values. Because the published thresholds differed very much we wanted to find a new way to define the threshold individually by using the information in the component images. From the experimental data we found that the turning point (or maximum curvature point) in the ordered intensity values of the component images defined the point up to which we could be sure to obtain specific information about the target organ such as the myocardium or blood pool. We used this individual threshold to segment the original dynamic image set for the calculation of the TACs for both the input function and the muscle. When comparing the ICA-ROI results and the results given by the ICA-VOI method, it can be seen that there was no significant difference between these methods in the MBF values. This validates the automatic method against the manual ROI-based method. However, even in this study, the average threshold for the left ventricle corresponds well with the 50% threshold applied in the previous dog study although the individual variation was large, ranging from 20% to 65 %. This supports the use of the individual threshold. The average threshold for the myocardium was about 55% in both the rest and stress cases. The separated ICA component images presented enhancement of the image contrast that allowed the drawing of the ROIs (ICA-ROIs) easily and without assuming the position of the left ventricle or the myocardium. The component images show the most probable position of the tissue in question. In this study, we found that the beginning of the dynamic PET study had more effect on the results than the latter part of the study because, in the beginning, the behaviour of the TACs of the left ventricle and right ventricle differs most from the myocardium TAC. As in the previous studies, we found that the separation of the blood pool in the left ventricle and in the right ventricle could be done with great certainty. This also helped the detection of the myocardium, although we did not make any corrections for the overlapping components. Because we assumed the three components to be separated, and two of them could be found very clearly, the third, corresponding the myocardium, was at least well separated from the blood pool components. In particular, this improved the detection of the septal region which is situated between the ventricles. The detection of this region is difficult with the differential method because of the high spill-over from the blood pool to this region at the beginning of the study. The septal region was not present in all the differential images, thus producing critical misplacement of the myocardial ROIs in many of the studies. In these cases, the myocardial ROI contained parts that behaved like the blood pool, promoting an overestimation of the myocardial TAC, increasing the whole myocardial perfusion value. Although the spill-over from the ventricles to the myocardium can be corrected by fitting the rate constants together with the recovery and spill-over corrections, when
the contamination of the blood pool increases, the blood flow estimate will become biased [21]. For the ICA separation of the tissues we needed an appropriate mask to avoid contaminating information mainly from the tracer injection site and the liver. Data re-orientation into the short axis images or a manual masking process could be alternatives. However, this re-orientation would need a separation process to give a good contrast image to define the axis for re-slicing. In addition to the rest studies, we tested the ICA methodology with a small number (6) of adenosineinduced stress studies. Because of the larger movement of the heart, we expected that the separation would be poorer than in the rest studies. However, the quality of the component images was similar to that of the rest cases, and the automatic segmentation also performed well. With this test, we were able to show that the iteratively run ICA process could also help in the analysis of stress studies with H215O, although the number of stress cases in this study was too small to draw more definite conclusions. V. CONCLUSIONS The three cardiac structures (right ventricle, left ventricle and myocardium) could be visualized better with the ICA separation than with the previously used differential method. In the myocardial component image, even the septal region was clearly detectable. The ICA component images improved the positioning of the ventricular and myocardial ROI in the cardiac H215O studies. In addition, we developed an automatic method for the segmentation of the three-dimensional VOI of the myocardium and the left ventricle. The segmentation was successfully applied for all the rest and stress image sets in this study. The calculated perfusion values differed from those based on the differential images, but without the ground truth values in human studies we do not know the true reference. Further larger studies are needed to confirm the applicability of the developed methods in a clinical environment. Especially, the methods need more testing with stress cases and real patient data. ACKNOWLEDGMENT We thank Vesa Oikonen for his help on issues related to modeling. REFERENCES [1] [2] [3] [4]
Hyvärinen, J. Karhunen, E. Oja ”Independent component analysis”, Wiley InterScience, pp. 147-164. 2001. M. Magadán-Méndez, A. Kivimäki, U. Ruotsalainen “Testing of the sensitivity of ICA separation to noise with simulated Cardiac PET data”, Finnish Signal Processing Symposium (FINSIG), 2003. M. Magadán, A. Kivimäki, U. Ruotsalainen, “ICA Separation of functional components from dynamic cardiac PET data”, In proc. of IEEE Medical Imaging Conference (MIC2003), pp. 2618-2622, 2003. A. Juslin, A. Reilhac, M. Magadán-Méndez, E. Albán, J. Tohka, U. Ruotsalainen, “Assessment of separation of functional components with ICA from cardiac perfusion PET phantom images for volume extraction with deformable surface model”. In: Frangi, A. F. et al. (Eds.). Functional Imaging and Modeling of the Heart, Proceedings of the Third International Workshop (FIMH 2005), Barcelona, Spain, 2-4 June, 2005.
Copyright (c) 2007 IEEE. Personal use of this material is permitted. Authorized licensed use limited to: Chang Gung University. Downloaded on June 23, 2009 at 09:22 from IEEE Xplore. Restrictions apply.
This article has been accepted for publication in a future issue of this journal, but has not been fully edited. Content may change prior to final publication.
9 [5]
[6]
[7] [8] [9] [10] [11] [12]
[13]
[14]
[15] [16] [17]
[18]
[19]
[20]
[21]
J. S. Lee, J. Y. Ahn, D. S. Lee, J. Han, M.J. Jang, J-K. Chung et al., “Robust Extraction of Input Function from H152O dynamic Myocardial Positron Emission Tomography Using Independent Component Analysis”, In proc. of IEEE Nuclear Science Symposium (NSS99), vol. 2, pp. 990 – 994, 2000. J. S. Lee, D. S. Lee, J. Y. Ahn, G. J. Cheon, S-K. Kim, J. S.Yeo, et al., “Blind separation of cardiac components and extraction of input function from H152O dynamic myocardial PET using independent component analysis”. J Nucl Med., vol. 42, no. 6, pp. 938 – 943, 2001. B.I. Lee, J. S. Lee, D. S. Lee, S. Choi, “Myocardial Blood Quantification in dynamic PET: An assemble ICA Approach”. W. Duch et al. (Eds): ICANN 2005, LNCS 3697, pp. 709 – 714, 2005. J. Himberg, A. Hyvärinen, F. Esposito, “Validating the independent components of neuroimaging time-series via clustering and visualization”, NeuroImage, vol. 22, no. 3, pp. 1214 – 1222, 2004. H. M. Hudson and R. S. Larkin “Accelerated Image Reconstruction Using Ordered Subsets of Projection Data”, IEEE Transaction on medical Imaging, vol. 13, no. 4, pp. 601-609, 1994. A. Hyvärinen, “Fast and robust fixed-point algorithms for independent component analysis” IEEE Trans. Neural Networks, vol. 10, no.3, pp. 626-634, 1999. P. Comon, “Independent component analysis, a new concept?”, Signal Processing, vol. 36 no.3, pp. 287– 314, 1992. A. Juslin, J. Tohka, “Unsupervised segmentation of cardiac PET transmission images for automatic heart volume extraction” In proc. of the IEEE 2006 International Conference of the Engineering in Medicine and Biology Society, pp.1077–1080, 2006. S. Clay, K. Alfakih, A. Radjenovic, T. Jones, J.P. Ridgway, M.U. Sinvananthan, “Related Normal range of human left ventricular volumes and mass using steady state free precession MRI in the radial long axis orientation”. MAGMA. vol. 19, no. 1, pp. 41– 45. Feb, 2006. H. Iida, I. Kanno, A. Takahashi, S. Miura, M. Murakami, K. Takahashi, Y. Ono, F. Shishido, A. Inugami, N. Tomura, “Measurement of absolute myocardial blood flow with H215O and dynamic positron-emission tomography. Strategy for quantification in relation to the partial-volume effect” Circulation, vol. 78, pp. 104 – 115. Jul, 1988. P. Chareonthaitawee, P. A. Kaufmann, O. Rimoldi, P. G. Camici “Heterogeneity of resting and hyperemic myocardial blood flow in healthy humans”, Cardiovascular Research, vol. 50, pp. 151– 161, 2001. A. Hyvärinen, P. Pajunen, “Nonlinear independent component analysis: Existence and uniqueness results”, Neural Networks, vol. 12, pp. 429 – 439, 1999. H-M. Wu, C. K. Hoh, Y. Choi, H. R. Schelbert, A. Randall Hawkins, M. E. Phelps, et al., “Factor analysis for extraction of blood time-activity curves in dynamic FDG-PET studies”, J Nucl Med., vol. 36, no.9, pp. 1714 – 1722, 1995. J. Y. Ahn, D. S. Lee, J. S. Lee, S. K. Kim, G. J. Cheon, J. S. Yeo, et al., “Quantification of regional myocardial blood flow using dynamic H152O PET and factor analysis”, J Nucl Med., vol. 42, no. 5, pp. 782 – 787, 2001. F. Frouin, P. Merlet, Y. Bouchareb, V. Frouin, J-L. Dubois-Randè, A. De Cesare, et al., ”Validation of myocardial perfusion reserve measurements using regularized factor images on H215O dynamic PET scans”, J Nucl Med., vol. 42, no. 12, pp. 1737 – 1746, 2001. F. Hermansen, J. Ashburner, T. J. Spinks, J. S. Kooner, P. G. Camici, and A. A. Lammertsma, “Generation of Myocardial Factor Images Directly from the Dynamic Oxygen-15-Water Scan Without Use of an Oxygen-15-Carbon Monoxide Blood-Pool Scan” J Nucl Med., vol. 39. pp. 1696-1702. 1998. G.D. Hutchins, J.M. Caraher, R.R. Raylman, “A Region of Interest Strategy, for minimizing Resolution Distortions in Quantitative Myocardial PET Studies”, J Nucl Med., vol. 33, no.6. pp. 1243-1250, 1992.
Copyright (c) 2007 IEEE. Personal use of this material is permitted. Authorized licensed use limited to: Chang Gung University. Downloaded on June 23, 2009 at 09:22 from IEEE Xplore. Restrictions apply.