Yersinia pestis, the infamous plague-causing pathogen, appears to have emerged in ... classification of Y. pestis based on glucose fermentation and ni-.
JOURNAL OF CLINICAL MICROBIOLOGY, Sept. 2001, p. 3179–3185 0095-1137/01/$04.00⫹0 DOI: 10.1128/JCM.39.9.3179–3185.2001 Copyright © 2001, American Society for Microbiology. All Rights Reserved.
Vol. 39, No. 9
Identification and Characterization of Variable-Number Tandem Repeats in the Yersinia pestis Genome ALEXANDRA M. KLEVYTSKA,1† LANCE B. PRICE,1 JAMES M. SCHUPP,1 PATRICIA L. WORSHAM,2 JANE WONG,3 AND PAUL KEIM1* Department of Biological Sciences, Northern Arizona University, Flagstaff, Arizona 86011-56401; United States Army Medical Research Institute of Infectious Diseases, Fort Detrick, Frederick, Maryland 21702-50112; and Microbial Diseases Laboratory, California Department of Health Services, Berkeley, California 947043 Received 2 April 2001/Returned for modification 26 May 2001/Accepted 6 July 2001
Yersinia pestis, the infamous plague-causing pathogen, appears to have emerged in relatively recent history. Evidence of this fact comes from several studies that document a lack of nucleotide diversity in the Y. pestis genome. In contrast, we report that variable-number tandem repeat (VNTR) sequences are common in the Y. pestis genome and occur frequently in gene coding regions. Larger tandem repeat arrays, most useful for phylogenetic analysis, are present at an average of 2.18 arrays per 10 kbp and are distributed evenly throughout the genome and the two virulence plasmids, pCD1 and pMT1. We examined allelic diversity at 42 chromosomal VNTR loci in 24 selected isolates (12 globally distributed and 12 from Siskiyou County, Calif.). Vast differences in diversity were observed among the 42 VNTR loci, ranging from 2 to 11 alleles. We found that the maximum copy number of repeats in an array was highly correlated with diversity (R ⴝ 0.86). VNTR-based phylogenetic analysis of the 24 strains successfully grouped isolates from biovar orientalis and most of the antiqua and mediaevalis strains. Hence, multiple-locus VNTR analysis (MLVA) appears capable of both distinguishing closely related strains and successfully classifying more distant relationships. Harnessing the power of MLVA to establish standardized databases will enable researchers to better understand plague ecology and evolution around the world. The etiologic agent of plague, Yersinia pestis, is a gramnegative bacillus and a member of the family Enterobacteriaceae (4). Hundreds of millions of people have died in three major plague pandemics. The first pandemic, known as Justinian’s plague, occurred during the 6th century, striking populations in Africa and the Mediterranean countries (4). The wellknown Black Death plague began in the 14th century and by the 17th century had killed a fourth of the European population (4). The third pandemic began in China in the late 1800’s and was quickly dispersed by boat and rail around the world (16). The third pandemic persists today, primarily in rodent reservoirs, and rarely causes human deaths. Three biovars, antiqua, mediaevalis, and orientalis, have been established for classification of Y. pestis based on glucose fermentation and nitrate reduction. However, until recently, strain differentiation within these biovars has been limited. Recent technological advances in molecular biology have facilitated strain discrimination among pathogenic bacteria. Multilocus sequence typing has demonstrated extremely low diversity in genes of such recently emerged pathogens as Y. pestis (1, 2, 5) and the gram-positive bacterium Bacillus anthracis (18). Molecular techniques based on restriction enzyme digestion patterns have recently been applied to Y. pestis strain differentiation. The hypothesis that the first, second, and third pandemics were caused by progenitor strains of the antiqua,
mediaevalis, and orientalis biovars, respectively, has been substantiated by strain typing using rRNA restriction patterns (ribotyping) (6) and the IS100 insertion element restriction fragment length polymorphism (RFLP) (1). Pulsed-field gel electrophoresis detects large restriction fragment size differences and has been applied to Y. pestis strain typing, but it has resulted in mixed findings (6, 12). Of these methods, the IS100 insertion element RFLP analysis appears to have the highest resolution, perhaps due to the higher mutation rates associated with IS elements (1). It has been known since the late 1960s that eukaryotic genomes contain large numbers of repeated DNA sequences (3). However, not until two decades later were these hypervariable minisatellite regions used to detect DNA fingerprints in the human genome (8). Because of repetitive sequence length variation observed among individuals, these tandem repeat arrays were renamed variable number of tandem repeat (VNTR) loci by Nakamura et al. (14). The ongoing sequencing efforts for a number of archaeal and bacterial genomes have led to the discovery and application of VNTRs to DNA fingerprinting of prokaryotic species as well. For example, high-diversity VNTR loci have been used to genotype strains of Neisseria gonorrhoeae (17), Helicobacter pylori (13), Haemophilus influenzae (23), B. anthracis (9), and, in a limited case, Y. pestis (2). In the work presented here, we report the analysis of the Y. pestis chromosomal and two plasmid, pMT1 and pCD1, DNA sequences in order to identify and characterize VNTR loci. We further analyzed the relationship between sequence structure and diversity using 42 VNTR loci. We report here the effects of sequence structure on VNTR polymorphism and the phylogenetic potential for Y. pestis strain discrimination using VNTR markers.
* Corresponding author. Mailing address: Department of Biological Sciences, Northern Arizona University, Flagstaff, AZ 86011-5640. Phone: (520) 523-1078. Fax: (520) 523-7500. E-mail: Paul.Keim@nau .edu. † Present address: Johns Hopkins School of Medicine, Department of Pathology, Baltimore, MD 21287-6417. 3179
3180
KLEVYTSKA ET AL.
J. CLIN. MICROBIOL. TABLE 1. Y. pestis strains
MATERIALS AND METHODS Nomenclature. Any DNA sequence repeated side by side is referred to as a direct repeat or tandem repeat array. The simplest sequence motif of a direct repeat array has a repeat length, measured in base pairs. The number of times that this simple sequence motif is present in the array is referred to as the copy number. The repeat length multiplied by the copy number is the array size, also measured in base pairs. For example, the tandem repeat array NATATATN, where N is any DNA, contains the dinucleotide motif AT with a repeat length of 2 bp, a copy number of 3 bp, and an array length of 6 bp. By convention, we state the repeat length before the copy number. For instance, the array in the above example is a 2 by 3. A direct repeat array may contain either a mononucleotide repeat motif, also called a homopolymeric motif, such as a poly(T) tract, or a heteropolymeric motif, which is a dinucleotide or greater repeat motif of mixed nucleotide composition. A tandem repeat array with a short repeat length is frequently referred to as a simple sequence repeat (SSR) or short tandem repeat. van Belkum et al. (22) have previously defined SSRs as repeat arrays with repeat lengths of 2 to 6 bp. For the sake of consistency with one of the direct repeat search programs used, here we refer to SSRs as arrays with repeat lengths of 1 to 10 nucleotides. A VNTR maintains a repeat length but differs among strains in copy number. PCR amplification of a VNTR locus from different strains will reveal PCR fragment length polymorphisms that reflect the increased or decreased copy number as a result of insertion or deletion events within the array. Detection of tandemly repeated sequences in the Y. pestis genome. In these studies, we have used and compared two approaches for identifying direct repeat arrays. One approach employed the Genequest software program (Dnastar package; LaserGene, Inc., Madison, Wis.) direct repeat function set for the smallest scanning window size possible (8 nucleotides) to locate direct repeat arrays. This setting permits detection of arrays as small as 1 by 9, 2 by 5, 3 by 3, 4 by 3, etc.; however, it will not detect arrays of 8 bases or less. Genequest will also readily detect open reading frames (ORFs) and was used in conjunction with the direct repeat searches to determine their presence in and out of probable coding regions. The second approach used software designed by Gur-Arie et al. (7) to detect SSRs with a repeat length between 1 and 10 bp (ftp://ftp.technion.ac.il/pub /supported/biotech/ssr.exe). The SSR program generates an output file that contains the repeat length in base pairs, the nucleotide composition of the motif, the copy number, and the location of the array. The unfinished Y. pestis strain Colorado 92 (CO92) chromosome sequence was downloaded from the Sanger Center Microbial Genomes web page (http://sanger .ac.uk/Projects/Y_pestis/) on 21 April 2000 in 105 contigs. The complete sequences for the Y. pestis plasmids pCD1 and pMT1 were downloaded from the National Center for Biotechnology Information (NCBI) web site (GenBank accession numbers NC_001976 for pCD1 and NC_001976 for pMT1). Plasmid sequences were screened for direct repeats in Genequest according to the parameters described above. Clustering of arrays in the chromosome as detected with Genequest was examined in 10-, 25-, and 50-kbp intervals and was compared to an expected Poisson distribution [P(x) ⫽ e⫺x/x!, ⫽ 2.14 arrays per 10-kbp interval] as previously described (25). PCR screening of direct repeats for variability. All reagents were obtained from Life Technologies, unless otherwise noted. A diverse collection of 77 tandem repeat arrays identified with Genequest was screened for locus variability. When available, three representatives were screened for each repeat length. These loci were amplified from 12 Y. pestis isolates, representing all biovar types (Table 1). Variability was detected in 42 of the screened loci (Table 2). Thirty-five loci were dropped from further analyses due to lack of variability (27 loci), poor amplification (5 loci), or no amplification (3 loci). Six of the 27 monomorphic loci showed significant homology to ORFs identified in members of the Enterobacteriaceae when BLAST searched on the NCBI database (http://www.ncbi.nlm.nih .gov/BLAST/). Another five, detected in an earlier incomplete Y. pestis chromosome sequence assembly, were no longer present in multiple copies in the 21 April 2000 sequence, suggesting they were artifacts of an inaccurate assembly. Sequences from the 42 VNTR loci were checked against the 21 April 2000 Y. pestis genome sequence to ensure that the same VNTR locus was not duplicated in our analyses. The completed Y. pestis sequence (February 2001) was revisited to establish final genomic coordinates (Table 2). DNA was extracted from the 12 diverse strains using a traditional phenolchloroform method. For the 12 California strains, DNA was prepared by a simple heat-soak method, previously described by Keim et al. (9). Primers were designed using Primer Select (Dnastar) with annealing temperatures as close to 65°C as possible but ranging from 59 to 69°C. However, primer-annealing temperatures did not differ by more than 2°C within a pair.
Straina
Geographical origin
Biovarb
Angolaⴱ Antiquaⴱ Pestoides Fⴱ Harbin 35ⴱ Kim 10 Variantⴱ Nicholisk 41ⴱ Pestoides Aⴱ Pestoides Baⴱ 195/Pⴱ Java 9ⴱ La Pazⴱ CO92ⴱ 83A-5257† 85A-4160† 86A-3503† 86A-3654† 89A-7521† 89A-7544† 89A-7545† 90A-415† 90A-598† 90A-4021† 90A-6072† 90A-7215†
Angola Democratic Republic of Congo Former Soviet Union Manchuria Kurdistan Manchuria Former Soviet Union Former Soviet Union India Indonesia Bolivia Colorado California California California California California California California California California California California California
A A A M M M M M O O O O O O O O O O O O O O O O
a Strains from the U.S. Army Medical Research Institutes for Infectious Diseases collection are indicated with asterisks. Strains from the California Department of Health are indicated with daggers. b A, antiqua; M, mediaevalis; O, orientalis.
Reaction mixtures for PCR amplifications contained the final concentrations of the following reagents: 1⫻ PCR buffer without MgCl2; 2 mM MgCl2; 200 M dATP; 200 M dCTP; 200 M dGTP; 200 M dTTP; 1 M R110, R6G, or Tamra phosphoramidite fluorescently labeled dUTP (Applied Biosystems, Foster City, Calif.); 0.5 U of Taq polymerase; 0.5 ng of template DNA; 0.2 M forward primer; 0.2 M reverse primer; and filtered sterile water to a final volume of 20 l. The primers marked by an asterisk in Table 2 have a phosphoramidite fluorescent dye (Fam, Hex, or Ned) covalently linked to the 5⬘ nucleotide. Reaction conditions using the 5⬘-labeled primers were identical to those given above, with two exceptions. The fluorescent dUTP was omitted from the reaction mixture, and 5⬘-labeled primers were multiplexed, such that 18 primers were combined in four mixes. Mix 1 contained primers for the M06, M09, M18, M21, M28, and M34 loci; mix 2 contained primers for the M12, M23, M31, M58, and M82 loci; mix 3 contained primers for the M27, M29, and M33 loci; and mix 4 contained primers for the M22, M25, and M59 loci. All PCRs were performed in MJ Research 96-well DNA Engines equipped with hot bonnets. Reaction mixtures were raised to an initial temperature of 94°C for 5 min to denature the DNA. Thereafter, reaction mixtures were cycled for 20 s at 94°C, 20 s at 60°C, and 45 s at 72°C for a total of 35 cycles, followed by a final polymerase extension step at 72°C for 5 min. Fluorescently labeled amplicons were visualized by polyacrylamide gel electrophoresis (PAGE) on an Applied Biosystems 377 DNA sequencer using GeneScan fragment analysis. The PCR product was diluted fivefold and then mixed with formamide, dextran blue loading dye, and a custom Bio Ventures Rox 1000 fluorescently labeled size standard at a ratio of 12:5:1:6, respectively. Virtual filter set A was used to detect amplicons labeled by direct incorporation with fluorescent dUTP. Virtual filter set D was used to detect primer-labeled amplicons. Amplicons were sized with Applied Biosystems GeneScan analysis software. Statistical and phylogenetic analyses. The degree of VNTR variability for a locus was assessed by the number of alleles observed or by Nei’s diversity index [DI ⫽ 1 ⫺ ⌺(allele frequency2)]. Because the calculations for Nei’s diversity index were based on allelic frequency, only the 12 mixed-biovar strains were used to calculate the diversity index for each VNTR locus. The neighbor-joining dendrogram was generated using all 42 VNTR marker loci (Table 2) in PAUP4a (software program; D. Swofford, Sinauer Associates, Inc., Sunderland, Mass.). The simple matching coefficient and midpoint rooting options were used for this analysis.
TANDEM REPEATS IN THE YERSINIA PESTIS GENOME
VOL. 39, 2001
3181
TABLE 2. Y. pestis VNTR loci and primers used for their amplificationa CO92 array
Locus
No. of alleles
DIb
Forward primer (5⬘ to 3⬘)
GCCTTGGCGCTGACTCCATTGTGC ⴱFam-GATAGATCTCCGAAGGCAGATCGCAATAG GTC ⴱFam-GACCTCGATCTGCTTAGAACCTTTGTAGCT GTTGC GAAGCGGCAACAATTTACCGTTATTTATGCT GTCACCTCTCAGGCGGGAATCATCTCTC GGGGTGTTAATTGTGAGGCGTGTTGTC ⴱNed-GATTTATGAATGGCTACAACGTCGTCGCA ⴱFam-GCGTGATACCAAAGGCTGGCTCACC ⴱHex-GTTAAAACTTAATTAACCAACTTAAGAGTC GCCATATC ⴱHex-GTTTAGCTGTAAATAGATTTAGAAGCCTCG TCTTTTGAC GCTATTTTTTGCGGTTAGTCACATTTGATATTTG ⴱFam-GTCTAACTGGCGCGGCATTCTTGC GTTTGGCGGTTGGGCGTACCTTGGTA ⴱNed-GAGCGGCGGGTTCTCATGCTGAT
M02 M06
1 by 11 2 by 6
5 2
0.76 0.17
M09
3 by 6
4
0.51
M12c M15 M18 M2 M22 M23
4 5 6 7 7 7
10 2 6 5 12 6.5
7 4 9 3 9 9
0.82 0.57 0.82 0.49 0.82 0.83
M25
7 by 20
10
0.83
M26 M27 M28 M29
8 8 8 8
2 6 7 8
2 10 7 7
0.49 0.84 0.75 0.83
M31
8 by 8
7
0.78
M33 M34 M36 M37 M41 M42 M43 M49 M51 M52 M54 M55
9 by 22 9 by 6 10 by 1 10 by 6 12 by 2 12 by 3 12 by 5 14 by 3 15 by 3 15 by 4 16 by 3 16 by 2
7 11 2 5 3 2 4 2 2 2 3 3
0.76 0.81 0.38 0.72 0.15 0.18 0.69 0.44 0.49 0.49 0.57 0.40
M56 M58
17 by 2 17 by 7.5
3 6
0.40 0.78
M59 M61 M65 M66
17 18 19 20
by by by by
8 5 2.5 2
4 3 3 3
0.68 0.60 0.29 0.50
M68 M69 M71 M72 M73 M74
20 21 21 22 30 36
by by by by by by
3 2 2 2 2 2
3 2 2 2 2 2
0.49 0.00 0.15 0.38 0.28 0.28
M76 M77 M79
41 by 2 45 by 4 8 by 10
2 2 10
0.49 0.15 0.86
a b c
by by by by by by
by by by by
Reverse primer (5⬘ to 3⬘)
ⴱFam-GGTTTGCAGGTTTTTGTTGTGGATTATGGA CTTAGAT ⴱHex-AGCAACCTGTGCCGCCTCGATATAAG ⴱFam-GAATCGCGGGTTGACGCTGTTGAGC GTTAGACAAAACGTTTCTCGATGATTTGTAAGC GCCACAGGAAGAGGACATTTCAGAGAAAAC GCAGGGGACACCGAGCAGATTTATGC GCCGGTAGAGGCGTTGTCTTTGGTTTTTTC GAGTGCGCGACGGTATGGTGC GTAATACTTACGCCTTGGCAGCAGTGTTCACGAC GCAACCCGCTGAAGTTGTAAAAACCGAC GTGGCCTAACCCGTTTTACCGGTGTAGC GTATGCTTAGCGCCAGTGATAACGAGTC GTCATGGGTGATGCTGTTGCTCTCATTTTATAGT TGTAGTGA GTGCCAGTGTTTCGAGCATAGCCAATGAAATAC ⴱHex-GCGATAACCCACATTATCACAATAACCAA CAC ⴱNed-GCTTAGCCGCCAGAAAAGGTGAGTTGGC GCGCCACAATTAGGGCAACTGC GTTGTATGTGCGTTGGTTAGGGAAGGC GAGATGGATTAACCAGATGTCTTAAAAACTATC GTAAC GATAAAGCGCAATGGCAAGAGAAAGC GCGGTGCTGTTGTTAATGATTAGGTGTTCAC GCGTTGCCAGCCGCAGCGATAC GCGACACGCCCTTTCAATGAGATACAC GCTTTCTGGCAATGCGATAGTTAGGCATCTC GATAGAATAGCGCTTCTTTTATTATTGAGATGAT GAC GCGGCCTGATAAGGGATATTGGAAGC GAGTATTGCGAAGGGGTGATAAATGAAGC ⴱFam-GCCCTTATCTACTGGGCCAAGCTAACGC
ⴱHex-GGCCTATTTATCTTAACCACGACTGAACCTC GGGCGATAGGATAGCTTGATGCGTTGTTTTAC GTTGCATTTGTTGGCTAACTGCTGACTGAGTTC ⴱNed-TTTATTCGCCTCCCCTTCGAACTTGAA GCATAACGTCTTCAGTGCGTTGTGGC ⴱHex-CCCTACCCGCCACTCTCTTGGTAGC GTAGTGATACAGGCAAATCCAAGAGCGCA GGCACTTTGGGTACGGAACGTCATCAC GTTATCAGATTTCGCTTGAAGTAGGTTTAACGAT GAC GATATAAATGAGTTGATTCAGGTGTTCATATTTAA CGAAAC GTCCCTTTCCTCACTGGTTCGACTTGTAAG GGGTGTTCTTATGTCATCCGCCAACAAAC ⴱNed-AGCGCCCGTAGACGCTTTCGAAATAGC GTTTAAGCAGTAGATCTAAAGCGTTATGAATATTG GTGTTA GGCGGGATGGCGTATCGGTTGC GAGACGGGCGAAATTGAAGCACAGTTAT GCTGAACAGCCCCATAAAACCGGAGC GACAAACAATAAAAATTCACGATTTATACCCGTC GTTGCTAAAACGATACCGCTACGATCAGC GCTTTCGCTTTAGGCCTGACCTGTTCTGC GTTTTGGGGTTCAGTGCACGCTTGTGAC GCCGCGCATTTATTGATGGTGTC GTGGGGTGTTCTACGGTGGATTGTTTTTAGGC GCGTTGATCTTCGCGGCCTTCAC GCGGTTTTGTCAATCACGAATCAGGACTC GATCGCGTCATCGGGGTTTGTC GCCTTAATGGTTGAATGCGCGAATGAGTCAGAT AAC GTACCGCAGCCCAGACTCCTTACTGGAAAC GCTGATGGAACCGGTATGCTGAATTTGC GATAATGGCGGTAGCCGGAATCTGATAATCATC GCCGCTTTAATGGTTTGTGAAATGAC GTCATTTACTCCGGTAGTTTATTGGGTATTGAAC GCGAATCGGCGGCCCAAAC GCCTGGCAATTGTTCAGCGAATC GCCCTCATCACAAAATACCTAAAATAGTCAATAGC GCACCCCTGCTCTGGGTCACGC GTAGATCACCGCTAAATGCGAAGGTCCAC GTTAATTTAACTCAATATTGTCGCTATGGT GTGCTTGTGGCAGGTGGGTATGAC GGCGAAATTCATTAAAGAGGATCCTGACAC GTGCCAGAGTCCTTGGTTAAACAAATAGAAGAAC GCCATGGCGGGATGTAATGGCAC
The primers marked by an asterisk have a phosphoramidite fluorescent dye (Fam, Hex, or Ned) covalently linked to the 5⬘ nucleotide. DI, Nei’s diversity index. The same VNTR locus as that described by Adair et al. (2); however, the PCR primers differ.
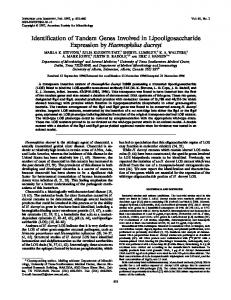
RESULTS VNTR types and occurrence in the Y. pestis genome. In order to identify tandem repeat arrays and potential VNTRs, we examined 105 contigs of Y. pestis genomic sequence undergoing gap closure prior to final assembly. The chromosomal sequence of the CO92 strain was analyzed using two approaches for identifying tandem repeat arrays, Genequest and an SSR search program (7). We used Genequest to identify an average of 2.18 arrays per 10 kbp, with repeat lengths ranging from 1 to 143 bp. SSRs with repeat lengths of 9 bp or less comprised the vast
majority (84%) of all detected tandem repeat arrays. The two most common repeat lengths among these SSRs were 3 and 6 bp (46%) (Fig. 1). Just over half (53%) of all tandem repeat arrays were found in ORFs of at least 700 bp. A substantial portion (72%) of tandem repeat arrays identified in these ORFs had repeat lengths of 3 bp or a multiple of 3. However, a surprisingly large fraction (17%) of ORF tandem repeat arrays contained 7- or 8-bp repeat lengths. Given the high density of genes in most bacterial genomes, the triplet ORF bias and the nontriplet non-ORF bias strongly suggest that tandemly repeated sequences mutate
3182
KLEVYTSKA ET AL.
FIG. 1. Number of tandem repeat sequence arrays in the Y. pestis chromosome. Log of array numbers with repeat lengths from 1 to 21 bp detected by Genequest (black bars) and repeat lengths from 1 to 10 bp detected by the SSR program (gray bars) are presented. Larger repeat lengths of 22, 30, 36, 41, 45, 49, 115, 122, 123, 141, and 145 bp were observed but are not presented, as each was observed only once (except the 123-bp repeat length, which was observed three times).
by insertion and/or deletion events that must stay in frame if present in genes. The two larger Y. pestis plasmids were also analyzed using Genequest in order to identify extrachromosomal tandem repeat arrays. The pCD1 (GenBank accession no. NC_001972) and the pMT1 (GenBank accession no. NC_001976) plasmids had array densities of 2.13 and 2.18 per 10 kbp, respectively. The plasmid results were essentially identical to that of the chromosome direct repeat array composition. Hence, at this stage there is no evidence for gross differences in the repeat array composition between Y. pestis plasmids and its chromosome. While Genequest permits detection of imperfect and nontandem (or interspersed) repeat arrays, it will not detect arrays of less than 9 bp. In contrast, the SSR search program identifies direct repeat arrays with repeat lengths from 1 to 10 bp and was able to identify many additional SSRs that were not discovered via the Genequest analysis. This approach identified 950 SSR arrays per 10 kbp. This is notably higher than the 1.86 SSR arrays per 10 kbp found with Genequest (Fig. 1) and was largely due to the detection of many more short, mononucleotide arrays. The frequency of detected SSR arrays declines logarithmically with increasing repeat length (Fig. 1). The ORF detection program that accompanies the SSR search program was not available for determination of potential ORF bias patterns. Clearly, the SSR search program is effective at identifying very small arrays that the Genequest program misses. The SSR search program, however, does not identify arrays with imperfect repeats or with repeat lengths larger than 10 bp (Fig. 1). In addition, the large number of short, mononucleotide repeat arrays identified by the SSR program are not generally useful as molecular markers because of the difficulty in scoring 1-bp fragment length polymorphisms. The Genequest direct repeat pattern recognition is primarily a function of the human user and, hence, is capable of identifying repeated sequences that are more difficult to define in an algorithm. We find that both programs are useful and complementary in the identification of
J. CLIN. MICROBIOL.
FIG. 2. Tandem repeat array distribution in the Y. pestis chromosome. Array distribution observed per 10-kbp interval (black bars) versus the expected Poisson distribution ( ⫽ 2.14 arrays per 10-kbp interval) (gray bars).
repeated sequence arrays in large genomic sequence databases. In order to discern whether direct repeat arrays (as detected with Genequest) occur randomly or in genomic clusters, their frequency in 10-, 25-, and 50-kbp intervals was compared to a model Poisson distribution (Fig. 2). We found that array frequency did not deviate from random at these three interval scales, as tested by a chi-square test for independence. The observed and Poisson expectations were so close that the chisquare probabilities were equal to 1.0 for all three intervals. Therefore, it appears that direct repeat arrays are randomly distributed in the Y. pestis chromosome over these genomic interval sizes, which are larger than most single genes. It would not be surprising if particular genes were intolerant of repeated sequence arrays. Sequence structure versus diversity. Among 77 direct repeat loci PCR amplified from a group of 12 mixed-biovar strains of Y. pestis, 42 were polymorphic. In order to compare sequence structure parameters with VNTR variability we have determined the diversity and number of alleles at these 42 VNTR loci for 24 selected Y. pestis isolates (Table 2). For these studies, a group of 12 potentially closely related isolates from a restricted geographic range (Siskiyou County, Calif.) were chosen, in addition to the 12 isolates representing all three biovar types from a broad worldwide distribution (Table 1). Among these 42 VNTR loci, the number of alleles observed per locus
FIG. 3. VNTR locus diversity. The 42 VNTR loci examined in this study are displayed based on the total number of alleles present in the 24 strains exampled.
VOL. 39, 2001
TANDEM REPEATS IN THE YERSINIA PESTIS GENOME
3183
FIG. 4. Maximum repeat copy number predicts the number of alleles. Correlation between copy number and allele number observed in 42 polymorphic loci. This is presented for 12 Siskiyou County isolates (open circles and line with short dashes), 12 globally dispersed isolates (open triangles and solid line), and all 24 isolates combined (filled circle and line with long dashes).
ranged from 2 to 11 (Fig. 3). Nei’s diversity index, calculated from allele frequencies observed in the 12 mixed-biovar strains, ranged widely from 0 (only 1 allele detected) to 0.86. Variability at VNTR loci was compared with different sequence structure parameters in order to determine which component provides the greatest power for predicting and understanding VNTR diversity levels. Correlations were performed between copy number, repeat length or array length, and the number of alleles or the diversity index for all 42 VNTR loci. Maximum copy number and number of alleles are highly correlated (R value of 0.86) (Fig. 4). However, this strong relationship is problematic for predictive purposes, because maximum copy number is determined after screening a locus against a group of diverse strains. More useful in a VNTR discovery program is the correlation between the number of alleles and copy number in a reference genomic sequence, such as CO92. In this study this correlation is lower but still of great predictive power at 0.67. The two additional sequence parameters, array length and repeat length, moderately correlate with VNTR diversity. In neither case does the correlation coefficient exceed 0.6, and both are correlated with copy number. Interestingly, the repeat length correlates negatively with the number of alleles (⫺0.50); VNTR arrays with larger repeat lengths display fewer alleles. Among the 35 direct repeat arrays that did not show variability, the SSR category (1- to 10-bp repeat length) exhibited a higher frequency of monomorphism than the larger repeat length arrays. BLAST searches in the NCBI database found that the majority of these monomorphic SSRs showed significant homology to known genes, and they very likely reside in
related ORFs of Y. pestis (data not shown). The SSRs that exhibited polymorphism, however, showed moderate to very high diversity levels. The most diverse VNTRs tended to have repeat lengths between 6 and 9 bp. The arrays with repeat lengths larger than those of SSRs were more often polymorphic but generally showed low diversity levels. Diversity in closely and distantly related isolates. In order to understand the relationship between VNTR diversity and evolutionary time, we have examined the VNTR diversity between the 12 Siskiyou County Y. pestis isolates with that of the 12 global strains. While all Siskiyou County isolates were of the biovar orientalis, the globally dispersed isolates had representatives from the orientalis, mediaevalis, and antiqua biovars. As expected, the mixed-biovar isolates are much more diverse, with an average of 4 alleles per locus versus 1.8 for the Siskiyou County isolates. In addition, the average Nei’s diversity index for the mixed-biovar isolates is 0.54 versus 0.18 for the Siskiyou County samples. With all 24 samples combined, the total number of alleles per locus and the diversity index shift to 4.6 and 0.46, respectively. The slight increase in total allele number when all 24 samples are combined is due to unique alleles in the Siskiyou samples not represented among the four orientalis strains in the global isolate group. Not surprisingly, this contrast indicates a geographic component to polymorphism due to the length of time separating diversifying isolates. Likewise, the maximum copy number effect upon allele number is depressed in the closely related Siskiyou County isolates (Fig. 4). The correlation is only 0.66 for Siskiyou County isolates but is 0.82 for the 12 global isolates. In this case, the geographic proximity may
3184
KLEVYTSKA ET AL.
FIG. 5. Phylogenetic analysis using VNTR loci. Neighbor-joining analysis with midpoint rooting using 42 markers identified genetically similar and dissimilar strains. Biovar identities are indicated in parentheses following the strain names. O, orientalis; M, mediaevalis; A, antiqua. Bootstrap values based upon 1,000 simulations for individual branches are indicated. Branches with no numbers had values of less than 50.
also be an indicator of evolutionary distance. In the Siskiyou County isolates, the VNTR loci have not had sufficient time to fully diversify and therefore exhibit reduced allele number. Because of the differences in diversity among the VNTR loci in this comparison, differential mutation rates among VNTR loci must also be important. Genetic relationships among strains based upon VNTR analysis. A phylogenetic analysis was performed on the 24 Y. pestis isolates using all 42 VNTR loci and the neighbor-joining method. The purpose of this analysis was not to construct an extensive phylogeny for many Y. pestis strains but to identify the utility of VNTRs as molecular markers in Y. pestis using biovar-classified isolates. The resulting phylogenetic tree (Fig. 5) grouped all orientalis biovar isolates into a single clade, supported with a high bootstrap value of 85. This strongly supported branch, of course, also separates the mediaevalis and antiqua biovar isolates from the orientalis isolates. Mediaevalis and antiqua isolates also were consistently categorized to their biovar, with the exception of the Pestoides F strain. Branch lengths among the orientalis isolates were relatively short and frequently well supported by bootstrap values. In contrast, branch lengths among mediaevalis and antiqua isolates were long and seldom supported by strong bootstrap values. This phylogenetic analysis is generally consistent with IS100-based analysis and common biovar evolutionary scenarios (2). DISCUSSION Because Y. pestis is a recently emerged pathogen, very little (2) or no (1) nucleotide variation among strains has been detected in comparative sequencing studies. With nucleotide substitutions so rare, more frequent types of mutational changes are needed for strain identification and phylogenetic analysis. IS100-based analysis is very promising (2), as is multiple-locus VNTR analysis (MLVA), which uses the VNTR-based polymorphism reported here. In both cases, multiple-variable loci are used to provide genome-wide coverage and increase the
J. CLIN. MICROBIOL.
precision in genetic relationship estimation. MLVA has the additional attraction of providing multiple character states at each locus (IS100 RFLPs are binary), which increases discriminatory potential between closely related isolates. Binary data have a maximum possible diversity index value of 0.5 per locus, whereas the multiple allelic VNTRs may approach 1.0 per locus. The greater diversity and, probably, higher mutation rates of VNTRs can provide high-resolution analysis of epidemics where isolates may be very closely related. MLVA is PCR based and requires only small amounts of low-quality DNA templates. With these favorable attributes, MLVA represents a promising approach for the characterization of Y. pestis isolates. Our analysis of the genome has identified numerous potential VNTR loci and defined attributes related to their diversity in natural populations of Y. pestis. The high densities of both large repeat length arrays (ca. 1.86 per 10 kbp) and SSR arrays (ca. 980 per 10 kbp) in the genome offer a plentiful resource for marker development. The contrasting relationships between copy number and diversity and between repeat length and diversity will provide a guide for designing typing systems that match the research goals of particular projects. If phylogenetic analysis of global diversity is required, the less diverse, longer repeat length VNTR loci may be more fruitful for analysis due to slower evolutionary change maintained in the genome. If epidemiological or forensic analysis of a plague outbreak is the goal, the most rapidly evolving, high-copy-number SSR loci are best suited for inclusion in a typing system. Combining multiple loci in an analysis will provide great precision in genetic estimation and minimize the effect of convergent evolution on the analysis. An assumption intrinsic to VNTR analysis is that alleles of the same length are identical (homologous). However, this will not be universally true due to convergent evolution, and it necessitates identity between isolates to be confirmed at multiple loci. The 42 marker loci described in this study will provide a high level of confidence in identifying genetic relationships. The exceedingly high number of direct repeat arrays within the Y. pestis genome may be an important feature of its evolution. More than half of the tandem arrays we identified contain triplet (or multiples of 3 bp) repeat lengths and comprise the majority of direct repeats found in probable protein-coding ORFs. Variation in these VNTRs generated by insertion and/ or deletion events, such as during mismatch repair (10, 21), will not affect the reading frame but rather will change the amino acid sequences in these proteins and may result in altered phenotypes. In addition, VNTRs found in intergenic regions, such as a previously described tetranucleotide VNTR in Y. pestis (2), have the capacity to modify expression of adjacent genes. For example, SSR-mediated phase variation of virulence factor expression in many pathogenic bacteria, including H. influenzae (24), Neisseria spp., and Moraxella catarrhalis (15), is well characterized. Surprisingly, we found that over one quarter of the direct repeats detected in ORFs contain nontriplet repeat lengths, mostly of 7 or 8 bp. Nontriplet repeat array variation within coding regions has the potential to radically modify proteins and shift bacterial phenotypes. However, such variation is expected most often to produce a frameshift mutation, leading to loss-of-function or undetected lethal phenotypes. Nontriplet
TANDEM REPEATS IN THE YERSINIA PESTIS GENOME
VOL. 39, 2001
tandem repeat-associated loss-of-function mutations have been previously characterized for Y. pestis. The spontaneous loss of Psn, the yersiniabactin/pestin receptor, arises from a 5-bp deletion, removing one of a pair of tandem pentameric repeats in psn (11, 20). The naturally nonureolytic state of Y. pestis has also been attributed to urease silencing by the addition of a single G residue at a poly(G) tract in ureD (19). Hence, the high frequency of monomorphism we observed among SSRs found in ORFs may reflect a selective bias against such highstakes changes that accompany nontriplet repeat variation. These observations have two consequences for our understanding of the Y. pestis genome. First, the mechanisms (e.g., mismatch repair) responsible for tandemly repeated sequences and their associated variation are potent. Their random distribution suggests that VNTR development can occur throughout the genome and that selection against debilitating mutation defines VNTR composition within genes. Secondly, there is tremendous potential for generating genetic diversity within protein-coding genes over a very short evolutionary time. The diversity associated with VNTRs is great, especially in contrast to the lack of nucleotide substitutions among Y. pestis strains. Evolutionary adaptation of Y. pestis as it has moved across the globe and into new hosts, vectors, and reservoirs would require genetic variation. As a recently emerged pathogen, VNTR diversity along with other highly mutable loci (e.g., IS elements) may have played an important role in Y. pestis evolution in the recent past.
6. 7. 8. 9.
10. 11. 12.
13.
14.
15.
16. 17.
ACKNOWLEDGMENTS This work was supported, in part, by funds from the U.S. Department of Energy—NN20/CBNP, National Institutes of Health, and the Cowden Endowment in Microbiology. We thank Christine Keys and an anonymous referee for reviewing the manuscript and making critical suggestions. REFERENCES 1. Achtman, M., K. Zurth, G. Morelli, G. Torrea, A. Guiyoule, and E. Carniel. 1999. Yersinia pestis, the cause of plague, is a recently emerged clone of Yersinia pseudotuberculosis. Proc. Natl. Acad. Sci. USA 96:14043–14048. (Erratum, 97:8192, 2000.) 2. Adair, D. M., P. L. Worsham, K. K. Hill, A. M. Klevytska, P. J. Jackson, A. M. Friedlander, and P. Keim. 2000. Diversity in a variable-number tandem repeat from Yersinia pestis. J. Clin. Microbiol. 38:1516–1519. 3. Britten, R. J., and D. E. Kohne. 1968. Repeated sequences in DNA. Hundreds of thousands of copies of DNA sequences have been incorporated into the genomes of higher organisms. Science 161:529–540. 4. Brubaker, R. R. 1991. Factors promoting acute and chronic diseases caused by yersiniae. Clin. Microbiol. Rev. 4:309–324. 5. Buchrieser, C., C. Rusniok, L. Frangeul, E. Couve, A. Billault, F. Kunst, E. Carniel, and P. Glaser. 1999. The 102-kilobase pgm locus of Yersinia pestis: sequence analysis and comparison of selected regions among different Yer-
18. 19. 20. 21. 22. 23. 24. 25.
3185
sinia pestis and Yersinia pseudotuberculosis strains. Infect. Immun. 67:4851– 4861. Guiyoule, A., F. Grimont, I. Iteman, P. A. Grimont, M. Lefevre, and E. Carniel. 1994. Plague pandemics investigated by ribotyping of Yersinia pestis strains. J. Clin. Microbiol. 32:634–641. Gur-Arie, R., C. J. Cohen, Y. Eitan, L. Shelef, E. M. Hallerman, and Y. Kashi. 2000. Simple sequence repeats in Escherichia coli: abundance, distribution, composition, and polymorphism. Genome Res. 10:62–71. Jeffreys, A. J., V. Wilson, and S. L. Thein. 1992. Hypervariable ’minisatellite’ regions in human DNA. Bio/Technology 24:467–472. Keim, P., L. B. Price, A. M. Klevytska, K. L. Smith, J. M. Schupp, R. Okinaka, P. J. Jackson, and M. E. Hugh-Jones. 2000. Multiple-locus variable-number tandem repeat analysis reveals genetic relationships within Bacillus anthracis. J. Bacteriol. 182:2928–2936. Levinson, G., and G. A. Gutman. 1987. Slipped-strand mispairing: a major mechanism for DNA sequence evolution. Mol. Biol. Evol. 4:203–221. Lucier, T. S., J. D. Fetherston, R. R. Brubaker, and R. D. Perry. 1996. Iron uptake and iron-repressible polypeptide in Yersinia pestis. Infect. Immun. 64: 3023–3031. Lucier, T. S., and R. R. Brubaker. 1992. Determination of genome size, macrorestriction pattern polymorphism, and nonpigmentation-specific deletion in Yersinia pestis by pulsed-field gel electrophoresis. J. Bacteriol. 174: 2078–2086. Marshall, D. G., D. C. Coleman, D. J. Sullivan, H. Xia, C. A. O’Morain, and C. J. Smyth. 1996. Genomic DNA fingerprinting of clinical isolates of Helicobacter pylori using short oligonucleotide probes containing repetitive sequences. J. Appl. Bacteriol. 81:509–517. Nakamura, Y., M. Leppert, P. O’Connell, R. Wolff, T. Holm, M. Culver, C. Martin, E. Fujimoto, M. E. Hoff. Kumlin, et al. 1987. Variable number of tandem repeat (VNTR) markers for human gene mapping. Science 235: 1616–1622. Peak, I. R., M. P. Jennings, D. W. Hood, M. Bisercic, and E. R. Moxon. 1996. Tetrameric repeat units associated with virulence factor phase variation in Haemophilus also occur in Neisseria spp. and Moraxella catarrhalis. FEMS Microbiol. Lett. 137:109–114. Perry, R. D., and J. D. Fetherston. 1997. Yersinia pestis—etiologic agent of plague. Clin. Microbiol. Rev. 10:35–66. Poh, C. L., V. Ramachandran, and J. W. Tapsall. 1996. Genetic diversity of Neisseria gonorrhoeae IB-2 and IB-6 isolates revealed by whole-cell repetitive element sequence-based PCR. J. Clin. Microbiol. 34:292–295. Price, L. B., M. Hugh-Jones, P. J. Jackson, and P. Keim. 1999. Genetic diversity in the protective antigen gene of Bacillus anthracis. J. Bacteriol. 181: 2358–2362. Sebbane, F., A. Devalckenaere, J. Foulon, E. Carniel, and M. Simonet. 2001. Silencing and reactivation of urease in Yersinia pestis is determined by one G residue at a specific position in the ureD gene. Infect. Immun. 69:170–176. Sikkema, D. J., and R. R. Brubaker. 1987. Resistance to pesticin, storage of iron, and invasion of HeLa cells by yersiniae. Infect. Immun. 55:572–578. Strand, M., T. A. Prolla, R. M. Liskay, and T. D. Petes. 1993. Destabilization of tracts of simple repetitive DNA in yeast by mutations affecting DNA mismatch repair. Nature 365:274–276. (Erratum, 368:569, 1994.) van Belkum, A., S. Scherer, L. van Alphen, and H. Verbrugh. 1998. Shortsequence DNA repeats in prokaryotic genomes. Microbiol. Mol. Biol. Rev. 62:275–293. van Belkum, A., S. Scherer, W. van Leeuwen, D. Willemse, L. van Alphen, and H. Verbrugh. 1997. Variable number of tandem repeats in clinical strains of Haemophilus influenzae. Infect. Immun. 65:5017–5027. Weiser, J. N., D. J. Maskell, P. D. Butler, A. A. Lindberg, and E. R. Moxon. 1990. Characterization of repetitive sequences controlling phase variation of Haemophilus influenzae lipopolysaccharide. J. Bacteriol. 172:3304–3309. Young, W. P., J. M. Schupp, and P. Keim. 1999. DNA methylation and AFLP marker distribution in the soybean genome. Theor. Appl. Genet. 99: 785–790.