Journal of Life Sciences and Technologies Vol. 4, No. 2, December 2016
Identification of SNP-SNP Interaction Using Entropy-Based Multifactor Dimensionality Reduction in Case-Control Studies Cheng-Hong Yang and Cheng-Han Wu Department of Electronic Engineering, National Kaohsiung University of Applied Sciences, Kaohsiung, Taiwan Email:
[email protected],
[email protected]
Li-Yeh Chuang Department of Chemical Engineering, I-Shou University, Kaohsiung, Taiwan Email:
[email protected]
Abstract—Diseases susceptibility plays an important role in genome-wide association study (GWAS). There are complex relationships between genotypes and environment factors in diseases. Due to the nonlinear relationship, the identification methods are met a challenge to detect gene-gene interaction or gene-environment interactions. In this study, EntropyBased Multifactor Dimensionality Reduction (EMDR) was used for identification of the single nucleotide polymorphisms (SNPs) interaction effects. MDR method is able to identify the interaction by trying n-locus interaction brute force. The proposed method uses K-way entropy based information gain as the filter for preprocessing, and then picks the suggested percentage of n-locus SNP combinations. Entropy-based interaction was compared with the searching way of MDR based on the ranking of interaction gain value. The Gametes simulation datasets were used to test the top percentage chosen for MDR, and the real kidney data was used to proof the ability of EMDR.
An efficiency method to identify the specific interactions from a huge amount of SNP or environment factors is become the hot topic in GWAS. Most of the traditional statistical methods can only detect a SNP factor in linear relationship between genetic marker with disease [3], [4]. However, the relationship between SNP and environment interactions is nonlinear in a complex disease. Even a SNP has been identified to have small effect on the heritability of complex disease; the combination of several SNPs could be highly associated with the disease susceptibility. The high-dimension of SNP data remains the other challenge in the analyzing methods due to lack of computation effectiveness in traditional linear parametric methods. To overcome the challenges of identification in SNP and environment factors interactions, many algorithms were proposed to conquer the problems, e.g., Genetic Algorithm (GA) [5], logic regression [6]-[8], Polymorphism Interaction Analysis (PIA) [9] and Multifactor Dimensionality Reduction (MDR) [10]. Here, the main structure of the proposed method is based on MDR algorithm. MDR classifies the high-dimension data into high risk group or low risk group by reorganizing the amount of SNP-SNP characterization in a “Cell”, the base unit of MDR. The cell can be declared as the high risk group through the threshold of the cell. In this study, the process of MDR method was maintained, but the selection step of the variables number was discarded. The entropy-based MDR uses the interaction gain [11] as a preprocess of MDR. EMDR leaves a number of SNP combinations that doesn’t pass the threshold of gain limit. In this way, we can save the computational time through dislodging the SNP combinations with low gain value. In this study, two 2-order GAMETES [12] model and two 3-order GAMETES models were selected for testing the cut line, and each Gametes model has 2 sets of SNP number (50SNP, 100SNP), 3 sets of case-control number (Case: Control = 200: 200, Case: Control = 500: 500, Case: Control = 1000: 1000), and each combine setting has 100 experiments. In total, there are 4 × 2 × 3 × 100 = 1200 simulation data for testing the gain list cut line.
Index Terms—entropy-based interaction gain, SNP-SNP interaction, multifactor dimensionality reduction, Gametes
I.
INTRODUCTION
Due to the huge amount of data produced from the Next Generation Sequencing Technologies (NGSTs), the Genome Wide Association Study (GWAS) becomes an important role in bioinformatics. In fact, an individual factor may not be the cause of a disease, but may lead to a high risk of disease susceptibility. To determine an individual is in the risk group (case) or in the low risk group (control) depends on the interactions between genetic and environment factors. Single Nucleotide Polymorphisms (SNPs), the common genetic variants between different human beings, have become the main elements to determine the particular disease susceptibility. According to the features of SNPs, GWAS is widely applied on the identification of gene-gene interaction or gene-environment interactions to determine the disease susceptibility [1], [2].
Manuscript received April 25, 2016; revised July 5, 2016.
© 2016 Journal of Life Sciences and Technologies doi: 10.18178/jolst.4.2.60-65
60
Journal of Life Sciences and Technologies Vol. 4, No. 2, December 2016
II.
METHODS
sample in case group and with the low risk cell is labeled as False Negative group (FN). The error rate is calculated to determine the prediction ability of a filter. Therefore, the error rate would be a ratio of false predition amount to all sample amount. The accuracy of training data sets and test data sets is calculated as the Eq. (1) by the contingency table of SNP problem in Table I.
A. Multifactor Dimensionality Reduction The results of this study were obtained by the MDR method with cross-validation. Before the MDR processing, the number of polymorphisms was decided, and then started the MDR processing. In the first step, the data was divided into 9/10 training dataset and 1/10 test dataset (for a 10 fold cross-validation); the data should be random shuffle the order of samples in the whole data by a random seed. The random shuffle process is able to avoid the case or control samples concentrated to a certain subset or area. Even though the data is ceoncentrated to a certain subset after the random shuffle process, the data division can be reorganized through several times of cross-validation by using different seed to random shuffle the sample order in dataset. Hence, the final results turn to avoid the particular situation. In the second step, the number of a polymorphisms set was selected from the beginning. In the third step, the number of different class (case and control) in a polymorphisms set with different genotype was calculated. Then, the ratio of case number to control number in whole data was used as the threshold. If the ratio of the cell is higher than the threshold, then the cell is described as the high risk group. For example, assume the MDR cell is 2 polymorphisms and there are 3 avalible genotypes in each polymorphism. Then, the MDR cell has 9 sub cells in it as shownin Fig. 1. Each sub cell was calculated to obtain a ratio of case to control. Then, based on the ratio value, the sub cell could be discribed as high risk group if the ratio is met or exceed the threshold.
Error rate (X i )
FPi FN i TPi FPi FN i TNi
(1)
TABLE I. THE CONTINGENCY TABLE IN SNP PROBLEM High risk cell
Low risk cell
Case
TP
FN
Control
FP
TN
B. Entropy-Based Interaction Gain 1) Definitions The entropy is the value measuring the uncertainty associated with a random variable or a random system. The entropy H(X) of a discrete random variable X is defined as equation (2):
p( x) log p( x)
H ( X ) E[log P( X )]
(2)
x
The disease status of an individual is denoted by D. If D = 0, the individual is labeled as control. If D = 1, the individual is labeled as case. To identify the interactions between two di-allelic markers, A, B and C (SNPA, SNPB, and SNPC), the genotypes of SNPA, SNPB and SNPC are denoted as GA, GB and GC, shown as the equation (3) below.
2 AA 2 BB 2 CC G A 1 Aa , G B 1 Bb , GC 1 Cc 0 aa 0 bb 0 cc
(3)
2) Interaction gain In the literature, genetic markers and environmental factors are treated as attributes. Using the entropy definition (1), we can define the entropy H(A) of marker A in the general population and the conditional entropy H(A|D) in the affected population as equation (4) and (5). genotype
H ( A)
P(G
A
i) log P(G A i)
(4)
i 0
P(G 2
H ( A | D)
A
i | D case) log P(GA i | D case)
(5)
i 0
3) Two way interaction gain The mutual information measures the interaction between two markers. In the general population, the mutual information of markers A and B, I(A, B), is defined as
Figure 1. The description of a base MDR unit
In MDR, the error rate is the evaluation value of the SNP-SNP interaciton. The error rate is according to the contingency table that is divided into 4 groups. The sample in case group and with the high risk cell is labeled as True Positive group (TP). The sample in control group and with the high risk cell is labeled as False Positive group (FP). The sample in control group and with the low risk cell is labeled as True Negative group (TN). The © 2016 Journal of Life Sciences and Technologies
I ( A, B) H ( A) H ( B) H ( A, B) P(G A i, G B j ) P(G A i, G B j ) log P(G A i) P(G B j ) j 0
2
i 0
2
(6)
In the affected population, the mutual information of markers A and B is defined as 61
Journal of Life Sciences and Technologies Vol. 4, No. 2, December 2016
I ( A, B | D ) H ( A | D ) H ( B | D ) H ( A, B | D ) P (G A i , G B j | D case) 2 2 P (G A i , G B j | D case) log i 0 j 0 P (G A i | D case) P (G B j | D case) 11. 12.
The information gain of markers A and B in the presence of a disease can be defined as the difference between the mutual information in the affected population and that in the general population [13].
IG( AB | D) I ( A, B | D) I ( A, B)
13. 14.
(8)
15. 16.
4) Three way interaction gain In the general population, we denote the joint genotype probabilities for markers A, B and C by Pije = P(GA = i, GB = j, GC = e). In the affected population, we denote the joint conditional genotype probabilities by Qije = P(GA = i, GB = j, GC = e|D = 1). Denote Pi··= Σ2j=0Σ2e=0Pije, P·j·= Σ2i=0Σ2e=0Pije, P··e = Σ2i=0Σ2j=0Pije. Similarly, Qi··, Q·j·, and Q··e can be defined in a similar manner. Denote Pij·= Σ2e=0Pije, P·je = Σ2i=0Pije, Pi·e = Σ2j=0Pije. Similarly, Qi··, Q·j·, and Q··e can be defined in a similar manner.
fije Pije log
Pije Pi P j Pe
, gije Qije log
Qije QiQ jQe
17. 18. 19. 20. 21. 22. 23. 24. 25.
Pije Pi P j Pe Pij P je Pie
, lije Qije log
Qije QiQ jQe Qij Q je Qie
III.
1) GAMETES datasets GAMETES is a tool for generating 2-locus, 3-locus models with random architectures. GAMETES is focused on generating the lower heritability models that typically used in simulation studies. In the case, the extremely strict models can be tried to evaluate the identification algorithms for SNP interaction. There are two 2-locus GAMETES models and two 3-locus GAMETES models were used in this study. Two of the 2-locus models are the models with marginal effects. Junghyun Namkung et al. developed Models 1 (Table III) and 2 (Table IV) [14] by varying the strength of genetic effects while fixing the interaction structure, the minor allele frequency (MAF) and prevalence.
(10)
IIG ( ABC | D) I ( A, B, C | D) I ( A, B, C )
2
i 0
2
j 0
2
e0
lije
h 2
2
2
i 0
j 0
e0
(11)
ije
C. Entropy-based MDR The entropy-based MDR uses gain value of interaction information as the suggestion. The suggestion is a ranking list in order. The SNP sets with a higher gain value would be put at the front of the list. The ranking list is similar as a pool that is feeded with the polymorphisms sets into the MDR process in order. In the way, we can reduce the redundancy SNP sets to join the MDR process for saving the computational time meaningfully. The psudocode is show as Table II.
TABLE III.
4. 5. 6. 7. 8. 9. 10.
TABLE IV.
AA 0.060 0.010 0.010
Aa 0.010 0.208 0.208
aa 0.010 0.208 0.208
PREVALENCE.VALUES OF 2-LOCUS MODEL 2. BB Bb bb
Interaction gain phase: For S = 1 to the last SNPs combination. Calculating the interaction gain value by n way interaction gain. End S End interaction gain phase MDR phase: Divide data into 10 subsets randomly. For D = 1 to 10 subsets Training data: For S = 1 to the cutline of interaction gain
© 2016 Journal of Life Sciences and Technologies
PREVALENCE.VALUES OF 2-LOCUS MODEL 1. BB Bb bb
TABLE II. EMDR PSEUDO CODE 1. 2. 3.
RESULTS AND DISCUSSION
A. Results
The interaction information gain A, B and C would be denoted as
For C = 1 to all combination of genotypes Determine the high/low risk groups in C MDR sub-cell. End C Compute the error rate of S SNP combination. End S Choose the best combination with the least error rate. End training data Test data: Compute the best combination in the test data. End test data Collect the best combination into consistency set. End D Compute cross-validation consistency from consistency set. Choose the best combination with the least error rate in test data. End MDR phase
(9)
Denote Pije = Σ 2e=0 Pije, P·je = Σ 2i=0 Pije, Pi·e = Σ 2j=0 Pije. Similarly, Qi··, Q·j·, and Q··e can be defined in a similar manner.
hije Pije log
(7)
AA 0.061 0.017 0.017
Aa 0.017 0.136 0.136
aa 0.017 0.136 0.136
Two of the 3-locus models are called XOR model [15] (Table V) and ZZ model [16], [17] (Table VI), respectively. XOR model is a nonlinear epistasis model, and the high risk of disease is dependent on inheriting a heterozygous genotype from one locus or a heterozygous genotype from another locus, but not all loci. In ZZ
62
Journal of Life Sciences and Technologies Vol. 4, No. 2, December 2016
model, the high risk of disease is dependent upon inheriting exactly two high risk alleles from two loci. The simulation data was set at 50 or 100 SNP number and 400, 1000 or 2000 sample size for each model. TABLE V. PENETRANCE VALUES FOR COMBINATIONS OF GENOTYPES FROM THREE SNPS EXHIBITING INTERACTIONS IN THE ABSENCE OF INDEPENDENT MAIN EFFECTS. (XOR MODEL)
BB Bb bb
AA 0.4 0.9 0.1
CC Aa 0.9 0.0 0.2
aa 0.7 0.9 0.6
AA 0.2 0.6 0.3
Cc Aa 0.2 0.9 0.6
aa 0.6 0.0 0.3
AA 1.0 0.3 0.3
Cc Aa 0.4 0.1 0.9
aa 0.5 0.6 1.0 Figure 3. The gain value of two 2-locus marginal effect model and 3locus ZZ, XOR model with different SNP and sample size.
TABLE VI. PENETRANCE VALUES FOR COMBINATIONS OF GENOTYPES FROM TWO GENES EXHIBITING INTERACTIONS TO 3-LOCUS EXTENSION. (ZZ MODEL)
BB Bb bb
AA 0 0 1
CC Aa 0 0 0
aa 1 0 1
AA 1 0 1
Cc Aa 0 0.5 0
aa 1 0 1
AA 1 0 1
cc Aa 0 0 0
aa 1 0 0
2) Cut line EMDR uses MDR as a based algorithm and entropybased interaction gain as preprocess. The ranking list lists the gain values in order. Only a percentage of data from the ranking list is sent into the MDR for figuring out the best training model. Therefore, the definition of cutline is important. A good cutline of ranking list can abandon the SNP combinations with lower gain values into the SNP combination pool of MDR, but still maintains the high accuracy as the standard MDR.
Figure 4. The identification accuracy of MDR and EMDR in different GAMETES simulation data setting. (2-locus model1)
Figure 5. The identification accuracy of MDR and EMDR in different GAMETES simulation data setting. (2-locus model2)
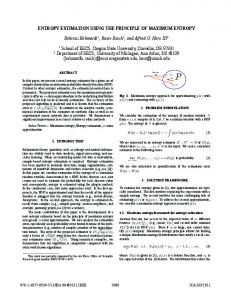
Figure 2. The ranking of two 2-locus marginal effect model and 3locus ZZ, XOR model with different SNP and sample size.
Here, the cutline of ranking list is discussed by detecting the ranking of SNP combinations in the simulation data. As shown in Fig. 2, the ranking of target SNP combinations revealed lower than 50 percentage of the SNP combinations in the selection pool except that of the 3-locus of ZZ model. The obtained gain values are shown in Fig. 3. The gain values obtained from 2-locus models were close to 0. However, the gain values of 3-locus models were increased and higher than 2-locus models. In addition, no matter the SNP number is getting higher, the average gain value is kept at the same level in same model.
© 2016 Journal of Life Sciences and Technologies
Figure 6. The identification accuracy of MDR and EMDR in different GAMETES simulation data setting. (3-locus ZZ model)
63
Journal of Life Sciences and Technologies Vol. 4, No. 2, December 2016
comparison of the identification accuracy of MDR and ENDR, the EMDR can keep the stability of accuracy for all of the test data sets. The superior performance of EMDR is due to EMDR removed the rundancy pair of SNP combination. Without the perturbation of rundancy pair of SNP combaintion, EMDR can easily keep the high accuracy even the fold is unbalance. In Fig. 6, EMDR showed worse performance than MDR. That might be caused by the interaction information gain ranking list. The list missed the useful SNP combinations due to divide the wrong group among the gain value of SNP combinations. EMDR was not able to search the correct SNP combination in the selection pool. Thus, EMDR obtained lower accuracy than MDR in the 3-locus of ZZ model.
3) Comparison of MDR and EMDR Fig. 4-Fig. 7 show the identification accuracy of MDR and EMDR in different GAMETES simulation data sets (symbol A to F). Symbol A is 50 SNPs with 400 sample size. Symbol B is 50 SNPs with 1000 sample size. Symbol C is 50 SNPs with 1000 sample size. Symbol D is 100 SNPs with 400 sample size. Symbol E is 100 SNPs with 1000 sample size. Symbol F is 100 SNPs with 2000 sample size. As shown in Fig. 4, the accuracy line of MDR and EMDR are same in the 2-locus model 1. In the 2-locus model 2, the accuracy line of MDR and EMDR become different (Fig. 5); EMDR method showed higher accuracy than MDR for the GAMETES data sets A and D. However, the MDR method revealed higher accuracy than EMDR in 3-locus ZZ model for all of the GAMETES data sets (Fig. 6). Same as the 2-locus model 1, the accuracy line of MDR and EMDR are same in the 3-locus XOR model (Fig. 7).
IV.
The method of multifactor dimensionality reduction (MDR), a nonparametric method, is a good tool that divides high dimensional data into one dimension. MDR plays an important role on the identification of gene interaction. However, there is a drawback for MDR due to its unbalance folding. With the unbalance folding of MDR, the lower accuracy or missing selection is come behind. EMDR is proposed to solve the problem of unbalance folding. The results indicated that EMDR provided a better identification while the important SNP combinations were in the gain ranking list for interaction information. EMDR is able to use the interaction information gain list to pool the SNP combinations to target group and remove the redundancy group meaningfully. With abandoning the redundancy group of SNP combinations, EMDR would save the computational time on identification of the interaction of SNP combinations. However, based on the current study results, the entropy-based interaction gain can’t correctly pool the SNP combinations to the target group and remove the redundancy group. That would make EMDR never select the target SNP combination, instead select the close solution. We expect raising the precision of interaction information gain can be proposed in the future work.
Figure 7. The identification accuracy of MDR and EMDR in different GAMETES simulation data setting. (3-locus XOR model)
B. Discussion In this paper, the ability of EMDR and MDR is evaluated for the identification of SNPs interaction. In the experiment of interaction gain ranking list, the most interesting part is the ZZ model in the whole experiment. The ranking percentage of target SNP combinations is significant high, even higher than 75%. The reason might be due to inexistence of the main effect in the ZZ model, and the other 3 models in 2-locus or 3-locus might exist more or less of the main effects. Thus, we hypothesize the existence of main effect may influence the information gain value of the combination items. In the accuracy test experiment, we compared the identification accuracy between MDR and EMDR methods. Before the experiment, we assumed that if the target SNP combination didn’t get into the MDR selection pool, the EMDR won’t select the correct SNP combination, and the accuracy of EMDR would be lower than MDR. In Fig. 4 and Fig. 7, the MDR performance is exactly same as EMDR. That is because of the target SNP combination is in the gain ranking list, and MDR is not lose control. The MDR method randomly shuffles the order of samples in the whole data to avoid the unbalance sub-data in any fold. If the unbalance sub-data exist, the MDR would made a mistake to choose the SNP combination with a lower interaction. As shown in Fig. 5,
© 2016 Journal of Life Sciences and Technologies
CONCLUSION
ACKNOWLEDGMENT This study was partly supported by the National Science Council of Taiwan for Grant NSC 103-2221-E151-029-MY3. REFERENCES [1]
[2]
[3]
64
P. Li, M. Guo, C. Wang, X. Liu, and Q. Zou, “An overview of SNP interactions in genome-wide association studies,” Briefings in Functional Genomics, p. elu036, 2014. J. H. Moore, F. W. Asselbergs, and S. M. Williams, “Bioinformatics challenges for genome-wide association studies,” Bioinformatics, vol. 26, pp. 445-455, 2010. D. J. Balding, “A tutorial on statistical methods for population association studies,” Nature Reviews Genetics, vol. 7, pp. 781-791, 2006.
Journal of Life Sciences and Technologies Vol. 4, No. 2, December 2016
[4]
[5]
[6]
[7]
[8]
[9]
[10]
[11]
[12]
[13]
[14]
[15] J. H. Moore, L. W. Hahn, M. D. Ritchie, T. A. Thornton, and B. C. White, “Routine discovery of complex genetic models using genetic algorithms,” Applied Soft Computing, vol. 4, pp. 79-86, 2004. [16] J. H. Moore, L. W. Hahn, M. D. Ritchie, T. A. Thornton, and B. C. White, “Application of genetic algorithms to the discovery of complex models for simulation studies in human genetics,” in Proc. Genetic and Evolutionary Computation Conference/GECCO. Genetic and Evolutionary Computation Conference, 2002, p. 1150. [17] W. N. Frankel and N. J. Schork, “Who's afraid of epistasis?” Nature Genetics, vol. 14, pp. 371-373, 1996.
X. Wu, H. Dong, L. Luo, Y. Zhu, G. Peng, J. D. Reveille, et al., “A novel statistic for genome-wide interaction analysis,” PLoS Genet, vol. 6, p. e1001131, 2010. H. W. Chang, L. Y. Chuang, C. H. Ho, P. L. Chang, and C. H. Yang, “Odds ratio-based genetic algorithms for generating SNP barcodes of genotypes to predict disease susceptibility,” OMICS A Journal of Integrative Biology, vol. 12, pp. 71-81, 2008. I. Dinu, S. Mahasirimongkol, Q. Liu, H. Yanai, N. S. Eldin, E. Kreiter, et al., “SNP-SNP interactions discovered by logic regression explain Crohn's disease genetics,” PloS One, vol. 7, p. e43035, 2012. S. Prabhu and I. Pe'er, “Ultrafast genome-wide scan for SNP–SNP interactions in common complex disease,” Genome Research, vol. 22, pp. 2230-2240, 2012. M. Li, S. W. Erickson, C. A. Hobbs, J. Li, X. Tang, T. G. Nick, et al., “Detecting maternal‐fetal genotype interactions associated with conotruncal heart defects: A haplotype‐based analysis with penalized logistic regression,” Genetic Epidemiology, vol. 38, pp. 198-208, 2014. L. E. Mechanic, B. T. Luke, J. E. Goodman, S. J. Chanock, and C. C. Harris, “Polymorphism interaction analysis (PIA): A method for investigating complex gene-gene interactions,” BMC Bioinformatics, vol. 9, p. 1, 2008. L. W. Hahn, M. D. Ritchie, and J. H. Moore, “Multifactor dimensionality reduction software for detecting gene–gene and gene–environment interactions,” Bioinformatics, vol. 19, pp. 376382, 2003. R. Fan, M. Zhong, S. Wang, Y. Zhang, A. Andrew, M. Karagas, et al., “Entropy‐based information gain approaches to detect and to characterize gene ‐ gene and gene ‐ environment interactions/correlations of complex diseases,” Genetic Epidemiology, vol. 35, pp. 706-721, 2011. R. J. Urbanowicz, J. Kiralis, N. A. Sinnott-Armstrong, T. Heberling, J. M. Fisher, and J. H. Moore, “GAMETES: A fast, direct algorithm for generating pure, strict, epistatic models with random architectures,” BioData Mining, vol. 5, p. 1, 2012. J. H. Moore, J. C. Gilbert, C. T. Tsai, F. T. Chiang, T. Holden, N. Barney, et al., “A flexible computational framework for detecting, characterizing, and interpreting statistical patterns of epistasis in genetic studies of human disease susceptibility,” Journal of Theoretical Biology, vol. 241, pp. 252-261, 2006. R. J. Urbanowicz, A. L. Granizo-Mackenzie, J. Kiralis, and J. H. Moore, “A classification and characterization of two-locus, pure, strict, epistatic models for simulation and detection,” BioData Mining, vol. 7, p. 1, 2014.
© 2016 Journal of Life Sciences and Technologies
Cheng-Hong Yang is a professor of the Department of Electronic Engineering at National Kaohsiung University of Applied Sciences, Tai-wan. He received his M.S. and Ph.D. degrees in computer engineering from North Dakota State University in 1988 and 1992, respectively. His main areas of research are evolutionary computation, bioinformatics, and assistive tool implementation.
Cheng-Han Wu is a master student of the Department of Electronic Engineering at National Kaohsiung University of Applied Sciences, Tai-wan. He received his bachelor degree from the Department of Computer Science and Information Engineering at National Kaohsiung University of Applied Sciences, Kaohsiung, Taiwan. His research interests include evolutionary computation, data mining, machine learning, and bioinformatics. Li-Yeh Chuang is a professor and director of the Department of Chemical Engineering & Institute of Biotechnology and Chemical Engineering at I-Shou University, Kaohsiung, Taiwan. She received her M.S. degree from the Department of Chemistry at the University of North Carolina in 1989 and her Ph.D. degree from the Department of Biochemistry at North Dakota State University in 1994. Her main areas of research are Bioinformatics, Biochemistry and Genetic Engineering.
65