Critical for High-Performance cIEF. Ingrid D. ... collected was measured with a pipet and adjusted to yield an IgG ... in cIEF and can result in differences in peak.
Application Information
Identification of System Parameters Critical for High-Performance cIEF Ingrid D. Cruzado-Park, Scott Mack and Chitra K. Ratnayake Beckman Coulter, Inc., Fullerton, CA, USA
Introduction Capillary Isoelectric Focusing (cIEF) is a unique and powerful capillary electrophoretic technique. In this procedure, a capillary is filled with a mixture of sample and ampholytes and the ends are submerged in anolyte (acidic) and catholyte (basic) solutions. Voltage is then applied across the capillary to form a pH gradient, in which ampholytes and sample are focused at their respective isoelectric point (pI). Addition of pI markers within the cIEF gradient allows for the reproducible determination of pI for the sample. The cIEF analysis requires proper optimization of various factors in order to achieve high-quality results. Factors to be considered for optimization include degree of protein solubility, strategies for sample mobilization, anolyte and catholyte concentrations, and pH gradient stability. Beginning with currently available cIEF chemistry, we step through these key areas to consider for optimization of this technique. This article describes a holistic approach to maximizing resolution and reproducibility in cIEF separations.
Experimental Instrument. All experiments were performed using a PA 800 Protein Characterization System (Beckman Coulter, Inc., Fullerton, CA) equipped with a UV detector and a 280 nm filter (p/n 144439). Data was collected and analyzed using 32 Karat™ Software. The installed Neutral Capillary (Beckman Coulter, p/n 477441) was 30.2 cm long (20 cm from injector to detector). The capillary temperature was maintained at 20°C in all separations. Normal polarity was used during voltage application.
A-11634A
Chemicals and Materials. cIEF separations were performed using the components of the cIEF kit (Beckman Coulter, p/n 477490) as described in the kit User Guide, unless specified otherwise. Anolyte consisting of 91 mM phosphoric acid was prepared by mixing 1.7 mL of cIEF gel with 170 µL of 1 M phosphoric acid in a 2 mL glass vial (Beckman Coulter, p/n 144980). Catholyte consisting of 20 mM sodium hydroxide was prepared by mixing 36 µL of 1 M NaOH with 1.8 mL of double-deionized (DDI) water in a 2 mL glass vial. The acid rinse wash (10 mM phosphoric acid) was prepared by mixing 1.8 mL of DDI water and 18 µL of 1 M phosphoric acid in a 2 mL glass vial. All three solutions were freshly prepared at the start of each working day and used for no more than eight consecutive cIEF runs. The cIEF kit (p/n 477490) includes four proteins as pI markers: ribonuclease A (24 mg/mL, pI 9.45), carbonic anhydrase II (4 mg/mL, pI 5.9), β-lactoglobulin A (4 mg/mL, pI 5.1) and CCK flanking peptide (2 mg/mL, pI 3.6). Human hemoglobin AF was obtained from Beckman Coulter (p/n 667630). Synthetic peptides were manufactured and used as pI markers. Pharmalyte* 310 (p/n 17-0456-01) and Pharmalyte 5-8 (p/n 170453-01) were from GE-Healthcare Bio-Sciences AB (Uppsala, Sweden). Conductivity measurements were performed using an Orion 3 Star* conductivity meter (Thermo-Electron Corp., Waltham, MA). DDI water was obtained from an E-pure* deionizer (Barnstead Thermolyne, Dubuque, IA). Additional solutions used are as follows:
Anolyte: 200 mM phosphoric acid was prepared by diluting 685 µL of 85% phosphoric acid (SigmaAldrich, St. Louis, MO, p/n 343245) to a final volume
Anodic Stabilizer: 0.20 M iminodiacetic acid (IDA) was prepared by dissolving 0.27 g of IDA (Sigma, p/n 220,000) in 10.0 mL of DDI water. This solution can be stored at room temperature for up to 30 days. IDA will precipitate out of solution if stored at 2-8°C.
of 50.0 mL with DDI water. The anolyte can be stored at room temperature for up to 30 days. Catholyte: 300 mM sodium hydroxide was prepared by dissolving 0.60 g of sodium hydroxide (J. T. Baker, Phillipsburg, NJ, p/n 3722-11) in DDI water to a final volume of 50.0 mL. This solution can be stored at room temperature in a plastic container for up to 30 days.
Capillary Cleaning Solution: 4.3 M urea solution was prepared by mixing 10.8 g of urea (Sigma, p/n U0631) and 30.0 mL of DDI water. The solid material was dissolved by vortexing for at least 15 min. This solution can be stored at 2-8°C for up to 30 days.
Chemical Mobilizing Solution: 20 mM acetic acid was prepared by diluting 0.8 mL of 1 M acetic acid (Sigma, p/n 318590) with DDI water to a final volume of 40.0 mL. This solution can be stored at room temperature for up to 30 days.
Desalting the IgG Sample. Mouse IgG1κ (Sigma, p/n M9269) was buffer-exchanged with 20 mM Tris, pH 8.0 buffer prior to cIEF analysis. A 20 mM Tris, pH 8.0 buffer was prepared by diluting 4.0 mL of 50 mM Tris buffer, pH 8.0 (Beckman Coulter, p/n 477427) to 10.0 mL with DDI water. The IgG1κ stock solution (each vial contains 1 mL at a concentration of 1 mg/mL) was thawed at room temperature and then divided by equal volume into two Microcon* Centrifugal Filter Devices YM-30 (p/n 42410, Millipore, Bedford, MA). The samples were immediately centrifuged at 12,000 rcf for 5 min in a Microfuge™ 18 (Beckman Coulter). The flow-through was discarded when necessary. Next, 250 µL of Tris
Chemical Mobilizing Solution: 350 mM acetic acid was prepared by diluting 1.0 mL of glacial acetic acid (Sigma, p/n A6283) with DDI water to a final volume of 50.0 mL. This solution can be stored at room temperature for up to 30 days. Cathodic Stabilizer: 0.50 M arginine (Arg) was prepared by dissolving 0.87 g of Arg (Sigma, p/n A5006) in 10.0 mL of DDI water. This solution can be stored at room temperature for up to 30 days.
A
Aperture
B
Aperture
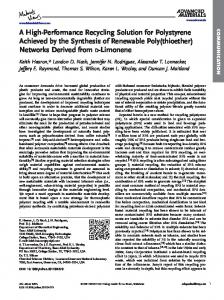
Figure 1: cIEF separation of hemoglobins A and F using different capillary cartridge apertures: (a) 200 µm and (b) 800 µm. Sample: 1.0 µL of hemoglobin AF, 200 µL of cIEF gel and 4.0 µL of ampholytes 3-10. cIEF conditions: focusing at 21 kV for 10 min using a 4 min ramp; mobilization at 21 kV for 35 min applying 0.5 psi towards the outlet. Anolyte: 91 mM phosphoric acid. Catholyte: 20 mM sodium hydroxide.
2
when the 800 µm aperture was replaced with the 200 µm aperture. Due to this increased resolution, all further cIEF experiments were carried out with the 200 µm aperture.
buffer were added into each Microcon device and the samples were again centrifuged at 12,000 rcf for 10 min. Again, 250 µL of Tris buffer were added into each Microcon device and the samples were centrifuged at 12,000 rcf for 3 min. Then 200 µL of Tris buffer were added into each Microcon device and centrifuged for 5 min at 12,000 rcf. The volume inside each Microcon filter was collected by placing the inverted Microcon filters into new centrifuge tubes and centrifuging at 2,000 rcf for 3 min. The volume collected was measured with a pipet and adjusted to yield an IgG concentration of 5.0 mg/mL. Finally, the IgG sample was aliquoted in 5.0 µL volumes and stored at -20°C or below until needed.
Mobilization of the Gradient. Resolution can be greatly enhanced when using chemical mobilization instead of pressure mobilization due to the absence of hydrodynamic flow, which can cause band broadening to occur. Manabe et al1 studied different chemical mobilizers and concluded that acetic acid gives the best resolution. In chemical mobilization, acetate ions enter the capillary at the cathodic side, while hydronium ions enter at the anodic side. Applying voltage, sample and ampholytes in the gradient are titrated from the basic to the acidic side of the capillary. Acetic acid does not significantly increase the electrical current during mobilization thus allowing the gradient to retain both its linearity and resolution.
Results and Discussion Detection Aperture in the Capillary Cartridge. A capillary cartridge uses an aperture to determine the dimension of the detection window. The PA 800 cartridge apertures are available in two widths: 200 and 800 µm. The aperture size plays an important role in cIEF and can result in differences in peak resolution (Fig. 1). Resolution between hemoglobins A (pI 7.0) and F (pI 7.1) increased from 0.8 to 1.0
In cIEF, resolution of hemoglobins A and F is affected by mobilization strategy (Fig. 2). A resolution of 1.0 was obtained with pressure mobilization, whereas a resolution of 4.0 was obtained using chemical
A
0.07
F
0.06
(A) Pressure Mobilization
0.05
A
AU
0.04
0.03
0.02
F 0.01
(B) Chemical Mobilization 0.00 0
2
4
6
8
10
12
14
16
18
20
22
24
26
28
30
32
34
Minutes
Figure 2: cIEF separation of hemoglobins A and F using (a) pressure and (b) chemical mobilization. Sample and experimental settings as described in Fig. 1. Method with pressure mobilization as described in Fig. 1. Method with chemical mobilization: focusing at 21 kV for 10 min using a 4 min ramp; mobilization at 21 kV for 35 min without pressure. Chemical mobilizing solution: 20 mM acetic acid.
3
mobilization. In this experiment, chemical mobilization was achieved by first replacing the catholyte vial with a 20 mM acetic acid vial at the end of the focusing step and then applying voltage across the capillary.
Chemical mobilization can also aid in the prevention of spikes in the electropherogram commonly caused by the flow of air bubbles or protein precipitate across the detection window (Fig. 3).
(A) Pressure Mobilization
0.30
RA
Run #1
0.25
CA
LG
Spikes
CCK
AU
0.20
0.15
0.10
0.05
Run #4 0.00 5
0
10
15
20
25
30
35
40
45
50
55
Minutes
0.45
(B) Chemical Mobilization
CA
RA
0.40
Run #1
LG CCK
0.35
0.30
AU
0.25
0.20
0.15
0.10
0.05
0.00 0.0
Run #4 2.5
5.0
7.5
10.0
12.5
15.0
17.5
20.0
22.5 Minutes
25.0
27.5
30.0
32.5
35.0
37.5
40.0
42.5
45.0
Figure 3: Four consecutive cIEF separations of a protein mixture using (a) pressure and (b) chemical mobilization. Sample: 200 µL of cIEF gel, 4.0 µL of ampholytes 3-10, 5 µL of ribonuclease A (RA), 4 µL of β-lactoglobulin B (LG), 3 µL of CCK flanking peptide, and 2 µL of carbonic anhydrase II (CA). Focusing: 15 kV for 6 min using a 0.17 min ramp. Pressure mobilization: 21 kV for 49 min applying 0.5 psi towards the outlet. Chemical mobilization: 21kV for 39 min using 20 mM acetic acid as chemical mobilizer. Anolyte: 91 mM phosphoric acid. Catholyte: 20 mM sodium hydroxide.
4
If buffer-exchange is not possible, desalting can be accomplished during focusing by using the voltage ramp option (Fig. 5) and establishing a current limit of 20 µA (Fig. 6) in the 32 Karat software method. The ramp option increases the voltage during the specified time interval. However, focusing time must be optimized when employing the voltage ramp option in order to ensure complete formation of the pH gradient.
Cleaning the Capillary Surface. Hydrophobic proteins can precipitate inside the capillary and/or be adsorbed to the capillary internal coating, adversely affecting resolution and reproducibility. Electrical current profiles can help indicate changes in resistance within the capillary, possibly due to precipitated protein redissolving during separation (Fig. 4a). Fluctuations in the electrical current can decrease the efficacy of the focusing and chemical mobilization steps. In order to mitigate this, a 4.3 M urea solution in water can be used to cleanse the capillary between cIEF separations. Urea aids solubilization of precipitated proteins inside the capillary. Use of capillary cleaning solution before each cIEF separation helps stabilize current profiles (Fig. 4b) and has been successful in improving reproducibility. Implementation of this improvement requires rinsing the capillary with capillary cleaning solution for 3 min at 50 psi followed by DDI water rinse for 2 min at 50 psi, at the start of each cIEF separation. 12
12
10
8
8
6
4
4
2
2
A µA
10
A µA
(A) Without Cleaning
0
Concentration of Anolyte and Catholyte. Changes in conductivity and pH value of anolyte and catholyte solutions can cause shifts in migration time between consecutive cIEF separations (Fig. 7). For example, mobilization time decreased with each consecutive separation when using 91 mM phosphoric acid as anolyte, 20 mM sodium hydroxide as catholyte, and 20 mM acetic acid as chemical mobilizer. This shift in migration time was due to a decrease in conductivity of the catholyte (Table 1). Practically, the pH of the catholyte decreased from
(B) With Cleaning
Figure 4: Electrical current profiles of cIEF separations when (a) not rinsing and (b) rinsing with the capillary cleaning solution between runs. Separations were carried out as described in Fig. 3 using chemical mobilization, except (a) 5 min and (b) 6 min of focusing.
6
0
2
4 Minutes
6
8
0
0
2
4 Minutes
6
8
pH 12 to 10, causing the loss of cathodic stabilizer into the catholyte vial. Because of this, the migration time of the samples decreased over consecutive runs.
Sample Desalting. The cIEF separation is very sensitive to the amount of salt present in the sample. Rodriguez-Diaz et al2 showed that high salt content can compress the pH gradient, decreasing resolution and slowing the rates of focusing and mobilization. Another disadvantage of high salt content is high electrical current, which can deteriorate the capillary coating if it increases above 20 µA. Desalting samples prior to separation can be performed by exchanging the sample buffer with a low-ionic strength buffer (e.g. 20 mM Tris, pH 8.0 buffer) using a concentrator such as the Microcon Centrifugal Filter Device. In general, the cIEF sample should have a salt concentration below 50 mM.
Migration time shifts can be eliminated by increasing the concentration of the anolyte, catholyte and chemical mobilizing solutions. Recommended concentrations for cIEF separations are 200 mM phosphoric acid as anolyte, 300 mM sodium hydroxide as catholyte, and 350 mM acetic acid as chemical mobilizing solution (Fig. 8). The pH and conductivity values of these highly concentrated solutions have been found to be stable up to ten consecutive cIEF separations (Table 2). 5
Figure 5: Focusing settings used in the cIEF separation of hemoglobins A and F (Figs. 1-2). Red arrow points to the ramp time, which is set on the time program of the cIEF method. The default value for the ramp time is 0.17 min. Use the ramp time to control the rate of voltage increase during focusing.
Figure 6: Initial conditions of cIEF method. Red arrow points to the maximum current setting. The default value of the maximum current is 300 µA. Change this value to 20 µA when performing cIEF to prevent electrical current to increase over 20 µA.
6
0.45
0.40
0.35
#1
CA
RA
LG CCK
0.30
AU
0.25
0.20
0.15
0.10
0.05
0.00
#8 12
14
16
18
20
22
24
26 Minutes
28
30
32
34
36
38
40
Figure 7: Eight consecutive cIEF separations of protein pI markers using 91 mM phosphoric acid as anolyte, 20 mM sodium hydroxide as catholyte and 20 mM acetic acid as chemical mobilizer. Separation conditions and sample as described in Fig. 3b.
Vial Anolyte: 91mM H3PO4 Catolyte: 20mM NaOH Chemical Mobilizer: 20 mM Acetic Acid
Conductivity of freshly prepared solutions (mS/cm)
Conductivity after 10 cIEF separations (mS/cm)
6.95
6.92
4.960
2.098
0.2243
0.2129
Table 1: Conductivity values of anolyte, catholyte and chemical mobilizing solutions with low concentration before and after performing eight consecutive cIEF separations.
7
LG
0.55
RA
0.50
CA
Run #1
0.45
CCK
0.40 0.35
AU
0.30 0.25 0.20 0.15 0.10 0.05
Run #10
0.00 12
14
16
18
20
22
24
26 Minutes
28
30
32
34
36
38
40
Figure 8: Ten consecutive cIEF separations of protein pI markers using 200 mM phosphoric acid as anolyte, 300 mM sodium hydroxide as catholyte and 350 mM acetic acid as chemical mobilizer. Separation conditions and sample as described in Fig. 3b.
Vial Anolyte: 200 mM H3PO4 Catolyte: 300 mM NaOH Chemical Mobilizer: 350 mM Acetic Acid
Conductivity of freshly prepared solutions (mS/cm)
Conductivity after 10 cIEF separations (mS/cm)
13.1
13.0
62.7
59.5
.910
0.853
Table 2: Conductivity values of anolyte, catholyte and chemical mobilizing solutions with high concentration before and after performing ten consecutives cIEF separations.
8
Peptide pI markers. Many proteins do not function as good pI markers because their pI values can be affected by post-translation modifications, degradation and changes in three-dimensional conformation. Therefore, short synthetic peptides can be used as pI markers for maximum precision of the pI determination. Shimura et al4 designed and tested synthetic peptides as pI markers in cIEF. Some of these peptide pI markers are listed in Table 3.
Stabilization of the pH Gradient. Following the formation of the pH gradient, isotachophoresis can cause distortion by moving the ends of the gradient into the anolyte and catholyte vials (Fig. 9a). This phenomenon can be prevented by the use of stabilizers (Fig. 9b), similar to the single-component ampholytes used in isoelectric trapping3. In this case, the stabilizers are UV-transparent chemical compounds that have a pI value above or below the pH range of the ampholytes and also have high conductivity. In order to be an effective anodic stabilizer, the reagent must have a pI above the pH of the anolyte (pH 1) and below pH 3 when using pH 310 ampholytes. IDA is a good anodic stabilizer because its pI is 2.2. Following the same logic, an effective cathodic stabilizer must have a pI below the pH of the catholyte (pH 12) and a pH above 10 when using pH 3-10 ampholytes. In this case, arginine is a good cathodic stabilizer because its pI is 10.7.
The peptide pI markers (Table 3) were separated using the cIEF method improvements discussed in this article (Fig. 10). Linearity above 0.99 was obtained in the pH 3-10 range (Fig. 11), indicating that pI response is linear when applying these cIEF improvements.
(A)
(B)
Figure 9: A diagram illustrating a capillary with ends submerged in anolyte (phosphoric acid) and catholyte (sodium hydroxide) vials during focusing. Case (a): capillary is filled with ampholytes pH 3-10; gradient is decaying into the anolyte and catholyte vials. Case (b): capillary is filled with ampholytes pH 3-10, cathodic stabilizer and anodic stabilizer; pH gradient is protected by stabilizers.
Peptide
Table 3: List of peptides with amino acid sequence and corresponding pI values.
pI value
Trp-Tyr-Lys-Lys
10.0
Trp-Tyr-Tyr-Tyr-Lys-Lys
9.5
Trp-Glu-His-Arg
7.0
Trp-Glu-His-His
6.7
Trp-Glu-His
5.5
Trp-Asp-Asp-Arg
4.1
Trp-Asp-Asp-Asp
3.4
9
0.10
Focusing
0.09
0.08
9.5
0.07
0.06
AU
0.05
Cathodic peaks
6.7
0.04
7.0
10.0
5.5
4.1
0.03
3.4
0.02
0.01
0.00
-0.01 0.0
2.5
5.0
7.5
10.0
12.5
15.0
17.5
20.0 Minutes
22.5
25.0
27.5
30.0
32.5
35.0
37.5
40.0
Figure 10: cIEF separation of peptide pI markers (Table 3). Sample: 200 µL of cIEF gel, 12.0 µL of Pharmalyte 3-10, 2.0 µL of each pI marker (1.25 mM), 18.0 µL of cathodic stabilizer (0.5 M Arg.) and 4.0 µL of anodic stabilizer (0.2 M IDA). Method: focusing: 15 min at 25 kV; chemical mobilization: 25 min at 30 kV. Anolyte: 200 mM phosphoric acid. Catholyte: 300 mM sodium hydroxide. Chemical mobilizing solution: 350 mM acetic acid.
Figure 11: Linear regression for the cIEF separation of peptide pI markers. Separation conditions as described in Fig. 10.
10
Use of Urea to Increase Sample Solubility. Proteins have low solubility near their pI. Urea can be used as a protein solubilizer to minimize sample precipitation or aggregation during focusing. Incorporation of 3 M urea into the cIEF separation of mouse IgG1κ has a profound effect on resolution (Fig 12). The IgG peak signal increased by a factor of two when using urea, whereas the peptide pI markers remain unaffected. In addition, the IgG profile is highly resolved in the presence of urea.
The cathodic peaks (Fig. 10) detected during focusing are due to movement of UV-absorbing sample from the cathodic side of the capillary, across the detection window, towards the anodic side. Thorman and Mosher5 studied the dynamics of cIEF focusing and chemical mobilization using computer simulations. They showed that, at the start of focusing, mirror-imaged peaks form at opposite ends of the capillary for each sample component because the formation of the pH gradient begins at the capillary ends. As focusing continues, the anodic and cathodic peaks migrate towards each other as the pH gradient forms from the capillary ends towards the center. Focusing is complete when both anodic and cathodic peaks merge with one another, which occurs when the pH gradient has reached steady-state.
0.050
IgG
0.045
0.040
7.0
5.5
6.7
0.035
0.030
AU
0.025
(A) 3 M urea
0.020
0.015
0.010
0.005
(B) No urea
0.000
-0.005 11
12
13
14
15
16
17
18
19
20
21
22
23
24
25
26
27
28
29
30
31
Minutes
Figure 12: Comparison of the cIEF separations of mouse IgG1κ and three peptide pI markers (7.0, 6.7 and 5.5): (a) with and (b) without 3 M urea in the sample. Sample: 200 µL of cIEF gel with and without 3 M urea, 6.0 µL of Pharmalyte 5-8, 2.0 µL of each pI marker, 9.0 µL of cathodic stabilizer (0.5 M Arg.), 5.0 µL of anodic stabilizer (0.2 M IDA), and 10.0 µL of desalted IgG. Focusing: 5 min at 25 kV. Chemical mobilization: 30 min at 30 kV. Anolyte: 200 mM phosphoric acid. Catholyte: 300 mM sodium hydroxide. Chemical mobilizing solution: 350 mM acetic acid. Black arrow indicates the boundary between ampholytes and anodic stabilizer.
11
Conclusion
References
This article describes a holistic approach to increasing resolution and reproducibility of cIEF. Key areas of optimization for greater robustness are as follows:
1. Manabe, T., Miyamoto, H., Iwasaki, A. Electrophoresis 18, 92 (1997).
• The use of a 200 µm aperture instead of the 800 µm aperture in the capillary cartridge, to increase resolution. • Replacement of pressure mobilization with chemical mobilization using 350 mM acetic acid solution to alleviate band broadening and obtain better resolution.
2. Rodriguez-Diaz, R., Wehr, T., Zhu, M. Electrophoresis 18, 2134 (1997). 3. North, R.Y., Vigh, Gy. Electrophoresis 29, 1077 (2008). 4. Shimura, K., Wang, Z., Matsumoto, H., Kasai, K. Electrophoresis 21, 603 (2000). 5. Thorman, W., Mosher, R. Electrophoresis 27, 968 (2006).
• The use of a capillary cleaning solution consisting of 4.3 M urea to reduce buildup of protein precipitate on capillary surfaces. • Desalting of samples prior to cIEF separation to minimize compression of the pH gradient. • Addition of cathodic and anodic stabilizers in the cIEF sample mixture to reduce distortions caused by isotachophoresis. •Increase of anolyte concentration to 200 mM phosphoric acid. • Increase of catholyte concentration to 300 mM NaOH. • The use of peptide pI markers to achieve highest accuracy in pI determination. • The addition of urea to the cIEF sample to minimize protein precipitation.
* All trademarks are the property of their respective owners. For research purposes only; not for use in diagnostic procedures.
For Research Use Only. Not for use in diagnostic procedures. © 2014 AB SCIEX. SCIEX is part of AB Sciex. The trademarks mentioned herein are the property of AB Sciex Pte. Ltd. or their respective owners. AB SCIEX™ is being used under license. Australia, Gladesville (61) 2 9844-6000 Canada, Mississauga (1) 905 819 1234 China, Beijing (86) 10 6515 6028 Czech Republic, Prague (420) 272 01 73 32 Eastern Europe, Middle East, North Africa, South West Asia: Switzerland, Nyon (41) 22 365 3707 France, Villepinte (33) 1 49 90 90 00 Germany, Krefeld (49) 2151 33 35 Hong Kong (852) 2814 7431 India, Mumbai (91) 22 3080 5101 Italy, Cassina de’ Pecchi, Milan (39) 02 953921 Japan, Tokyo (81) 3 5530 8500 Korea, Seoul (82) 2 404 2146 Latin America (1) (305) 380 4709 Mexico, Mexico City (001) 52 55 9183 2800 Netherlands, Mijdrecht (31) 297 230630 Puerto Rico (787) 747 3335 View SCIEX products at www.sciex.com AB SCIEX Headquarters Singapore (65) 6339 3633 South Africa/Sub-Saharan Africa, Johannesburg (27) 11 564 3203 Spain, Madrid (34) 91 3836080 local Taiwan, office at www.sciex.com/offi Path | Framingham, MA 01701 USA Sweden, Bromma (46) 8 564 85 900 Switzerland, Nyon (41)Find 0800your 850 810 Taipei (886) 2 2378 3456cesTurkey, Istanbul (90)500 216 Old 570Connecticut 17 17 Phone 508-383-7700 UK, High Wycombe (44) 01494 441181 USA, Fullerton, CA (1) 800 742 2345 www.sciex.com/ce www.absciex.com B2008-8783-PO-3K www.beckmancoulter.com © 2008 Beckman Coulter, Inc. BMR-PRINTED IN U.S.A.