Computers and Electronics in Agriculture 48 (2005) 92–102
Identifying defects in images of rotating apples B.S. Bennedsen ∗ , D.L. Peterson, Amy Tabb USDA1 , Agricultural Research Service, Appalachian Fruit Research Station, Kearneysville, WV 25430, USA Received 16 September 2004; received in revised form 24 January 2005; accepted 31 January 2005
Abstract An experimental machine vision system was used to identify surface defects on apples, including bruises. Images were captured through two optical filters at 740 and 950 nm, respectively. In the ensuing grey scale images, defects appeared as dark areas, however, so did shadows and parts of the stem/calyx area. This paper reports a novel approach to locate the defects and eliminate other dark areas. The method is based on rotating the apples in front of the camera while multiple images are acquired. Dark areas, which are found at the same position, relative to the apple, during the rotation, represent defects, while other dark areas, which change shape and/or position from one frame to the next, are not classified as defects. In a test using 54 Pink Lady apples with 56 defects, the system successfully detected 52, or 92% while providing two false positive. In another test with Ginger Gold Apples, where the rotation technique was combined with images of the stem and calyx regions, 90% of the defects were detected with no false positives. Published by Elsevier B.V. Keywords: Apple; Defects; Image processing; Sorting
1. Introduction Surface defects are of great concern to apple producers. Consumers tend to relate quality to the appearance of the fruit, and marketing standards set stringent limits for surface ∗
Corresponding author. E-mail address:
[email protected] (B.S. Bennedsen). 1 All programs and services of the USDA are offered on a non-discriminatory basis with regard to race, colour, national origin, religion, sex, age, marital status, or handicap. Mention of a trade name or product does not constitute a guarantee, warranty, or endorsement of the product. 0168-1699/$ – see front matter. Published by Elsevier B.V. doi:10.1016/j.compag.2005.01.003
B.S. Bennedsen et al. / Computers and Electronics in Agriculture 48 (2005) 92–102
93
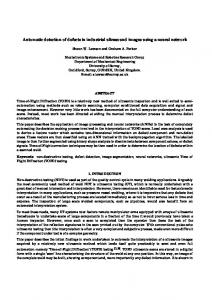
Fig. 1. Original images acquired with the two-waveband filters and 360◦ rotation; top six images are captured through a 740 nm filter, the six images in the lower row through a 950 nm filter.
blemishes. Sorting the fruits for surface defects is predominantly done manually. Some automatic sorting equipment has been developed and is commercially available. However, many producers, especially in the USA, feel that the existing machines are not sufficiently selective, especially on darker coloured varieties like Red Delicious. The system reported here was built at the USDA Appalachian Fruit Research Station, Kearneysville, West Virginia, in close collaboration with Cornell University. The development of the sorter started in 1980, reaching its present configuration as described by Throop et al. (1999, 2003a,b) The latest development in the image processing system was described by Bennedsen et al. (2004a,b). This current paper reports a further development of the defect identification routines. The image capturing system was originally designed to acquire six images while the apples rotated through 360◦ in front of the camera. Images are eight bit grey level, generated by filtering the light reflected from the apple surface through two filters at 740 and 950 nm. Depending on the settings and the size of the apples, each of the six frames show all, or most of the apple (Figs. 1 and 2). In order to create an image of the entire apple surface,
Fig. 2. Images acquired with 180◦ rotation and 740 nm filter (top row) and 950 nm filter (bottom row).
94
B.S. Bennedsen et al. / Computers and Electronics in Agriculture 48 (2005) 92–102
specially developed software extracted 60◦ from the centre of each of the six frame and stitched them together to form a new image, which then represented the entire surface of the apple. Previous work (Throop et al., 2003a; Bennedsen et al., 2004a,b) focused on detecting defects in these images. The defects appear as dark areas or spots in the grey scale images. Even though the detection was rather successful, there were problems with false positives (good apples classified as defective). These false positives consisted of dark areas, which are not defects but are classified as such by the image processing system. They are normally caused by shadows in cavities or behind ridges on the apple surface, or by parts of the stem or calyx region being visible to the camera. Considerable effort has gone into creating a lighting system, which would provide a sufficiently diffuse illumination to avoid this. However, problems with false positives persisted at a level of 1.1–3.6%. The idea behind the approach reported in this work is that as apples rotate, the illumination changes, and so does the appearance and position of shadows. The dark areas, which are caused by defects, however, remain almost unaffected by the rotation. Hence, if the speed of rotation is decreased, so that the same part of the apple is visible in three or more frames, and if a dark mark can be found in three or more consecutive frames, with a change in position corresponding to the rotation of the apple, then there is a good chance this is a defect. In the previous work (Bennedsen et al., 2004a,b; Bennedsen and Peterson, in press) the sensitivity of the system was a compromise between the desire to capture as many defects as possible and not getting false positives. Making the routines more sensitive increased the number of defects caught; however, it also increased the number of false positives and vice versa. While the industry wants to eliminate defective apples, and preferably all of them, it is not interested in loosing good apples due to the sorting system’s inability to differentiate between defects and shadows, stem-calyx and other items mistaken for defects. With a system like the one described in this work, the rotation can be used to determine if a dark area is a defect or a shadow, and so the sensitivity of the segmentation routines can be increased in order to catch more defects. Detecting defects in the stem/calyx area represents an inherent problem in the design of the sorting system. Distinguishing between stem/calyx and defects has not yet been achieved, hence the need for orienting the apples in order to keep the stem/calyx out of the images. According to the concept as described by Throop et al. (2000), orienting the apples allows for the use of additional cameras, attuned to inspect the stem and calyx region. Hence, with more cameras, three sets of images could be acquired for each apple; one covering the stem region, another the calyx region, and a number of images covering the circumference as the apple rotates in front of the camera. In order to simulate this, images of stem and calyx ends of the apples were acquired with apples manually placed on the conveyor, which was not moving while the images were acquired. 1.1. Objectives The objective of this research was to develop and test an image processing system which could identify defects on apple surfaces, while minimizing false positives, by analyzing multiple images acquired while the apples were rotating in front of the camera. Another objective was to prove the concept of adding stem and calyx images to the system to improve effectiveness of system.
B.S. Bennedsen et al. / Computers and Electronics in Agriculture 48 (2005) 92–102
95
2. Materials and methods 2.1. Sorting system The sorting system consisted of a conveyor with orienting capability. As apples travelled along the conveyor, they were oriented with the stem-calyx in a vertical position (Throop et al., 2003a). The imaging area was a tunnel with a lighting system. While passing through it, apples were tilted slightly so that the stem-calyx axis was perpendicular to the camera lens (Fig. 3). The tilting made the apples lean against plastic rollers, which caused them to rotate while passing the camera’s field of view. The rotation speed was adjusted in relation to the forward travel of the conveyor. In the original set-up, one full rotation of the apple was achieved while passing the camera. For this experiment, the angular velocity was set so that the apples would rotate 180◦ . With six frames, this corresponded to 30◦ of travel between each frame. It also meant that only half of the apple surface was exposed to the camera. Ideally, the camera settings should have been changed to capture 12 images, and thus cover the entire apple surface with a 30◦ displacement between each frame. However, these settings were controlled by custom designed software, to which access was not easily available. Since this project was a proof of concept, it was decided to leave the image capturing system as it was.
Fig. 3. Conveyor and imaging area. Apples are tilted 45◦ while they rotate in front of the camera. This is located out of view of the image, outside the upper right hand corner.
96
B.S. Bennedsen et al. / Computers and Electronics in Agriculture 48 (2005) 92–102
2.2. Imaging system The image capturing system consisted of a camera (Dalsa 1M60, Waterloo, Ontario, Canada) with high spatial resolution (1024 × 1024 pixels, 256 grey levels) and a high sensitivity in the near infrared area. Further, the system comprised an optical splitter and filters. It was based on research by Throop and Aneshansley (1997), who investigated the performance of different wavelengths for detecting surface defects, and found that 740 nm performed best for dark marks caused by fungal or bacterial diseases, insects, hail damage etc, and 950 nm proved to be the optimal wavelength for detecting bruises, punctures, and scald. Aneshansley et al. (2003) developed an optical filter system consisting of a splitter and two bandpass filters. The splitter was mounted in front of the camera and contained optics that divided the incoming radiation into three identical parts each of which was directed to sub-areas on the image sensor, thus enabling the camera to capture three images simultaneously. Only two of the three sub-images were used. These images were filtered through bandpass filters, mounted in front of the splitter. When six sets of two images were acquired, while the apples rotated in front of the camera, a result such as the one presented in Fig. 1, was achieved. The upper row was filtered through a 740 nm filter, the lower row through a 950 nm filter. The example shows how the dark spots from various diseases are more evident in the 740 nm range, and that the bruises appear darker at 950 nm. 2.3. Thresholding segmentation Three different threshold segmentation methods were used in this study. They were developed (Bennedsen et al., 2004a,b) and tested (Bennedsen and Peterson, in press) on eight different varieties of apples. The three segmentation methods consisted of: (1) a simple threshold segmentation based on flat-field corrected images. Flat-field correction compensates for the uneven distribution of light, caused by the spherical shape of the apples. In this case, an image of a white sphere, the size of the apples, was inverted and added to the original apple image; (2) a more elaborate routine, known as multi-segmentation, in which the images were segmented several times at different threshold levels. The resulting binary images were added to form a so-called multi-layer image. This in turn was then subjected to threshold segmentation. This segmentation aimed at identifying the darkest areas in the original image. The resulting, binary image was referred to as a marker image. The final step consisted in constructing a binary image, based on the marker image and the multi-layer image. With the position of the defects identified, a simple thresholding routine, e.g. a gradient segmentation could be employed to determine the area of these defects; (3) a method in which a correction image was created through a succession of median filtering and averaging of the six frames. The correction image showed low values corresponding to the highlights in the original images, but higher values where shadows needed to be lightened. When applied to the original frames, shadows and dark rims around the edge of the apples were eliminated, yielding uniformly illuminated images. These images were then threshold segmented in order to identify the defects. All image processing was done using Matlab (Release 14, The MathWorks Inc., Natick, MA, USA) with the image and signal processing toolbox.
B.S. Bennedsen et al. / Computers and Electronics in Agriculture 48 (2005) 92–102
97
2.4. Image analysis Each frame showed a section of approximately 180◦ of the apple (Fig. 2). As the apple was rotating about 30◦ between the acquisitions of each frame, a given part of the surface appeared at different positions in up to six frames. Hence, a defect could show in up to six frames (Fig. 2). Note: Since the apples in this work were only rotating through 180◦ , some defects could be visible in only one frame. In order to simulate the ideal situation in which the apples rotate 360◦ , and defects would appear in three to six frames, it was decided to consider only defects appearing in three or more frames when the performance of the system was evaluated. The images contained dark areas of which some were actual defects, while others were caused by shadows, or parts of the stem/calyx region, etc. The task of the image processing routines was to segment the images, thus identifying potential defects, and combine the frames in order to separate defects and false positives. After segmentation, the individual frames were combined, staggering the frames by an amount corresponding to the rotation and hence matching overlapping sections. In the combined image, defects would appear with almost the same shape and at the same place in three or more frames. False positives from shadows and the stationary stem and calyx would appear in only one frame, or at different locations in more frames. Thus, defects could be identified in the combined image as overlapping dark areas. The first task was to resize the individual frames to gain a representation of the apple surface, as if it was peeled off and flattened. In order to accomplish this, each row of pixels was resized individually and tacked together with the other resized rows. First, the pixels representing apple surface was isolated from each row. These arrays of pixels were projections on the flat image plane of the curved apple surface. In order to recreate the curvature, rows were projected to the interval from minus one to one, creating a number of equal length intervals. Fig. 4 shows a graphical representation with 10 pixels, creating 10 intervals, which can be perceived as values on an x-axis. Further, it was assumed that each of the rows of pixels approximately represented a unit circle. Only half of that unit circle was visible in each frame, so the angle range was zero to π radians. The diamonds on the semi-circle represented the arc lengths on the curved surface of the apple, corresponding to each interval, and hence to each pixel in the frame. The arc length was calculated using the
Fig. 4. Graphical representation of the basis for resizing apple surface.
98
B.S. Bennedsen et al. / Computers and Electronics in Agriculture 48 (2005) 92–102
Fig. 5. Resizing and flat-field correction. The original frame (left) was resized using the projection illustrated in Fig. 4 yielding the central image. This in turn was flat-field corrected using an average of nine defect-free apples. This average was then resized to the proportions of the apple to be flat-field corrected.
inverse cosine of each angle describing the interval. The arc length between the x-values determined the number of the pixels in the resized image. Consequently, pixels near the edges of the row were replicated many times, whereas pixels in the centre were replicated less often. After the frames were resized, they were flat-field corrected using an average of nine images of defect-free apples. This average was inverted by subtracting the pixels values from 255, then resized to the proportions of the apple to be flat-field corrected. The process from the raw frame to the flat-field corrected image is shown in Fig. 5. After resizing, the frames were combined to form an image of the entire apple surface. For this combination, the frames were staggered at an interval corresponding to the rotation. If the apples had rotated through 360◦ , and 12 frames were acquired, each part of the apple surface would be overlapped six times. With only half of the apple covered, it was necessary to keep track of the number of overlapping frames at each point of the combined image. This was done by creating a matrix from segmented versions of the frames, in which the apple and the background were identified by pixel values of 1 and 0, respectively. The resulting image was then created by dividing the combined image by this matrix. Two combined images were created, one for the 740 nm and one for the 950 nm frames (Fig. 6). Each individual, resized frame was segmented using the three different threshold segmentation methods mentioned in Section 2.3 (Bennedsen et al., 2004a,b). The segmented frames were combined as described for the grey scale images. For each apple, two segmented images were created; one for the 740 nm frames and another for the 950 nm frames. In each segmented frame, dark areas representing potential defects were assigned a value of 1 by the segmentation routines. Areas classified as non-defective was assigned a value of 0. When the segmented images were overlapped, i.e. pixel values added, these values would increase if the same dark area was identified in more than one frame. If a pixel value of three or more was encountered at any point of the combined, segmented image it meant that a potential defect had been identified in at least three frames at the same location on
B.S. Bennedsen et al. / Computers and Electronics in Agriculture 48 (2005) 92–102
99
Fig. 6. (a) The 740 nm overlapped image; (b) overlapped 740 nm segmentation image; (c) 950 nm overlapped image; (d) overlapped 950 nm segmentation image; (e) resulting image after segmentation and merging. Note: in (b) and (d), white represents a “vote” of three. Votes of one and two appear as dark grey and light grey, respectively. The dark defect on the left-hand side was only shown in two frames, and hence not considered in this work.
the apple. These cases were classified as defects. A pixel with a value of one or two was assumed to be a shadow or artefact and was set to zero. The final evaluation of the apple was based on combining the segmented images in the 740 and 950 nm wavebands (Fig. 6).
100
B.S. Bennedsen et al. / Computers and Electronics in Agriculture 48 (2005) 92–102
Images of stem and calyx ends were flat-field corrected using an image of a white sphere, after which they were segmented, using Matlab’s automatic thresholding function. The actual stem and calyx were eliminated by a routine which located the central, dark spot in the image and masked an area around it. The size of the mask corresponded to the size of the calyx and the radius of the stem. The method could be improved with more sophisticated segmentation methods and more precise ways of masking stem and calyx. However, as a proof of concept, the one described proved adequate. Images of stem and calyx were acquired only for the Ginger Gold Apples. 2.5. Apple test sets ‘Pink Lady’ and ‘Ginger Gold’ apples were used to test the performance of the routines. ‘Pink Lady’ was picked at the Appalachian Fruit Research Station, West Virginia, in September 2003. Apples with different surface defects were preferred. Between picking and testing (in July 2004), ‘Pink Lady’ apples were stored at 0◦ C. The day before running the apples through the sorting system, bruises were inflicted on some of the apples. This was done by dropping apples 150–200 mm onto the convex surface of a semi-sphere of wood. This created a bruise of approximately 12–15 mm diameter. The batch of Ginger Gold Apples was picked in mid-July 2004 and images were taken the day after harvest. After image acquisition, apples were returned to cold store so that they could be used for the evaluation of the image processing. The ‘Pink Lady’ apples were regular in shape and size. The ‘Ginger Gold’ were rather small and irregularly shaped. A characteristic of the variety is its edged appearance with vertical (stem-calyx) ridges and depressions, causing shadows that will need to be distinguished from defects. 2.6. Evaluating the results For the evaluation of the system’s performance, apples were extracted from the cold store and visually compared with the combined, segmented images.
3. Results and discussion The system was tested using a batch of 54 Pink Lady apples, and 58 Ginger Gold Apples. The apples had varying degrees of surface defects and were selected to represent the majority of the situations encountered in a practical implementation. The Pink Lady apples provided 56 defects in a position where the system was expected to identify them, meaning that these defects appeared in three or more consecutive frames as explained in Section 2.5. In addition, three apples had small defects near the stem/calyx end. Of the 56 defects, 52, or 93% were correctly identified. The defects that were not detected were a rather large area of rot in the calyx region and three small defects near the stem/calyx. Two apples showed false positives. One was caused by parts of the calyx region being mistaken for a defect. As stated below, this false positive could be avoided using cameras covering the stem and calyx regions. On one apple, particularly prominent lenticel spots
B.S. Bennedsen et al. / Computers and Electronics in Agriculture 48 (2005) 92–102
101
caused two small spots in the segmented image. In a previous test with Golden Delicious apples (Bennedsen et al., 2004b) 86% of the defects were detected using a combination of the same three segmentation methods as used in the current project, but without the rotation. There were 1.8% false positives. In another test using Pink Lady apples (Bennedsen and Peterson, in press), a combination of the three segmentation methods and a neural network based routine detected 90% of the defects with 1.84% false positives. The performance of the three segmentation methods, without the information provided by the rotation, was tested on the current batch of Pink Lady apples. Although all of the defects were detected, the number of false positives was high, amounting to 25–30%. The main reason for the false positives was shadows, mistaken for defects. The Ginger Gold Apples provided 51 defects visible around the perimeter of the apples and 60 defects in the stem/calyx regions. Of the 51 defects, 39 were detected using the rotation technique. In addition to that, were detected in the stem/calyx images, yielding an overall result of 47, or 92% detection. Of the 60 defects in the stem/calyx region, 49 were detected with another four detected in the rotation images. That amounts to 53 defects or 88% detected. The combined result was 90% detection with no false positives. As with the Pink Lady apples, the performance of the three segmentation methods without the information provided by the rotation was tested. With the Ginger Gold Apples, the problem with shadows causing false positives was even more pronounced due to the irregular shape, characteristic of this variety. There were four defects, which were not detected by the rotation routine due to problems in the way the apples rotated. Under normal conditions, the apples will rotate in a regular manner around an axis through the stem-calyx. Some of the Ginger Gold Apples were irregular in shape, which made them wobble as they rotated. This caused the dark areas, representing defects, to move up and/or down as well as horizontally. When only the horizontal displacement is taken into consideration in the combination of the segmented frames, the segmented defects will not overlap, and hence not be detected. As this problem will recur for a number of varieties, the image processing routines should be modified to allow for vertical movements as well as horizontal. This is possible with a system that captures 360◦ of the apple surface, but as this test only dealt with 180◦ , this modification could not be implemented.
4. Conclusion A system for identifying surface defects on apples was designed, based on analysing images acquired while apples were rotating in front of the camera. When multiple images were combined and adjustments made for rotation, dark areas caused by defects would appear with almost the same shape and at the same place in three or more frames. Dark areas from shadows and the stationary stem and calyx would appear in only one frame, or at different locations in more frames. In addition to that, images of the stem/calyx regions were used to identify defects in these regions and eliminate false positives caused by parts of the stem or calyx being visible in the images. The system successfully detected 90–92% of all defects with only one false positive in the Pink lady batch and none in the Ginger Golds.
102
B.S. Bennedsen et al. / Computers and Electronics in Agriculture 48 (2005) 92–102
Based on the methodology developed and described in this report, the system, as described by Throop et al. (1999, 2003a,b) should be modified in the following ways: the oriented apples should be transferred to a conveyor with their stem-calyx axis horizontal. Here, images of the stem and calyx end can be acquired for verification of orientation and inspection of these parts of the apples. While on the conveyor, the apples could be rotated through 360◦ while 12 images are acquired. The camera could be placed vertically above the conveyor. This will allow for a more compact construction and a better distribution of the light. It will also provide a much more compact construction and the possibility of having more inspection lines in parallel.
References Aneshansley, D.J., Throop, J.A., Anger, W.C., Peterson, D.L., 2003. A multivision linear filter for capturing multispectral images. ASAE Paper No. 033027. ASAE, St. Joseph, MI. Bennedsen, B.S., Peterson, D.L., Tabb, A., 2004a. Identifying apple surface defects using principal components analysis and artificial neural networks. Trans. ASAE, submitted for publication. Bennedsen, B.S., Peterson, D.L., Tabb, A., 2004b. Quantitative performance of segmentation routines for detection of apple surface defects. Trans. ASAE, submitted for publication. Bennedsen, B.S., Peterson, D.L., in press. Performance of a system for apple surface defects identification in near infrared images. Biosyst. Eng. Throop, J.A., Aneshansley, D.J., 1997. Apple damage segmentation utilizing reflectance spectra of the defect. ASAE Paper No. 97-3078. ASAE, St. Joseph, MI. Throop, J.A., Aneshansley, D.J., Anger, W.C., 1999. Inspection station detects defects on apples in real time. ASAE Paper No. 993205. ASAE, St. Joseph, MI. Throop, J.A., Aneshansley, D.J., Anger, W.C., 2000. A multispectral inspection station detects defects on apples. In: Proceedings of the Conference 4203-Biological Quality and Precision Agriculture II, Photonics East 2000, Boston, MA, November 7–8, 2000. Throop, J.A., Aneshansley, D.J., Anger, W.C., Peterson, D.L., 2003a. Quality evaluation of apples based on surface defects — an inspection station design. ASAE Paper No. 036161. ASAE, St. Joseph, MI. Throop, J.A., Aneshansley, D.J., Anger, W.C., Peterson, D.L., 2003b. Conveyor design for apple orientation. ASAE Paper No. 036123. ASAE, St. Joseph, MI.