Journal of Infectious Diseases Advance Access published March 30, 2016
1
Identifying key drivers of the impact of an HIV cure intervention in sub-Saharan Africa
Andrew Phillips1, Valentina Cambiano 1, Paul Revill2, Fumiyo Nakagawa1, Jens
ipt
Lundgren3, Loveleen Bansi-Matharu1, Travor Mabugu4 , Mark Sculpher2, Geoff
Garnett5, Silvija Staprans5, Stephen Becker, Joseph Murungu6, Sharon R. Lewin7,8,
1
UCL, London, UK
2
University of York, York, UK
3
M an
Dept of Infectious Diseases, Rigshospitalet, University of Copenhagen, Copenhagen,
Denmark 4
University of Zimbabwe, Zimbabwe
5
Bill & Melinda Gates Foundation, Seattle, USA
6
7
pt ed
Ministry of Health and Child Care, Zimbabwe
The Peter Doherty institute for infection and Immunity, The University of Melbourne,
Melbourne, Australia 8
Department of Infectious Diseases, Alfred Hospital and Monash University, Melbourne,
9
ce
Australia
San Francisco General Hospital Medical Center, San Francisco, USA Imperial College London, London, UK
Ac
10
Correspondence:
[email protected] © The Author 2016. Published by Oxford University Press for the Infectious Diseases Society of America. This is an Open Access article distributed under the terms of the Creative Commons AttributionNonCommercial-NoDerivs licence (http://creativecommons.org/licenses/by-nc-nd/4.0/), which permits non-commercial reproduction and distribution of the work, in any medium, provided the original work is not altered or transformed in any way, and that the work is properly cited. For commercial re-use, contact
[email protected].
Downloaded from http://jid.oxfordjournals.org/ by guest on April 11, 2016
us cr
Steven G. Deeks 9, Tim Hallett10
2
Abstract (200 words) Background: The properties required of an intervention that results in eradication or control of HIV in absence of antiretroviral therapy (ART-free viral suppression) to make it cost-
ipt
effective in low income settings are unknown.
us cr
Methods: We used a model of HIV and ART to investigate the effect of introducing an ARTfree viral suppression intervention in 2022 in an example country of Zimbabwe. We assumed that the intervention (cost: $500) would be accessible for 90% of the population, be given to those on effective ART, have sufficient efficacy to allow ART interruption in 95%, with a
M an
each successive year.
Results: An ART-free viral suppression intervention with these properties would result in over 0.53 million disability-adjusted-life-years averted over 2022-2042, with a reduction in HIV programme costs of $300 million (8.7% saving). An intervention of this efficacy
pt ed
costing anything up to $1400 is likely to be cost-effective in this setting. Conclusion: Interventions aimed at curing HIV have the potential to improve overall disease burden and to reduce costs. Given the effectiveness and cost of ART, such interventions
Ac
ce
would have to be inexpensive and highly effective.
Downloaded from http://jid.oxfordjournals.org/ by guest on April 11, 2016
rate of viral rebound 5% per year in the first three months, and a 50% decline in rate with
3
Introduction
ipt
Research is on-going into developing an intervention which would allow HIV positive
individuals to have prolonged, and perhaps permanent, viral suppression in the absence of
us cr
therapy (“remission”, “cure”). We refer to this as antiretroviral therapy-free viral suppression (1-8). The implications of this research for sub-Saharan Africa, where most people with HIV live, are as yet unclear, and any such intervention requires consideration in the context of
M an
properties are likely to be required of such an intervention in order for it to be cost effective, or cost saving in low income, high HIV prevalence settings (i.e. a “target product profile”) is important in order to focus research, clinical development and delivery approaches. Here, we sought to identify some basic product and delivery attributes within a framework of a global
pt ed
policy agenda. We address the following research questions. First, what would be the predicted impact of an intervention to induce sustained ART-free HIV suppression in low income countries in sub-Saharan Africa, in terms of death rates, HIV incidence, and disability-adjusted life years (DALYs)? Secondly, under what conditions, particularly those
ce
relating to efficacy and cost, would such an intervention represent a cost-effective approach,
Ac
within the context of continued expansion in access to ART?
Methods
Model and Context We assess these questions in the context of a generalised HIV epidemic with on-going ART roll-out using a model that has been informed by, and calibrated to, data from Zimbabwe (9-
19). We used the HIV Synthesis transmission model, an individual-based stochastic model of
Downloaded from http://jid.oxfordjournals.org/ by guest on April 11, 2016
resource-constrained public health approaches to treatment and prevention. Knowing what
4
heterosexual HIV transmission, progression and treatment in adults that has been previously described (20-23; and see Supplementary Material). Each simulation run generates timeupdated longitudinal “data” over time for a population of people from 1989 such that the
ipt
overall characteristics of the population in terms of age, gender, sexual risk behaviour and HIV status resembles that of the entire adult population of Zimbabwe (HIV positive and
us cr
negative). Transmission of HIV is modelled, with the HIV status of each (condomless sex)
partner being sampled, along with viral load status of HIV positive partners. For people who have become infected with HIV the variables for which longitudinal data are simulated
M an
HIV positive, whether they are linked to care, whether they are maintained in care and on treatment, and occurrence of AIDS and death.
Evaluation of the impact of an ART-free viral suppression intervention depends on the predicted outcomes in the absence of such an intervention and, in particular, the projected
pt ed
long term effects of ART. The first-line regimen is assumed to be composed of efavirenz/lamivudine/tenofovir and the second line regimen ritonavir-boosted atazanavir/zidovudine/lamivudine. It is assumed that no third line will be available. Table 1 presents the modelled 10 and 20 year outcomes after the start of ART. These outputs reflect
ce
model assumptions regarding adherence patterns, resistance acquisition, effect of adherence and resistance on virologic outcome and CD4 count changes, the rate of interruption of ART
Ac
and of ART toxicity, as detailed elsewhere (Supplementary Material; 24-29).
We initially concentrate on a base case analysis and then consider a number of sensitivity analyses (Supplementary Table 1). We assumed that rates of HIV testing and hence ART coverage will continue to rise, although by lower amounts than has been the case in the last
Downloaded from http://jid.oxfordjournals.org/ by guest on April 11, 2016
include viral load, CD4 count, presence of resistance mutations, whether they have tested
5
five years and that the policy will be for ART initiation in people with CD4 count 500
us cr
copies/mL) is projected to decline only slowly from the level of 40% in 2022 without the
ART-free viral suppression intervention, but to decline to close to 25% with introduction of the ART-free viral suppression intervention (Supplementary Figure 2 (g)). The death rate in
M an
around 0.5 per 100 person years (8.4% lower; Supplementary Figure 2 (h)). DALYs (discounted) will be slightly lower with the ART-free viral suppression intervention (Supplementary Figure 2 (i)). Costs are higher with the ART-free viral suppression
intervention in the initial few years of introduction due to the costs of the ART-free viral suppression intervention but thereafter costs are lower, due largely to less people being on
onwards.
pt ed
ART (Supplementary Figure 2 (j)). Further outputs are shown in Supplementary Figure 2(k)
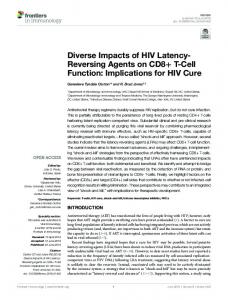
With regard to projected costs, the main differences between the scenario with and without an
ce
ART-free viral suppression intervention are the cost of ART, the cost of the ART-free viral suppression intervention, the cost of clinic visits (less expensive in people with ART-free
Ac
viral suppression), and the cost of viral load tests (since these are done more frequently in people with ART-free viral suppression) (Figure 1). The ART-free viral suppression intervention results in 539,738 DALYs being averted (252,215 life years gained) which equates to an average 2.6% reduction in death rate in the whole population age 15-65 (Table
Downloaded from http://jid.oxfordjournals.org/ by guest on April 11, 2016
people with HIV is projected to be lower with the ART-free viral suppression intervention by
11
3). The ART-free viral suppression intervention also results in a reduction in costs of $298m (discounted), which represents an 8.7% reduction in the total budget over that period.
ipt
We also explored the effect of variations in assumptions on the DALYs averted with the ART-free viral suppression intervention (Supplementary Figure 3). Assumptions about the
us cr
degree to which ART is expected to be durably successful affect the magnitude of benefit of the ART-free viral suppression intervention. In particular, when we assume a higher rate of interruption of ART (such that only 63% of ART experienced people have viral load < 500
M an
of the ART-free viral suppression intervention is also greater if we assume that the rate ratio compared with the HIV negative population for non-AIDS mortality in people in people with ART-free viral suppression success is 1.0, but higher (at 1.3 fold or 1.7 fold) for people with viral suppression on ART. If the disability weight from ART toxicity is assumed to be 0.15
greater.
pt ed
rather than 0.05 then the impact of the ART-free viral suppression intervention is again
Figure 2 presents the cost-effectiveness of the ART-free viral suppression intervention according to variation in combinations of key uncertain parameters of ART-free viral
ce
suppression efficacy and access, and cost parameters. The most strongly influential of these factors for cost-effectiveness is the cost of the ART-free viral suppression intervention, with
Ac
the efficacy of the intervention (degree of reduction in the viral rebound rate from the initial rate of 0.05 per year) also influential. In the context of the base case the threshold cost of the
ART-free viral suppression intervention to be cost-effective is $1400, and the threshold to be cost-saving is $975. If the ART-free viral suppression intervention efficacy is lower, such
that the % reduction in viral rebound rate / year is instead 20%, then the threshold cost of the
Downloaded from http://jid.oxfordjournals.org/ by guest on April 11, 2016
cps/mL, compared with 73% in the base case), the intervention benefit is greater. The benefit
12
ART-free viral suppression intervention to be cost-effective is $1000 and the threshold cost to be cost saving is $700.
ipt
Discussion
In this modelling and economic evaluation we have assessed what properties an intervention
us cr
aimed at HIV “cure” should have in order for it to represent a cost effective option in low resource settings. The key determinants of the cost effectiveness / impact of an AVFS
intervention are the efficacy of the intervention (as defined by the rate of rebound over time)
M an
viral suppression intervention would need to cost below $1400 in order to be cost-effective. The predicted benefits of an ART-free viral suppression intervention depend on our predicted outcomes of ART. It is difficult to be certain about long-term outcomes of ART when potent regimens have been in use for less than 20 years, and for little over 12 years in southern
pt ed
Africa. However, data on levels of viral suppression from sub-Saharan Africa indicate that therapy is highly effective (29, 40-43). Long-term rates of virologic rebound in high-income settings have shown low and decreasing rates of viral rebound over time (28, 44). Our sensitivity analyses suggest that if our model proves to be overly optimistic regarding ART
ce
efficacy - which is plausible given experiences in high-income countries - then then more expensive ART-free viral suppression interventions would become cost-effective and cost-
Ac
saving.
The costs associated with adopting the ART-free viral suppression intervention are highest soon after introduction due to the cost of the intervention itself and the increased intensity of viral load monitoring required in the initial period after the interruption. Without such frequent monitoring - 3 monthly for 5 years - a significant proportion of people could
Downloaded from http://jid.oxfordjournals.org/ by guest on April 11, 2016
and the cost of the intervention. With the efficacy assumed in our base case, the ART-free
13
experience a sustained period of high level viraemia (higher than that in people with viral breakthrough on ART). Over the longer term within our 20 year time horizon (to 2042) the
ipt
ART-free viral suppression intervention is associated with lower costs than continued ART.
The intention of this evaluation is to provide one source of guidance as research into potential
us cr
ART-free viral suppression interventions moves forward. The potential impact of an HIV vaccine has been evaluated in such a way previously (23, 45). In addition, modelling and
cost-effectiveness analyses have been used to identify the attributes of different types of cure
M an
included gene therapy, chemotherapy, and stem cell transplantation. There are many
similarities in the approach used with our own, with the use of individual-based simulation models which consider possible relapse rates and the consequences. The main differences concern our focus on sub-Saharan Africa rather than high income settings, with substantial implications for the cost of cure regimens that might be cost-effective, and our inclusion via a
pt ed
dynamic transmission model of effects on HIV incidence. In building our model of the ART-free viral suppression intervention we have not explicitly distinguished between an intervention that results in HIV eradication and one that results in
ce
sustained immune control of HIV. In the latter situation, advantages might be that viral rebound, if it occurs, would be less dramatic, and that there may be protection from super-
Ac
infection. A theoretical potential disadvantage is that due to presence of low levels of virus there may remain persistent immune activation and less restoration of health. A potential additional benefit of an ART-free viral suppression intervention that we did not include is that the availability of a “cure” may give an added impetus to ART programmes and lead to higher levels of HIV testing and greater engagement with, and adherence to, ART if there is the prospect of access to the intervention.
Downloaded from http://jid.oxfordjournals.org/ by guest on April 11, 2016
approaches required to be cost-effective (46). Specific cure strategies that were considered
14
Our work has the limitation that we naturally have had to make a number of assumptions. The success of prevention efforts and future HIV incidence are uncertain, although the impact
ipt
of the ART-free viral suppression intervention is not highly sensitive to these factors. The greatest uncertainties of the impact of the ART-free viral suppression intervention relate to
us cr
the properties of that intervention and, to a lesser extent, the future effects of ART. In
addition, we considered a time scale of 20 years and the impact of the intervention would be expected to become greater with time, after a large initial investment. In addition, we
M an
Zimbabwe are on third line regimens. We also assumed that pre-exposure prophylaxis would not be available when it is likely to be used in future to some extent. In conclusion, a new ART-free viral suppression intervention has the potential to avert DALYs and result in substantial cost savings in HIV care. However, the intervention will
pt ed
need to meet a stringent set of specifications in order for this to be the case. The cure field can utilize models such as this to better define its product development and delivery system
Ac
ce
imperatives.
Downloaded from http://jid.oxfordjournals.org/ by guest on April 11, 2016
assumed that third line regimens are not available when in fact small numbers of people in
15
Acknowledgements
ipt
Funding from the Bill & Melinda Gates Foundation, via a grant to Imperial College London for the HIV Modelling Consortium. We thank colleagues supporting the Legion computing
us cr
cluster (Legion@UCL) for critical computing support. SD and SRL are supported by the
National institutes of Health Delaney AIDS Research Enterprise (DARE) to find a cure U19 AI096109. SRL is an Australian National Health and Medical Research Council (NHMRC) Practitioner Fellow. JDL was supported by the Danish National Research Foundation [grant
M an
Author Contributions
All authors contributed to defining the analysis concept and design, providing critical input to
pt ed
the conduct of the modelling analysis, and writing the manuscript. AP, VC and FN developed the model and conducted the modelling analysis.
ce
Conflicts of Interests
Dr. Phillips reports grants from BMGF, during the conduct of the study; personal fees from
Ac
Gilead Sciences, personal fees from Abbvie, personal fees from GSK Biologicals, personal fees from Ashfield Communications, outside the submitted work. Dr. Hallett reports grants from BMGF, World Bank, UNAIDS, Rush Foundation, Wellcome Trust, personal fees from BMGF, New York University, WHO, GFATM, outside the submitted work.
Downloaded from http://jid.oxfordjournals.org/ by guest on April 11, 2016
no 126].
16
References
ipt
1. The International AIDS Society Scientific Working Group on HIV Cure. Towards an
us cr
HIV cure: a global scientific strategy. Nat Rev Immunol 2012; 12: 607-614.
2. Lewin SR, Deeks SG, Barré-Sinoussi F. Towards a cure for HIV—are we making progress? Lancet 2014; 384: 209-211.
M an
infection: Targeting the latent reservoir for HIV-1. J Allergy Clinic Immunol. 2014; 134: 12–19.
pt ed
4. Margolis DM. How Might We Cure HIV ? Curr Infect Dis Rep 2014; 16:392 DOI 10.1007/s11908-014-0392-2
5. Passaes CP, Sáez-Cirión A HIV cure research: advances and prospects. Virology
ce
2014; http://dx.doi.org/10.1016/j.virol.2014.02.021.
Ac
6. Fauci AS, Marston HD, Folkers GK. An HIV Cure. Feasibility, Discovery, and Implementation. JAMA 2014; 312: 335-336.
7. Hansen SG, Piatak M, Ventura AB, et al. Immune clearance of highly pathogenic SIV infection. Nature 2013; 502: doi:10.1038/nature12519
Downloaded from http://jid.oxfordjournals.org/ by guest on April 11, 2016
3. Siliciano JD, Siliciano RF. Recent developments in the search for a cure for HIV-1
17
8. Henrich TJ, HanhauserE, Marty FM, et al. Antiretroviral-Free HIV-1 Remission and Viral Rebound After Allogeneic Stem Cell Transplantation. Report of 2 Cases. Ann
ipt
Intern Med. 2014;161:319-327. doi:10.7326/M14-1027.
9. Gregson S, Gonese E, Hallett TB, et al. HIV decline in Zimbabwe due to reductions
2010;39:1311–1323.
10. UNAIDS. Global AIDS response progress report 2012. Follow up to the 2011
M an
Political Declaration on HIV/AIDS: Intensifying our efforts to eliminate HIV/AIDS. Zimbabwe Country Report. Reporting Period: January 2010-December 2011. http://www.unaids.org/en/dataanalysis/knowyourresponse/countryprogressreports/201 2countries/ce_ZW_Narrative_Report.pdf
pt ed
11. Mutasa-Apollo T, Shiraishi RW, Takarinda KC, Dzangare J, Mugurungi O, et al. (2014) Patient Retention, Clinical Outcomes and Attrition-Associated Factors of HIVInfected Patients Enrolled in Zimbabwe’s National Antiretroviral Therapy
ce
Programme, 2007–2010. PLoS ONE 9(1): e86305. doi:10.1371/journal.pone.0086305
12. Halperin DT, Mugurungi O, Hallett TB, Muchini B, Campbell B, et al. (2011) A
Ac
Surprising Prevention Success: Why Did the HIV Epidemic Decline in Zimbabwe? PLoS Med 8(2): e1000414. doi:10.1371/journal.pmed.1000414
Downloaded from http://jid.oxfordjournals.org/ by guest on April 11, 2016
us cr
in risky sex? Evidence from a comprehensive epidemiological review. Int J Epid
18
13. Zimbabwe National Statistics Agency (ZIMSTAT) and ICF International. 2012. Zimbabwe Demographic and Health Survey 2010-11. Calverton, Maryland:
ipt
ZIMSTAT and ICF International Inc.
us cr
14. Global Fund to Fight HIV, TB and Malaria. Zimbabwe Quarterly reports.
15. CIA World Factbook 2015 (https://www.cia.gov/library/publications/the-worldfactbook/geos/zi.html).
M an
17. PSI (Population Services International), Zimbabwe.
18. Zimbabwe National Statistics Agency (ZIMSTAT) and ICF International. 2012.
pt ed
Zimbabwe Demographic and Health Survey 2010-11. Calverton, Maryland: ZIMSTAT and ICF International Inc.
19. Cowan FM, Davey C, Fearon E, Mushati P, Dirawo J, Cambiano V, et al. The HIV
ce
care cascade among female sex workers in Zimbabwe. Baseline results of the Sisters ART Programme for Prevention of HIV: an Integrated Response (SAPPH-Ire) Trial.
Ac
(submitted for publication)
20. Phillips AN, Pillay D, Garnett G, et al. Effect on transmission of HIV-1 resistance of timing of implementation of viral load monitoring to determine switches from first to
Downloaded from http://jid.oxfordjournals.org/ by guest on April 11, 2016
16. UNAIDS. Global AIDS Response Country Progress Report. Zimbabwe 2014.
19
second-line antiretroviral regimens in resource-limited settings. AIDS 2011; 25(6):843-50.
ipt
21. Cambiano V, Bertagnolio S, Jordan MR, Lundgren JD, Phillips AN. Transmission of drug resistant HIV and its potential impact on mortality and treatment outcomes in
us cr
resource-limited settings. J Infect Dis 2013 Jun 15; 207 Suppl 2:S57-S62.
22. Cambiano V, Ford D, Mabugu T, et al. Assessment of the potential impact and cost-
M an
10.1093/infdis/jiv040.
23. Phillips AN, Cambiano C, Nakagawa F, et al. Potential future impact of a partially effective HIV vaccine in a southern African setting. PLoS ONE 2014; DOI:
pt ed
10.1371/journal.pone.0107214
24. Chi, B. H. et al. Adherence to first-line antiretroviral therapy affects non-virologic outcomes among patients on treatment for more than 12 months in Lusaka, Zambia.
ce
Int J Epidemiol 38, 746-756 (2009).
25. Genberg, B. L. et al. Patterns of antiretroviral therapy adherence and impact on HIV
Ac
RNA among patients in North America. AIDS 26, 1415 (2012)
Downloaded from http://jid.oxfordjournals.org/ by guest on April 11, 2016
effectiveness of self-testing for HIV in low income countries. J Infect Dis 2015; DOI:
20
26. Kranzer, K. et al. Treatment interruption in a primary care antiretroviral therapy programme in South Africa: cohort analysis of trends and risk factors. Journal of
27. WHO. Resistance Surveillance Report 2012.
us cr
http://www.who.int/hiv/pub/drugresistance/report2012/en/
ipt
acquired immune deficiency syndromes 55, e17 (2010).
28. Cozzi-Lepri A, Dunn D, Pillay D, Sabin CA, Fearnhill E, Geretti A, et al. Long term
M an
nucleoside reverse transcriptase inhibitor- or ritonavir boosted protease inhibitorcontaining antiretroviral therapy. Clin Infect Dis 2010; 50:1275-1285.
29. Fox, M.P., Cutsem, G.V., Giddy, J., Maskew, M., Keiser, O., Prozesky, H., Wood, R., Hernan, M.A., Sterne, J.A., Egger, M., & Boulle, A. 2012. Rates and predictors of
pt ed
failure of first-line antiretroviral therapy and switch to second-line ART in South Africa. J Acquir. Immune. Defic.Syndr., 2012; 60, (4) 428-437 available from: PM:22433846
ce
30. Rodger AJ, Lodwick R, Schechter M, et al. Mortality in well controlled HIV in the continuous antiretroviral therapy arms of the SMART and ESPRIT trials compared
Ac
with the general population. AIDS 2013; 27: 973–79.
31. Lewden C, Bouteloup V, De Wit S, Sabin C, Mocroft A, Wasmuth JC, et al. All-cause mortality in treated HIV-infected adults with CD4 ≥500/mm3 compared with the
Downloaded from http://jid.oxfordjournals.org/ by guest on April 11, 2016
probability of detecting HIV drug resistance in drug-naïve patients starting non
21
general population: evidence from a large European observational cohort collaboration. Int J Epidemiol 2012; 41:433–445. doi:10.1093/ije/dyr164.
ipt
32. Legarth R, Ahlstrom MG, Kronborg G, Larsen CS, Pedersen C, Pedersen G. Longterm mortality in HIV-infected individuals 50 years or older: a nationwide, population
us cr
based cohort study. JAIDS (in press).
33. Tagar E, Sundaram M, Condliffe K, Matatiyo B, Chimbwandira F, et al. (2014)
M an
ART Unit Cost Analysis in Ethiopia, Malawi, Rwanda, South Africa and Zambia. PLoS ONE 9(11): e108304. doi:10.1371/journal.pone.0108304
34. Untangling the web of antiretroviral price reductions. 17th Edition – July 2014.
pt ed
www.msfaccess.org.
35. Salomon JA, Vos T, Hogan DR, et al. Common values in assessing health outcomes from disease and injury: disability weights measurement study for the Global Burden
ce
of Disease Study 2010. Lancet 2012; 380: 2129–43.
36. Miners, A., et al. Health-related quality-of-life of people with HIV in the era of
Ac
combination antiretroviral treatment: a cross-sectional comparison with the general population. Lancet HIV (2014).
Downloaded from http://jid.oxfordjournals.org/ by guest on April 11, 2016
Multi-Country Analysis of Treatment Costs for HIV/AIDS (MATCH): Facility-Level
22
37. Claxton, K., Walker, S., Palmer, S., Sculpher, M., ‘Appropriate Perspectives for Health Care Decisions’, Centre for Health Economics Research Paper 54, University
ipt
of York, 2010.
38. Woods E, Revill P, Sculpher M, Claxton K. Country-Level Cost- Effectiveness
us cr
Thresholds: Initial Estimates and the Need for Further Research.
https://www.york.ac.uk/media/che/documents/papers/researchpapers/CHERP109_cos t-effectiveness_threshold_LMICs.pdf
M an
40. Fatti G, Mothibi E, Meintjes G, Grimwood A. Antiretroviral Treatment Outcomes amongst Older Adults in a Large Multicentre Cohort in South Africa. PLoS ONE
pt ed
2014; 9(6): e100273. doi:10.1371/journal.pone.0100273.
41. Billioux A, Nakigozi G, Newell K, Chang LW, Quinn TC, Gray RH, et al. Durable Suppression of HIV-1 after Virologic Monitoring-Based Antiretroviral Adherence Counseling in Rakai, Uganda. PLoS ONE 2015; 10(5): e0127235.
ce
doi:10.1371/journal.pone.0127235
Ac
42. Amoroso A, Etienne-Mesubi M, Edozien A, Ojoo S, Sheneberger R, Obiefune M, et al. Treatment Outcomes of Recommended First-Line Antiretroviral Regimens in Resource-Limited Clinics. J Acquir Immune Defic Syndr 2012;60:314–320
Downloaded from http://jid.oxfordjournals.org/ by guest on April 11, 2016
39. http://data.worldbank.org/indicator/NY.GDP.PCAP.CD
23
43. Government of Malawi Ministry of Health. Integrated HIV Program Report. April June 2014.
ipt
44. O'Connor J, Smith C, Lampe F, et al. Rate of viral load failure over time in people on ART in the UK Collaborative HIV Cohort (CHIC) study. J Int AIDS Soc 2014;
us cr
17:25-26.
45. Leelahavarong P, Teerawattananon Y, Werayingyong P, et al. Is a HIV vaccine a
M an
into existing prevention programs in Thailand. BMC Public Health 2011; 11: DOI: 10.1186/1471-2458-11-534.
46. Sax PE, Sypek A, Berkowitz BK, Morris BL, Losina E, et al. (2014) HIV Cure Strategies: How Good Must They Be to Improve on Current Antiretroviral Therapy?
Ac
ce
pt ed
PLoS ONE 9(11): e113031. doi:10.1371/journal.pone.0113031
Downloaded from http://jid.oxfordjournals.org/ by guest on April 11, 2016
viable option and at what price? An economic evaluation of adding HIV vaccination
24
Table 1. Illustration of the modelled effect of ART. Model outputs of status in 2025 and 2035 for people starting ART in 2015. These outputs reflect model assumptions regarding
ipt
multiple aspects, including adherence patterns, resistance acquisition, effect of adherence and resistance on virologic outcome and CD4 count changes, the rate of interruption of ART and
Outcome
Model outputs of status at 10 and 20 years
M an
from start of ART for people starting ART in 2015
20 years from start
of ART (i.e. in
of ART (i.e. in
2025)
2035)
pt ed
10 years from start
53%
31%
On ART with viral load > 1000 copies/mL
6%
3%
Alive but off ART
9%
5%
Dead from HIV disease
20%
40%
Of those alive on ART, percentage
37%
34%
24%
37%
Ac
ce
On ART with viral load < 1000 copies/mL
experiencing an ART toxicity Of those alive on ART, percentage on second-line ART
Downloaded from http://jid.oxfordjournals.org/ by guest on April 11, 2016
us cr
of ART toxicity*.
25
Of those alive on ART, percentage with
44%
56%
1%
2%
NNRTI drug resistance Of those alive on ART, percentage with
ipt
resistance to NNRTI, NRTI and PI classes
us cr
* Full details of modelling of effect of ART are given in Supplementary Material. Also see supplementary material for details and comparison of outputs for adherence, virologic
outcome, NNRTI resistance, ART discontinuation (20-29) See also references 20-23 for
M an pt ed ce Ac
Downloaded from http://jid.oxfordjournals.org/ by guest on April 11, 2016
additional details.
26
7,971,000
Number tested for HIV (per 3
687,000
months) Proportion of men circumcised (age 15-65) Incidence of HIV (per 100 person
0.27
0.99
Observed data
us cr
Population size age 15-65
2020
8,946,000
8,000,000&
882,000
2,274,328 age 15-49
M an
2014
0.46
tested in 2013* 0.26 in men age 1529 in 2014^
0.61
0.98 in 2013*
0.15 in 2011 DHS**
pt ed
years) age 15-65
0.14
0.11
Number living with HIV
1,167,000
1,124,000
Of people with HIV, proportion
0.84
0.91
678,000
801,000
ce
Prevalence of HIV age 15-49
diagnosed
Ac
Number on ART (age 15-65)
Of people diagnosed with HIV,
2015*** 0.75
0.87
0.58
0.78
proportion ever started ART Of people with HIV, proportion
~700,000 on 1st Jan
Downloaded from http://jid.oxfordjournals.org/ by guest on April 11, 2016
Output
ipt
Table 2. Characteristics of the simulated population of Zimbabwe in 2014 and 2020
27
on ART Death rate (per 100 person years)
1.81
1.57
5.45
4.54
1.15 age 15-49**
Death rate (per 100 person years) in people with HIV age 15-65 Death rate (per 100 person years)
4.13
in people on ART age 15-65
Of people who ever started ART, proportion who have started 2nd line
0.05
0.19
0.52
0.39
pt ed
Of people with HIV, proportion
0.84
M an
with VL below 500 copies/mL
0.81
3.20
0.78 +
< 0.02***
with VL above 500 copies/mL
Of people who ever started ART,
0.13
0.24
proportion who have failed first
CIA World Factbook 2015 (https://www.cia.gov/library/publications/the-world-
Ac
&
ce
line
factbook/geos/zi.html). * UNAIDS. Global AIDS Response Country Progress Report. Zimbabwe 2014. ^ Data from PSI, Zimbabwe (personal communication). ** Zimbabwe National Statistics Agency
(ZIMSTAT) and ICF International. 2012. Zimbabwe Demographic and Health Survey 2010-
Downloaded from http://jid.oxfordjournals.org/ by guest on April 11, 2016
Of people on ART, proportion
us cr
65
ipt
in whole adult population age 15-
28
11. Calverton, Maryland: ZIMSTAT and ICF International Inc. *** personal communication
M an pt ed ce Ac
Downloaded from http://jid.oxfordjournals.org/ by guest on April 11, 2016
us cr
ipt
J Murungu MoHCC. + baseline results SAPPH-IRe trial;
29
Table 3. Discounted DALYs and costs over 20 years (2022-2042) with and without ARTfree viral suppression intervention. Base case.
No ART-free viral
ipt
ART-free viral
suppression
intervention
intervention
us cr
suppression
--------------------------------------------------------------------------------------------------------------------------------
DALYs averted compared with no ART-free viral suppression
539,738
pt ed
intervention
47,150,234
M an
46,610,496
----
$3,139
$3,437
Increment in costs (in $m)
-$298
----
ce
Costs (in $m)*
compared with no ART-free
Ac
viral suppression intervention
--------------------------------------------------------------------------------------------------------------------------------
* 8.7% reduction in costs with ART-free viral suppression intervention
Downloaded from http://jid.oxfordjournals.org/ by guest on April 11, 2016
DALYs
30
Figure Legends
Figure 1. Overall programme costs in ($m over 20 years from 2022-2042) according to
ipt
whether the ART-free viral suppression (AFVS) intervention is introduced or not (discounted at 3% per
us cr
annum from 2015 )
Figure 2. Results of multi-way sensitivity analysis showing the effects of (i) efficacy and
M an
effectiveness and level of cost saving. In the context of the base case, highlighted, (% of people with access = 90%, % reduction in viral rebound rate / year = 50%, cost of viral load $22, cost of visits during ART-free viral suppression success $10), the threshold cost of the ART-free viral suppression intervention to be cost-effective = $1400, and the threshold to be
Ac
ce
pt ed
cost-saving = $975.
Downloaded from http://jid.oxfordjournals.org/ by guest on April 11, 2016
access of the ART-free viral suppression (AFVS) intervention and (ii) unit costs, on the cost
Downloaded from http://jid.oxfordjournals.org/ by guest on April 11, 2016
an us cr ipt
Overall programme costs in ($m over 20 years from 2022-2042) according to whether the ART-free viral suppression (AFVS) intervention is introduced or not (discounted at 3% per annu
AFVS
200000
400000
pt
0
ed
M
No AFVS
600000
Ac
ce
ART CD4 tests VL tests clinic visits treatment and care for WHO stage 3 and 4 conditions ART adherence intervention when VL > 1000 HIV testing AFVS intervention
800000
1000000 1200000 Millions of US $
% reduction in viral rebound rate / year
50%
an us cr ipt
80%
% of people with access to AFVS intervention 90%
Cost AFVS intervention
$5
Cost AFVS intervention
VL cost
$200 $500
$1000
Cost AFVS intervention
$500
$1000
pt
Cost of visits during AFVS success
$200
$2000
Cost AFVS intervention
$200
ce
$22
50%
ed
$2000
$5
Ac
$10
not cost effective
$1000 $2000
$10
Costs
$500
90%
M
$10
Cost of visits during AFVS success
$200
50%
% of people with access to AFVS intervention
cost effective at $500
less DALYs, lower cost (>20% saving in total cost)
$500
$1000
$2000
less DALYs, lower cost (up to 20% saving in total costs)
Downloaded from http://jid.oxfordjournals.org/ by guest on April 11, 2016
Efficacy and access
20%
% of people with access to AFVS intervention 90%
50%