Identifying Metabolic Pathway within Microarray Gene Expression Data Using Combination of Probabilistic Models Abdul Hakim Mohamed Salleh and Mohd Saberi Mohamad Artificial Intelligence and Bioinformatics Research Group, Faculty of Computer Science and Information System, Universiti Teknologi Malaysia, 81310 UTM Skudai, Johor, Malaysia
[email protected],
[email protected]
Abstract. Extracting metabolic pathway that dictates a specific biological response is currently one of the important disciplines in metabolic system biology research. Previous methods have successfully identified those pathways but without concerning the genetic effect and relationship of the genes, the underlying structure is not precisely represented and cannot be justified to be significant biologically. In this article, probabilistic models capable of identifying the significant pathways through metabolic networks that are related to a specific biological response are implemented. This article utilized combination of two probabilistic models, using ranking, clustering and classification techniques to address limitations of previous methods with the annotation to Kyoto Encyclopedia of Genes and Genomes (KEGG) to ensure the pathways are biologically plausible. Keywords: Metabolic pathway, biological response, probabilistic models, annotation.
1
Introduction
A metabolic pathway which comprise of coordinated sequence of biochemical reactions is a small segment of the overall metabolic network that contribute to a specific biological function. However, a complete metabolic network is so huge and highly complex that the key pathways contributing to the responses are usually hidden. Therefore, an appropriate and effective model to extract and identify the pathways which at the same time takes account of the biological interactions between the components is required so that the real underlying structure of the system can be precisely obtained. Many of the approaches that have been done before can successfully identify a pathway within the metabolic networks but none of them can clearly justify that the pathway extracted has a significant contribution in a certain metabolic response since none are considering the genetic interactions within the components level. Models such as network expansion [1] and Flux Balance Analysis (FBA) [2] only focused on D. Lukose, A.R. Ahmad, and A. Suliman (Eds.): KTW 2011, CCIS 295, pp. 52–61, 2012. © Springer-Verlag Berlin Heidelberg 2012
Identifying Metabolic Pathway within Microarray Gene Expression Data
53
chemical properties of metabolic network and do not directly consider the genetic component in the network. Numerous amount of research incorporate the genetic factors that contribute to the function of metabolic networks as proposed by Karp et al. (2010) [3] and Mlecnik et al. (2005) [4], but they can only identify groups of specified genes are important although only some genes within this known groups are contributing to the observe response. Other research such as Gene Set Enrichment Analysis (GSEA) [5] do not incorporate the known networked structure of genes but instead rely on structure of simple test statistics. Probabilistic network models such as Markov Random Field [6] and Mixture Model on Graph [7] on the other hand able to confirm that the features to be logically connected within the metabolic network but an assumption has to be made that is the gene expression is discretely distributed. This may not correctly describe the underlying structure and mechanisms of the system. This article discuss about the implementation based on combination of probabilistic models which has similar concept with GSEA but additionally takes account of the network structure [8]. With the use of pathway annotation from Kyoto Encyclopedia of Genes and Genomes (KEGG) this approach can overcome the limitations mentioned before and produce biologically plausible results. First, pathway ranking method [9] is applied to extract a number of pathways with maximum correlation through metabolic network. Then 3M Markov mixture model [10] is used to identify the functional components within the extracted pathways and finally Hierarchical Mixture of Experts, HME3M model [11] utilized as the classification model to identify set of pathways related to a particular response label. The techniques are implemented on GSE121 dataset, the observation of genetic differences between obese patients that are divided into insulin resistance and insulin sensitive. This article extend the findings by calculating the p-value for the best HME3M component and annotating the gene set to enzyme accession number from KEGG. The outcomes of the methods are represented as directed graph pathway comprises of the relations between reaction, compounds, genes and also enzymes involved in that particular pathway.
2
Methods
This research is conducted by implementing the framework of model developed by Hancock et al. (2010) [8] with the extension of finding enzymes involved in particular pathway. The first step is defining pathway to precisely identify the location of each gene denotes a specific function, by the fact that same gene can be found in multiple location with different biological functions within the metabolic network. This step will define specific location of each gene using node and edge annotations extracted from KEGG database [12]. In pathway definition, each gene is defined as node in the network and annotated by its gene code (G), reaction (R) and KEGG pathway membership (P) as in (1). nodes: = (G,R,P) ; edges: = (CF, CM, CT, P).
(1)
54
A.H. Mohamed Salleh and M.S. Mohamad
In addition, the edges that connect the nodes will be identified as first substrate compound (CF), the product compound of first reaction (CM), final product compound (CT) and (P) the final KEGG pathway membership of CT. Then, using annotation in equation (1), genetic pathway will be defined through metabolic network to be an extending connected sequence of genes, g, starting from specified start (s) and end compound (t) as shown in equation (2). s…
f(gk-1,gk) labelk-1
gk
f(gk,gk+1) labelk
gk+1
f(gk+1,gk+2) … t labelk+1
(2)
Each of the edges will also be evaluated by the functions f (gk, gk+1) which measure the strength of relationship between gk and gk+1 where label k is the edge annotation in equation (1). 2.1
Pathway Ranking
This second step is to find the pathway of maximum correlation trough metabolic network. This particular technique will identify K number of shortest and loop-less path within the weighted network [9] which is a non-parametric ranking procedure using Empirical Cumulative Distribution Function (ECDF) over all edge weights in the network. The ranking procedure will usually tend to biased towards shorter path consisting same genes due to high levels of redundancy in metabolic network. To overcome this problem two parameter are set. First, a parameter to control number of minimum genes in a pathway to remove small and insignificant pathways from pathway set. Secondly, as the result of redundancy, there will also be chains of reactions involving similar or identical genes therefore the second parameter is the user specified penalty p which control over the diversity of genes selection. An assigned of edge correlation, f (gk, gk+1) for all same gene edges will be used to specify penalty value. 2.2
Pathway Clustering
The goal for this important step is to identify set of pathways that produce the specific response and directly can be used to classify a particular response label. This research will utilize a pathway classifier based on the 3M Markov Mixture Model (3M) [10] which will provide the basic framework for the model. The 3M model will be used to identify M functional components by mixture of first order Markov chains as shown in equation (3). This method achieved competitive performance in terms of prediction accuracies with combination of two types of data sets, pathway graph and microarray gene expression data. M
K
m=1
k=2
p(x)= ∑ πmp(s|θ1m)∏ p(gk,labelk|gk-1; θkm)
(3)
Identifying Metabolic Pathway within Microarray Gene Expression Data
55
The πm is the probability of each components, transition probabilities θkm defines each components, p(si|θ1m) is the start compound probability of si and p(gk, labelk|gk-1; θkm) is the probability of path travers on edge labelk. The result of this 3M is M components defined by θm = { θsm, [θ2m,…, θtm,…, θTm]}. The θm is probabilities of each gene clustered within each component and indicate the importance of the genes. 2.3
Pathway Classification
For pathway classification, an extension to the previous 3M model, HME3M [11] will be used which incorporate Hierarchical Mixture of Experts (HME) that enables it to create a classification model from 3M model directly. In order to do so, additional term, p(y|X, βm) which is a classification model will be added to the equation (3) into equation (4). M
K
m=1
k=2
p(y|X)= ∑ πmp(y|X,βm)∏ p(gk,labelk|gk-1; θkm)
(4)
y is a binary response variable and X is a binary matrix where the columns represent genes and the rows represent a pathway and value of 1 indicates that the particular gene is included within specific path. The parameters πm, θkm and βm are estimated simultaneously with an EM algorithm [11]. The additional term p(y|X,βm) which takes the binary pathway matrix X weighted by the EM component probabilities as input and returns the output as the posterior probabilities for classification of the response variable y. To ensure a scalable and interpretable solution, HME3M uses a penalized logistic regression for each component classifier. The goal of HME3M is to identify a set of pathways that can be used to classify a particular response label, yl ∈y. By using set of genes that involved in the particular pathway, p-values for each pathway are calculated using the hypergeometric distribution. If the whole genome has a total of (m) genes, of which (t) are involved in the pathway under investigation, and the set of genes submitted for analysis has a total of (n) genes, of which (r) are involved in the same pathway, then the p-value can be calculated to evaluate enrichment significance for that pathway by equation (5): r-1
p=1-∑
x=0
2.4
t x
m-t n-x m n
(5)
Pathway Visualization
The most important HME3M pathway is visualize in nodes and edge representation by connected pathways, genes, compounds and reactions. One of the enhancements
56
A.H. Mohamed Salleh and M.S. Mohamad
made to this visualization technique is by incorporating the enzyme information that involved in the particular pathway based on set of genes that made up the pathway using the EC (Enzyme Commission) accession as well as the KO (KEGG Orthology) which both are annotated from KEGG database.
3
Results and Discussion
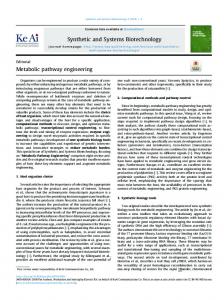
The dataset used is obtained from Gene Expression Omnibus (GEO) (GSE121) derived from an experiment of global transcript profiling to identify differentially expressed muscle genes in insulin resistance which is the prime causes of Type II diabetis-melitus [13]. Here this experiment presents the minimum path analysis of the HME3M [8]. The result shown in figures below are the key component for insulin resistant as identified by HME3M in terms of connected pathways (Figure 1), genes (Figure 2) and compounds (Figure 3) involved in that particular pathways. The edge thickness indicates the importance of that edge to the network and pathway with higher probability. This experiment is only focusing on insulin resistant as it is the key factor that contributes to Type II diabetes. This experiment is conducted by using number of minimum path to be extracted of 5 paths. From Figure 1 it can be concluded that there are 2 main pathway components to the insulin resistance biological response that is the purine metabolism as the primary driver as well as pyrimidine metabolism which also serve as the shortest path. Another significant path includes glutathione metabolism, alanine, aspartate and glutamate metabolism and also arginine and proline metabolism. These observations may cause by the ability of this model to classify genes into the correct pathway map and calculate the p-value to estimate membership as in Table 1. With the combination of probabilistic models, this method able to extract probable pathways that are biologically significant based on the annotation to the pathway database. It is clear from set of compounds that made up the pathway, the highest path probability would be the transition and conversion from C00002 (ATP) through C00046 (RNA), C00075 (UTP), C00063 (CTP), C00044 (GTP) and C01261 (GppppG) in Figure 3. This particular pathway result in production in ATP which is the significant signaling molecule in diabetes and insulin secretion as describe in Koster et al., 2005 [14]. In addition, the production of ATP that are occurring from C01260 (AppppA), C06197 (ApppA), C06198 (UppppU) or converted to C00575 (cAMP), C00020 (AMP) and C00008 (ADP) and then back to ATP by using is supported by previous researches to have impact on insulin resistance. Verspohl and Johannwille (1998) prove that AppppA and ApppA play important part in insulin secretion which may relate to diabetes [15] as well as production of GLP-1 by C00575 (cAMP) and nucleoside diphosphate kinase (NDK) enzyme in ADP to ATP conversion known factor in insulin secretion and Type II diabetes [16].
Identifying Metabolic Pathway within Microarray Gene Expression Data
57
Fig. 1. Connected pathways
From Figure 2 we can clearly see there is a gene with the accession number 318 which code for nudix (nucleoside diphosphate linked moiety X) –type motif 2 also known as NUDT2. This gene encodes a member of nucleotide pyrophosphatases which can asymmetrically hydrolyzes Ap4A to yield AMP and ATP and responsible for maintaining intracellular level of dinucleotide Ap4A. This research extend the findings of this experiment by using the set of genes involve in this particular pathway from HME3M classifier to calculate p-value for each related pathways to measure the gene membership in the pathway (Table 1). Here the top 15 pathways correspond to the set of genes are presented in the table. The gene ratio indicates the number of genes that are the members of the pathway from the number of genes produced by HME3M. Besides providing calculation for pvalue this research also provides the FDR-corrected q-values (if applicable) for reducing the false positive discovery rate.
58
A.H. Mohamed Salleh and M.S. Mohamad
Fig. 2. Connected genes of insulin resistant
Fig. 3. Connected compound of insulin resistant
From the table it is obvious that purine metabolism pathway has the lowest p-value with the highest gene ratio indicating the significant of the pathway with the gene set produce by HME3M component. The pathways are considered to be highly statistically significant if having p < 0.01.
Identifying Metabolic Pathway within Microarray Gene Expression Data
59
Table 1. Gene ratio, background ratio, p-value and q-value for each pathway Path
Pathway Name
00230
Purine metabolism Arginine and proline metabolism Ether lipid metabolism Alanine, aspartate and glutamate metabolism Linoleic acid metabolism Pyrimidine metabolism VEGF signaling pathway Histidine metabolism Fc epsilon RI signaling pathway Vascular smooth muscle contraction alpha-Linolenic acid metabolism Pyruvate metabolism Glycine, serine and threonine metabolism GnRH signaling pathway
00330 00565 00250 00591 00240 04370 00340 04664 04270 00592 00620 00260 04912
Gene Ratio 53/221
Background Ratio 161/25668
35/221
pvalue
qvalue
0.0000
0.0000
79/25668
0.0000
0.0000
14/221
35/25668
0.0000
0.0000
21/221
58/25668
0.0000
0.0000
14/221
29/25668
0.0000
0.0000
32/221
99/25668
0.0000
0.0000
15/221
76/25668
1.11E-16
7.51E-16
11/221
29/25668
4.44E-16
2.84E-15
14/221
79/25668
6.22E-15
3.76E-14
16/221
126/25668
1.63E-14
9.12E-14
9/221
19/25668
1.89E-14
1.03E-13
11/221
41/25668
3.79E-14
1.98E-13
10/221
31/25668
6.91E-14
3.45E-13
14/221
101/25668
2.15E-13
1.03E-12
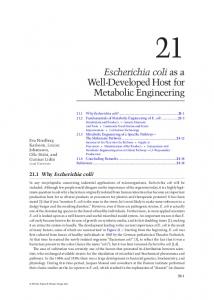
From the set of genes this research also extends the findings to identify the enzymes involved in the particular pathway. In order for researchers to gain benefits from this extension, they should have a prior knowledge in the study of enzymes involved in a particular pathway. Figure 4 shows the enzyme involve using undirected graph with the correlation to every members. EC: 3.6.1.5 for example is ATP diphosphohydrolase which responsible for the formation of AMP and phosphate using ATP and water as substrate as well as its role as modulator of extracellular nucleotide signaling and also contribute to changes in metabolism [17]. Figure 4 shows the corresponding enzymes that may contribute to insulin resistant. Some of the enzymes that potentially related to insulin resistant are for example EC: 1.7.1.7 is GMP reductase that has a role of producing NADPH, guaosine 5’ phosphate. EC: 2.7.1.73 is inosine kinase which has the role of converting ATP to ADP and the other way around which gives an impact on insulin resistance as mention before as well as EC: 3.6.1.8 (ATP diphosphatase) which also involved in ATP conversion to AMP. The AMP-activated protein kinase plays important part in lipid and glucose metabolism where it promotes glucose uptake into muscle and suppressed glucose output from liver via insulin independent mechanism [18].
60
A.H. Mohamed Salleh and M.S. Mohamad
Fig. 4. The related enzymes that contribute to diabetes and insulin resistant
4
Conclusion
In this article, we describe an experiment of identifying and analyzing biologically significant pathway using gene expression dataset within global metabolic network. The key aspect of this research is that it takes into account for analysis of the sub networks, compound, reaction and interaction which allows a better picture of metabolic response without neglecting the underlying structure and mechanisms of metabolic network. The method discussed in this research has shown its effectiveness in extracting biologically significant pathway by using a combine approach with pathway ranking, clustering and classification technique by using two algorithms as the core structure that is the 3M and HME3M. Acknowledgement. We also would like to thank Universiti Teknologi Malaysia for supporting this research by UTM GUP research grant (Vot number: Q.J130000.7107.01H29).
References 1. Handorf, T., Ebenhoh, O., Heinrich, R.: Expanding metabolic networks: scopes of compounds, robustness, and evolution. J. Mol. Evol. 61(4), 498–512 (2005) 2. Smolke, C.D.: The Metabolic Engineering Handbook: Tools and Applications. CRC Press, Boca Raton (2010)
Identifying Metabolic Pathway within Microarray Gene Expression Data
61
3. Karp, P.D., Paley, S.M., Krummenacker, M., Latendresse, M., Dale, J.M., Lee, T.J., Kaipa, P., Gilham, F., Spaulding, A., Popescu, L., Altman, T., Paulsen, I., Keseler, I.M., Caspi, R.: Pathway tools version 13.0: integrated software for pathway/genome informatics and systems biology. Brief Bioinform. 11(1), 40–79 (2010) 4. Mlecnik, B., Scheideler, M., Hackl, H., Hartler, J., Sanchez-Cabo, F., Trajanoski, Z.: PathwayExplorer: web service for visualizing high-throughput expression data on biological pathways. Nucleic Acids Research 33(1), 633–637 (2005) 5. Subramanian, A., Tamayo, P., Mootha, V.K., Mukherjee, S., Ebert, B.L., Gillette, M.A., Paulovich, A., Pomeroy, S.L., Golub, T.R., Lander, E.S., Mesirov, J.P.: Gene set enrichment analysis: A knowledge-based approach for interpreting genome-wide expression profiles. PNAS 102(43), 15545–15550 (2005) 6. Wei, Z., Li, H.: A markov random field model for network-based analysis of genomic data. Bioinformatics 23(12), 1537–1544 (2007) 7. Sanguinetti, G., Noirel, J., Wright, P.C.: Mmg: a probabilistic tool to identify submodules of metabolic pathways. Bioinformatics 24(8), 1078–1084 (2008) 8. Hancock, T., Takigawa, I., Mamitsuka, H.: Mining metabolic pathways through gene expression. Gene Expression 26(17), 2128–2135 (2010) 9. Takigawa, I., Mamitsuka, H.: Probabilistic path ranking based on adjacent pairwise coexpression for metabolic transcripts analysis. Bioinformatics 24(2), 250–257 (2008) 10. Mamitsuka, H., Okuno, Y., Yamaguchi, A.: Mining biologically active patterns in metabolic pathways using microarray expression profiles. SIGKDD Explorations 5(2), 113–121 (2003) 11. Hancock, T., Mamitsuka, H.: A Markov classification model for metabolic pathways. In: Workshop on Algorithms in Bioinformatics (WABI), pp. 30–40 (2009) 12. Kanehisa, M., Goto, S.: KEGG: Kyoto Encyclopedia of Genes and Genomes. Nucleic Acids Res. 28, 27–30 (2000) 13. Yang, X., Pratley, R.E., Tokraks, S., Bogardus, C., Permana, P.A.: Microarray profiling of skeletal muscle tissues from equally obese, non-diabetic insulin-sensitive and insulinresistant pima indians. Diabetologia 45, 1584–1593 (2002) 14. Koster, J.C., Permutt, M.A., Nichols, C.G.: Diabetes and insulin secretion: the ATP-sensitive k+ channel (k ATP) connection. Diabetes 54(11), 3065–3072 (2005) 15. Rusing, D., Verspohl, E.J.: Influence of diadenosine tetraphosphate (ap4a) on lipid metabolism. Cell Biochem. Funct. 22(5), 333–338 (2004) 16. Yu, Z., Jin, T.: New insights into the role of camp in the production and function of the incretin hormone glucagon-like peptide-1 (glp-1). Cell Signal 22(1), 1–8 (2010) 17. Enjyoji, K., Kotani, K., Thukral, C., Blumel, B., Sun, X., Wu, Y., Imai, M., Friedman, D., Csizmadia, E., Bleibel, W., Kahn, B.B., Robson, S.C.: Deletion of Cd39/Entpd1 Results in Hepatic Insulin Resistance. Diabetes 57, 2311–2320 (2007) 18. Hegarty, B.D., Turner, N., Cooney, G.J., Kraegen, E.W.: Insulin resistance and fuel homeostasis: the role of AMP-activated protein kinase. Acta Physiol. (Oxf) 196(1), 129–145 (2009)