RESEARCH ARTICLE
Identifying Shifts in Leaf-Litter Ant Assemblages (Hymenoptera: Formicidae) across Ecosystem Boundaries Using Multiple Sampling Methods Michal Wiezik1*, Marek Svitok2,3, Adela Wieziková2, Martin Dovčiak4 1 Department of Applied Ecology, Faculty of Ecology and Environmental Science, Technical University in Zvolen, Zvolen, Slovakia, 2 Department of Biology and General Ecology, Faculty of Ecology and Environmental Science, Technical University in Zvolen, Zvolen, Slovakia, 3 Department of Aquatic Ecology, Centre of Ecology, Evolution and Biogeochemistry, Eawag Swiss Federal Institute of Aquatic Science and Technology, Kastanienbaum, Switzerland, 4 Department of Environmental and Forest Biology, College of Environmental Science and Forestry, State University of New York, Syracuse, New York, United States of America *
[email protected]
Abstract OPEN ACCESS Citation: Wiezik M, Svitok M, Wieziková A, Dovčiak M (2015) Identifying Shifts in Leaf-Litter Ant Assemblages (Hymenoptera: Formicidae) across Ecosystem Boundaries Using Multiple Sampling Methods. PLoS ONE 10(7): e0134502. doi:10.1371/ journal.pone.0134502 Editor: Darren Ward, Landcare Research, NEW ZEALAND Received: April 13, 2015 Accepted: July 9, 2015 Published: July 30, 2015 Copyright: © 2015 Wiezik et al. This is an open access article distributed under the terms of the Creative Commons Attribution License, which permits unrestricted use, distribution, and reproduction in any medium, provided the original author and source are credited. Data Availability Statement: All relevant data are within the paper and its Supporting Information files. Funding: The study was co-funded by research grants no. 1/0186/14 and 2/0052/15 of the Slovak Grant Agency for Science (VEGA). Competing Interests: The authors have declared that no competing interests exist.
Global or regional environmental changes in climate or land use have been increasingly implied in shifts in boundaries (ecotones) between adjacent ecosystems such as beech or oak-dominated forests and forest-steppe ecotones that frequently co-occur near the southern range limits of deciduous forest biome in Europe. Yet, our ability to detect changes in biological communities across these ecosystems, or to understand their environmental drivers, can be hampered when different sampling methods are required to characterize biological communities of the adjacent but ecologically different ecosystems. Ants (Hymenoptera: Formicidae) have been shown to be particularly sensitive to changes in temperature and vegetation and they require different sampling methods in closed vs. open habitats. We compared ant assemblages of closed-forests (beech- or oak-dominated) and open foreststeppe habitats in southwestern Carpathians using methods for closed-forest (litter sifting) and open habitats (pitfall trapping), and developed an integrated sampling approach to characterize changes in ant assemblages across these adjacent ecosystems. Using both methods, we collected 5,328 individual ant workers from 28 species. Neither method represented ant communities completely, but pitfall trapping accounted for more species (24) than litter sifting (16). Although pitfall trapping characterized differences in species richness and composition among the ecosystems better, with beech forest being most species poor and ecotone most species rich, litter sifting was more successful in identifying characteristic litter-dwelling species in oak-dominated forest. The integrated sampling approach using both methods yielded more accurate characterization of species richness and composition, and particularly so in species-rich forest-steppe habitat where the combined sample identified significantly higher number of species compared to either of the two methods on their own. Thus, an integrated sampling approach should be used to fully characterize changes
PLOS ONE | DOI:10.1371/journal.pone.0134502 July 30, 2015
1 / 14
Forest Ant Sampling Method Comparison
in ant assemblages across ecosystem boundaries, or with vegetation change over time, and particularly so in species-rich habitats such as forest-steppe ecotones.
Introduction Ants (Hymenoptera: Formicidae) are a varied, abundant, and ubiquitous group of insects that can exert a strong influence as ecosystem engineers on physical, chemical, and biotic properties of terrestrial ecosystems, and especially on soil environment [1]. Ants belong among the most studied terrestrial invertebrates; they have been used to monitor ecosystem health and functioning [2–4], effects of changing climate [5, 6], as well as the effects of changing land-use and successional processes [7, 8]. Our understanding of the role of ants in ecosystems hinges to a large extent on the sampling methodology used to quantify the composition, richness, and abundance (or activity) of ant assemblages. While numerous sampling techniques are available, their suitability can vary substantially across different habitats and ant assemblages [9]. For example, pitfall trap method is the main method used for sampling epigaeic ant assemblages in relatively open habitats such as grasslands, deserts, or shrublands [8,10–14], while leaf-litter sampling method is preferred in forest habitats [15, 16]. Habitat specificity of sampling methods affects our ability to discern patterns present in ant assemblages across ecosystem boundaries (ecotones) and to compare ant assemblages between different ecosystems or within ecosystems undergoing successional changes in vegetation over time (e.g., due to changing climate or land-use). Studies contrasting sampling methods and developing a unified sampling framework that could be used among different ecosystems are needed, particularly in temperate forests and forest-steppe ecotones [17] where such work has been less frequent compared to tropical systems [18–21]. Pitfall trapping involves placement of an open container with a liquid preservative in the ground to trap ants active on the ground surface [9], but they are believed to under-sample litter-dwelling ants [9, 22]. Pitfall traps are cheap, easy-to-install, self-operating, and they can be used for relatively longer time periods [23]. Their main limitations are that samples (capture rates) vary with the locomotion type of ant species [24] and with the physical structure of the ground surface (i.e., thick and compact leaf-litter layer or stones may reduce capture rates; [25]). In addition, preserving agents in the traps may attract some and repel other ant species [23, 26] and catch efficiency can vary with the concentration of the preservative [27]. Leaf-litter sifting techniques have been developed to provide accurate estimates of litterdwelling ants by measuring their abundance within the sampled volume of leaf-litter [9]. The collected leaf litter is sieved manually or mechanically in an extraction apparatus (e.g., the Winkler extractor, Berlese funnel) in order to extract the ants [9, 23]. Sampling may underestimate abundance during very dry periods (when ants tend to move deeper in the soil; [9]) and for fast moving species (which may be harder to capture; [28]). Relative to pitfall traps, litter sampling is more time consuming, more costly, and it requires destructive sampling of litter [17, 29]. We compared how the two main sampling methods used in characterizing ant assemblages (pitfall traps and leaf-litter sifting) vary in their ability to characterize species richness and community composition across three adjacent temperate ecosystems (relatively mesic beech forest, dry oak forest, and dry forest-steppe ecotone). Accurate quantification of species richness (biodiversity) and community composition are important for our understanding of emergent community and ecosystem characteristics such as ecosystem productivity or
PLOS ONE | DOI:10.1371/journal.pone.0134502 July 30, 2015
2 / 14
Forest Ant Sampling Method Comparison
compositional stability (e.g., [30, 31]). In Central Europe, beech forests are among the most species-poor forest habitats, usually hosting only few ant species with very low population densities [32], while oak forests and forest-steppe habitats are usually among the most diverse [33, 34]. All three habitat types represent vegetation characteristic of low elevations in Western Carpathians [35] and other areas in Europe [36]. Climate change is likely to alter composition and boundaries of adjacent ecosystem types controlled by moisture and temperature gradients [37– 39] and ants may have a potential to serve as early bioindicators of these substantial changes in vegetation structure [2–9, 40], but see also [41]. Ants of warm and relatively mesic forests and forest-steppe habitats are believed to be particularly susceptible to climate warming [5]. The objectives of our study were (i) to contrast the ability of pitfall traps and leaf-litter sifting to characterize species composition, richness, and abundance of ant assemblages in adjacent mesic beech forest, dry oak forest, and dry forest-steppe ecotone, and (ii) to test whether the combination of the two methods is necessary to provide the full description of the ant assemblages across these adjacent ecosystems.
Material and Methods Study Area The study was carried out in the Boky Nature Reserve (48° 34´ N, 19° 02´ E, 280–579 m above sea level) located on southern slopes of the Kremnické vrchy Mts. in western Carpathians, Slovakia. The reserve is regarded as one of the most preserved oak dominated old-growth forest in Slovakia, with minimal historical human use [42]. The region has mean annual temperature of 7°C and annual precipitation of 720 mm. Rich brown soils on andesite bedrock and rankers are the dominant soil types. The forests in this area are composed of broad-leaved trees, mainly sessile oak (Quercus petraea), Turkey oak (Q. cerris), European hornbeam (Carpinus betulus), and European beech (Fagus sylvatica), together with admixtures of maple (Acer spp.), lime (Tilia spp.) and elm (Ulmus spp.). Patches of steppe and forest-steppe vegetation of the class Festuco-Brometea typically occur on steep slopes with shallow soils. European beech dominates the forest stands locally in places with increased soil moisture (mainly concave parts of slopes), while oaks dominate the majority of the area and especially exposed slopes and dry ridge tops [43]. The forest stands are characterized by their high stem density (> 850 stems ha-1), moderate above-ground growing stock (280 m3ha-1), and high diversity and amount of deadwood [42]. The reserve has been strictly protected since 1964. We conducted our research based on the research permission No. 2006/00924-Pe issued by the Regional Bureau of Environment in Banská Bystrica, Slovakia.
Sampling design and data collection Altogether nine 30 × 30 m study plots were established representing three habitat types: beech dominated forest, oak forest, and oak forest-steppe ecotone (three plots per habitat). The minimum distance between the plots representing a particular habitat was 230 m. All plots were separated by qualitatively different habitat. In each plot we intensively sampled ant assemblages using both pitfall trap method and litter sifting, applied in April, May, and July in 2009. In each plot, we established a transect consisting of three traps spaced at 5 m intervals, following the procedures used for studying epigaeic ant assemblages [44, 45]. The traps consisted of plastic cups with sealing (5 cm in diameter) buried at soil level and filled with 100 ml of 2% formaldehyde solution with addition of detergent to lower the surface tension. Each trap was left in place for 5 days before being opened in order to reduce digging-in effects [46]. The traps remained open for 5 consecutive days during each month, concluding in 135 trap-days (across 27 traps) per habitat in total.
PLOS ONE | DOI:10.1371/journal.pone.0134502 July 30, 2015
3 / 14
Forest Ant Sampling Method Comparison
Leaf litter was sampled at each plot from 16 randomly placed subplots (25 × 25 cm large), with 144 subplots sampled in total across the plots (3) and sampling times (3) per habitat (or the total area of 9 m2 per habitat). Most of the surface litter was collected, sieved through the Winkler extractor in order to exclude large particles, and placed into a large polythene bag. Litter-dwelling ants were extracted from the litter using the dry sieve method [47] with a set of three sieves of 12 mm, 5 mm, and 1 mm mesh sizes. From the sifted material the ants were manually extracted and preserved in 60% ethanol solution. Ants were identified at the species level according to [32]; only ant workers were considered in the statistical analyses.
Statistical analyses A two factor, partly nested (split-plot) design [48] was used to address our objectives. Total species richness, epigaeic activity (from pitfall traps), density (from sifting), and species composition expressed as qualitative species matrix (based on species presence/absence) as well as quantitative species matrix (based on species activity or density) were used as response variables. For each plot, obtained data were pooled across samples and months to prevent spatial and temporal dependencies and to generalize the responses over the course of the whole sampling period (i.e., May, June, and July). Response variables were compared among the three studied habitat types and two sampling techniques as follows. First, data from pitfall and sifting samples were analyzed separately using a series of simple linear models. The effect of different habitat types on univariate characteristics (richness, activity, and density) was assessed by one-way analysis of variance (ANOVA). Significant (α = 0.05) results of the overall tests were followed by pair-wise comparisons using Tukey’s HSD tests. Assumptions of each model were screened in diagnostic plots and data were log transformed when necessary. However, we use untransformed data in figures to facilitate interpretation. Multivariate data (qualitative and quantitative species matrices) were analyzed fitting the same linear models through permutational multivariate analysis of variance (PERMANOVA; [49]). The analyses of those matrices were based on Sørensen [50] and Bray-Curtis [51] dissimilarity, respectively. We included all ant species in the analyses as the preliminary screening showed minimal impact of the rare species on both statistical testing (identical conclusions) and ordination configurations (all Procrustes correlations > 0.95). However, quantitative species data were logtransformed to reduce the influence of dominant species and stabilize the variance. Probabilities of obtained test statistics were based on 9999 unrestricted permutations of raw data [52]. Significant results were followed by relevant pair-wise comparisons. Due to the limited number of permutable units, p values for the pair-wise tests were based on a random Monte Carlo samples from the asymptotic distribution of the test statistics under permutations [53]. P values in pair-wise tests were adjusted by Bonferroni correction to control for family-wise error rate. Species typical for samples from particular habitat or sampling technique were identified using indicator species analysis [54]. The indicator species analysis was conducted separately for ant activity, density and presence/absence data. The species with high indicator value (IndVal > 70%) were regarded as characteristic species. Response variables that are directly comparable between sampling methods (richness, qualitative species matrix) were analyzed using partly nested models, with habitat type as a between plot factor (fixed effect), sampling method as a within plot factor (fixed effect), and plot as a factor nested within habitat (random effect). Factor of sampling method consisted of three levels: pitfalls, sifting, and combination of these two methods representing an optimal sampling solution or standard. Species richness was assessed using traditional MANOVA accompanied with Tukey's HSD tests. Species presence/absence matrix was converted to Sørensen dissimilarities and analyzed using PERMANOVA with tests based on 9999 permutations of correct
PLOS ONE | DOI:10.1371/journal.pone.0134502 July 30, 2015
4 / 14
Forest Ant Sampling Method Comparison
exchangeable units [55]. Again, after the overall differences were found, relevant pair-wise test were adjusted by Bonferroni correction. In order to facilitate interpretation of the univariate analyses, mean values were plotted along with 95% confidence intervals. Confidence limits were computed by non-parametric bootstrap (10,000 samples) using a bias-corrected accelerated percentile method [56]. Confidence intervals for within plot factor (sampling method) were adjusted for repeated measurements of the same plots [57]. Non-metric multidimensional scaling (NMDS) [58] with halfchange scaling and principal component rotation was used to visualize differences in community composition. Scores of indicator species were added into ordinations as weighted sums of particular composition matrices. Statistical analyses were performed in DISTLM v.5 [59] (Anderson 2004) and R [60] using libraries boot [61], car [62], multcomp [63], nlme [64] and vegan [65].
Results We collected a total of 5,338 ant workers belonging to 28 species (Table 1). The total number of species recorded using both methods (pitfall traps and litter sifting) was highest at foreststeppe ecotone (24 species), intermediate in oak forest (17 species), and lowest in beech-dominated forest (11 species).
Variation in species richness, epigaeic activity, and abundance by habitat and method The two sampling methods differed in the numbers of recorded species (total richness) and they varied in their sensitivity in discerning the effects of habitat type. Across all habitats, we recorded 24 species in pitfall traps and 16 species by litter sifting, with the total of 16 species recorded by only one of the two methods (12 species by pitfall traps and 4 species by litter sifting). The two methods yielded similar estimates of the total species richness in the two forest habitats, but they differed greatly in forest-steppe ecotone where we recorded 22 species in pitfall traps but only 11 with litter sifting (Table 1). Pitfall trap data revealed a significant effect of habitat on species richness (F(2,6) = 6.35, p = 0.033), but not on overall epigaeic activity (F(2,6) = 2.40, p = 0.172). Forest-steppe ecotone had significantly higher species richness than beech forest, while species richness in oak forest was intermediate and statistically indistinguishable from the other two habitats (Fig 1). In contrast, litter sifting data did not discern significant effects of habitat on ant species richness (F(2,6) = 0.25, p = 0.787), but it suggested significant effects of habitat on ant abundance (F(2,6) = 6.22, p = 0.034). Oak forest had significantly higher abundance of ants than foreststeppe ecotone, while beech forest had an intermediate ant density (Fig 2).
Variation in species composition by habitat and method Community composition detected by pitfall traps showed significant differences between habitats regardless of the type of community matrix used (qualitative: pseudo-F = 5.25, p = 0.010; or quantitative: pseudo-F = 5.35, p = 0.007). Paired comparisons revealed significant differences in species composition between ecotones and beech forests (qualitative matrix: pseudot = 3.18, p = 0.031, quantitative matrix: pseudo-t = 3.12, p = 0.007). Characteristic indicator species (IndVal > 70%) were found only for ecotones (F. gagates, L. emarginatus, L. alienus) and beech forests (S. debile) (Fig 3). Community composition detected by litter sifting also suggested a significant effect of habitat using quantitative community matrix (pseudo-F = 3.56, p = 0.011), but not when qualitative matrix was used (pseudo-F = 1.70, p = 0.169). Nevertheless, due to the low power of tests, we
PLOS ONE | DOI:10.1371/journal.pone.0134502 July 30, 2015
5 / 14
Forest Ant Sampling Method Comparison
Table 1. Total activity and abundance (density) in beech-dominated forest, oak forest, and forest-steppe ecotone. Habitat
beech
Sampling method
oak
ecotone
pit
sift
pit
sift
pit
Sift
-
-
-
-
-
22
21
-
Ponerinae Ponera testacea Emery, 1895 Myrmicinae Myrmica lonae Finzi, 1926
-
3
3
-
M. ruginodis Nylander, 1846
48
41
22
M. sabuleti Meinert, 1861
11
11
Stenamma debile (Förster, 1850)
223
43
3
3
885
-
-
382
42
313
32
82
61
-
11
Aphaenogaster subterranea (Latreille, 1798)
-
-
11
Myrmecina graminicola (Latreille, 1802)
-
-
-
2
4
2
20
3
121
-
32
-
2
-
Solenopsis fugax (Latreille, 1798)
-
-
-
-
4
Temnothorax crassisspinus (Karavaiev, 1926)
573
5093
893
5053
213
273 -
1
T. nigriceps (Mayr, 1855)
-
2
-
-
-
T. parvulus (Schenck, 1852)
11
112
71
653
423
963
1
2
171
T. unifasciatus (Latreille, 1798)
-
-
-
1 1
8
2
Tetramorium caespitum (Linnaeus, 1758)
-
-
1
-
16
T. moravicum Kratochvíl, 1941
-
-
-
-
122
21
Dolichoderus quadripunctatus (Linnaeus, 1771)
-
-
-
-
11
-
Tapinoma erraticum (Latreille, 1798)
-
-
-
-
133
-
11
-
-
252
-
-
853
22 -
Dolichoderinae
Formicinae Plagiolepis pygmaea (Latreille, 1798) Lasius alienus (Förster, 1850)
-
2
4
1
9
1
L. brunneus (Latreille, 1798)
-
2
-
-
-
L. citrinus Emery, 1922
-
-
-
11
-
-
L. emarginatus (Olivier, 1792)
92
-
6083
1212
16033
11
L. niger (Linnaeus, 1758)
-
-
-
-
11
-
82
-
3
1
1
Camponotus ligniperdus (Latreille, 1802)
-
-
11
C. fallax (Nylander, 1856)
-
-
11
-
11
-
C. piceus (Leach, 1825)
-
-
-
-
51
-
C. aetiops (Latreille, 1798)
-
-
-
-
11
-
Formica fusca Linnaeus, 1758
-
-
32
-
202
-
F. gagates Latreille, 1798
-
11
32
11
1233
21
Total individuals
143
584
811
1599
2045
165
Number of species
7
9
13
11
22
11
Ant activity was sampled by pitfall traps (pit; number of ants captured per 9 traps and 15 days of sampling) and density was sampled by the leaf litter sifting (sift; number of ants sampled from surface of 9 m2). The number of plots where each species was present is indicated by superscript representing the number of plots with species present. doi:10.1371/journal.pone.0134502.t001
were not able to find significant pair-wise differences among habitats. L. emarginatus and M. ruginodis were identified as indicator species for oak forests (Fig 4).
Quantifying advantages of an integrated sampling approach We combined the two sampling methods and contrasted species richness and composition of the combined sample with richness and composition measured by the two methods
PLOS ONE | DOI:10.1371/journal.pone.0134502 July 30, 2015
6 / 14
Forest Ant Sampling Method Comparison
Fig 1. Ant species richness and epigaeic activity (mean ± 95% confidence interval) in beech, oak and ecotone habitats based on pitfall trap collections. Bars with the same lowercase letters are not significantly different. doi:10.1371/journal.pone.0134502.g001
independently. Split-plot MANOVA on species richness showed that the effect of sampling method depends on habitat (habitat × method: Wilks λ = 0.09, p = 0.010). Significant effect of sampling method was found for all three habitats (Fig 5). The integrated sampling approach yielded better richness estimates than both individual methods, and particularly so in species rich ecotone; the integrated richness estimates were comparable to pitfall trapping in oak forest and to litter sifting in beech forest. Pitfall trapping outperforms litter sifting only in ecotone (Fig 5). Multivariate analysis of species composition (using presence/absence data for consistence between the sampling methods) revealed that the sampling methods significantly differed in describing ant assemblages (pseudo-F = 6.86, p = 0.003) independently of habitat type (habitat × method: pseudo-F = 1.21, p = 0.356). The integrated sampling approach and pitfall trap method did not differ statistically in describing community composition (pseudo-t = 3.76, p = 0.117) (Fig 6). On the other hand, community composition revealed by sifting method differed significantly from the integrated sampling approach (pseudo-t = 3.43, p = 0.033). Differences between litter sifting and pitfall trapping were marginally non-significant (pseudot = 2.23, p = 0.096).
Fig 2. Ant species richness and density (mean ± 95% confidence interval) in beech, oak and ecotone habitats based on sifting method. Bars with the same lowercase letters are not significantly different. doi:10.1371/journal.pone.0134502.g002
PLOS ONE | DOI:10.1371/journal.pone.0134502 July 30, 2015
7 / 14
Forest Ant Sampling Method Comparison
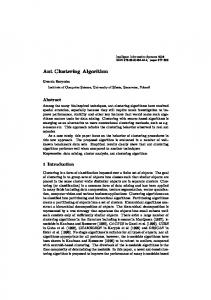
Fig 3. NMDS of pitfall trap data based on qualitative (presence/absence) matrix (a) and quantitative (activity) matrix (b). Squares, circles and diamonds represent beech, oak and ecotone habitats, respectively. Scores of characteristic indicator species (IndVal > 70%) are superimposed as × signs. Values of the final stress are displayed for each ordination. doi:10.1371/journal.pone.0134502.g003
Discussion Our results suggest that the two methods most commonly used in quantifying richness and composition of ant assemblages (i.e., pitfall traps, litter sifting) can lead to considerably different results, and especially so when comparing ant assemblages across different ecosystem or habitat types. The three ecosystem (habitat) types in our study represented a gradient in canopy openness, ranging from the closed forest of shade tolerant beech to a relatively more open oak forest to even more open habitat of the forest-steppe ecotone [43]. Canopy openness
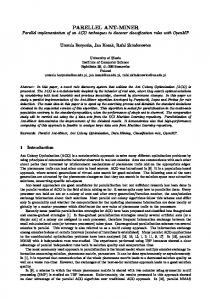
Fig 4. NMDS of sifting method data based on matrix of species density. Squares, circles and diamonds represent beech, oak and ecotone habitats, respectively. Scores of characteristic indicator species (IndVal > 70%) are superimposed as × signs. Value of the final stress is displayed. doi:10.1371/journal.pone.0134502.g004
PLOS ONE | DOI:10.1371/journal.pone.0134502 July 30, 2015
8 / 14
Forest Ant Sampling Method Comparison
Fig 5. Influence of sampling method on mean ant species richness (± 95% confidence interval) in beech, oak and ecotone habitats. Bars with the same lowercase letters are not significantly different within a particular habitat. doi:10.1371/journal.pone.0134502.g005
strongly influences microclimate [66], one of the main ecological factors shaping ant communities [67–69] and distributions of particular ant species [70]. Ant species richness was found to be negatively associated with canopy tree cover and leaf litter [71], a pattern corresponding well to our overall findings that ant species richness increased from species poor beech forest to species rich forest-steppe ecotone. However, our ability to discern the patterns of species richness across the three habitats rested on the pitfall trap sampling; the sifting method failed to differentiate the three habitats in terms of species richness. The low power of litter sifting to detect the strong richness gradient present across the three ecosystems is not surprising given that the number of ant species associated with forest litter was low compared to the number of epigaeic species sampled by pitfall traps in more species rich habitats. Yet, the inclusion of litter sampling in the integrated sampling approach made species richness estimates more accurate, and especially so in species rich ecotone where the integrated sampling yielded more accurate richness estimates compared to either of the two methods used on their own.
Fig 6. NMDS of pitfall trap data and sifting data based on presence/absence matrix. Geometric shapes (symbols) represent centroids of three independent samples (whiskers). Value of the final stress is displayed. doi:10.1371/journal.pone.0134502.g006
PLOS ONE | DOI:10.1371/journal.pone.0134502 July 30, 2015
9 / 14
Forest Ant Sampling Method Comparison
While pitfall traps confirmed the expected patterns in species richness and epigaeic activity (lowest in beech forest and highest in forest-steppe ecotone), litter sifting represented a different picture with the abundance (density) of ants lowest in forest-steppe ecotone and highest in oak forest. Importantly, the sifting method yielded higher numbers of individuals compared to pitfall traps in both forest habitats, and especially so for the dominant litter species (e.g., Myrmica ruginodis, Temnothorax crassispinus). However, compared to pitfall traps, sifting method appeared ineffective in our study in sampling both (i) open habitat specialists (e.g., Plagiolepis pygmaea, Tetramorium caespitum, Solenopsis fugax), which tend to avoid leaf litter [32], and (ii) fast moving forest and forest-steppe species that evaded litter extraction [28] but were characterized as frequent across all three habitats based on our pitfall trap data (e.g., Lasius emarginatus). Although our results corroborate previous findings that pitfall trap method is appropriate for open habitats and litter sifting method for forest habitats [9, 10, 22, 72], they also suggest that the pitfall trap method worked well also in forest ecosystems. Overall, the combination of the two methods was beneficial for characterizing species richness across both specialist groups (leaf-litter vs. open habitat) and locomotion types (fast vs. slow), and particularly so in species rich ecotones where neither method on its own fully captured all species [17]. Our work improves the current understanding of ant assemblages and sampling methods in beech and oak forests and forest-steppe transitions in Europe. Although little has been published on the composition of ants assemblages in European temperate broadleaved forests, our results corroborate the few previous studies of litter-dwelling ant assemblages of oak forests in confirming that these assemblages tend to be quite diverse and dominated by a few common forest species (especially Temnothorax crassispinus, Stenamma debile and Myrmica ruginodis) accompanied by a relatively broad array of other less abundant forest ant species [34, 73, 74]. Interestingly, Lasius emarginatus, a very abundant species in our study, was very rare or missing in the other published accounts [34, 74]. In addition to observing these characteristic forest species, we identified a diverse set of indicator species for the relatively more open forest-steppe ecotone. This indicator species group well reflected the transitional character of forest-steppe ecotone since it included forest-steppe specialists (Formica gagates, [33]), species typical of abandoned grasslands colonized by shrubs (Lasius alienus, [8]), as well as forest specialist species (Lasius emarginatus, [34]). Overall, the pitfall trap method proved to be appropriate for characterizing compositional shifts among the three habitats in our study. While both litter sifting and pitfall trap method revealed significant compositional differences between the species-poor forest habitat and ecotone, the pitfall trap data were more sensitive and lead to a greater number of indicator species identified in forest-steppe ecotone. On the other hand, the sifting method revealed litter-dwelling indicator species for oak forest (unidentified by pitfall trap method), confirming the strength of the integrated sampling approach. Quantifying and understanding the differences in ant assemblages across ecosystems is important especially when vegetation character and ecosystem boundaries change over time as they respond to changing climate or land use [8, 75]. Habitat temperature regime can be dramatically affected by vegetation structure (i.e., canopy openness) and temperature influences many aspects of ant biology such as ant functional responses, species range limits, and the diversity of ant assemblages [6, 15, 76]. Ants from lower elevations (with warmer climate and sometimes more open habitat) can be more susceptible to negative effect of climate warming [5]. Forest-steppe ecotones and oak dominated forest in our study represent some of the plant and ant communities most adapted to warm and dry climate within the deciduous forest biome in Europe. With changing climate, these communities are expected to expand over time at the expense of more mesic forest communities such as beech forest [39]. Consequently,
PLOS ONE | DOI:10.1371/journal.pone.0134502 July 30, 2015
10 / 14
Forest Ant Sampling Method Comparison
robust methods for monitoring these future changes across forest ecosystem boundaries are needed. In this study, we demonstrated that an integrated sampling framework utilizing different sampling methods can appropriately address distinct aspects of ant communities inhabiting different ecosystems, and thus it can overcome specific disadvantages of using only a single method to monitor ant community changes across ecosystem boundaries. The integrated sampling approach is well known to myrmecologists worldwide [9], however it is not always used in myrmecological studies. We apply it in a novel way to vegetation transition zones that are likely to change as the result of climate or land-use changes [77], and in habitats in which it has not been applied in Europe before. We are not aware of any other research explicitly stating with quantitative support that transition zones need to be sampled using integrated methods due to their dynamic character and due to global environmental changes.
Supporting Information S1 Dataset. Detailed capture data. (XLS)
Acknowledgments We would like to thank Lucia Mačáková for her assistance with field work, and two anonymous referees for their constructive comments.
Author Contributions Conceived and designed the experiments: MW. Performed the experiments: MW AW. Analyzed the data: MS MW AW. Contributed reagents/materials/analysis tools: MW. Wrote the paper: MW MD MS.
References 1.
Jouquet P, Dauber J, Lagerlöf J, Lavelle P, Lepage M. Soil invertebrates as ecosystem engineers: Intended and accidental effects on soil and feedback loops. Appl Soil Ecol. 2006; 32: 153–164.
2.
Folgarait PJ. Ant biodiversity and its relationship to ecosystem functioning: a review. Biodiv Conserv. 1998; 7: 1221–1244.
3.
Ottonetti L, Tucci L, Santini G. Recolonization patterns of ants in a rehabilitated lignite mine in Central Italy: potential for the use of Mediterranean ants as indicators of restoration processes. Restor Ecol. 2006; 14: 60–66.
4.
Underwood EC, Fisher BL. The role of ants in conservation monitoring: If, when, and how. Biol Conserv. 2006; 132: 166–182.
5.
Diamond SE, Sorger DM, Hulcr J, Pelini SL, Del Toros I, Hirsch C, Oberg E, Dunn RR. Who likes it hot? A global analysis of the climatic, ecological, and evolutionary determinants of warming tolerance in ants. Glob Change Biol. 2012; 18: 448–456.
6.
Resasco J, Pelini SL, Stuble KL, Sanders NJ, Dunn RR, Diamond SE, Ellison AM, Gotteli NJ, Levey DJ. Using historical and experimental data to reveal warming effects on ant assemblages. PLOS One 2014; 9(2): e88029. doi: 10.1371/journal.pone.0088029 PMID: 24505364
7.
Palladini JD, Jones MG, Sanders NJ, Jules ES. The recovery of ant communities in regenerating temperate conifer forests. For Ecol Manage. 2007; 242: 619–624.
8.
Wiezik M, Svitok M,Wieziková A, Dovčiak M. Shrub encroachment alters composition and diversity of ant communities in abandoned grasslands of western Carpathians. Biodivers Conserv. 2013; 22: 2305–2320.
9.
Bestelmeyer BT, Agosti D, Alonso LE, Brandao CRF, Brown WL, Delabie JHC, Silvestre R. Field techniques for the study of ground-dwelling ants. In: Agosti D, Majer J, Alonso LE, Schultz TR. Editors. Ants: Standard methods for measuring and monitoring biodiversity. Smithsonian Institution Press, Washington D. C.; 2000. pp. 122–144.
PLOS ONE | DOI:10.1371/journal.pone.0134502 July 30, 2015
11 / 14
Forest Ant Sampling Method Comparison
10.
Andersen AN. Sampling communities of ground-foraging ants: Pitfall catches compared with quadrate count in an Australian tropical savanna. Aust J Ecol. 1991; 16: 273–279.
11.
Retana J, Cerdá X. Patterns of diversity and composition of mediterranean ground ant communities: tracking spatial and temporal variability in the thermal environment. Oecologia 2000; 123: 436–444.
12.
Gómez C, Casellas D, Oliveras J, Bas JM. Structure of ground-foraging ant assemblages in relation to land-use change in the northwestern Mediterranean region. Biodiv Conserv. 2003; 12: 135–146.
13.
Dahms H, Wellstein C, Wolters V, Dauber J. Effects of management practices on ant species richness and community composition in grasslands (Hymenoptera: Formicidae). Myrmekol Nachr. 2005; 7: 9– 16.
14.
Dauber J, Wolters V. Colonization of temperate grassland by ants. Bas Appl Ecol. 2005; 6: 83–91.
15.
Dunn RR, Agosti D, Anderson AN, Arnan X, Bruhl CA, Cerda X, et al. Climatic drivers of hemispheric asymmetry in global patterns of ant species richness. Ecol Lett. 2009; 12: 324–333. doi: 10.1111/j. 1461-0248.2009.01291.x PMID: 19292793
16.
Groc S, Delabie JHC, Fernández F, Leponce M, Orivel J, Silvestre R, et al. Leaf-litter ant communities (Hymenoptera: Formicidae) in a pristine Guianese rainforest: stable functional structure versus high species turnover. Myrmecol News. 2013; 19: 43–51.
17.
King JR, Porter SD. Evaluation of sampling methods and species richness estimators for ants in upland ecosystems in Florida. Env Entomol. 2005; 34: 1566–1578.
18.
Olson DM. A comparison of the efficacy of litter sifting and pitfall traps for sampling leaf litter ants (Hymenoptera: Formicidae) in tropical wet forest, Costa Rica. Biotropica 1991; 23: 166–172.
19.
Longino JT, Coddington J, Colwell RK. The ant fauna of a tropical rainforest: estimating species richness three different ways. Ecology 2002; 83: 689–702.
20.
Robertson HG. Comparison of leaf litter ant communities in woodlands, lowland forest and montane forests of north-eastern Tanzania. Biodiv Conserv. 2007; 11: 1637–1652.
21.
Sabu TS, Shiju RT. Efficacy of pitfall trapping, Winkler and Berlese extraction methods for measuring ground-dwelling arthropods in moist-deciduous forests in the Western Ghats. J Insect Sci. 2010; 10: article 98.
22.
Majer JD. The use of pitfall traps for sampling ants: A critique. Mem Mus Victoria. 1996; 56, 323–329.
23.
Nageleisen LM, Bouget C. Forest insect studies: methods and techniques. Key considerations for standardisation. An overview of the reflections of the “Entomological Forest Inventories” working group (Inv. Ent.For.). Les Dossiers Forestiers no. 19, Office National des Forêts; 2009.
24.
Greenslade PJM. Sampling ants with pitfall traps: Digging-in effects. Insect Soc. 1973; 20: 343–353.
25.
Adis J. Problems of interpreting arthropod sampling with pitfall traps. Zool Anz. 1979; 202: 177–184.
26.
Calixto AA, Harris MK, Dean A. Sampling ants with pitfall traps using either propylene glycol or water as a preservative. SW Entomol. 2007; 32: 87–91.
27.
Pekár S. Differential effects of formaldehyde concentration and detergent on the catching efficiency of surface active arthropods by pitfall traps. Pedobiologia 2002; 46: 539–547.
28.
Spence JR, Niemelä JK. Sampling carabid assemblages with pitfall traps: the madness and the method. Can Entomol. 1994; 126: 881–894.
29.
Krell F-T, Chung AYC, DeBoise E, Eggleton P, Giusti A, Inward K, et al. Quantitative extraction of macro-invertebrates from temperate and tropical leaf litter and soil: efficiency and time-dependent taxonomic biases of the Winkler extraction. Pedobiologia 2005; 49: 175–186.
30.
Cardinale BJ, Wright JP, Cadotte MW, Carroll IT, Hector A, Srivastava DS, et al. Impacts of plant diversity on biomass production increase through time because of species complementarity. Proc Natl Acad Sci USA. 2007; 104: 18123–18128. PMID: 17991772
31.
Dovčiak M, Halpern CB. Positive diversity–stability relationships in forest herb populations during four decades of community assembly. Ecol Lett. 2010; 13: 1300–1309. doi: 10.1111/j.1461-0248.2010. 01524.x PMID: 20735464
32.
Seifert B. Die Ameisen Mittel- und Nordeuropas. Lutra, Görlitz/Tauer; 2007.
33.
Wiezik M, Wieziková A, Svitok M. Vegetation structure, ecological stability, and low-disturbance regime of abandoned dry grasslands support specific ant assemblages in Central Slovakia. Tuexenia 2011; 31: 301–315.
34.
Holecová M, Christophoryová J, Mrva M, Roháčová M, Stašiov S, Štrichelová J, et al. Biodiversity of soil micro- and macrofauna in oak-hornbeam forest ecosystem on the territory of Bratislava. Comenius University, Bratislava; 2012.
35.
Hrvoľ J, Horecká V, Škvarenina J, Střelcová K, Škvareninová J. Long-term results of evaporation rate in xerothermic Oak altitudinal vegetation stage in Southern Slovakia. Biologia 2009; 64: 605–609.
PLOS ONE | DOI:10.1371/journal.pone.0134502 July 30, 2015
12 / 14
Forest Ant Sampling Method Comparison
36.
EEA European forest types. Categories and types for sustainable forest management reporting and policy. EEA Technical report, No 9/2006, Copenhagen, Denmark; 2006.
37.
Allen CD, Breshears DD. Drought-induced shift of a forest–woodland ecotone: Rapid landscape response to climate variation. Proc Natl Acad Sci USA. 1998; 95: 14839–14842. PMID: 9843976
38.
Frelich LE, Peterson RO, Dovčiak M, Reich PB, Vucetich JA, Eisenhauer N. Trophic cascades, invasive species, and body‐size hierarchies interactively modulate climate change responses of ecotonal temperate‐boreal forest. Phil Trans R Soc B. 2012; 367: 2955–2961. PMID: 23007083
39.
Mette T, Dolos K, Meinardus C, Bräuning A, Reineking B, Blaschke M, et al. Climatic turning point for beech and oak under climate change in Central Europe. Ecosphere 2013; 4: art145.
40.
Andersen AN, Majer JD. Ants show the way Down Under: invertebrates as bioindicators in land management. Front Ecol Environ. 2004; 2: 291–298.
41.
Franklin K. The remarkable resilience of ant assemblages following major vegetation change in an arid ecosystem. Biol Conserv. 2012; 148: 96–105.
42.
Saniga M, Balanda M, Kucbel S, Pittner J. Four decades of forest succession in the oak-dominated forest reserves in Slovakia. iForest 2014; 7: 324–332.
43.
Korpeľ Š. Virgin forests of Slovakia. Bratislava: Veda, Slovak Academy of Science; 1989.
44.
Dekoninck W, Desender K, Grootaert P. Establishment of ant communities in forests growing on former agricultural fields: Colonisation and 25 years of management are not enough (Hymenoptera: Formicidae). Eur J Entomol. 2008; 105: 681–689.
45.
Dekoninck W, Hendrickx F, Dethier M, Maelfait J-P. Forest succession endangers the special ant fauna of abandoned quarries along the river Meuse (Wallonia, Belgium). Restor Ecol. 2010; 18: 681–690.
46.
Greenslade PJM, Greenslade P. Some effects of vegetation cover and disturbance on a tropical ant fauna. Insect Soc. 1977; 24: 163–182.
47.
Wallwork JA. Ecology of Soil Animals. McGraw-Hill Publishing Company Ltd., London; 1970.
48.
Quinn GP, Keough MJ. Experimental design and data analysis for biologists. Cambridge University Press, UK; 2002.
49.
Anderson MJ. A new method for non-parametric multivariate analysis of variance. Aust Ecol. 2001; 26: 32–46.
50.
Sørensen T. A method of establishing groups of equal amplitude in plant sociology based on similarity of species content. Det Kong Dansk Viol Sels Biol Skrif. 1948; 54: 1–34.
51.
Bray JR, Curtis JT. An ordination of upland forest communities of southern Wisconsin. Ecol Monog. 1957; 27: 325–349.
52.
McArdle BH, Anderson MJ. Fitting multivariate models to community data: a comment on distancebased redundancy analysis. Ecology 2001; 82: 290–297.
53.
Anderson MJ, Robinson J. Generalised discriminant analysis based on distances. Aust NZ J Stat. 2003; 45: 301–318.
54.
Dufrêne M, Legendre P. Species assemblages and indicator species: the need for a flexible asymmetrical approach. Ecol Monogr. 1997; 67: 345–366.
55.
Anderson MJ,Ter Braak CJF. Permutation tests for multi-factorial analysis of variance. J Statist Comput Simul. 2003; 73: 85–113.
56.
Efron B, Tibshirani R. Bootstrap methods for standard errors: confidence intervals and other measures of statistical accuracy. Statist Sci. 1986; 1: 54–77.
57.
Loftus GR, Masson ME. Using confidence intervals in within-subject designs. Psychon Bull Rev. 1994; 1: 476–490. doi: 10.3758/BF03210951 PMID: 24203555
58.
Kruskal JB. Multidimensional scaling by optimizing goodness of fit to a nonmetric hypothesis. Psychometrika 1964; 29: 1–27.
59.
Anderson MJ. DISTLM v.5: a FORTRAN computer program to calculate a distance-based multivariate analysis for a linear model. Department of Statistics, University of Auckland, New Zealand; 2004.
60.
R Core Team R: A language and environment for statistical computing. R Foundation for Statistical Computing, Vienna, Austria; 2014.
61.
Canty A, Ripley B. boot: Bootstrap R (S-plus) functions. R package version 1.3–15; 2015.
62.
Fox J, Weisberg S. An R companion to applied regression, 2nd ed. Sage, CA; 2011.
63.
Hothorn T, Bretz F, Westfall P. Simultaneous inference in general parametric models. Biom J. 2008; 50: 346–363. doi: 10.1002/bimj.200810425 PMID: 18481363
64.
Pinheiro J, Bates D, DebRoy S, Sarkar D. Nlme: Linear and nonlinear mixed effects models. R package version 3.1–120; 2015.
PLOS ONE | DOI:10.1371/journal.pone.0134502 July 30, 2015
13 / 14
Forest Ant Sampling Method Comparison
65.
Oksanen J, Guillaume Blanchet F, Kindt R, Legendre P, Minchin PR, O'Hara, RB, et al. Vegan: Community ecology package. R package version 2.2–1; 2015.
66.
Dovčiak M, Brown J. Secondary edge effects in regenerating forest landscapes: vegetation and microclimate patterns and their implications for management and conservation. New Forest. 2014; 45: 733– 744.
67.
Andersen AN. Global ecology of rainforest ants. Functional groups in relation to environmental stress and disturbance. In: Agosti D, Majer J, Alonso LE, Schultz TR, editors. Ants: Standard methods for measuring and monitoring biodiversity. Smithsonian Institution Press, Washington D.C.; 2000. pp. 25– 34.
68.
Wang C, Strazanac JS, Butler L. Association between ants (Hymenoptera: Formicidae) and habitat characteristics in oak-dominated mixed forests. Env Entomol. 2001; 30: 842–848.
69.
Gibb H, Parr CL. How does habitat complexity affect ant foraging success? A test using functional measures on three continents. Oecologia 2010; 164: 1061–1073. doi: 10.1007/s00442-010-1703-4 PMID: 20589395
70.
Chen Y-H, Robinson EJH. The relationship between canopy cover and colony size of the wood ant Formica lugubris—Implications for the thermal effects on a keystone ant species. PLOS One 2014; 9: e116113. doi: 10.1371/journal.pone.0116113 PMID: 25551636
71.
Lassau SA, Hochuli DF. Effects of habitat complexity on ant assemblages. Ecography 2004; 27: 157– 164.
72.
Gotelli NJ, Ellison AM, Dunn RR, Sanders NJ. Counting ants (Hymenoptera: Formicidae): biodiversity sampling and statistical analysis for myrmecologists. Myrmecol News. 2011; 15: 13–19.
73.
Czechowski W, Pisarski B. Ants (Hymenoptera, Formicoidea) of linden-oak-hornbeam forests and thermophilous oak forests of the Mazowian Lowland. 1. Nest density. Fragm Faun. 1990; 34: 133–141.
74.
Tăus, an I, Bota OT, Trică MR. Comparative analysis of ants assemblages (Hymenoptera: Formicidae) of old Transylvanian deciduous forests. Brukenthal Acta Musei 2013; 8: 461–468.
75.
Dovčiak M, Frelich LE, Reich PB. Pathways in old-field succession to white pine: seed rain, shade, and climate effects. Ecol Monograph. 2005; 75: 363–378.
76.
Arnan X, Cerda X, Retana J. Ant functional responses along environmental gradients. J Animal Ecol. 2014; 83: 1398–1408.
77.
Thuiler W, Lavorel S, Araújo MB, Sykes MT, Prentice IC. Climate change threats to plant diversity in Europe. Proc Natl Acad Sci USA. 2005; 102: 8245–8250. PMID: 15919825
PLOS ONE | DOI:10.1371/journal.pone.0134502 July 30, 2015
14 / 14