Identifying Sources of Dimensional Variation Affecting Assembly Quality of Automobiles Sang-Ho Lee† 1and Chi-Hyuck Jun2 Division of Mechanical and Industrial Engineering, POSTECH San 31, Hyoja-dong, Pohang, KB, 790-784, S. Korea Email:
[email protected] [email protected] Juncheul Jung3, Tae-Soo Kim4, Ji-Hoon Lee5 Hyundai-Kia Motors Company, S. Korea Email:
[email protected] [email protected] [email protected] Abstract. Dimensional variations in the automotive assembly process are caused by deviations associated with an automobile body and moving parts such as doors as well as by assembling methods. The dimensional variation leads to a poor quality of appearance, inconvenience of opening and closing doors and a low performance of a car. A conventional regression analysis may not be used for identifying the sources of dimensional variations particularly when the number of variables is larger than the number of observations and the variables are highly correlated with each other. In this study, partial least squares regression is applied to identify the sources of dimensional variation affecting main assembly quality characteristics, gap and flush. An application to a real data set will be discussed. Keywords: Assembly, Automobile body, Partial least squares, Variation
1. INTRODUCTION Dimensional variation incurred in the automotive assembly process is caused by an automobile body, moving parts (door and hood) and an assembling method. The dimensional variation makes a poor quality of an appearance, inefficiency of an opening and closing and a low performance of a car. Especially, gap and flush are important quality characteristics. Gap is defined as an interval measured horizontally between a front door and a rear door or between door and a car body. Flush is defined similarly but it represents a vertical one. The quality of gap and flush affects a noise, water leakage and efficiency of opening and closing. Therefore it is a very important problem to find sources of dimensional variation affecting the quality of gap and flush. Analyzing the degrees of influence due to the major sources is also a core problem. Analyzing degrees of importance of sources affecting the dimensional variation is a core technique to improve the quality of gap and flush. Degrees of importance can be
quantified by finding a functional relationship between sources and dimensional variations. Conventional statistical analysis methods have many limitations to solve this problem when (1) the sources affecting the variation of gap and flush are numerous, (2) the sources are highly correlated, (3) variations of gap and flush are also correlated. When there are numerous sources, to find a functional relationship which is statistically significant, we need a large number of reliable data which covers the whole range of sources. Since it takes much time and cost, it is practically impossible. It is difficult and unreasonable to analyze this problem using ordinary least squares (OLS) regression because of the multicollinearity problem which is caused by highly correlated data. The conventional regression coefficients will be unstable and have a large variation for the multicollinearity problem. In order to overcome these limitations many statistical approaches have been developed. Principal component analysis (PCA) and partial least squares (PLS) regression use a dimension reduction technique. Ridge regression (RR) and LASSO (least absolute shrinkage and selection operator) are
________________________________________ † : Corresponding Author 753
APIEMS 2008 Proceedings of the 9th Asia Pasific Industrial Engineering & Management Systems Conference popular penalized regression techniques which reduce the variance of coefficients. There have been many previous works about fault detection or failure diagnosis in a multivariate manufacturing process. The most of works analyze the data gathered from the optical coordinate measuring machine (OCMM) by using PCA, factor analysis (FA) and so on. Wu et al. (1994) proposed a fault identification and classification scheme for an assembly process of automobile door itself by using principal component factor analysis. Ceglarek and Shi (1996) and Rong et al. (2000) proposed a model based diagnostic methodology for the fault mapping procedure using PCA and pattern recognition approach. Apley and Lee (2003) conducted the research about identifying spatial variation patterns by using PCA and blind source separation concept. Lee and Jang (2001) presented that applying both PCA and Correspondence analysis (CA) to the fault identification procedure led to a better result and understanding. Also there are some works about the dimensional variation reduction by using root cause analysis (RCA) such as Ceglarek and Shi (1996) and Carlson and Söderberg (2003). Chen et al. (2004) developed a quality and reliability chain (QR chain) model in a multi-station manufacturing process. Variable selection is one of the important practical issues when optimizing processes. Some variable selection methods have been developed such as PLS-VIP method (Wold et al. 1993) and PLS-Beta method (Wold et al. 2001). Chong and Jun (2005) conducted various experiments and simulations about variable selection by using PLS, LASSO, and stepwise regression. The previous literatures about an automotive manufacturing process focus the identification of variation pattern rather than the detection of important factors which causes the spatial defects. This paper proposes the identification scheme for sources of dimensional variation affecting assembly quality of automobile based on the variable selection using PLS regression.
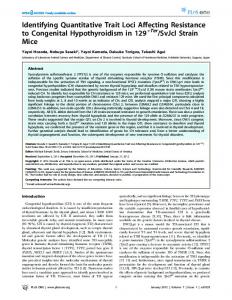
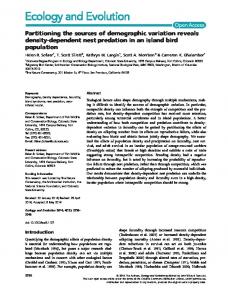
Figure 1: Measurement points of gap and flush To help understanding the process of door assembly, related parts, and the measurement of dimensional fault are concisely described. Five separated parts such as front door, rear door, door hinge, door hinge nuts and BIW (body in white) are involved in door assembly process. Front door and rear door are assembled in the previous station through positioning, clamping, welding and hemming. Then doors are fit to BIW by positioning with hinges. The measurement data in each related part are gathered from the laser-optical measurement machines. As possible sources of the dimensional variation, we considered dimensional deviations in BIW, door hinges, door hinge nuts, and front/rear doors. The dimensional deviations were measured as the deviations from the specifications in three directions (T, L and H) at the specified location of the above mentioned parts of a car. Figure 2 shows the 8 measurement locations in BIW, Figure 3 shows the 12 measurement locations in the front and the rear door hinges. Figure 4 shows the 4 measurement locations each in the front and the rear door nuts. Finally, Figure 5 shows the 10 locations in the front door and another 10 locations in the rear door. So, there are 48 measurement locations altogether. Measurements have been made in three directions basically, but some of them were available only for one or two directions. Therefore, there are 108 measurement variables for each of 40 cars.
2. DATA DESCRIPTION The measurement data have been collected on 40 cars of the same model. The quality characteristics will be two variables of the dimensional variations, that is, gap and flush of the assembled doors of the car. The gap and the flush have been measured at the 14 locations indicated in Figure 1. We considered only a left side of the auto body since the statistical properties of gap and flush in a left side and in a right side are not different. So, we have 28 quality variables in total.
Figure 2: Measurement Locations in BIW
Nusa Dua, Bali – INDONESIA December 3rd – 5th, 2008 754
APIEMS 2008 Proceedings of the 9th Asia Pasific Industrial Engineering & Management Systems Conference process, PLS regression is the most suitable technique to analyze them. PLS regression model with two matrices, X (n×k, predictors) and Y (n×m, responses) can be expressed as follows: X = TP T + E
(1a)
Y = UQ + F
(1b)
T
u a = ba t a + h
Figure 3: Measurement Locations in Front and Rear Door Hinges
Figure 4: Measurement Locations in Door Hinge Nuts
3. MODELING and ESTIMATION of PARTIAL LEAST SQUARES Partial least squares regression is used to describe the relationship between multiple response variables and predictors through the latent variables. PLS regression can analyze data with strongly collinear, noisy, and numerous X-variables, and also simultaneously model several response variables, Y (Wold et al. 2001). Since the number of observations is much smaller than the number of Xvariables in the data set collected from door assembly
(1c)
where T=(t1,…,tA) and U=(u1,…,uA) are latent variable scores of X and Y, respectively, and P and Q are the corresponding loadings, where A is the number of latent variables. Equations (1a, b) represent the outer relations of X and Y, (1c) is the inner relation between two score matrices, and ba is the regression coefficients of inner relation. The matrices E and F represent error terms associated with X and Y, respectively, whereas h means random error vector in the inner relation. In general, by using nonlinear iterative partial least squares (NIPALS) algorithm, these quantities can be obtained (Geladi and Kowalski 1986). The number of latent variables is an important parameter in PLS regression and it can be determined by considering the proportion of variance explained by each latent variable. It is usually done by a cross-validation in a way to minimize the predicted error. The VIP (Variable Importance in the Projection) scores and the beta coefficients, which are obtained by PLS regression, can be used to select most influential variables or predictors, X (Chong and Jun 2005, Lee et al. 2006). The VIP score can be estimated for j-th X-variable by VIPj = k ∑a w 2ja ba2 t Ta t a
Figure 5: Measurement Locations in Front/Rear Doors
a = 1,..., A
∑bt
2 T a a a a
t
(2)
where wja, which is obtained by NIPALS algorithm, is a weight of the j-th X-variable to the a-th latent variable. Usually the predictor variable of which VIP score is greater than one is considered as an important variable since the average of squared VIP score is one. PLS model can be rewritten to look as a multiple regression model (Wold et al. 2001). By using equation (3) multiple linear regression coefficients can be estimated from the PLS regression model parameters. Those coefficients describe an increase of a particular Y-variable as a change of a particular X-variable when the other Xvariables are fixed. By controlling X-variable with a large coefficient tightly a small variation of related Y-variable can be expected. The beta coefficients can be obtained by considering the equivalent following multiple linear regression model, Y = XB PLS + ε (3) where BPLS is called the beta coefficients. They can be derived from the PLS regression model since there exist the following relationships between the quantities derived
Nusa Dua, Bali – INDONESIA December 3rd – 5th, 2008 755
APIEMS 2008 Proceedings of the 9th Asia Pasific Industrial Engineering & Management Systems Conference through NIPALS algorithm: Y = UQ = TBQ where B is a matrix whose i-th diagonal element is bi. Since T
T
(
T = XW P T W
)
−1
(4)
(5)
QT = B −1 (TT T) −1 TY
(6)
Equation (4) reduces to Y = XW(P T W) −1 (TT T) −1 TT Y
(7)
Therefore, BPLS can be expressed as follows, B PLS = W (P T W ) −1 (TT T) −1 TT Y
(8)
The contribution of each X-variable to a response variable can be measured by decomposing the sum of squares (SS) of the response variables. Let us define the sum of squares of an n-vector x and n-by-k matrix X, respectively, by n
SS (x) = x t x = ∑ xi2
variables contributing to each of Y-variables. Step3. Calculate the impact according to (14), which is the relative contribution of an X-variable to a Y-variable.
4. APPLICATION For the PLS regression analysis, the number of latent variables should be determined. Larger number of latent variables can explain the data well but overfitting may happen. Figure 6 shows the proportions of X-variance and Y-variance explained as the number of latent variables increases. When ten latent variables are used, PLS regression model explains more than 80% of X-variance and more than 70% of Y-variance. It seems that beyond ten variables the increase in the proportion of variance explained is quite marginal. So, we chose the number of latent variables as 10.
(9)
i =1
k
SS ( X) = ∑ SS (x j )
(10)
j =1
Then the total sum of squares can be divided into SS of regression (SSR) and SS of error (SSE) as follows: SST = SS (Y) = SSR + SSE (11) Here SSR is the summation of SS of latent variables, which is shown in equation (12). A
A
A
a =1
a =1
a =1
SSR = ∑ SS (ba t a qTa ) = ∑ ba2 SS (t a ) = ∑ SSRa (12)
Figure 6: Proportion of variance explained by latent
Using equation (1b) and (12) the contribution ratio of the ath latent variable to the deviation of the j-th quality characteristic can be estimated as follows, CRaj =
SSRaj SS (y j )
=
qaj2 SS a SS (y j )
(13)
Then combining equation (5) and (13) the impact of i-th indepenent variable to the j-th response variable can be calculated as in the following, impactij = ∑ a
wia CRaj wa
(14)
In order to detect the major sources of dimensional variation of assembled doors a new procedure using PLS modeling is proposed. The proposed procedure is as follows: Step1. After PLS modeling, calculate VIP scores and find the X-variables whose VIP is greater than a predetermined threshold. Step2. Estimate beta coefficients of the selected X-
variables Figure 7 (a) shows the VIP scores of the 108 Xvariables and Figure 7 (b) shows the sorted VIP scores from the largest to the smallest. As mentioned in the previous section, X-variables with the VIP score greater than 1 will be considered as important variables. It can be seen that some foreside X-variables have a big VIP score. The important variables, which have a VIP score greater than 1.5, should be controlled and supervised tightly. Xvariables can be divided into four major parts which are related to the assembly process of doors. X-variables presented in the foreside of the Figure 7 (a) including that with the biggest VIP score are related to the part that connects the doors to the automobile body. Some dimensional faults in that part can result a large variation in gap and flush of doors. That is, the assembly process which is related to that part should be changed or strongly
Nusa Dua, Bali – INDONESIA December 3rd – 5th, 2008 756
APIEMS 2008 Proceedings of the 9th Asia Pasific Industrial Engineering & Management Systems Conference supervised.
dimensional measurement point instead of each independent variable. At each measurement point three or less dimensional data were gathered. In Table 1 Hinge 23 includes the 17th independent variable which has the biggest VIP score. Any other measurement points listed in Table 1 also have a bigger VIP score. That is, it can be seen that the result of the decomposition of SS is similar to the VIP score. 1.000
Gap14 0.800
0.600
0.400
0.200
0.000
(a) VIP scores across variables
x6 x11 x14 x17 x18 x19 x20 x33 x36 x49 x51 x54 x55 x56 x63 x71 x78 x86 x89 x98 -0.200
-0.400
-0.600
Figure 8: Beta coefficients of X-variables to Gap 14
0.600
Flu7 0.400
0.200
0.000 x6 x11 x14 x17 x18 x19 x20 x33 x36 x49 x51 x54 x55 x56 x63 x71 x78 x86 x89 x98 -0.200
(b) VIP scores in descending order
-0.400
Figure 7: VIP scores of X-variables
-0.600
Figure 8 shows the beta regression coefficients of Xvariables that are related to the particular Y-variable, the 14th gap data. The selected X-variables are top 20 variables which have a biggest VIP score. X17 has the biggest VIP score while X11 has the second biggest VIP score. Other beta regression coefficients of X-variables that are related to the particular Y-variable, the 17th flush data, are shown in figure 9. The absolute value of coefficients for X11 and X17 are bigger than any other variables. That is, the trend of the absolute value of coefficients is similar to figure 8. But the most of signs of the coefficients are reverse as compared with Figure 8. Contribution ratio of the i-th independent variable to the j-th dependent variable is shown in Table 1. Some of dependent variables which have a large contribution ratio were selected. We arranged the result by using a specific
-0.800
Figure 9: Beta coefficients of X-variables to Flush 17
5. CONCLUSION In this paper, a new approach to finding the dimensional variation sources of assembled doors in the automobile body was introduced. The new statistical approach utilizes PLS regression and has the following three steps: estimating VIP scores for the selection of influencing variables, calculating beta coefficients and estimating of contribution ratio of an X-variable to each of Y-variables. As a case study for the proposed procedure the real
Nusa Dua, Bali – INDONESIA December 3rd – 5th, 2008 757
APIEMS 2008 Proceedings of the 9th Asia Pasific Industrial Engineering & Management Systems Conference dimensional measurement data of automobile body were gathered and applied. In this case the quality characteristics are gap and flush of doors. The important variables, which have a VIP score greater than 1.5, were identified and their impact to each quality variable were analyzed. It is
expected that a better quality of door assembly and a reduction of dimensional variation will be obtained by controlling these variables more tightly.
Table 1: Contribution ratio of some measurement points to selected quality characteristics (%) gap6
gap8
gap12
flush1
flush4
flush7
point
ratio
point
ratio
point
ratio
point
ratio
point
ratio
point
ratio
FRT DR 6
4.10
Hinge 23
7.66
Hinge 23
8.15
H NUT 5
5.70
Hinge 23
4.85
Hinge 23
5.38
Hinge 25
3.63
Hinge 21
5.58
Hinge 21
6.38
H NUT 2
3.42
Hinge 21
4.28
FRT DR 6
4.32
Hinge 23
3.34
Hinge 16
3.30
Side 6
3.31
RR DR 7
3.01
RR DR 6
3.07
Hinge 25
3.69
H NUT 5
3.20
Side 6
3.16
Hinge 16
3.24
FRT DR 2
2.88
RR DR 4
2.42
Side 6
3.51
Side 6
3.12
FRT DR 4
2.99
Hinge 24
3.08
RR DR 8
2.74
Hinge 16
2.34
RR DR 4
3.48
ACKNOWLEDGMENT This work was supported by the grant from NGV Corp. and by the grant for the Basic Research from GIFT at POSTECH.
REFERENCES Apley, D. W. and Lee, H. Y. (2003) Identifying Spatial Variation Patterns in Multivariate Manufacturing Processes: A Blind Separation Approach, Technometrics, 45(3), 220-234 Carlson, J. and Söderberg, R. (2003) Assembly Root Cause Analysis: A Way to Reduce Dimensional Variation in Assembled Products, International Journal of Flexible Manufacturing Systems, 15, 113-150 Ceglarek, D. and Shi, J. (1995) Dimensional variation reduction for automotive body assembly manufacturing, Journal of Manufacturing Review, 8, 139-154 Ceglarek, D. and Shi, J. (1996) Fixture Failure Diagnosis for Autobody Assembly Using Pattern Recognition, Journal of Engineering for Industry, 118, 5566 Chen, Y., Jin, J. and Shi, J. (2004) Integration of Dimensional Quality and Locator Reliability in Design and Evaluation of Multi-station Body-in-white Assembly Processes, IIE Transactions, 36, 827-839 Chong, I. G. and Jun, C. H. (2005) Performance of Some Variable Selection Methods when Multicollinearity
Is Present, Chemometrics and Intelligent Laboratory Systems, 78, 103-112 Geladi, P. and Kowalski, B. R. (1986) Partial Least Squares Regression: A Tutorial, Analytica Chimica Acta, 185, 1-17. Lee, S. and Jang, K. (2001) Identification of the Deviation from the Mean and Multimodal Distribution in the Automotive Assembly Process: Correspondence Analysis Approach, International Journal of Production Research, 39 (10), 2105-2120 Lee, D. Lee, H. Jun, C. H. and Chang, C. H. (2006), A Variable Selection Procedure for X-ray Diffraction Phase Analysis, Applied Spectroscopy, 61(12), 1398-1403 Rong, Q., Ceglarek, D. and Shi, J. (2000) Dimensional Fault Diagnosis for Compliant Beam Structure Assemblies, Journal of Manufacturing Science and Engineering, 122, 773-780 Wold, S. Johansson, E. and Cocchi, M. (1993) PLSPartial Least Squares Projections to Latent Structures, in: H. Kubinyi (Ed.), 3D QSAR in Drug Design, Theory, Methods, and Applications, ESCOM Science Publishers, Leiden, 523-550 Wold, S., Sjöström, M. and Eriksson, L. (2001) PLSregression: a basic tool of chemometrics, Chemometrics and Intelligent Laboratory Systems, 58, 109-130 Wu, S. K., Ho, S. J. and Wu, S. M. (1994) A Fault Identification and Classification Scheme for an Automobile Door Assembly Process, International Journal of Flexible Manufacturing Systems, 6, 261-285
Nusa Dua, Bali – INDONESIA December 3rd – 5th, 2008 758
APIEMS 2008 Proceedings of the 9th Asia Pasific Industrial Engineering & Management Systems Conference
AUTHOR BIOGRAPHIES
Sang-Ho Lee received a B.S. (2004) in industrial engineering from POSTECH. He is now a Ph.D. student in the Department of Industrial and Management Engineering at POSTECH. His interests are in data mining, and applied statistics. His email address is Chi-Hyuck Jun received a B.S. in mineral and petroleum engineering from Seoul National University, an M.S in industrial engineering from KAIST, and a Ph.D. in operations research from University of California, Berkeley. Since 1987, he has been with POSTECH. He is interested in reliability and quality analysis, and data mining techniques. His email address is
[email protected]
Juncheul Jung received a B.S. in mechanical engineering from Pusan National University. He works for Hyundai-Kia motors company as a general manager of advanced body manufacturing engineering team. He is interested in optimization of automotive manufacturing process. His email address is
[email protected] Tae-Soo Kim works for Hyundai-Kia motors company as a manager of advanced body manufacturing engineering team. He is interested in quality improvement and optimization of automotive manufacturing process. His email address is Ji-Hoon Lee received a B.S. (2002) in mechanical engineering from Korea University. He now works for Hyundai-Kia motors company as an engineer. He is interested in development of a new autobody manufacturing methodology. His email address is
Nusa Dua, Bali – INDONESIA December 3rd – 5th, 2008 759