International Journal of Information and Education Technology, Vol. 8, No. 3, March 2018
Identifying the Learning Style of Students in MOOCs Using Video Interactions D. Dissanayake, T. Perera, C. Elladeniya, K. Dissanayake, S. Herath, and I. Perera
offered on edX platform by Stanford Laguinita [3], to locate the temporal relationship between learning styles and performance.
Abstract—Massive Open Online Courses (MOOC) are an emerging technology for online teaching and learning at a larger scale. Therefore getting an overall view of student behavior and performance is quite challenging. We intend to provide a solution by identifying the learner behavior using click stream interaction analysis. In MOOCs, videos provide the most informative content of learner behavior because majority of the students gather knowledge from videos whereas a relatively fewer number of students participate in assignments and forum activities. In this research the click stream data from the video interactions were analyzed to understand the learner behavior. The interactions such as play, pause, seeks and speed changes were aggregated to calculate features which indicate frequency and temporal dynamics of the behavior of the students. Two courses Engineering CS101 and Humanities and Statistical Learning from a dataset of the edX platform were analyzed by using unsupervised learning. The findings from this research can be used to understand how the learner behavior in MOOC videos differs in two different courses.
II. LITERATURE REVIEW MOOC videos have been identified as the most informative component of a MOOC. In the early period of MOOCs, works on videos were mainly focused on identifying the quality of the videos. The present research focuses more on using video interaction analysis to describe important activities of MOOCs such as predicting dropouts and performance of students. Li et al. have researched on a large-scale analysis of in-video interactions [4]. They have categorized the in-video activities into several categories such as pauses, seeks, speed changes, replays, frequent pauses, long pauses, speed up and speed down. In addition to clustering of the video watching behaviors, they have highlighted the relationship between the video watching and rewatching behavior to perceived video difficulty and the performance of students. In their work, they have used statistical inferences without considering the nature of the course or the video. Kim et al. have researched on of large scale analysis of in-video dropout and peaks in viewership activities of the students [5]. They have used data from several videos from courses hosted in edX platform [6]. According to Kim et al., the peaks indicate points of interest or confusion. The focus of the research was on understanding why peaks occur. By combining interaction data with visual content analysis, they have identified five student activity types which can lead to a peak. According to the results they obtained, 61% of the peaks occur due to visual transition in the videos. The other reasons that they have identified includes starting from the beginning of a new material, returning to missed content, following a tutorial step, replaying a brief segment and repeating a verbal explanation. It is important to identify the at-risk students or the students who are about to drop out in order to reduce the attrition of the students in MOOCs. Video interactions can be used for such analysis. For example, by identifying what type of interactions may indicate a student has experienced difficulty and to what extent video interactions indicate the perceived video difficulty for a student can be used as a good indicator to predict the drop out of the students. Nan et al. [7] have conducted research on how the video interactions reflect the perceived difficulty of the video for the students. During the research, they have identified simple video interaction features that indicate students’ perceived video difficulty. They have used the Mixed Model analysis to infer
Index Terms—E-learning, learner behavior, unsupervised learning.
I. INTRODUCTION Massive Open Online Courses (MOOC) is a disruptive innovation in online education that enhances the traditional pedagogy through video lessons, quizzes, assignments and forums. Video interaction is an important factor to analyze student interaction with course materials [1]. Multiple researches have been carried out regarding video interaction as most students spend a majority of study time watching video lessons [2]. Video analytics can provide an exclusive opportunity to understand the video content usage in the learning experience. Students attempt different video watching patterns to perceive the content, which can be distinguished by the patterns in activities such as pauses, forward seeks and backward seeks. In the research presented in this paper, we aim to analyze the impact of learning style on the student’s performance. The learning styles were identified using clustering techniques and, using statistical analysis, their correlation with final grade and probability of dropout were established. We have also analyzed videos of 6 weeks of a MOOC, Manuscript received January 10, 2017; revised July 4, 2017. The research was supported in part by University of Moratuwa under SRC-LT Grants Scheme The authors are with the Department of Computer Science and Engineering, University of Moratuwa, Sri Lanka (e-mail:
[email protected],
[email protected],
[email protected],
[email protected],
[email protected],
[email protected]).
doi: 10.18178/ijiet.2018.8.3.1029
171
International Journal of Information and Education Technology, Vol. 8, No. 3, March 2018
the changes of subjective video difficulty for a student from video to video. According to the results of the research, speed decreases, frequent and long pauses, infrequent seeks with high amount of skipping and re-watching indicate higher level of video difficulty. Students’ learning behavior can be predicted via video viewing clickstream analysis. Boer et al. [8] suggested video viewing styles by analyzing the feature distribution of course videos. Craik and Lockhart [9] introduced the four viewing styles of student learning from video lessons, namely, Elaboration viewing style, Maintenance-rehearsal viewing style, Linear viewing style and Zapping style. Table I compares the four strategies for different viewing styles.
III. DATASET The dataset used for this research was from Engineering CS101 course conducted in summer 2014 by University of Stanford. The data was collected by Center for Advanced Research Through Online Learning (CAROL) [13] in University of Stanford. Data was anonymized for the purpose of privacy protection of students. Details of the dataset shared by CAROL such as protocols to access data, table schemas are available online [14]. The table schema includes three tables that contain logs of user interactions in events, videos and activities respectively. For this research, only video interaction table was considered. Each row in this table contains temporal details about an event (play, pause, seek etc.) along with identifiers for participant, video and course. A summary of details is shown in Table II.
TABLE I: OVERVIEW OF THE VIDEOS SELECTED FROM ENGINEERING CS101 Week Number
No of events
Unique users
Number of sessions after preprocessing
1
328003
28835
7902
2
403068
32832
14618
IV. METHODOLOGY
3
508066
25073
15605
4
231149
19312
7520
Fig. 1 shows the steps in proposed methodology and each of these steps are discussed in detail in this section.
5
115843
17058
4034
6
97611
14069
3758
A. Data Preprocessing Since the dataset was quite large and contained missing values, outliers and incorrect values, data preprocessing steps were required before applying Machine Learning techniques.
TABLE II: LEARNING STYLES OF WATCHING VIDEOS Learning strategy
Viewing behavior
Viewing scenario
Linear
A student watches a video in one-pass (uninterruptedly) from the beginning to the end
One-pass scenario
Elaboration
A student watches a video again after finishing the first time in one-pass
Two-pass scenario
Maintenanc e rehearsal
A student watches parts of a video repeatedly
Repetitive scenario
Zapping
A student skips through the instructional video at intervals of relatively short viewing times
Zapping scenario
1) Session reconstruction A session includes a set of actions within a given time or a set of actions of a user in completing a task. The raw click stream data recorded in in the Video Interaction table can correspond to one or more sessions for a given user and a video. The separation of sessions can be achieved by arranging the records for a user and a video temporally and then applying a set of rules.
Creating watching sessions from click stream log is important in the case of a certain user watching a video multiple times. This is known as session reconstruction. According to Meiss et al. [10] there are two basic methods in session reconstruction from log data; Time Oriented method and Navigation oriented method. The time oriented method uses an inactivity timeout to separate event sequence into watching sessions. For example if the time gap between two consecutive events exceed the given timeout values, it is considered as a separate watching session. The navigation oriented method considers the chain of events in the event sequence of the user. The navigation method does not consider the time spent on the video or the inactivity timeout between the events [11]. Instead it focuses on the ability to reach a certain event from the previous event in the sequence. To segment the students based on their learner behavior we have employed clustering, an unsupervised machine learning technique. In this research, we have used the k–medoids [12] technique, which is more robust to noise and outliers. Silhouette coefficient was used to identify the goodness of the clustering.
Fig. 1. Flow chart of Unsupervised Learning methodology.
We applied the time oriented method by Meiss et al. for session reconstruction, with an inactivity timeout of 30 minutes [10]. This value was chosen considering the average 172
International Journal of Information and Education Technology, Vol. 8, No. 3, March 2018
length of the video was between 7-20 minutes and industry norm. We did not apply the navigation method as coming up with rules for navigation method is not straightforward.
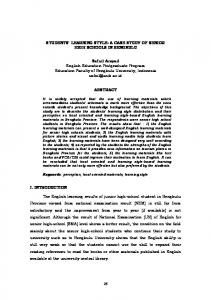
and removed from the dataset. We employed the comparison method and binning method for outlier removal. Comparison method checks whether the values are within the valid range. For example average speed should be within 1.75 and 0.75.
Fig. 2. Identifying outliers through binning. TABLE III: FEATURES CALCULATED FROM CLICKSTREAM DATA Abbreviation Feature Description NP
Number of pauses
Frequency of the pauses
NB
Number of backward seeks
Frequency of the backward seeks
NF
Number of forward seeks
Frequency of the forward seeks
MP
Median duration of pauses
Median duration of all the pauses(seconds)
RL
Replayed video length
Total length of backward seeks (seconds)
SR
Proportion of skipped video content
Total length of the forward seeks (seconds)
AS
Average video speed
The average playback speed of the video 0.5x 0). Zero values in NB and NF depicts that student have watched it without any forward/backward seeks. C. Time Series Cluster Analysis for Engineering Course The behavior of students throughout the course can be analyzed by time series cluster analysis. Each course is delivered for six weeks and it is observed that the number of clusters corresponding to a learning styles differs. For example, in week 3 and 4 no cluster shows prominent one pass behaviour but in week 5 and 6 multiple clusters illustrates one pass behavior. Table VII depicts the cluster behavior corresponding to one pass viewing, taking the largest cluster when there is more than one. The comparison of features in above clusters are visualized in Fig. 6. Usually students watch 80% of the video length, but in this course TP has increased from 92.7% to 99.5% towards the last weeks. It can be considered an improvement that students tend to watch the entire video towards the end of the course. NP values does not fluctuate drastically and MP shows a significant decrease from 0.355 to 0.018. Therefore it can be concluded that more students practice an agile linear style of viewing towards the end of the course. The mean grade has increased more than twice (from 32% to 80%) towards the end of course. The variance of grade has decreased from 0.19 to 0.14 which interprets that overall student results have improved. It is observed that the interest for the course has improved as the dropout percentage has reduced from 33% to 12% in general. Especially it is shown that students tend to behave according to one pass viewing style towards the end of course after analyzing last few weeks. Considering the correlation between the extracted features and the performance of students for the video analyzed in Table V, it was observed that mean grade has strong positive correlation of 0.85 with TP. NB and NF provide weak negative correlation with Mean grade which infers that grade has an inverse relation with forward and backward seeks. MP shows significant positive correlation with variance of grade
Fig. 5. Engineering CS101 clustering results.
V. RESULTS AND ANALYSIS A. Results The results obtained for clustering of watching sessions for video with the video id i4x-Engineering-CS101-video-z103 in course Engineering CS101 is visualized in Fig. 4. These clusters were mapped to the learning styles suggested by Craik and Lockhart [9] based on the features of cluster medoids. B. Identifying Learning Styles (Labeling Clusters) in Engineering Course As shown in Table V, feature centroids can explain clusters with their values and students can be labeled according to their viewing style. Dominating value of a feature can indicate the behavior of particular cluster intuitively. For example cluster 3 has the highest centroid of median pause (MP) feature. Video viewers can be categorized into different viewing styles according to their interactions. The four viewing styles and their feature distribution is given in Table VI.Two pass scenario is a combination of one pass and repetitive scenario, where students watch all the relevant videos in one pass at the beginning and later on they watched them again more closely 174
International Journal of Information and Education Technology, Vol. 8, No. 3, March 2018
and TP. The dropout tendency is lower when interaction is higher. It concludes that active students stay with the course without being dropped.
while other features correlate negatively. Dropout percentage has maintained comparatively high negative correlation with MP, SR, and RL while it has low negative relation with NB
TABLE V: CLUSTER MEDOIDS FOR ENGINEERING CS101 Colour
NP
NB
NF
MP
SR
RL
TP
Session No
Mean grade
Variance of the grade
Dropout %
A
Red
0.0137
0.0449
0.0344
0.0230
0.0395
0.1739
0.8656
0.0078
0.5518
0.2155
0.0467
B
Light Blue
0.0068
0.0112
0
0.0184
0
0.0012
0.8826
0.0078
0.5864
0.2183
0.1916
C
Yellow
0.0022
0.0112
0
0.0388
0
0.0139
0.2864
0
0.5257
0.2217
0.1040
D
Dark Blue
0.0022
0
0
0.1846
0
0
0.8666
0.0078
0.5727
0.2234
0.0344
D. Identifying Learning Styles in Humanities Courses In order to compare the learning styles of students who follow technical and humanities courses, one of the humanities videos was analyzed. Table VIII indicates the feature medoids of video with the id i4x-Humanities and Science- video which was held on the 3rd week of the course. As shown in Fig. 7, student learning behavior can be significantly separated into three clusters. Cluster A has the behaviour of Zapping scenario as its TP is close to 0.4 and SR, RL > 0.1. Students have not watched the whole video but some parts have been repeatedly watched with long pauses as MP shows 0.4 values which is the maximum among three clusters. This behaviour has resulted 9 percent of dropout rate but mean grade is lower as 0.2.
Humanities student’s grade variance is low (< 0.09) when compared to engineering which is relatively high (>0.2). It is observed that humanities have higher total play which explains that students tend to watch the whole video with more number of pauses. However analysis of both videos interprets that even though there are slight differences in grades and watching behaviours, recognized student learning styles remain same and clustering process proves it clearly.
TABLE VI: FEATURE CATEGORIZATION FOR VIEWING STYLE Viewing style
Feature distribution
One-pass scenario (Linear TP > 0.8, NB,NF = 0, Session No = 0, RL,SR =0 viewing style) Two-pass scenario (Elaboration)
TP > 0.8, NB,NF > 0, RL,SR >0, Session No > 0
Repetitive scenario(Maintenance Rehearsal )
NB,NF > 0, RL,SR >0
Zapping scenario
TP < 0.5, NB,NF > 0.1, RL,SR >0
Fig. 6. Time series analysis of videos in Engineering CS101.
E. Time Series Cluster Analysis for Humanities course Humanities course is held for 10 weeks and after analyzing clusters for each week, it is observed that one pass behaviour is prominent throughout the course. Table IX shows mediods of features corresponding to the one pass learning style in week 2, 3, 7 and 9. It is observed that students have watched over 97% of the video length throughout the humanities course and it is consistent. Since Number of Pauses (NP) values are very low and Median duration of Pauses (MP) is also below 0.04, it indicated that the students watch it continuously without any pauses and disturbances. Further, mean grade shows a significant improvement as it rises from 0.15 to 0.49 towards the end of the course. Even though it has improved drastically, at the same time, grade variance has increased its values from 0.067 to 0.12. Dropouts also show some positive impact towards the end of the course as dropouts percentage decrease by 4% (From 18% to 14%) which indicates that the interest about the course videos has increased. But dropout rate has dropped to 6% during the week 7 which is the minimum throughout the course. Therefore overall performance of students who
However cluster B depicts one pass learning style which was the prominent learning style of videos in engineering courses. It has 97% total play (TP) percentage in its first session with zero NB and NF values. Even though the dropout percentage stays at 12%, their means grade is close to 0.25. The last cluster indicates repetitive scenario as it shows positive values for NB, NF and session no. It has the highest number of pauses as well, but they are short pauses because MP stays around 0.01. Students who have watched it repetitively by fast forwarding and backward seeking with high replay time belongs to this category. Their dropout rate and mean grade are also quite close to the values of cluster B. When comparing across the two courses, it is clear that students practice same set of learning styles but mean grade is twice higher in the Engineering CS 101 course. Because students have obtained grades close to 0.2 in humanities while engineering courses has values more than 0.5. 175
International Journal of Information and Education Technology, Vol. 8, No. 3, March 2018
higher mean grade (0.80) than humanities (0.49) but, the dropout rate is comparatively higher in engineering course (0.33) where humanities course has 0.18 of dropout rate at the beginning of the course. But both have decreased it up to less than 0.14 at the end. It explains that the rise of interest towards engineering course videos is higher.
follow one pass learning behaviour is fairly improved with higher grades and a significant decrease of dropouts. When we compare the time series analysis of one pass learning style across the courses, the proportion of Total Play Time (TP) is low in engineering (0.92) compared to humanities (0.98) but, towards the end of the courses, both increases up to 0.99. Engineering students have significantly
TABLE VIII: CLUSTER MEDOIDS FOR HUMANITIES AND STATISTICS LEARNING Week
NP
NB
NF
MP
SR
RL
TP
Session No
Mean grade
Variance grade
Drop Outs
Cluster Size
1
0.001517
0
0
0.3551
0
0
0.927234
0
0.3278
0.1954
0.0255
0.04644
2
0.009772
0
0
0.0194
0
0
0.994179
0
0.4498
0.2220
0.3391
0.7178
5
0.023529
0
0
0.0213
0
0
0.990709
0
0.7562
0.1710
0.1705
0.79325
6
0.015625
0
0
0.0184
0
0
0.995466
0
0.8086
0.1408
0.1240
0.7299
TABLE IX: TIME SERIES ANALYSIS OF VIDEOS IN HUMANITIES AND STATISTICS LEARNING Week
NP
NB
NF
MP
SR
RL
TP
Session No
Mean grade
Variance grade
Drop Outs
Cluster Size
2
0.02
0.0
0.0
0.02
0.0
0.0
0.98
0.0
0.15
0.067
0.18
0.51
3
0.02
0.0
0.0
0.04
0.0
0.0
0.98
0.0
0.25
0.089
0.12
0.42
7
0.03
0.0
0.0
0.02
0.0
0.0
0.97
0.0
0.49
0.11
0.06
0.35
9
0.031
0.0
0.0
0.03
0.0
0.0
0.99
0.0
0.49
0.12
0.14
0.65
In fact one pass behaviour has been an impact to the improvement of students in both courses which is clearly explained in above scenarios. Their mean grades are increased and dropout rate is reduced. So interest towards the course is highly improved.
In addition, the same analysis has been conducted for two videos from two different courses; Engineering CS101 and Humanities and statistical learning. A significant observation is the final grade of the Engineering course is higher than that of the Humanities and statistical learning course. According to the results, it is evident that even though there are minor differences between the results of two courses, the basic learning styles identified from the unsupervised learning can be applied to both courses. Through the proposed, we could analyze and compare the learner behavior of students across courses and time. The insight obtained can be used by educationist when designing courses, allowing the courses to adapt to the students, rather than following a fixed lesson style. The future work includes incorporating features corresponding to quizzes and forums to give a better overview of the overall behavior of a student. In addition, the comparison of the learning behavior of the two disciplines such as Engineering and Humanities can be done as a detailed analysis by using a pure humanities course such as a language teaching course. The techniques used in the analysis of learning behaviour can be further improved by incorporating the features of the course. Examples for such features would be the type of the course, the type of the video and the duration of the video.
Fig. 7. Humanities and statistical learning Clustering results.
VI. CONCLUSION AND FUTURE WORK As video lectures are major component in MOOCs, the student interactions with the video provides an insight into their learning experience. This research proposes an unsupervised learning technique to identify viewing styles of students. The learning styles are then compared with the student performance to find the temporal correlation between video interactions and performance.
ACKNOWLEDGEMENT The authors thank CAROL (The Center for Advanced Research through Online Learning) at University of Stanford for providing the dataset necessary for carrying out this research. 176
International Journal of Information and Education Technology, Vol. 8, No. 3, March 2018
REFERENCES [1]
[2]
[3] [4]
[5]
[6] [7]
[8]
[9]
[10]
[11]
[12]
[13]
[14] [15]
[16]
P. J. Guo, J. Kim, and R. Rubin, “How video production affects student engagement,” in Proc. the First ACM Conference on Learning @ Scale Conference, 2014. D. T. Seaton, Y. Bergner, I. Chuang, P. Mitros, and D. E. Pritchard, “Who does what in a massive open online course?” Communications of the ACM, vol. 57, no. 4, pp. 58–65, 2014. Stanford. (2017). Stanford Lagunita. [Online]. Available: https://lagunita.stanford.edu/ N. Li, L. Kidziński, P. Jermann, and P. Dillenbourg, ‘MOOC video interaction patterns: What do they tell us?” Design for Teaching and Learning in a Networked World. Springer Nature, pp. 197–210, 2015. J. Kim, P. J. Guo, D. T. Seaton, P. Mitros, K. Z. Gajos, and R. C. Miller, “Understanding in-video dropouts and interaction peaks in online lecture videos,” pp. 31–40, 2014. EdX. (2017). [Onlline]. Available: https://www.edx.org/ N. Li, L. Kidzinski, P. Jermann, and P. Dillenbourg, “How do in-video interactions reflect perceived video difficulty?” in Proc. the European MOOCs Stakeholder Summit 2015, P.A.U. Education, 2015, pp. 112–121. J. Boer, P. A. M. Kommers, and B. Brock, “Using learning styles and viewing styles in streaming video,” Computers & Education, vol. 56, no. 3, pp. 727–735, Apr. 2011. F. I. M. Craik and R. S. Lockhart, “Levels of processing: A framework for memory research,” Journal of Verbal Learning and Verbal Behavior, vol. 11, no. 6, pp. 671–684, 1972. M. Meiss, J. Duncan, B. Gonçalves, J. J. Ramasco, and F. Menczer, “What's in a session: tracking individual behavior on the web,” in Proc. the 20th ACM conference on Hypertext and hypermedia (HT '09), New York, NY, USA, pp. 173-182, 2009. M. Spiliopoulou, B. Mobasher, B. Berendt, and M. Nakagawa, “A framework for the evaluation of session reconstruction Heuristics in web-usage analysis,” INFORMS Journal on Computing, vol. 15, no. 2, pp. 171–190, May 2003. S. Shah and M. Singh, “Comparison of a time efficient modified k-mean algorithm with k-mean and k-Medoid algorithm,” in Proc. the 2012 International Conference on Communication Systems and Network Technologies, IEEE Computer Society, Washington, DC, USA, pp. 435-437, 2012. Stanford University. (2017). Center for Advanced Research through Online Learning | Institute for Research in the Social Sciences. [Online]. Available: https://iriss.stanford.edu/carol CAROL Learner Data Documentation. [Online]. Available: https://datastage.stanford.edu/ T. Kodinariya and P. Makwana, “Review on determining number of cluster in K-means clustering,” International Journal of Advance Research in Computer Science and Management Studies, vol. 1, no. 6, pp. 90-95, 2013. Scikit-learn: Machine learning in python- scikit-learn 0.18.1 documentation. [Online]. Available: http://scikit-learn.org/stable/ Dinusha Dissanayake is an undergraduate from the Department of Computer Science and Engineering, following the BSc. (honours) engineering degree at University of Moratuwa, Sri Lanka. He completed his internship as a software engineering intern at WSO2 Inc. His research interests includes data analytics and e learning.
177
Thilini Perera is an undergraduate following the B.Sc. engineering (honours) degree at the Department of Computer Science and Engineering in University of Moratuwa, Sri Lanka. Her current research interests are towards data analytics and data visualization. She is currently working on a data analytics project related to the education domain.
Chamil Elladeniya is currently majoring computer science and engineering at University of Moratuwa, Sri Lanka. He successfully completed his internship at WSO2 in year 2016. His main research interests are data science, integration and web services. blogging and music are his main leisure activities.
Kasun Dissnayake currently is a final year undergraduate of the Department of Computer Science and Engineering, University of Moratuwa. His main research interests are data analytics, cloud computing and mobile computing.
Sachini Herath is a lecturer in the Department of Computer Science and Engineering at the University of Moratuwa, Sri Lanka. She received Bachelors of Science of Engineering (B.Sc. Eng. Hons) from the University of Moratuwa. She is also an act ive contributor to Drupal, and developed the modules RDF UI, RDF Builder and Linked Data Tools. Her research interests include research topics of machine learning, learning analytics, database systems and computer vision for virtual reality. Indika Perera is a senior lecturer in the Department of Computer Science and Engineering at the University of Moratuwa, Sri Lanka. He holds a Ph.D. in Computer Science from the University of St Andrews, U.K; the focus of his Ph.D. was managed immersive technologies for education. He has also received a Master’s in Business Studies (MBS) from the University of Colombo, a masters in computer science (MSc) from the University of Moratuwa, a postgraduate diploma in business management from the University of Colombo and a bachelors of science of engineering (B.Sc. Eng. Hons) from the University of Moratuwa. His research interests include research topics of software architecture, software engineering; technology enhanced learning, human computer interaction and immersive environments. Dr. Perera is a fellow of the Higher Education Academy (UK), member of IET (UK) and member IEEE. He is also a Charted Engineer registered at Engineering Council (UK) and Institute of Engineers, Sri Lanka.