COORDINATED SCIENCE – BIOLOGY PORTION. 0654/3. Paper 3 ... Do not use
staples, paper clips, highlighters, glue or correction fluid. DO NOT ... 3 -. 2. (a)
The diagrams show two cells. Cell X is a plant cell and cell Y is from an animal. (i)
.
-1-
IGCSE Co-ordinated Sciences Post-Mock Revision Questions Biology Portion Name: ……………………………………………………………
COORDINATED SCIENCE – BIOLOGY PORTION Paper 3 (Extended)
0654/3 March 2012
Candidates answer on the Question Paper. No Additional Materials are required.
READ THESE INSTRUCTIONS FIRST Write your Centre number, candidate number and name on all the work you hand in. Write in dark blue or black pen. You may use a soft pencil for any diagrams, graphs, tables or rough working. Do not use staples, paper clips, highlighters, glue or correction fluid. DO NOT WRITE IN ANY BARCODES. Answer all questions.
At the end of the examination, fasten all your work securely together. The number of marks is given in brackets [ ] at the end of each question or part question.
-21
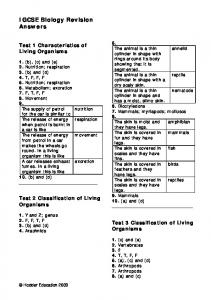
(a)
A student was asked to write a list of the characteristics shared by all living organisms. The list is shown below but it is not complete. Complete the list by writing the names of the missing characteristics in the empty boxes.
[2] (b)
Suggest why excretion and respiration are important to living organisms. excretion; ........................................................................................................... ............................................................................................................................ ............................................................................................................................ respiration. ....................................................................................................... ............................................................................................................................ ....................................................................................................................... [4]
-32
(a)
The diagrams show two cells.
Cell X is a plant cell and cell Y is from an animal. (i)
Name each cell. Cell X..................................................................................................... Cell Y................................................................................................. [2]
(ii)
Name parts A, B and C. A ....................................................................... B ....................................................................... C .......................................................................
(iii)
[3]
What is the cell wall made of? ........................................................................................................... [1]
The projections in each cell have different functions. (iv)
Complete the table.
[2]
-4(b)
The diagram shows a strip of onion tissue placed in a strong sugar solution.
Explain what has happened to cause the changes seen in these onion cells. ............................................................................................................................ ............................................................................................................................ ............................................................................................................................ ............................................................................................................................ ............................................................................................................................ ............................................................................................................................ ....................................................................................................................... [4]
(c)
The diagram shows a red blood cell.
-5(i)
What is the name of the pigment in the cell that helps it to absorb oxygen? ........................................................................................................... [1]
(ii)
Explain how the shape of the cell helps it to absorb oxygen. ................................................................................................................ ................................................................................................................ ................................................................................................................ ........................................................................................................... [2]
(d)
Below is a magnified diagram of a leaf cell.
(i)
Use the scale to measure the diameter of the nucleus. .......................... mm [1] This diagram has been magnified 100 times.
(ii)
Calculate the actual size of the nucleus in millimetres. Show your working.
.................................. mm
[2]
-63
(a)
The table shows the effect of temperature on the mass of starch broken down by amylase.
(i)
Use the data to draw a line graph on the grid provided.
[4]
-7(ii)
Describe and explain the effect of temperatures, above 35 °C, on the amylase. Effect ...................................................................................................... ................................................................................................................ Explanation ............................................................................................ ................................................................................................................ ........................................................................................................... [2]
(iii)
What is an enzyme? ................................................................................................................ ................................................................................................................ ................................................................................................................ ........................................................................................................... [2]
(iv)
What is produced when amylase breaks down starch? ........................................................................................................... [1]
-8Photographic film has a dark coating of the protein gelatine, which can be digested by a protease enzyme.
The diagrams show an investigation into the properties of enzymes.
-9(b)
(i)
Suggest two other factors which would have to be kept constant during this experiment. 1. ............................................................................................................ ................................................................................................................ 2.............................................................................................................. ........................................................................................................... [2]
(ii)
Suggest a suitable control for this experiment. ................................................................................................................ ........................................................................................................... [1]
(iii)
Describe the pattern in the results. ................................................................................................................ ................................................................................................................ ................................................................................................................ ........................................................................................................... [2]
(iv)
Suggest where this type of protease may be found in the human digestive system. Give a reason for your answer. ................................................................................................................ ................................................................................................................ ................................................................................................................ ........................................................................................................... [2]
- 10 4
(a)
The diagram shows part of a leaf.
(i)
Name layers A, B and C and structure D. A ............................................................ B ............................................................ C ............................................................ D ............................................................
(ii)
[4]
On the diagram label with an X the type of cell which carries out most photosynthesis.
[1]
a Y the type of cell which controls the movement of carbon dioxide in and out of a leaf. [1] (b)
(i)
Complete the word equation for photosynthesis.
[2]
- 11 (ii)
Explain how the starch, produced by photosynthesis, is used by the plant. ................................................................................................................ ................................................................................................................ ........................................................................................................... [2]
(c)
The graph shows the changes in carbon dioxide concentration measured in a field of grass on a warm sunny day.
(i)
Give the highest concentration of carbon dioxide recorded. ................................. arbitrary units [1]
(ii)
Between what times was the concentration of carbon dioxide below average? ........................................................................................................... [1]
(iii)
Describe the trend in carbon dioxide concentration between 4 am and 6 am. ................................................................................. 7 am and 5 pm. ................................................................................. [2]
- 12 (iv)
Explain the change in carbon dioxide concentration between 4 am and 6 am. ................................................................................................................ ................................................................................................................ ................................................................................................................ ........................................................................................................... [2]
(v)
Explain why the carbon dioxide concentration increases between 5 pm and 10 pm. ................................................................................................................ ................................................................................................................ ................................................................................................................ ........................................................................................................... [2]
(d)
The diagram shows the effects of minerals on the growth of seedlings.
(i)
Explain why the culture solution has air bubbled through it. ................................................................................................................ ................................................................................................................ ........................................................................................................... [2]
- 13 (ii)
Suggest a difference in the appearance of the leaves when grown in the solution without magnesium. ................................................................................................................ ........................................................................................................... [1]
(iii)
Complete the table showing some minerals required for healthy plant growth.
[3] 5
(a)
The graph shows the daily energy requirements for humans at different ages.
- 14 (i)
At what age do females have their highest energy requirement? ....................................... years [1]
(ii)
What is the highest energy requirement for males? ................................................ kJ [1]
(iii)
Explain why the female energy requirements are lower than those for males. ................................................................................................................ ........................................................................................................... [1]
(iv)
Give one other factor which affects the energy requirements of adults. ........................................................................................................... [1]
(v)
Explain what would happen to a 25-year-old female if her daily energy intake was 8000 kJ. ................................................................................................................ ................................................................................................................ ........................................................................................................... [2]
(vi)
Name the process in cells which releases the energy in food. ...................................................... [1]
(vii)
Give one other substance produced by this process ...................................................... [1]
- 15 (b)
The apparatus shown was used to calculate the energy in a piece of pasta.
(i)
Use the information above to help calculate the energy in the piece of pasta. Show your working.
Answer................................J [2] (ii)
Suggest one reason why not all the energy in the pasta was used to heat the water. ................................................................................................................ ........................................................................................................... [1]
- 16 (c)
The table summarises the nutritional information for pasta and the daily requirements for a 17-year-old male.
(i)
Using one piece of information from the table, suggest why eating 100g of pasta, as part of a healthy diet, reduces the risk of: heart disease; ........................................................................................ ................................................................................................................ constipation. ........................................................................................... ........................................................................................................... [2]
(ii)
Explain how: fat is used in the body; ................................................................................................................ ................................................................................................................ iron is used in the body; ................................................................................................................ ................................................................................................................ ................................................................................................................ calcium is used in the body. ................................................................................................................ ........................................................................................................... [4]
- 17 (iii)
Explain what is meant by a balanced diet. ................................................................................................................ ........................................................................................................... [1]
(d)
Complete the table below.
[5] (e)
Describe the test for reducing sugars. ............................................................................................................................ ............................................................................................................................ ............................................................................................................................ ............................................................................................................................ ....................................................................................................................... [3]
- 18 6
The diagram below shows some of the cells found in the root of a plant.
(a)
Name the structures labelled A, B and C. A ........................................................................................................................ B ........................................................................................................................ C ................................................................................................................... [3]
(b)
(i)
The water moves from the soil into the root hair cell by osmosis. Explain what is meant by osmosis. ................................................................................................................ ................................................................................................................ ................................................................................................................ ........................................................................................................... [2]
(ii)
Explain how the root hair cells are adapted to increase uptake of water from the soil. ................................................................................................................ ................................................................................................................ ................................................................................................................ ........................................................................................................... [2]
- 19 (c)
Complete the table below using a tick ( ) to indicate which cell is described by each statement.
[4] (d)
Loss of water from a leafy shoot can be measured using the apparatus below.
- 20 This apparatus was used by a student, in a brightly lit room, to measure the rate of water loss from a leafy shoot. He measured how far the bubble moved in five minutes. He measured this three times. The results are shown in the table.
(i)
Use these results to calculate the mean (average) rate of water loss in cm per minute. Show your working.
Answer............................ cm per minute. [2]
(ii)
If the room became colder, explain what would happen to the distance moved by the bubble. ................................................................................................................ ................................................................................................................ ................................................................................................................ ........................................................................................................... [2]
(iii)
If the light intensity became lower, explain what would happen to the distance moved by the bubble. ................................................................................................................ ................................................................................................................ ................................................................................................................ ........................................................................................................... [2]
- 21 7
The diagram shows part of the circulatory system.
(a)
(i)
Name vessels A, B, C and E. A ................................................................................................ B ................................................................................................ C ................................................................................................ E................................................................................................
[4]
(ii)
On the diagram, draw arrows to show the direction of blood flow in vessels D and F. [2]
(iii)
Name the blood vessel which contains the highest concentration of oxygen in the blood. ........................................................................................................... [1]
- 22 (iv)
Explain why the circulatory system is a double circulation. ................................................................................................................ ................................................................................................................ ........................................................................................................... [2]
(b)
(i)
Complete the table.
[5] (ii)
Explain two advantages of capillary walls being one cell thick. ................................................................................................................ ................................................................................................................ ................................................................................................................ ................................................................................................................ ........................................................................................................... [2]
- 23 (c)
The diagram shows a section through a heart.
(i)
Name the chambers A and D. A ....................................................... D .......................................................
(ii)
[2]
Explain the function of the semi-lunar valve. .................................................................................................... .................................................................................................... ............................................................................................... [2]
(iii)
Explain the difference in the thickness of heart wall at B and C. .................................................................................................... .................................................................................................... ............................................................................................... [2]
- 24 -
8
(a)
(i)
Define respiration. ................................................................................................................ ................................................................................................................ ........................................................................................................... [2]
(ii)
Write down the symbol equation for aerobic respiration.
[2] (b)
Distinguish between aerobic and anaerobic respiration.
............................................................................................................................ ............................................................................................................................ ............................................................................................................................ ............................................................................................................................ ............................................................................................................................ ....................................................................................................................... [3] (c)
Describe the role of anaerobic respiration in yeast during brewing and bread making. brewing; ............................................................................................................. ............................................................................................................................ ............................................................................................................................ ............................................................................................................................ bread – making. ................................................................................................. ............................................................................................................................ ..................................................................................................................... [5]
- 25 9
(a)
The diagram shows part of the human respiratory system.
(i)
Name parts A, B, C and D. A .................................................................... B .................................................................... C .................................................................... D ....................................................................
(ii)
[4]
List down three features that adapt the alveoli for gas exchange. ................................................................................................................ ................................................................................................................ ................................................................................................................ ........................................................................................................... [3]
- 26 The diagram shows some cells from the respiratory system. Healthy cells
Cells from a smoker
(iii)
Name the type of cells shown and describe their function. ................................................................................................................ ........................................................................................................... [2]
(iv)
Describe one difference between the healthy cells and those of the smoker. ................................................................................................................ ........................................................................................................... [1]
(v)
Name a disease caused by smoking. ............................................................
(vi)
[1]
Suggest why the person with the disease named in (v) above would find it difficult to walk upstairs. ................................................................................................................ ................................................................................................................ ................................................................................................................ ................................................................................................................ ........................................................................................................... [3]
- 27 (b)
(i)
Complete the diagram of expiration by drawing in the diaphragm and complete boxes X and Y to describe the changes.
[4] (ii)
What effect do the changes which occur during expiration have on the volume and pressure in the lungs? ................................................................................................................ ................................................................................................................ ................................................................................................................ ........................................................................................................... [2]
(iii)
State two differences in composition between inspired and expired air. ................................................................................................................ ................................................................................................................ ................................................................................................................ ........................................................................................................... [2]
- 28 10
(a)
The diagram shows a cross section of a human eye.
(i)
Name parts A, B, C and D. A .......................................................... B .......................................................... C .......................................................... D ..........................................................
(ii)
[4]
Complete the sequence of events relating to the eye.
[3] (iii)
Describe how the information received by the receptor cells travels to the co-ordinator. ................................................................................................................ ................................................................................................................ ........................................................................................................... [2]
- 29 (iv)
Describe the changes to the iris and pupil when moving from bright light into darkness. ................................................................................................................ ................................................................................................................ ................................................................................................................ ........................................................................................................... [2]
(v)
Suggest why this response is important for the eye. ................................................................................................................ ........................................................................................................... [1]
(b)
The table shows the thickness of the lens when looking at objects at different distances from the eye.
At first the thickness of the lens decreases evenly for every 100mm. (i)
Calculate the thickness of the lens for a distance of 200mm. Show your working.
Thickness of lens ................................ [2]
- 30 (ii)
Describe the relationship between object’s distance from the eye and the lens thickness. ................................................................................................................ ................................................................................................................ ........................................................................................................... [2]
(iii)
Suggest why the thickness of the lens stays the same between 1500 mm and 2000mm. ........................................................................................................... [1]
(c)
The diagram shows a reflex arc.
(i)
Name part A and B
A .......................................................... B ..........................................................
[2]
- 31 (ii)
Describe the events in the reflex arc that leads to withdrawal of the finger from the drawing pin. ................................................................................................................ ................................................................................................................ ................................................................................................................ ................................................................................................................ ................................................................................................................ ................................................................................................................ ........................................................................................................... [4]
(d)
Complete the table below to show the differences between nervous and hormonal control in the body.
[4]
- 32 11
(a)
The diagram below shows a section through human skin.
(i)
On the diagram, label; hair shaft, sweat gland, blood capillary and fatty tissue. [4]
(ii)
Suggest two possible functions of the nerve endings shown in the diagram above. 1. ............................................................................................................ 2. ....................................................................................................... [2]
(b)
Explain how the skin is involved in the loss of heat from the body during exercise. ............................................................................................................................ ............................................................................................................................ ............................................................................................................................ ............................................................................................................................ ............................................................................................................................ ....................................................................................................................... [3]
- 33 (c)
The diagram shows the mechanism involved in the regulation of blood sugar levels.
(i)
Name the organ which produces insulin and glucagon. ...............................................................
(ii)
[1]
Use the diagram to help explain how a negative feedback mechanism works. ................................................................................................................ ................................................................................................................ ........................................................................................................... [2]
(iii)
Explain how insulin causes the liver to reduce the blood glucose concentration. ................................................................................................................ ................................................................................................................ ................................................................................................................ ................................................................................................................ ........................................................................................................... [3]
- 34 (d)
(i)
State two conditions that increases the secretion of adrenaline in the blood. ................................................................................................................ ........................................................................................................... [2]
(ii)
Give three main effects of adrenaline on the human body. ................................................................................................................ ................................................................................................................ ................................................................................................................ ................................................................................................................ ........................................................................................................... [3]
- 35 12
(a)
(i)
Define asexual reproduction. ................................................................................................................ ........................................................................................................... [1]
(ii)
State two advantages and two disadvantages of asexual reproduction advantages ............................................................................................ ................................................................................................................ ................................................................................................................ disadvantages ....................................................................................... ................................................................................................................ ........................................................................................................... [4]
(b)
The drawing below shows part of a tomato flower.
(i)
Name parts A, B and C. A .......................................................... B .......................................................... C ..........................................................
[3]
- 36 (ii)
Sate the functions of parts B and D. B ............................................................................................................ D ....................................................................................................... [2]
(iii)
On the diagram, mark with a P, the part where a pollen grain must land to pollinate the flower. [1]
(iv)
Suggest an agent of cross pollination for the tomato flower. Give two reasons for your answer. agent of pollination ................................................................................ reasons .................................................................................................. ................................................................................................................ ........................................................................................................... [3]
The diagram shows a wind-pollinated flower.
(v)
Describe two features seen in the diagram that show this is a windpollinated flower. 1 ............................................................................................................. ................................................................................................................ 2 ............................................................................................................. ........................................................................................................... [2]
- 37 (c)
The diagram shows different types of fruit.
(i)
Name the fruit whose seed is dispersed by wind. Explain your answer. fruit ..................................................... explanation ............................................................................................ ................................................................................................................ ........................................................................................................... [3]
When strawberries are eaten by birds the seeds are dropped in their faeces. (ii)
Suggest why the bird is attracted to the strawberry as food. ................................................................................................................ ................................................................................................................ ........................................................................................................... [2]
(iii)
Explain why the seeds can still germinate after passing through the intestine of the bird. ................................................................................................................ ........................................................................................................... [1]
(iv)
Give two reasons why seed dispersal is necessary. ................................................................................................................ ........................................................................................................... [2]
- 38 (d)
The diagram shows a section of a seed.
(i)
Name parts A, B and C. A .................................................... B .................................................... C ....................................................
(ii)
[3]
Give the function of D. ........................................................................................................... [1]
(e)
List down three environmental factors that affect germination of seeds. 1 ........................................................................................................................ 2 ......................................................................................................................... 3 .................................................................................................................... [3]
- 39 13
(a)
The diagram below shows part of the male reproductive system.
(i)
Name parts A, B and D. A ......................................................... B ......................................................... D .........................................................
(ii)
[3]
Give two functions of part C. ................................................................................................................ ........................................................................................................... [2]
(iii)
Complete the drawing by showing the position of the bladder.
[2]
- 40 The diagram shows part of the reproductive system of a pregnant woman.
(b)
Name the parts labelled A, B, F and G. A .......................................................... B .......................................................... F ..........................................................
(c)
G ..........................................................
[4]
(i)
On the diagram, mark with an X where fertilization occurs.
[1]
(ii)
Describe the process of fertilization. ................................................................................................................ ................................................................................................................ ........................................................................................................... [2]
- 41 (d)
(i)
Which letter shows a part that releases progesterone? ........................................................................................................... [1]
(ii)
Why is it important that progesterone is released during pregnancy? ................................................................................................................ ........................................................................................................... [2]
(e)
(i)
Which letter shows the placenta? ........................................................................................................... [1]
(ii)
Give two functions of the placenta. 1 ............................................................................................................. 2 ........................................................................................................ [2]
(f)
The diagram shows the main changes which occur in a female during a menstrual cycle.
(i)
Between which days does: menstruation occur; ............................................. ovulation occur. ...................................................
[2]
- 42 (ii)
Describe what happens to the lining of the uterus when: menstruation occurs. ............................................................................. ................................................................................................................ it prepares for a fertilized egg. ............................................................... ........................................................................................................... [2]
(iii)
What is ovulation? ................................................................................................................ ................................................................................................................ ........................................................................................................... [2]
The menstrual cycle starts at puberty. (vii)
Give three other changes which occur in the female body during puberty. 1. ............................................................................................................ 2. ............................................................................................................ 3. ....................................................................................................... [3]
(g)
AIDS is a sexually transmissible infection. (i)
Name the type of organism which causes AIDS. ........................................................................................................... [1]
(ii)
Other than through sexual intercourse, state three other ways through which AIDs is transmitted from one person to another. ................................................................................................................ ................................................................................................................ ........................................................................................................... [3]
(iii)
State two methods through which AIDs can be prevented from spreading. ................................................................................................................ ........................................................................................................... [2]
- 43 14
(a)
The diagram below shows the chromosomes in an animal cell dividing by meiosis.
(i)
Complete the diagram by drawing in the remaining cells, the reassorted chromosomes which would produce two genetically different cells. [2]
(ii)
Describe the change in the number of chromosomes during meiosis. ................................................................................................................ ................................................................................................................ ........................................................................................................... [2]
(iii)
Where are chromosomes found in a cell? ........................................................................................................... [1]
(iv)
Where in the human body does meiosis occur? ........................................................................................................... [1]
- 44 (v)
Give two differences between mitosis and meiosis. 1. ............................................................................................................ ................................................................................................................ 2. ............................................................................................................ ........................................................................................................... [2]
(vi)
State three roles of mitosis. 1. ............................................................................................................ 2. ............................................................................................................ 3. ....................................................................................................... [3]
The diagram shows a genetic cross between two pure bred mice. Black coat (B) is dominant to white coat (b).
(b)
Complete the diagram by giving the genotype of the white parent and the phenotype of the offspring. [2]
- 45 Two of the offspring were mated. (c)
(i)
Complete the Punnett square to show this cross.
[3]
(ii)
Draw a circle round the homozygous recessive offspring.
(iii)
Give the expected ratio of black mice to white mice.
[1]
........................................................................................................... [1] (iv)
Explain what is meant by recessive. ................................................................................................................ ........................................................................................................... [1]
(v)
Explain the terms heterozygous and homozygous. ................................................................................................................ ................................................................................................................ ........................................................................................................... [2]
- 46 (d)
The alleles for black and white coats are two forms of a gene. (i)
What is a gene? ........................................................................................................... [1]
(ii)
Where are genes found in the cell? ................................................................................................................ ........................................................................................................... [2]
(e)
The diagram shows a set of chromosomes from a human cell.
Use the information in the diagram to help answer the following questions. (i)
Give the sex of the person the cell was taken from and give a reason for your answer. ................................................................................................................ ................................................................................................................ ........................................................................................................... [2]
- 47 The chromosomes show an abnormality. (ii)
Describe how these chromosomes differ from normal chromosomes and suggest the genetic condition the person would be affected by. description ............................................................................................. ........................................................................................................... [1] genetic condition ............................................................................... [1]
(iii)
What term describes a change in a chromosome? ..............................................................
15
(a)
[1]
The graph below shows the percentage of people with different blood groups. Blood groups are an example of variation.
State the type of variation shown in the graph. Give a reason for your choice. ............................................................................................................................ ............................................................................................................................ ............................................................................................................................ ....................................................................................................................... [2]
- 48 (b)
(i)
Complete the table.
[3] (ii)
Explain what is meant by continuous variation. ................................................................................................................ ................................................................................................................ ........................................................................................................... [1]
The diagram shows graphs drawn from data collected during biology experiments.
(c)
Which is the graph for: height; ................................................. tongue rolling; .....................................
[2]
- 49 The photograph below shows two forms of the peppered moth, a pale form and a black form. Birds feed on both forms of moth.
(d)
What would happen to the black moths in a woodland with light coloured tree trunks? ............................................................................................................................ ....................................................................................................................... [1]
(e)
A wood with light coloured tree trunks, had the following proportion of the two forms of moth.
The tree trunks became blackened with soot from a nearby factory. What would happen to the percentage of each type of moth in the wood? Explain your answer. ............................................................................................................................ ............................................................................................................................ ............................................................................................................................ ....................................................................................................................... [4]
- 50 (f)
(i)
Distinguish between artificial and natural selection. ................................................................................................................ ................................................................................................................ ................................................................................................................ ........................................................................................................... [2]
(ii)
Using development of strains of antibiotic resistant bacteria as an example, explain how natural selection can lead to evolution.
................................................................................................................ ................................................................................................................ ................................................................................................................ ................................................................................................................ ................................................................................................................ ................................................................................................................ ................................................................................................................ ................................................................................................................ ................................................................................................................ ........................................................................................................... [5]
- 51 16
(a)
The below diagram shows part of a grassland food web.
(i)
Use the diagram to name: the producer; ............................................................. a secondary consumer. ..............................................
(ii)
[2]
Explain the importance of producers in the food web. ................................................................................................................ ................................................................................................................ ........................................................................................................... [2]
Only a small part of the energy in the hare is available to the fox. (iii)
Suggest three reasons for this. 1. ............................................................................................................ 2. ............................................................................................................ 3. ....................................................................................................... [3]
- 52 (b)
The diagram represents the energy flow through a short food chain.
Heat
(i)
Give the source of energy for the food chain. ........................................................................................................... [1]
(ii)
Name organism A and process B. Organism A ................................................................ Process B ...................................................................
(iii)
[2]
Calculate the percentage of the energy in barley that is transferred to the growth of the bullock. Show your working.
Answer ...................................... [2]
- 53 Farmers can increase the percentage of the energy used by their bullocks for growth, by keeping them in cattle sheds during the winter. (iv)
Suggest two reasons why bullocks kept in cattle sheds in the winter could grow faster. ................................................................................................................ ................................................................................................................ ........................................................................................................... [2]
(v)
Explain in terms of energy, why it would be better for humans to eat barley directly. ................................................................................................................ ................................................................................................................ ................................................................................................................ ................................................................................................................ ................................................................................................................ ........................................................................................................... [3]
- 54 (c)
The diagram shows part of the carbon cycle.
(i)
Name the processes A, B and C. A ............................................................... B ............................................................... C ...............................................................
(ii)
[3]
Use the diagram to describe how carbon, from the air, is passed through a food chain and back into the air by decomposers. ................................................................................................................ ................................................................................................................ ................................................................................................................ ................................................................................................................ ................................................................................................................ ........................................................................................................... [3]
- 55 (iii)
Using the diagram, discuss the effect of combustion of fossil fuels and cutting down of trees on the amount of oxygen and carbon dioxide in the atmosphere. ................................................................................................................ ................................................................................................................ ................................................................................................................ ................................................................................................................ ................................................................................................................ ........................................................................................................... [3]
- 56 17
(a)
What is deforestation? ............................................................................................................................ ....................................................................................................................... [1]
The graph shows changes in the area of rainforest and atmospheric carbon dioxide concentration since 1950.
(b)
What evidence is there of deforestation from the graph? ............................................................................................................................ ....................................................................................................................... [1]
(c)
Explain how the change in atmospheric carbon dioxide concentration may be caused by deforestation. ............................................................................................................................ ............................................................................................................................ ....................................................................................................................... [2]
(d)
Suggest and explain one other way Man’s activities could cause the changes in the atmospheric carbon dioxide concentration. ............................................................................................................................ ............................................................................................................................ ....................................................................................................................... [2]
- 57 (e)
Explain how changes in atmospheric carbon dioxide concentration are linked to changes in global temperatures. ............................................................................................................................ ............................................................................................................................ ............................................................................................................................ ............................................................................................................................ ............................................................................................................................ ............................................................................................................................ ....................................................................................................................... [3]
(f)
Complete the table below on air pollution.
[4] (g)
Eutrophication of rivers can be caused by pollution from farms. (i)
Give two ways farming can cause eutrophication. 1. ............................................................................................................ 2. ....................................................................................................... [2]
(ii)
Suggest how this can cause an algal bloom in rivers. ................................................................................................................ ................................................................................................................ ........................................................................................................... [2]
- 58 (iii)
Explain how this algal bloom can result in the death of fish and other aquatic animals. ................................................................................................................ ................................................................................................................ ........................................................................................................... [2]
(h)
The table shows the sulphur dioxide emissions in the UK in 1998.
(i)
Complete the pie chart for this data.
[3] In total 1610 thousand tonnes of the gas were produced. (ii)
Calculate the mass of sulphur dioxide emitted by transport. Show your working.
....................................................................... [3]
- 59 (iii)
Explain how sulphur dioxide emissions can lead to acid rain. ................................................................................................................ ........................................................................................................... [1]
(iv)
Give two effects of acid rain. 1. ............................................................................................................ 2. ....................................................................................................... [2]
(v)
Suggest two ways to reduce sulphur dioxide emissions. ................................................................................................................ ................................................................................................................ ........................................................................................................... [2]
(vi)
Explain why acid rain is an international problem. ................................................................................................................ ................................................................................................................ ........................................................................................................... [2]
(i)
Describe the need for conservation of:
species and their habitat; ................................................................................... ............................................................................................................................ ............................................................................................................................ ............................................................................................................................ natural resources such as water and fossil fuel. ................................................ ............................................................................................................................ ............................................................................................................................ ............................................................................................................................ ....................................................................................................................... [6]