FTP index. HFM heat flux meter qâ²x heat flux (kW/m2) ig ignition. Q .... A series of free-burning radiation experiments with propane gas burners was carried out ...
Ignition of Secondary Objects in a Design Fire Simulation Tool 1
2
3
3
GREG BAKER , ROB FLEURY , MICHAEL SPEARPOINT , CHARLES FLEISCHMANN , and 4 COLLEEN WADE 1 Fire and Structural Engineering Section BRANZ Ltd, Porirua, New Zealand 2 Arup, Sydney, New South Wales, Australia 3 Department of Civil and Natural Resources Engineering University of Canterbury, Christchurch, New Zealand 4 QStar Solutions Ltd Porirua, New Zealand ABSTRACT A collaborative research project is currently in progress which aims to develop a fire zone model that deals with the uncertainty and variability associated with the modelling of design fires and design fire scenarios in buildings. As part of this research, a simple submodel has been developed which simulates the radiation received by secondary fuel items from both remote burning objects and enclosure surfaces and determines when secondary items ignite. An experimental programme was carried out to validate both the radiation and ignition predictions of the submodel, with good agreement being achieved between the theoretical model and actual intermediate-scale experiments in the laboratory. The experimental programme also serves to demonstrate the use of different radiation measuring devices. KEYWORDS: modelling, compartment fires, heat transfer, ignition. NOMENCLATURE LISTING D E F FTP G J n
diameter (m) emissive power (kW/m2) configuration factor Flux-Time Product (kW·sn/m2) irradiance (kW/m2) radiosity (kW/m2) FTP index heat flux (kW/m2)
Q R t T z Greek θ χ ε ρ σ
heat release (kW) radial distance (m) time (s) temperature (K) height (m)
q
subscripts auto ignition auto blackbody b critical cr fire f flame fl heat flux meter HFM ignition ig inc min pilot r W
incident minimum piloted ignition radiative water
angle (rad) radiative fraction emissivity reflectivity Stefan-Boltzmann constant
INTRODUCTION In relation to life safety, the traditional deterministic approach to modelling building fires makes it difficult to address the associated risk and uncertainty. A quantitative risk assessment (QRA) model is therefore in the process of being developed that addresses the inherent uncertainty in design fires and design fire scenarios in a rational manner. One specific aspect of the new risk-informed model is a methodology for modelling the radiant ignition of combustible items in pre-flashover compartment fires.
FIRE SAFETY SCIENCE-PROCEEDINGS OF THE TENTH INTERNATIONAL SYMPOSIUM, pp. 1359-1372 COPYRIGHT © 2011 INTERNATIONAL ASSOCIATION FOR FIRE SAFETY SCIENCE / DOI: 10.3801/IAFSS.FSS.10-1359
1359
Fire computer models are widely used by engineering practitioners to carry out fire safety designs for buildings. In the context of conducting a survey of the fire and smoke computer models that are available internationally, Olenick and Carpenter [1] list six types of fire models, namely; zone, field, detector response, egress, fire endurance and miscellaneous. These types of models can then be classed as being either deterministic or stochastic. When generically compared to stochastic models, Vose [2] describes deterministic (also known as „single point‟) modelling as involving the use of a single „best guess‟ estimate of each variable within a model to determine the model‟s outcome(s). It is possible to deal simplistically with the uncertainty inherent in building fires by varying the single point input values of the deterministic model and repeating the calculation procedure. This approach however does not address the uncertainty (probability) of a particular scenario occurring, which gives rise to the use of stochastic or probabilistic fire models [3]. As described by Walton et al. [4] a zone model generally divides a building enclosure into two relatively large control volumes, consisting of a hot upper layer and a cooler lower layer, that result from stratification due to buoyancy. A collaborative research project is currently in progress which aims to develop a new QRA tool for use in fire safety engineering design of buildings [5]. The project is enhancing the functionality of the existing deterministic zone model BRANZFIRE [6,7] by describing model input parameters in terms of probability distribution functions. Monte Carlo sampling techniques are then used to produce tenability parameter outputs in the form of cumulative density functions. The new tool will provide practitioners with a rational means to demonstrate compliance with future risk-informed building fire regulations [8]. The fundamental starting point for building fire safety designs is the heat release rate (HRR) of the fire [9], often called the „design fire‟. The current practice adopted by many fire safety engineers is to assume a particular HRR time history to represent the design fire scenario for the building being designed. Not only is very little guidance given by the regulator or building official as to what constitutes an acceptable design fire, which results in subjectivity and inconsistency, but deterministic design fire values do not address the risk and uncertainty inherent in the HRR. An important aspect therefore of the current research project is the development of a methodology to generate probabilistic design fires for certain occupancy classes – a so-called Design Fire Generator (DFG). Instead of the current practice to assume a single design fire, the DFG generates a unique design fire curve for each of a large number of repeat simulations. The approach being taken for each repeat simulation is to randomly populate a given compartment in a building with fuel objects using Monte Carlo sampling techniques, with both the number and spatial separation of the objects being random variables. Certain rules are applied to the number and location of these objects. For example, objects such as bookshelves have a high probability of being in close proximity to a wall, items are not located in front of doorways, and the maximum number of objects in the room is governed by the expected fire loading (also a random variable) for that occupancy group. In the DFG, for each simulation an initial item starts burning and then a submodel determines if and when a random number of randomly spaced secondary items ignite due to radiation from the initial burning item, from the hot upper layer and from enclosure surfaces. At different time steps in the simulation process, and if subsequent items are deemed to have ignited, a composite HRR time history is built up in an additive fashion based on the HRR of the individual fuel packages, thus producing a single combined design fire curve. The DFG then repeats this randomised process over and over again to probabilistically produce a „family‟ of design fire curves for that occupancy class. Each design fire curve is then used as input to the QRA tool for a run of the model‟s deterministic calculation engine to give a single set of model outputs. This procedure is repeated a large number of times so that the model outputs can be expressed as cumulative density functions. The focus of this paper is the thermal radiation and ignition model that forms part of the DFG, within the QRA tool that is under development. RADIATION AND IGNITION SUBMODEL The purpose of the radiation and ignition submodel is to determine when secondary fuel items will ignite following exposure to radiation from an initial burning item. An example of a random secondary object layout is shown in Fig. 1. 1360
Secondary object 2 R2
Secondary object 1
R1 R3
Fire
Secondary object 3
Fig. 1. Plan view of random object layout in enclosure for DFG. The radiation and ignition submodel has three discrete components; firstly radiation from flaming objects, secondly radiant exchange within a compartment, and thirdly ignition of secondary fuel items. An important aspect of the first two components of the submodel is the concept of configuration factors, which represent the fraction of radiation leaving one surface and being received by another [10–12]. Selection of Flame Radiation Model The first aspect of the radiation and ignition submodel is to select a flame radiation model. Research was conducted [13] to investigate the performance of six flame radiation models of varying complexity. The six flame radiation models consisted of a spherical model, a simple correlation, three different cylindrical models, and a planar model. A series of free-burning radiation experiments with propane gas burners was carried out, to ascertain which of the six flame radiation models was best suited for inclusion in the radiation and ignition submodel. Three different burner aspect ratios were utilised; 1:1, 2:1, and 3:1, consisting of burners that were 300 mm wide by 300, 600 and 900 mm long. Heat flux measurements in the vertical and horizontal orientation were taken with Schmidt-Boelter total heat flux meters (HFM), perpendicular to both the front and one side of the burner, at varying distances and with varying HRR up to a maximum of 300 kW. The burner was also positioned in one of two different orientations. When positioned at 0o, the sides of the burner were parallel to the heat flux gauges, and the second orientation was with the burner rotated by 45o, as shown in Fig. 2.
Burner orientation 0o or 45o
HFM location
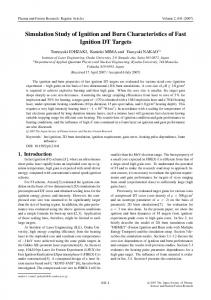
HFM location Fig. 2. Flame radiation experimental layout. Of the six models investigated, the spherical model, known as „Modak‟s point source model‟ [14], gave the best match to the actual experimental heat flux values that were measured. Figure 3 shows the results for the point source model for three tests where the HFM orientation is vertical, the burner aspect ratios are 1:1, 2:1 and 3:1, the burner angle is 0o, the burner output levels are 300, 250, 200, 150 and 100 kW, and the HFM distances are 1.0, 0.75 and 0.5 m from the burner centre.
1361
Measured radiation (kW/m²)
100
10
1
1:1 burner 2:1 burner 3:1 burner 0.1 0.1
1
10
100
Predicted radiation (kW/m²)
Fig. 3. Point source model – predicted vs. measured radiation (adapted from Ref. [13]). On this basis the point source model is selected for use in the radiation and ignition submodel. The point source model assumes radiation being emitted isotropically from a point source, in the form of the Q cos following expression q r , where is the angle between the normal to the target and line of 4R 2 sight from the target to the point source. The point source model is applied [15] at the mid-height of the flame, as noted in Fig. 4, with the flame height given by Heskestad‟s [16] flame height correlation z fl 0.235Q 2 / 5 1.02D f .
Df Flame zi
Interface
Point source R zfl2
θ Secondary object Fire
Fig. 4. Elevation of point source model (adapted from Ref. [17]). Radiant Exchange in Compartments A number of simplifying assumptions are made in formulating the calculation procedures of the radiation and ignition submodel [17]. The submodel assumes that radiation exchange is occurring in the lower layer of a pre-flashover compartment fire. Radiation exchange occurs between six „surfaces‟, which consist of the four wall segments below the layer interface, the floor, and the underside of the hot upper layer. Each surface is assumed to be isothermal, diffuse, opaque and gray [12]. The submodel makes use of a number of published [10] configuration factor formulae to calculate the radiation exchange. In addition to the radiation exchange between surfaces, the submodel also makes use of the method illustrated by Forney [18] to calculate the configuration factor for the radiation from the fire to the surrounding surfaces. The submodel also makes use of the concept of radiosity and irradiance [11]. Radiosity is the total radiation (emitted and reflected) leaving a surface, while irradiance is the total radiation arriving at a surface. The radiosity from the ith surface is expressed as: 1362
J i i Ebi iGi
(1)
The total irradiance from the ith surface is: Gi
F
(2)
ji J j
j
The idealised blackbody emissive power of the ith surface is given as: Ebi Ti 4
(3)
Kichoff‟s Law is also applied to diffuse, gray, opaque surfaces such that:
i i 1
(4)
In the literature, a number of authors [10,12,18] illustrate a technique for calculating the radiosity at each surface in an enclosure due to radiation exchange. As noted, the lower layer has six surfaces of finite area, which in turn gives a corresponding number of linear algebraic equations for the unknown radiosity at each surface. In addition, the submodel also represents each secondary object in the enclosure as a target cube with six differential area surfaces. Both radiosity and irradiance are modelled at the six finite area surfaces. It is assumed that radiant exchange does not occur between secondary objects and compartment surfaces, hence only irradiance is accounted for at the sets of six differential areas representing each secondary object. Therefore, for a simulation with one secondary object, 12 equations need to be solved simultaneously, for two secondary objects, 18 equations, for three secondary objects, 24 equations, etc. By substituting Eqs. 2–4 into Eq. 1, including a term for the irradiance from the initial burning object and solving for the unknown surface radiosities, the following expression results:
1 1 i
Ji i 1 i
4 Ti
N
F
ji J j
G fi
(5)
j 1
where N is the number of surfaces being modelled (compartment surfaces plus „target‟ cube surfaces). Equation 5 can be expressed in matrix form such that AJ C where A is an N by N matrix of known coefficients, J is a column matrix with N unknown radiosity terms, and C is a column matrix with N known irradiance terms. The submodel then uses matrix inversion to solve for J , i.e. J A1C . It is then a matter of substituting Eq. 3 into Eq. 1 to determine the irradiance, Gi. Selecting Ignition Criterion Methodology Having determined the radiation that is incident on secondary objects in the enclosure, the submodel requires a methodology to determine when ignition occurred. In research published by Baker et al. [19], the process for selecting an ignition criterion methodology for the submodel is described in detail. Having established a number of criteria that the ignition criterion method needed to meet, the flux-time product (FTP) method has been selected. The FTP approach is a simple way to predict piloted ignition when a combustible material is subject to an incident flux. Having been originally defined by Smith and Satija [20], the concept was extended by other researchers [21–23]. Further work by Shields et al. [24] generalised the FTP concept to include materials of different thermal thickness, such that: n FTP tig q qcr
(6)
1363
where n is a thermal thickness parameter called the FTP index ( 1 n ). Equation 6 can be rearranged to give a linear relationship: 1/ n q FTP1 / n / tig qcr
(7)
From experimental time-to-ignition data, a correlation procedure involving a trial-and-error linear trend line , and n. method, was used to determine the FTP dataset for the material, namely the FTP, q cr The basis of the FTP approach is that when a material is subjected to external heat flux, and when the heat flux exceeds a critical value, the FTP will aggregate until it exceeds a certain threshold and the material ignites. In relation to the submodel, the mathematical formulation is a variant on Eq. 6 such that for every , the submodel calculates the FTP in a cumulative fashion: time step in the simulation when q exceeds q cr m
FTP
q q
n
i
cr
ti
(8)
i 1
where ti is the ith time increment. In utilising the submodel functionality of the overall QRA tool, users have the choice of selecting secondary objects from the model database complete with a FTP dataset included as parameters of the object, or they can input their own secondary object, including a FTP dataset. In order to demonstrate the latter procedure, a series of Cone Calorimeter experiments was conducted on one type of foam-paddingfabric composite that represented typical low-cost furniture found in New Zealand. The composite consisted of flexible polyurethane foam, lightweight thermally-bonded polyester blanket padding, and 100 % polyester fabric, with all three components not fire-retardant-treated [19]. Experiments were carried out to test standard AS/NZS 3837:1998 [25]. Tests were done in both the horizontal and vertical orientations, and for both the piloted and auto ignition modes. EXPERIMENTAL PROGRAMME Compartment Radiation In order to validate the radiation algorithms of the submodel, two different series of tests have been conducted in an ISO 9705 [26] enclosure, the first series using a propane gas burner, and the second consisting of a series of hydrocarbon pan fire experiments. For each, heat flux measurements were taken at two fixed locations (R1 and R2), and the position of the burner (B1–B3) or pan (P1–P5) varied, as shown in Fig. 5.
B1
R1
P2
R2
P5a, P5b P3
R2
P1 R1
900 mm 750 mm
(a)
P4
600 mm
600 mm
2400 mm
1700 mm
2400 mm
B2
1100 mm
B3
3600 mm
950 mm
3600 mm
900 mm
900 mm
(b)
Fig. 5. ISO room layout: (a) propane burner (adapted from Ref. [17]); (b) pan fires. For the propane burner series, heat flux measurements were taken with Gardon HFMs, located at position R1 and R2. For each propane burner experiment (shown as B1–B3 in Fig. 5a), the heat output consisted of 1364
a series of 100 kW steps up to a maximum of 300 kW and lasting for 1200 s each, as shown in Fig. 6a. For the fuel pan series (shown as P1–P5b in Fig. 5b), heat flux measurements were taken with a Gardon HFM at Position R1, and a Schmidt-Boelter and Gardon HFMs at R2. The heat output varied for each experiment, with approximately 1.5 kg of 91-octane petrol in a 450 by 450 mm pan being used each time and a typical example is shown in Fig 6b.
450 400 350 300 250 200 150 100 50 0
450 400 350 300 250 200 150 100 50 0
Fuel pan output (kW)
Burner output (kW)
For the HFMs, the incident radiation measurements are „adjusted‟ to account for the temperature of the qHFM water cooling the device, TW, as qinc is the heat flux derived from the HFM TW4 , where q HFM voltage reading [27].
0
1000
2000
3000
4000
5000
6000
0
100 200 300 400 500 600 700 800
Time (s) (a)
Time (s) (b)
Fig. 6. Heat output: (a) propane burner; (b) fuel pan. Secondary Object Ignition Time-to-ignition experiments were also conducted in conjunction with the fuel pan experiments. A 100 by 100 by 25 mm thick specimen of the foam-padding-fabric composite, identical to that used for the Cone Calorimeter ignition experiments [19], was mounted vertically in a cage immediately adjacent to the HFMs, and ignition times recorded. EXPERIMENTAL RESULTS AND ANALYSIS Compartment Radiation Experiments
20
Measured radiation (kW/m2)
Measured radiation (kW/m2)
The general objective of the compartment radiation experiments was to validate the radiation algorithms of the submodel. Firstly, the results of the propane burner radiation experiments are illustrated in Fig. 7a–f, showing the three burner locations (B1 centre, B2 wall and B3 corner – refer to Fig. 5a) and two radiation measuring points (R1, R2). The general trend illustrated by Fig. 7a–b is that while the radiation predicted by the submodel stayed relatively constant, the corresponding actual radiation, measured by the HFM, fluctuated. For example, the middle data „column‟ seen in Fig. 7b indicates that the submodel underpredicted the measured radiation by 0–90 %, approximately.
16 12 8 4
20 16 12 8 4 0
0 0
4
8
12
16
Predicted radiation (kW/m2)
(a)
20
0
4
8
12
16
20
Predicted radiation (kW/m2)
(b) 1365
Measured radiation (kW/m2)
Measured radiation (kW/m2)
10 8 6 4 2
10 8 6 4 2 0
0 0
2
4
6
8
0
10
2
4
Predicted radiation (kW/m )
(c)
8
10
(d)
10
Measured radiation (kW/m2)
Measured radiation (kW/m2)
6
Predicted radiation (kW/m2)
2
8 6 4 2
10 8 6 4 2 0
0 0
2
4
6
8
0
10
2
4
6
8
10
Predicted radiation (kW/m 2)
Predicted radiation (kW/m2)
(e)
(f)
Fig. 7. Predicted vs. measured radiation: (a) burner B1/R1; (b) burner B1/R2; (c) burner B2/R1; (d) burner B2/R2; (e) burner B3/R1; (f) burner B3/R2.
40
Measured radiation (kW/m 2)
Measured radiation (kW/m2)
Secondly, a selection of two typical results is also illustrated in Fig. 8a and 8b for the fuel pan series of experiments, showing fuel pan location P5a (centre – refer to Fig. 5b) for Gardon HFM location R1, and Schmidt-Boelter and Gardon HFM location R2.
32
24
16
8
Gardon 0
20
16
12
8
4
Gardon S-B
0 0
8
16
24
32
Predicted radiation (kW/m2)
(a)
40
0
4
8
12
16
20
Predicted radiation (kW/m 2)
(b)
Fig. 8. Predicted vs. measured radiation: (a) centre pan P5a/R1; (b) centre pan P5a/R2. In Fig. 8a, it can be seen that at radiation levels below approximately 20 kW/m 2, the predicted and measured radiation values varying quite significantly, but start to converge at higher levels, while in Fig. 8b a better match is achieved over the whole radiation range. Figure 8b also illustrates the comparison between a Gardon and Schmidt-Boelter HFM, which is in turn more clearly shown in Fig. 9.
1366
Schmidt-Boelter HFM
20 16
12 8 4 0 0
4
8
12
16
20
Gardon HFM Fig. 9. Centre pan P5a/R2 - Gardon vs. Schmidt-Boelter HFM. It is also of interest to distinguish between the different radiation sources. The logical expectation would be that the closer to the burning item, the more dominant the radiation from the point source model in the submodel calculation procedures. In Fig. 10, the radiation from the fire is split out from the compartment surface radiation. 40
Pt source component Surfaces component Predicted radiation Measured radiation
75
30
50
20
25
10
0
Radiation (kW/m2)
Radiation component (%)
100
0 0
100
200
300
400
500
600
700
Time (s)
(a) Pt source component Surfaces component Predicted radiation Measured radiation
75
20
15
50
10
25
5
0
Radiation (kW/m2)
Radiation component (%)
100
0 0
100
200
300
400
500
600
700
Time (s)
(b) Fig. 10. Submodel radiation components: (a) centre pan P5a/R1; (b) centre pan P5a/R2. At a radial distance between pan fire and radiation measurement location of 600 mm for the centre pan P5a/R1 situation shown in Fig. 10a, the radiation from the pan fire peaks at approximately 95 % of the total, with the balance from the compartment surfaces. As the pan fire heat output decays, the balance of radiation between fire and surfaces changes, as the two approach equality. For the situation where the heat flux target is now a radial distance of 900 mm away from the pan fire, the proportion of radiation from the pan fire has reduced to a peak of approximately 85 %, as shown in Fig. 10b. During the decay phase of the pan fire, the proportion of surface radiation increases to be greater than that from the fire. 1367
Ignition Experiments A full summary of the experimental results for the ignition criterion methodology is contained in a paper by Baker et al. [19], covering both the auto and piloted ignition modes. For the typical scenario being simulated by the theoretical radiation and ignition submodel, the auto ignition mode is considered the most relevant – however, the FTP protocol applies only to piloted ignition data. Therefore Baker et al. developed an empirical auto ignition approximation, to accommodate this ignition mode in the submodel, based on the , FTPpilot FTP approach. As noted previously, for piloted ignition data, a trend line is fitted to determine q cr and the FTP index n. The first feature of the empirical auto ignition approximation was to assume that at some incident heat flux value, the auto and piloted time-to-ignition will coincide, i.e. tig(auto) = tig(pilot). For the foam-padding-fabric composite testing reported by Baker et al., this was estimated to be q 120 kW/m2. The minimum heat flux at which ignition occurred in the auto ignition Cone Calorimeter
, which equates to the heat flux value halfway testing was then used to determine the value for qmin between the lowest heat flux values where ignition does and does not occur. Based on research published in the literature [28–30], the critical incident heat flux for the auto ignition mode was estimated to be (auto) = 0.87 × q min (auto) = 22 kW/m2 [19], which in turn gives an equation of a form corresponding qcr to Eq. 7, and for the FTP index n = 1, such that: FTPauto / tig 22 qauto
(10)
Plotting q vs. 1/tig , as shown in Fig. 11, yields the FTPauto value of 427 kW·s/m2 from Eq. 10. Equation 7 is also plotted for the horizontal piloted ignition case.
Fig. 11. Empirical auto ignition approximation and piloted ignition (adapted from [19]). For the secondary object experiments, the empirical auto ignition approximation is used in the submodel to predict when ignition of the foam-padding-fabric specimens would occur, based on Eq. 8. A comparison of the ignition data measured at location R1 and the submodel prediction is tabulated in Table 1. Table 1. Actual and predicted ignition times. Fuel pan location P1 P2 P3 P4 P5a P5b
1368
Actual (s) NI NI NI NI 90 86 NI - No ignition
Submodel (s) NI NI NI NI 94 102
900
45
800
40
700
35
600
30
500
25
400
20
300
15
200
10
100
5
0
Radiation (kW/m2)
FTP (kWs/m2)
The empirical auto ignition approximation calculation procedure in the submodel is illustrated in Fig. 12a for the centre fuel pan/heat flux measurement combination P5a/R1.
0 0
50
100
FTP Increment Cumulative FTP FTPauto tig(actual) Predicted radiation Measured radiation
150
Time (s)
900
45
800
40
700
35
600
30
500
25
400
20
300
15
200
10
100
5
0
0 0
50
100
Radiation (kW/m2)
FTP (kWs/m2)
(a)
FTP Increment Cumulative FTP FTPpilot Predicted radiation Measured radiation
150
Time (s)
(b) Fig. 12. FTP ignition calculation for P5a/R1: (a) auto ignition; (b) piloted ignition. As soon as the incident flux calculated by the submodel qi („Predicted radiation‟ in Fig. 10) exceeds (auto) = 22 kW/m2 at approximately t = 40 s in Fig. 12a, then the FTP starts incrementally qcr accumulating (depicted by the broken line in Fig 12a „FTP increment‟) in accordance with Eq. 8. For each then FTP continues to grow in magnitude, as shown by the solid black time step that qi is greater than qcr line „Cumulative FTP‟ in Fig. 12a. When the accumulating FTP value reaches the threshold of FTPauto = 427 kWs/m2, then the secondary object is predicted by the submodel to have ignited in the auto ignition mode, which is shown by the intersection of „Cumulative FTP‟ and „FTPauto‟ at approximately t = 94 s. For the case of the centre pan P5a/R1 experiment, the measured value for time-to-auto-ignition is in very good agreement at t = 90 s (depicted by the vertical dashed line „tig(actual)‟ in Fig. 12a) with the submodel prediction. Although the piloted ignition mode was not a variable in the fuel pan experiments reported herein, it is of interest to also note the comparison between the auto and piloted ignition predictions of the submodel. Figure 12b depicts an equivalent comparison for centre pan P5a/R1, but for the piloted ignition situation. (pilot) reported by Baker et al. [19] is 9.5 kW/m2. Therefore at The corresponding value for qcr , then the „Cumulative FTP‟ starts approximately t = 15 s when the „Predicted radiation‟ values exceeds qcr building up until at approximately t = 60 s, the „FTPpilot‟ value of 481 kWs/m2 is exceeded and piloted ignition is deemed to have occurred. So even though the FTP threshold is higher for the piloted ignition value means that ignition occurs mode than the auto ignition mode, i.e. 481 vs. 427 kWs/m2, the lower qcr sooner for the piloted ignition mode than might be expected. For the second radiation measuring location, i.e. centre pan P5a/R2, auto ignition did not occur during the experiment. With reference to the ISO Room layout for the pan fires shown in Fig. 5b, R2 is 900 mm away from the centre of the pan, compared to 600 mm for R1. It can be seen from the radiation values shown in Fig. 8b that the radiation did not exceed approximately 18 kW/m2 at any point during the experiment.
1369
600
24
500
20
400
16
300
12
200
8
100
4
0
Radiation (kW/m2)
FTP (kWs/m2)
(auto) was not exceeded at any stage, the FTPauto value was zero throughout. Again in a similar Because qcr vein to Fig. 12b, Fig. 13 shows the piloted ignition situation for centre pan P5a/R2.
FTP Increment Cumulative FTP FTPpilot Predicted radiation Measured radiation
0 0
50
100
150
200
Time (s)
Fig. 13. FTP piloted ignition calculation for centre pan P5a/R2. Even though auto ignition does not occur for the centre pan P5a/R2 combination, it can be seen in Fig. 13 that the submodel predicts piloted ignition will occur at approximately t = 130 s when the „Cumulative FTP‟ curve intersects with the „FTPpilot‟ horizontal line. At the right hand end of the solid „Cumulative (pilot) value of 9.5 kW/m2 FTP‟ line, the curve plateaus at the point when the radiation drops below the qcr at approximately t = 170 s, as the radiation decays. DISCUSSION AND CONCLUSIONS Compartment Radiation While the flame radiation experiments were free-burning, the experiments to validate the radiation and ignition algorithms of the submodel were conducted in an enclosure. The initial series of radiation experiments were conducted using a propane burner. Referring to Fig. 7a–f, the results of these experiments, while promising, could not be described as being definitive. Compartment fires are a complex mixed radiative-convective environment, with convection occurring due to the turbulence created by entrainment and plume buoyancy, as well as natural convection at the wall surfaces, etc. The long duration of the propane burner experiments meant that there was likely to be a reasonable amount of convective cooling occurring. HFMs are total heat flux meters, which measure the combined effect of radiation and convection. Due to their orientation, the HFM in location R1 would be more susceptible to convective cooling. This is borne out by the results depicted in Fig. 7a, c and e, where the HFM recordings are below the submodel values. Conversely, the HFM readings for Fig. 7b, d and f are greater than the predicted submodel values. Another issue for the propane burner experiments was the fact that propane is a clean-burning fuel which only produced a very thin and transparent hot upper layer during the testing. The submodel is actually formulated on the basis of a dense upper layer, the underside of which is modelled as an isothermal radiating surface. The submodel would therefore be expected to over-predict the radiation, having the additional component from the upper layer surface, but the actual results are inconsistent in this regard. A second series of compartment experiments has therefore carried out which tried to replicate more accurately the submodel calculation procedures. The petrol pan fire experiments produced a dense black upper layer which was a realistic representation of the upper layer radiation procedure in the submodel. A comparison between the heat output graphs depicted in Fig. 6a (burner) and Fig. 6b (fuel pan) suggests that convection will have less of an impact for the fuel pan experiments, which in turn gives confidence in the comparison between the submodel predictions and HFM measurements. The results of the second series of compartment radiation experiments generally showed a good match between the theoretical predictions of the submodel and the actual experimental measurements. The pan fire series of experiments also demonstrated a very good match between Gardon and SchmidtBoelter HFMs in Fig. 9, indicating that it is possible to use the two types of device interchangeably. 1370
Ignition Although only a small amount of time-to-auto-ignition data was generated during the pan fire experiments, the measured values compared well with the corresponding combined radiation/ignition predictions of the submodel, with the submodel over-predicting the time-to-auto-ignition by 4–16 % compared to the actual experimental measurements (refer to data in Table 1). As described in the introductory section to this paper, the purpose of the radiation and ignition submodel is to predict the ignition of secondary objects in compartment fire scenarios as part of a probabilistic design fire simulation tool. The level of agreement, between the theoretical predictions of the submodel and experimental measurements, described in this paper is appropriate, i.e. within 20 %, for the degree of accuracy inherent in a zone model such as BRANZFIRE. It can therefore be concluded that the radiation and ignition submodel described in this paper is suitable for the purpose of predicting radiant ignition in the probabilistic design fire tool. ACKNOWLEDGEMENTS This research is funded by the New Zealand government Foundation for Research, Science and Technology and the BRANZ Group. REFERENCES [1]
Olenick, S.M., and Carpenter, D.J., (2003) An Updated International Survey of Computer Models for Fire and Smoke, Journal of Fire Protection Engineering 13(2): 87-110, http://dx.doi.org/10.1177/1042391503013002001.
[2]
Vose, D., Risk Analysis - A Quantitative Guide, (2nd ed.), John Wiley and Sons, Chichester, UK, 2000.
[3]
Ramachandran, G., “Stochastic Models of Fire Growth,” The SFPE Handbook of Fire Protection Engineering (4th ed.), DiNenno P.J. et al. (eds.), National Fire Protection Association (NFPA), Quincy, MA, USA, 2008, pp. 3-397 to 3-417.
[4]
Walton, W.D., Carpenter, D.J., and Wood, C.B., “Zone Computer Fire Models for Enclosures,” The SFPE Handbook of Fire Protection Engineering (4th ed.), DiNenno P.J. et al. (eds.), NFPA, Quincy, MA, USA, 2008, pp. 3-222 to 3-228.
[5]
Baker, G.B. and Wade, C.A., “Development of probabilistic design and analysis tools for performance-based fire safety engineering,” Proceedings of 2009 International Symposium on Fire Science and Fire-Protection Engineering, China Fire Protection Association, Beijing, China, 2009, pp. 37-49.
[6]
Wade, C.A., “BRANZFIRE Technical Reference Guide”, BRANZ Ltd Study Report No. 92, Porirua, New Zealand, 2004.
[7]
Wade, C.A., “A User‟s Guide to BRANZFIRE 2004”, BRANZ Ltd, Porirua, New Zealand, 2004.
[8]
Robbins, A., Wade, C., and Baker, G., “Characterising Fire Scenarios Based on New Zealand Fire Incident Data,” Proceedings 8th International Conference on Performance-Based Codes and Safety Design Methods, Society of Fire Protection Engineers, Bethesda, MD, USA, 2010. pp. 225236.
[9]
Babrauskas, V., “Heat Release Rate,” The SFPE Handbook of Fire Protection Engineering (4th ed.), DiNenno P.J. et al. (eds.), NFPA, Quincy, MA, USA, 2008, pp. 3-1 to 3-59.
[10]
Siegel, R., and Howell, J.R., Thermal Radiation Heat Transfer (4th ed.), Taylor and Francis, New York, NY, USA, 2002.
[11]
Tien, C.L., Lee, K.Y., and Stretton, A.J., “Radiation Heat Transfer,” The SFPE Handbook of Fire Protection Engineering (4th ed.), DiNenno P.J. et al. (eds.), NFPA, Quincy, MA, USA, 2008, pp. 1-74 to 1-90.
[12]
Incropera, F.P., and De Witt, D.P., Fundamentals of Heat and Mass Transfer (3 rd ed.), John Wiley and Sons, New York, NY, USA, 1990. 1371
[13]
Fleury, R., “Evaluation of Thermal Radiation Models for Fire Spread Between Objects,” University of Canterbury Masters of Engineering in Fire Engineering Thesis, Christchurch, New Zealand, 2010.
[14]
Modak, A.T., (1977) Thermal Radiation from Pool Fires, Combustion and Flame 29: 177-192, http://dx.doi.org/10.1016/0010-2180(77)90106-7
[15]
Beyler, C.L., “Fire Hazard Calculations for Large, Open Hydrocarbon Fires,” The SFPE Handbook of Fire Protection Engineering (4th ed.), DiNenno P.J. et al. (eds.), NFPA, Quincy, MA, USA, 2008, pp. 3-271 to 3-319.
[16]
Heskestad, G., “Fire Plumes, Flame Height, and Air Entrainment,” The SFPE Handbook of Fire Protection Engineering (4th ed.), DiNenno P.J. et al. (eds.) NFPA, Quincy, MA, USA, 2008, pp. 21 to 2-20.
[17]
Baker, G., Spearpoint, M., Fleischmann, C., and Wade, C., “Development of a Radiative Fire Spread Submodel for an Enhanced Zone Model,” Proceedings 8th Asia-Oceania Symposium on Fire Science and Technology (in press), International Association for Fire Safety Science, 2010.
[18]
Forney, G.P., “Computing Radiative Heat Transfer Occurring in a Zone Fire Model,” National Institute of Standards and Technology Report NISTIR 4709, Gaithersburg, MD, USA, 1991.
[19]
Baker, G.B., Spearpoint, M.J., Fleischmann, C.M., and Wade, C.A., (2010) Selecting an Ignition Criterion Methodology for Use in a Radiative Fire Spread Submodel, Fire and Materials, http://dx.doi.org/10.1002/fam.1059
[20]
Smith, E.E., and Satija, S., (1983) Release Rate Model for Developing Fires, Journal of Heat Transfer 105(2): 281-287, http://dx.doi.org/10.1115/1.3245575.
[21]
Smith, E.E., and Green, T.J., “Release Rates for a Mathematical Model,” Mathematical Modelling of Fires, Mehaffey, J.R. (ed.), American Society of Testing and Materials SPT 983, Philadelphia, PA, USA, 1988, pp. 7-20.
[22]
Toal, B.R., Silcock, G.W.H., and Shields, T.J., (1989) An Examination of Piloted Ignition Characteristics of Cellulosic Materials Using the ISO Ignitability Test, Fire and Materials 14: 97106, http://dx.doi.org/10.1002/fam.810140304
[23]
Shields, T.J., Silcock, G.W., and Murray, J.J., (1993) The Effect of Geometry and Ignition Mode on Ignition times Obtained Using the Cone Calorimeter and ISO Ignitability Test, Fire and Materials 17: 25-32, http://dx.doi.org/10.1002/fam.810170105
[24]
Shields, T.J., Silcock, G.W., and Murray, J.J., (1994) Evaluating Ignition Data Using the Flux Time Product, Fire and Materials 18: 243-254, http://dx.doi.org/10.1002/fam.810180407
[25]
AS/NZS 3837:1998, Method of Test for Heat and Smoke Release Rates for Materials and Products Using an Oxygen Consumption Calorimeter, Standards Australia/Standards New Zealand, Homebush, New South Wales, Australia and Wellington, New Zealand, 1998.
[26]
ISO 9705:1993, Fire Tests – Full-Scale Room Test for Surface Products, International Organisation for Standardisation, Geneva, Switzerland, 1993.
[27]
Ingason, U., and Wickström, U., (2007) Measuring Incident Radiant Heat Flux Using the Plate Thermometer. Fire Safety Journal 42(2):161-166, http://dx.doi.org/10.1016/j.firesaf.2006.08.008
[28]
Chen, F.F., “Radiant Ignition of New Zealand Upholstered Furniture Composites,” University of Canterbury Masters of Engineering in Fire Engineering Project Report, Christchurch, New Zealand, 2001.
[29]
Babrauskas, V., Ignition Handbook. Fire Science Publishers, Issaquah, WA, USA, 2003.
[30]
Babrauskas, V., and Krasny, J.F., “Fire Behavior of Upholstered Furniture,” National Bureau of Standards Monograph 173, Gaithersburg, MD, USA, 1985.
1372