International Journal of Fuzzy Systems, Vol. 9, No. 3, September 2007
143
Predicting Ocean Salinity and Temperature Variations Using Data Mining and Fuzzy Inference Yo-Ping Huang, Li-Jen Kao, and Frode-Eika Sandnes Abstract Global ocean salinity/temperature variations are attracting increasing attention, due to their influence on ocean-atmospheric changes and their potential for improved climate forecasting. The goal is to analyze historic salinity/temperature data to make predictions about future variations. Traditional statistical models that assume data independence are not applicable as ocean data are often inter-related. Association rules mining can be used to find interesting salinity and temperature patterns, however, the traditional method ignores spatial and temporal information in the data. This study proposes a strategy that employs inter-transaction association rules mining to discover salinity/temperature patterns where spatial/temporal relationships are considered. Next, a fuzzy inference is used to predict salinity/temperature variations. The fuzzy inference rules are derived from a set of inter-transaction association rules that are discovered from Argo data. The strategy is highly efficient as a reduced prefix-projected itemset algorithm with a small space and time complexity is employed in the search for large inter-transaction itemsets. This proposed strategy is unsupervised as it does not rely on domain experts for designing the fuzzy rule base. Experimental results demonstrate that the proposed strategy effectively predicts abnormal salinity/ temperature variations. Keywords: fuzzy inter-transaction association rule mining, spatial-temporal data mining, fuzzy inference, climate change.
1. Introduction Global climate changes are attracting increasing attention. Ocean density-driven circulation plays a key role in redistributing heat, and can dramatically affect the climate. One example is EI Nino. Seawater density is Corresponding Author: Prof. Yo-Ping Huang is with the Department of Computer Science and Engineering, Tatung University, 40 Chungshan North Road, 3rd Sec., Taipei, Taiwan 10451. E-mail:
[email protected] Manuscript received 8 Aug. 2007; revised 20 Sep. 2007; accepted 28 Sep. 2007.
determined by its salinity and temperature. Knowledge about the variations in salinity and temperature may help us understand ocean circulation and its role to climate change. This can be achieved by discovering interesting salinity and temperature patterns and then subsequently using these to predict future abnormal salinity/temperature events. Traditional event prediction is similar to time series prediction, which has been studied extensively within the field of statistics [4]. An alternative approach is to convert ocean data into market-basket type transactions and then apply association rules mining techniques to discover interesting associations. However, both of these strategies have shortcomings. Time-series prediction assumes statistical data independence while ocean data are often inter-related. Furthermore, time-series prediction usually relies on domain expert intervention. Association rule based prediction is not dependent on a domain expert, however, only salinity/temperature variations that occur simultaneously are considered. In practice it is necessary to reveal the associations among variations that occur at different times or at different places such that the associations can be applied to disaster prediction. Tung et al. proposed efficient algorithms for finding such rules [2]. In [2] a sliding window is applied to the multi-dimensional transaction database to reduce the search space and hence form mega-transactions. The first objective of this study is to establish a scheme that can discover the relationships among salinity and temperature variations that occur at different times and places. Ocean data are quantitative and must first be discretized. Inter-transaction association rules are extracted using a time sliding window spanning multiple transactions to form mega-transactions. The number of items increases with the introduction of fuzzy attributes and inter-transactions in the search for frequent inter-itemsets [5]. Therefore, a reduced prefix-projected itemsets method based on the PrefixSpan algorithm [7] is used to minimize the computational complexity. The second objective is to propose a fuzzy inference model that infers future abnormal salinity and temperature variations. The fuzzy inter-transaction association rules are used to construct a fuzzy rule base. Since the fuzzy rules are derived from inter-transaction association rules, the inference results contain salinity/temperature anomalies together with their
© 2007 TFSA
144
International Journal of Fuzzy Systems, Vol. 9, No. 3, September 2007
respective time and location information. The experimental results show that the proposed model is effective though the fuzzy rule base is not designed by domain experts. The remaining parts of this paper are organized as follows. In section II the problems at hand are summarized and related work is introduced. In section III the proposed algorithm is described and section IV provides experimental evidence. Section V concludes the paper.
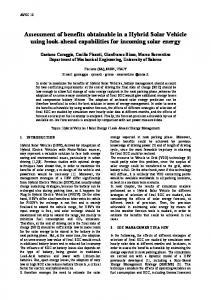
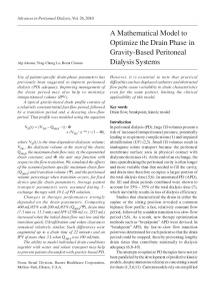
2. Problem Definition The goal of this study is to find the ocean salinity and temperature relations in the waters surrounding Taiwan. The data for our analysis is coming from Argo – a global array of 3,000 free-drifting profiling floats that measures the temperature and salinity of the upper 2000 m of the ocean [11]. Mining salinity and temperature patterns is a difficult task due to the spatio-temporal nature of the data [12], even there is a vast literature on how to extract spatial and temporal patterns from scientific data [13-19]. This section discusses the challenges involved in preprocessing and analyzing the data. Necessary definitions are also provided. 2.1 Transactions in Argo data Association rule mining algorithms assume that a finite set of disjoint transactions are given as input to the algorithms [9], [20]. However, there may not be an explicit finite set of transactions in a spatial data set. This study adopts the strategy proposed in [9], where the spatial transaction is defined around the instances of a special reference feature. Taipei is chosen as the reference site and concentric circles are used to define neighboring regions of the reference site. Fig. 1 shows this reference centric model. The concentric circles are also used to annotate the location of the abnormal events. The sub-areas defined by the concentric circles represent different distances and directions to the reference site. For example, sub-area A2 implies that it is in the east-northeast direction and far from Taiwan, and sub-area A1 is in the east-northeast direction and close to Taiwan. Thus, the location context information for abnormal variations is maintained. Fig. 2 shows how the set of all the abnormal variations within the concentric circles is treated as a single transaction. Table 1 lists some of the transaction data derived from Argo measurements. Each transaction is recorded with its spatial/temporal information. The transaction that is transformed from Fig. 2 has transaction ID 2001/01 in Table 2.
2.2 Quantitative attributes Many algorithms for mining binary association rules have been proposed in the past [3], [6], [7]. However, the attributes in most businesses or scientific databases are quantitative, with attributes such as age and income. Srikant et al. proposed an algorithm for finding the quantitative association rules by partitioning the continuous attribute domain, and then transforming the partitioned attributes into a binary representation [8]. The attribute partitioning method results in a sharp boundary problem. However, this problem can be overcome by applying fuzzy set theory in which an element can belong to a set with a membership degree in the range [0, 1]. In [1], each quantitative attribute is mapped to a value that is determined by the membership function associated with each fuzzy set. 2.3 Inter-transaction association rules In classical association rules mining, records in a transactional database contain only items and are identified by their transaction IDs. Although transactions occur under certain contexts such as time, place, etc., such contextual information is discarded. In this study the goal is to determine rules such as “if area A salinity anomaly rises little, then area B temperature anomaly will rise from little in the next month.” Here, salinity/temperature variations associated with different locations and transaction days are revealed, that is, the rule associates itemsets among different transactions. These are called inter-transaction association rules. In this section, fundamental definitions are introduced. Definition 1. Let I = {i1 , i2 ,..., ik } be a set of items. Let D be a dimensional attribute and Dom(D) be the domain of D. A transaction database is a database containing records in the form (d, Ij), where d ∈ Dom(D) and I j ⊂ I . We call this type of database a 1-dimensional database. The dimensional attribute usually describes the item time or place. An inter-transaction association rule that spans p intervals is found if an association exists between items that are p intervals apart. Since an inter-transaction association rule may cover many intervals, finding all such rules is time-consuming. In order to minimize the effort involved in mining uninteresting rules, a sliding window denoted by w is introduced. When mining inter-transaction association rules, only the rules spanning shorter than or equal to w intervals are considered. The sliding window is thus used to avoid mining rules that span many consecutive intervals [10]. Each sliding window forms a mega-transaction. A mega-transaction M that is contained within W can be
Y.-P. Huang, et al.: Predicting Ocean Salinity and Temperature Variations Using Data Mining and Fuzzy Inference
described as follows: M = {ik ( j ) | ik ∈ W [ j ];1 ≤ k ≤ u ,0 ≤ j ≤ w − 1}, where W is a sliding window with w intervals and u is the number of items in I = {i1 , i2 ,..., iu }. To distinguish the items in a mega-transaction from traditional transaction items, the mega-transaction items are called extended items. The set of all possible extended items are denoted I′. Given I and w, then: I ′ = {i1 (0),..., i1 ( w − 1), i2 (0),..., i2 ( w − 1),..., iu (0),..., iu ( w − 1)}. The following is the definition of an inter-transaction association rule. Definition 2. An inter-transaction itemset is a set of extended items B ⊆ I ′ such that ∃ik ∈ B,1 ≤ k ≤ u. Definition 3. An inter-transaction association rule has the form X ⇒ Y, where 1. X ⊆ I ′, Y ⊆ I ′. 2. ∃ik (0) ∈ X ,1 ≤ k ≤ u. 3. ∃ik ( j ) ∈ Y ,1 ≤ k ≤ u , j ≠ 0. 4. X ∩ Y = {}. Definition 4. Let MTxy be the set of mega-transactions that contains a set of extended items X ∪ Y and MTx be the set of mega-transactions that contains X. Let S be the number of transactions in the transaction database. Then, the support and confidence of an inter-transaction association rule X ⇒ Y can be defined as: Txy Txy sup port = , . confidence = S Tx As with intra-association rules mining algorithms, a minimum support, minsup, and a minimum confidence, minconf, are given and the task is to discover the inter-transaction association rules from the transaction database with support and confidence greater than or equal to the minimum requirements.
2.4 Mining frequent itemsets by prefix rojections Pei et al. [7] employed a projection scheme in the PrefixSpan algorithm where the transactions were projected into overlapping sets called projected databases such that all the transactions in each set had the same prefix that corresponded to a frequent sequence (itemset). The main idea behind PrefixSpan is that, instead of projecting sequence databases by considering all the possible occurrences of frequent subsequences, the projection is based only on frequent prefixes. This holds, because any frequent subsequence can always be found by growing a frequent prefix.
145
Similar principles can be applied to the inter-transaction association rules mining task discussed herein. By using the example database in Table 3, with a minimum support count of 2, the PrefixSpan algorithm first scans the database to find the frequent 1-itemset, i.e., , , , , and . Next, the algorithm generates the projected database for each frequent 1-itemset. For instance, Table 4 shows the projected database of . For this projected database, the PrefixSpan algorithm continues the discovery of frequent 1-itemsets to form the frequent 2-itemsets with prefix . In this way, the PrefixSpan algorithm recursively generates the projected database for each frequent k-itemset to find frequent (k+1)-itemsets. 2.5 Fuzzy inference Fuzzy inference is the process of formulating the mapping from a given input to an output using fuzzy logic. The mapping then provides a basis from which decisions can be made, or patterns discerned. The process of fuzzy inference involves three steps: (1) fuzzification, (2) inference from fuzzy rules, and (3) defuzzification. First, a set of fuzzy rules needs to be found. One approach is to generate the fuzzy rules by learning from the data [21], [22]. In this study, the fuzzy rule base is derived from the discovered inter-transaction association rules. This is a new method of generating fuzzy rules by learning from the data.
3. The Mining and Fuzzy Inference Strategies Mining fuzzy inter-transaction association rules from a 1-dimensional database can be divided into three steps: quantitative attribute transformation, the discovery of frequent inter-transaction itemsets, and association rule generation. (1) Quantitative attribute transformation: The first step is to map each quantitative attribute into its fuzzy intervals. Let I = {i1 , i2 ,..., ik } be the set of all items that belongs to the original database. For the sake of simplicity, the database is assumed to only have one quantitative attribute, i j ,1 ≤ j ≤ k . If ij is mapped to l fuzzy intervals, then the new set of all items If becomes {i1 , i2 ,..., i( j ,1) , i( j , 2 ) ,..., i( j , l ) , i j +1 ,..., ik }, where ir, r ≠ j, is a binary attribute and i(j, 1), i(j, 2), …, i(j, l) are fuzzy attributes that are transformed from quantitative attribute ij. (2) The discovery of frequent inter-transaction itemsets: Let If be the new set of all items that is defined from the previous phase and W be a sliding window with w intervals along the dimensional attribute. A mega-transaction M contained within W can now be redefined as:
146
International Journal of Fuzzy Systems, Vol. 9, No. 3, September 2007
M = {i (t ) | i ∈ W [t ]}, i could be a binary attribute or a fuzzy attribute and 0 ≤ t ≤ w − 1. The set of all possible extended items is then redefined as: I ′f = {i1(0), …, i1(w - 1), i2(0), …, i2(w – 1), …, i(j,
projected database with respect to prefix i( j ,1) (0) , then
i( j , 2) (0) needs to be deleted. (ii) The item i(t) where i(0) does not appear in L1. The reason is that if i(0) is not a frequent 1-itemset, then i(1), i(2), …, i(w-1) will not be frequent 1-itemsets either. (0), …, i (w 1), …, i (0), …, i (w – 1), i (0), …, 1) (j, 1) (j, l) (j, l) j+1 Following these steps, the improved PrefixSpan ij+1(w – 1), …, ik(0), …, ik(w – 1)}. Furthermore, an inter-transaction k-itemset is the set algorithm recursively generates the reduced projected B ⊆ I ′f such that at least one binary attribute database for each frequent k-itemset to find the frequent (k+1)-itemsets. ir (0) ,r = 1, 2, ..., k and r ≠ j , or one fuzzy attribute (3) Generate the association rules: The generation of i( j , q ) (0), q = 1,2,..., l exists in B. Since the fuzzy attribute inter-transaction association rules is similar to the transformations and inter-transactions results in more generation of classic association rules. The calculation of data, the algorithm employs a reduced prefix-projected rule confidence is shown in Definition 4. To design a fuzzy inference model, one needs to itemsets method based on the PrefixSpan algorithm to expedite the efficient search for the frequent itemsets, define its inputs and outputs. A total of 5 inputs are used instead of using the widely used Apriori algorithm which to infer the abnormal salinity/temperature events and their spatial/temporal relationships. These include: is more resource demanding. (1) The salinity event represents what kind of The following is a more detailed description of how abnormal salinity event that occurs. Fig. 3 shows the frequent itemsets are generated. Step 1: Discover the frequent 1-itemset L1. The membership functions for salinity events. These are candidate set C1 of 1-itemsets should be I ′f , the set of SDM (salinity dropping much), SDL (salinity dropping little), SNOR (no salinity event), SRL (salinity rising all possible extended items. The mega-transactions can little) and SRM (salinity rising much). be scanned to determine whether a special item (2) The temperature event represents what kind of i (t ),0 ≤ t ≤ w − 1, exists and determine whether it is a abnormal temperature event that occurs. Fig. 4 shows the frequent 1-itemset. However, it is not necessary to do so. membership functions for temperature events. These are Since each inter-transaction frequent itemset will contain TDM (temperature dropping much), TDL (temperature at least one i(0), only item i(0) needs to be checked. In dropping little), TNOR (no temperature event), TRL other words, the search space is reduced and the (temperature rising little) and TRM (temperature rising corresponding time and space complexity are also much). reduced. Therefore, the count of i(0) is increased by 1, if (3) The radius represents the distance to the event in it is a binary attribute, otherwise its membership degree the reference centric model. Fig. 5 shows the is increased, if it is a fuzzy attribute. Therefore, L1 can membership functions for the distance. These are be found simply by one scan through the short-distance, medium-distance and long-distance. mega-transactions. (4) Angle represents the direction of the event in the Step 2: Divide the search space and build the reference centric model. Fig. 6 shows the membership projected databases. The projected databases are built by functions for angle. These are angle1, angle2, angle3, partitioning the complete set of itemset into subsets angle4, angle5, angle6, angle7 and angle8. according to the corresponding prefixes in L1. (5) Time represents the time of the event. Fig. 7 Step 3: Reduce the size of the projected databases. shows the membership functions for time. These are For the projected databases, the PrefixSpan algorithm short-term, medium-term and long-term. continues the discovery of frequent 1-itemsets to form Output and input variables are identical. That is, the the frequent 2-itemsets with prefix . However, strategy can infer when, where and what kind of event some items in the projected database can be pruned that will occur based on the known input events. before obtaining frequent 1-itemsets by PrefixSpan. The Then, according to input and output variables, a set following items can be deleted from the projected of inter-transaction association rules is selected to database: generate a fuzzy rule base. For example, the (i) The fuzzy item i( j ,l ) (t ) where the source inter-transaction association rule “A1SDL(0) -> quantitative attribute is the same as its prefix. For B1SDL(1)“ is selected to transform to fuzzy rule such as example, ij is a quantitative attribute and it is “SDL TNOR angle1 short-distance short-term -> SDL transformed into two fuzzy attributes, i( j ,1) and i( j , 2) . If TNOR angle2 short-distance short-term”. This rule’s meaning is “if a salinity dropping little event happens, no i( j ,1) (0) is a prefix and i( j , 2) (0) is shown in the
Y.-P. Huang, et al.: Predicting Ocean Salinity and Temperature Variations Using Data Mining and Fuzzy Inference
temperature event happens, the distance is near Taipei, the direction is at angle1 and the time is short-term, then a salinity-dropping-little event will occur, no temperature event will occur, the distance will be near Taipei, the direction will be at angle2 and the time will be short-term.”
4. Experimental Results The experimental salinity/temperature data used in this study were taken from the Argo delayed-mode database that can be downloaded from Oceanographically Products in Japan. The monthly salinity/temperature images were collected from the period of January 2001 to December 2005. We put concentric circles on each map and then treat all the abnormal events that occur inside the concentric circles on each map as a transaction. The radii for the inner and outer circles are 380km and 760km, respectively. Concentric circles allow the location context information such as direction and distance to the reference site of Taipei to be maintained. In case no special events occurred in a sub-area then it is denoted a NOR event. After the quantitative attributes in Table 2 are mapped to several fuzzy intervals, the PreFixSpan algorithm is employed to find large inter-itemsets (the maxspan window size is set to 6 months and the minimum support is set to 25%). Then the fuzzy inter-transaction association rules can be derived from large itemsets as the minimum confidence is set to 70%. Table 5 shows some of the inter-transaction association rules. The next step is to design the fuzzy inference model. Assume that the fuzzy rule has the form “if the salinity event is A1, the temperature event is A2, distance is A3, angle is A4 and time is A5 then the salinity event is A1, the temperature event is A2, distance is A3, angle is A4 and time is A5.” A1, A2, A3, A4 and A5 are fuzzy sets that characterize the salinity event, the temperature event, distance, angle and time, respectively. Table 6 shows the fuzzy rule base. The Argo 2006 maps are used as test data. For example, taking the data from January 2006, “the salinity event is dropping 0.05psu, the temperature is rising 0.4 ℃, distance is 340km, and angle is 315°” as inputs, after fuzzification, inference process and defuzzification, one can get the inference result “the salinity will drop 0.05psu, the temperature event will rise 0.4℃, distance is 340km, and angle is 315° two months later.” After checking the Argo data map of April 2006, one can find the inference result is correct. Table 7 shows the fuzzification result of above example. Table 8 shows the fuzzy rules that will be triggered by the inputs of above example.
147
5. Conclusions A fuzzy inference based strategy for predicting ocean salinity and temperature variations is proposed. The fuzzy rule base is not designed by domain experts but derived from discovered inter-transaction association rules. First, a method is proposed for discovering fuzzy inter-transaction association rules that require less resource than the traditional Apriori algorithm. Secondly, a fuzzy inference model is designed. Since the fuzzy rule contains the salinity/temperature variations that are associated with their spatial and temporal information, the inference results allow the prediction of when, where and what event will occur. The experiment also shows that the fuzzy inference model has a prediction accuracy of 79%. Satisfactory results can therefore be achieved without domain experts. Future work includes incorporating ocean depth. It is hoped that this research can allow people to better understand ocean climate changes.
Acknowledgments This work is supported by National Science Council, Taiwan, R.O.C. under Grants NSC95-2745-E-036001-URD and NSC95-2745-E-036-002-URD. The research data were collected and made freely available by the International Argo Project and the national programs that contribute to it. (http://www.argo.ucsd.edu, http://argo.jcommops.org). Argo is a pilot program of the Global Ocean Observing System.
References [1] A. Gyenesei, “A fuzzy approach for mining quantitative association rules,” Acta Cybernetica, vol. 15, no.2, pp. 305-320, Dec. 2001. [2] A.K.H. Tung, H. Lu, J. Han and L. Feng, “Efficient mining of intertransaction association rules,” IEEE Trans. on Knowledge and Data Engineering, vol. 15, no. 1, pp. 43-56, Jan./Feb. 2003. [3] A. Savasere, E. Omiecinski and S. Navathe, “An efficient algorithm for mining association rules in large databases,” in Proc. Int. Conf. Very Large Data Bases, Zurich, Switzerland, pp. 432-444, Sept. 1995. [4] C. Berberidis, L. Angelis and I. Vlahavas, “Inter-transaction association rules Mining for rare events prediction,” in Proc. 3rd Hellenic Conf. on Artificial Intelligence, Samos, Greece, pp. 308-317, May 2004. [5] H. Lu, J. Han, and L. Feng, “Stock movement and n-dimensional intertransaction association rules,” in Proc. SIGMOD Workshop Research Issues on Data
148
International Journal of Fuzzy Systems, Vol. 9, No. 3, September 2007
Mining and Knowledge Discovery, Seattle, WA, U.S.A., vol. 12, pp. 1-7, June 1998. [6] J.S. Park, M.S. Chen, and P.S. Yu, “An effective hash-based algorithm for mining association rules,” in Proc. ACM SIGMOD Int. Conf. Management of Data, San Jose, CA, U.S.A., pp. 175-186, May 1995. [7] J. Pei, J. Han, B. Mortazavi-Asl, H. Pinto, Q. Chen, U. Dayal and M.C. Hsu, “PrefixSpan: Mining sequential patterns eficiently by prefix-projected pattern growth,” in Proc. Int. Conf. Data Engineering, Heidelberg, Germany, pp. 215-224, April 2001. [8] R. Srikant and R. Agrawal, “Mining quantitative association rules in large relation tables,” in Proc. of ACM SIGMOD Int. Conf. Management of Data, Montreal, Quebec, Canada, pp. 1-12, June 1996. [9] S. Shekhar and Y. Huang, “Discovering spatial co-location patterns: a summary of results,” in Proc. of 7th Int. Symp. on Spatial and Temporal Databases, L.A., CA, U.S.A., pp. 236-256, July 2001. [10] Y.-P. Huang, L.-J. Kao and F.E. Sandnes, “Using minimum bounding cube to discover valuable salinity/temperature patterns from ocean science data,” in Proc. IEEE SMC, Taipei, Taiwan, pp. 478-483, Oct. 2006. [11] Japan Argo Delayed-mode Data. available at http://w3.jamstec.go.jp/J-ARGO/index_e.html [12] P. Tan, M. Steinbach, V. Kumar, C. Potter, S. Klooster and A. Torregrosa, “Finding spatio-temporal patterns in earth science data,” in Proc. SIGMOD KDD Workshop on Temporal Data Mining, San Francisco, CA, U.S.A., pp. 1-12, Aug. 2001. [13] C.C. Yu and Y.L. Chen, “Mining sequential patterns from multidimensional sequence data,” IEEE Trans. on Knowledge and Data Engineering, vol. 17, no. 1, pp. 136-140, Jan. 2005. [14] J.F. Roddick and M. Spiliopoulou, “A survey of temporal knowledge discovery paradigms and methods,” IEEE Trans. on Knowledge and Data Engineering, vol. 14, no. 4, pp. 750-767, Jul./Aug. 2002. [15] J.S. Yoo and S. Shekhar, “A join-less approach for mining spatial colocation patterns,” IEEE Trans. on Knowledge and Data Engineering, vol. 18, no. 10, pp. 1323-1337, Oct. 2006. [16] J. Wang and J. Han, “BIDE: efficient mining of frequent closed sequences,” in Proc. Int. Conf. Data Engineering, Boston, MA, U.S.A., pp. 79-90, Mar. 2004. [17] Q. Ding, Q. Ding and W. Perrizo, “Association rule mining on remotely sensed image using p-trees,” in
Proc. Pacific-Asia Conf. on Advances in Knowledge Discovery and Data Mining, Taipei, Taiwan, pp. 66-79, May 2002. [18] R.T. Ng and J. Han, “CLARANS: a method for clustering objects for spatial data mining,” IEEE Trans. on Knowledge and Data Engineering, vol. 14, no. 5, pp. 1003-1016, Sept./Oct. 2002. [19] S. Shekhar and S. Chawla, Spatial Databases: A Tour, Prentice Hall, NJ, USA, 2002. [20] Y. Huang, S. Shekhar and H. Xiong, “Discovering co-location patterns from spatial datasets: a general approach,” IEEE Trans. on Knowledge and Data Engineering, vol. 16, no. 12, pp. 1472-1485, Dec. 2004. [21] C.H. Chang and S.M. Chen, “A new method to generate fuzzy rules from numerical data based on the exclusion of attribute terms,” in Proc. Int. Computer Symposium: Workshop on Artificial Intelligence, Chiayi, Taiwan, pp. 57-64, Dec. 2000. [22] Y.-P. Huang, Y.-H. Huang and F.E. Sandnes, “A fuzzy inference model-based non-reassuring fetal status monitoring system,” Int. Journal of Fuzzy Systems, vol. 8, no. 1, pp. 57-64, March 2006.
Figure 1. The reference model with concentric circles surrounding Taipei, Taiwan. The radii for inner and outer circles are 380km and 760km, respectively. The sub-areas represent different directions and distances to Taipei, Taiwan.
Y.-P. Huang, et al.: Predicting Ocean Salinity and Temperature Variations Using Data Mining and Fuzzy Inference
149
Figure 2. All the abnormal variations (events) that occurred inside the concentric circles are treated as one transaction. These data were collected and made freely available by the International Argo Project and the national programmes that contribute to it. (http://www.argo.ucsd.edu, http://argo.jcommops.org). Argo is a pilot programme of the Global Ocean Observing System.
Figure 6. Membership functions for angle.
Figure 3. Membership functions for salinity anomaly.
Figure 7. Membership functions for time. Table 1. Data with a quantitative attribute “abnormal salinity variation” and “abnormal temperature variation”. Date abnormal abnormal abnormal abnormal … salinity temperature salinity temperature variation variation in variation variation in in A1 A1 (℃) in A2 A2 (℃) (psu) (psu) 2001/01 -0.05 0.4 -0.05 0.4 … 2001/02 -0.1 0.4 -0.1 0.4 … 2001/03 0 0 0 0 … … … … … … … Figure 4. Membership functions for temperature anomaly.
Figure 5. Membership functions for distance.
Table 2. The “abnormal salinity variation” and “abnormal temperature variation” mapping results from Table 1. Date abnormal abnormal abnormal abnormal … salinity temperature salinity temperature variation variation in variation variation in in A1 A1 in A2 A2 2001/01 SDL TRL SDL TRL … 2001/02 SDL TRL SDL TRL … 2001/03 NOR NOR NOR NOR … … … … … … … Table 3. An example of an inter-transaction database. Transaction ID Transactions M1 {a(0), b(0), e(0), g(0), c(2), f(2), i(2)} M2 {c(0), f(0), i(0), a(3), e(3), d(3), h(3)} M3 {a(0), e(0), d(0),h(0), a(3),e(3), d(3)} M4 {a(0), e(0), d(0), b(2), c(2),f(2)} M5 {b(0), c(0), f(0)} Table 4. The projected database with prefix , and . Prefix Projected (postfix) database {b(0), e(0), g(0), c(2), f(2), i(2)} {e(0), d(0), h(0), a(3), e(3), d(3)} {e(0), d(0), b(2), c(2), f(2)}
150
International Journal of Fuzzy Systems, Vol. 9, No. 3, September 2007
{e(0), g(0), c(2), f(2), i(2)} {c(0), f(0)} {f(0), i(0), a(3), e(3), d(3), h(3)} {f(0)} … … Table 5. Partially discovered inter-transaction association rules. 2-item rules A2SRL(0) -> A2SRL(1) A2SRL(0) -> A2SRL(2) A2SRL(0) -> A1SRL(0) A2SRL(0) -> B1SRL(0) A2SRL(0) -> G2SRL(0) A2SRL(0) -> G1SRL(0) A2SRL(0) -> H2SRL(0) A2SRL(0) -> H2SRL(1) A2SRL(0) -> H2SRL(2) A2SRL(0) -> H1SRL(0) … 3-item rules A2SRL(0) and G2SRL(0) -> G1SRL(0) A2SRL(0) and G2SRL(0) -> H2SRL(0) A2SRL(0) and G2SRL(0) -> H1SRL(0) A2SRL(0) and H2SRL(0) -> G2SRL(0) A2SRL(0) and H2SRL(0) -> G1SRL(0) A2SRL(0) and H2SRL(0) -> H1SRL(0) A2SRL(3) and B1TNOR(0) -> H2SRL(3) A2SRL(3) and B1TNOR(0) -> H1SRL(3) A2SRL(3) and F2TNOR(0) -> H2SRL(5) … … … Table 6. The fuzzy rule base (total 72 rules). SDL SDL SRL SRL SRL SRL SRL SRL SRL SRL SRL SRL SRL SRL SRL SRL SRL SRL SRL SRL SRL SRL SRL SRL SRL SRL SRL SRL SRL SRL SRL SRL
TNOR TRL TNOR TNOR TNOR TNOR TNOR TNOR TNOR TNOR TNOR TNOR TNOR TNOR TNOR TNOR TNOR TNOR TNOR TNOR TNOR TNOR TNOR TNOR TNOR TNOR TNOR TNOR TNOR TNOR TNOR TNOR
angle1 angle1 angle1 angle1 angle1 angle1 angle1 angle1 angle1 angle1 angle1 angle1 angle6 angle6 angle6 angle6 angle6 angle6 angle6 angle6 angle6 angle7 angle7 angle7 angle7 angle7 angle7 angle8 angle8 angle8 angle8 angle8
long-distance short-distance short-distance long-distance long-distance long-distance long-distance long-distance long-distance long-distance long-distance long-distance long-distance long-distance long-distance long-distance long-distance long-distance long-distance long-distance long-distance short-distance long-distance long-distance long-distance long-distance long-distance short-distance short-distance short-distance long-distance long-distance
short-term short-term short-term short-term short-term short-term short-term short-term short-term short-term short-term short-term short-term short-term short-term short-term short-term short-term short-term short-term short-term short-term short-term short-term short-term short-term short-term short-term short-term short-term short-term short-term
-> -> -> -> -> -> -> -> -> -> -> -> -> -> -> -> -> -> -> -> -> -> -> -> -> -> -> -> -> -> -> ->
SDL SDL SRL SRL SRL SRL SRL SRL SRL SRL SRL SRL SRL SRL SRL SRL SRL SRL SRL SRL SRL SRL SRL SRL SRL SRL SRL SRL SRL SRL SRL SRL
TNOR TRL TNOR TNOR TNOR TNOR TNOR TNOR TNOR TNOR TNOR TNOR TNOR TNOR TNOR TNOR TNOR TNOR TNOR TNOR TNOR TNOR TNOR TNOR TNOR TNOR TNOR TNOR TNOR TNOR TNOR TNOR
SRL SRL SRL SRL SRL SRL SRL SRL SRL SRL SRL SRL SRL SRL SRL SRL SRL SRL SRL SRL SRL SRL SRL SRL SRL TRL SDL SDL SDL SDL SDL SDL SDL SDL SDL SDL SDL SDL SDL SDL
TNOR TNOR TNOR TNOR TNOR TNOR TNOR TRL TRL TRL TRL TRL TRL TRL TRL TRL TRL TRL TRL TRL TRL TRL TRL TRL TRL SNOR TRL TRL TRL TRL TRL TRL TRL TRL TRL TRL TRL TRL TRL TRL
angle8 angle8 angle8 angle8 angle8 angle8 angle8 angle1 angle2 angle2 angle2 angle2 angle2 angle6 angle6 angle7 angle7 angle7 angle7 angle7 angle7 angle7 angle8 angle8 angle8 angle1 angle7 angle7 angle7 angle7 angle7 angle7 angle8 angle8 angle8 angle8 angle8 angle8 angle8 angle8
long-distance long-distance long-distance long-distance long-distance long-distance long-distance short-distance short-distance medium-distance short-distance medium-distance short-distance long-distance medium-distance short-distance medium-distance short-distance short-distance short-distance long-distance long-distance short-distance short-distance short-distance short-distance long-distance long-distance long-distance short-distance short-distance short-distance long-distance long-distance long-distance long-distance short-distance short-distance short-distance short-distance
short-term short-term short-term short-term short-term short-term short-term short-term short-term short-term short-term short-term short-term short-term short-term short-term short-term short-term short-term short-term short-term short-term short-term short-term short-term short-term short-term short-term short-term short-term short-term short-term short-term short-term short-term short-term short-term short-term short-term short-term
-> -> -> -> -> -> -> -> -> -> -> -> -> -> -> -> -> -> -> -> -> -> -> -> -> -> -> -> -> -> -> -> -> -> -> -> -> -> -> ->
SRL SRL SRL SRL SRL TRL TRL SRL SRL SRL SRL SRL SRL SRL SRL SRL SRL SRL SRL SRL SRL SRL SRL SRL SRL TRL SDL SDL SDL SDL SDL SDL SDL SDL SDL SDL SDL SDL SDL SDL
TNOR TNOR TRL TRL TRL SNOR SNOR TRL TRL TRL TRL TRL TRL TRL TRL TRL TRL TRL TRL TRL TRL TRL TRL TRL TRL SNOR TRL TRL TRL TRL TRL TRL TRL TRL TRL TRL TRL TRL TRL TRL
Table 7. The fuzzification result while using data of January 2006 as inference inputs. 1. Temperature rising 0.4℃. The membership degree for TRL is 0.6, and for TNOR is 0.4. 2. Salinity dropping 0.05psu. The membership degree for SDL is 0.6, and for SNOR is 0.4. 3. Angle 315. The membership degree for angle7 is 0.5, and for angle 8 is 0.5. 4. Distance 340 km. The membership degree for mediumdistance is 1, and 0 for any other fuzzy sets. 5. The temperature and salinity event occurred in January 2006. The membership degree for short-term is 1, and 0 for any other fuzzy sets. Table 8. The fuzzy rules are triggered while using data of January 2006 as inference inputs. SDL SDL SDL SDL SDL SDL SDL SDL SDL SDL
TRL TRL TRL TRL TRL TRL TRL TRL TRL TRL
angle7 angle7 angle7 angle7 angle7 angle7 angle8 angle8 angle8 angle8
long-distance long-distance long-distance short-distance short-distance short-distance long-distance long-distance long-distance long-distance
short-term short-term short-term short-term short-term short-term short-term short-term short-term short-term
-> -> -> -> -> -> -> -> -> ->
SDL SDL SDL SDL SDL SDL SDL SDL SDL SDL
TRL TRL TRL TRL TRL TRL TRL TRL TRL TRL
Y.-P. Huang, et al.: Predicting Ocean Salinity and Temperature Variations Using Data Mining and Fuzzy Inference
SDL SDL SDL SDL
TRL TRL TRL TRL
angle8 angle8 angle8 angle8
short-distance short-distance short-distance short-distance
short-term short-term short-term short-term
-> -> -> ->
SDL SDL SDL SDL
TRL TRL TRL TRL
Yo-Ping Huang received his B.S. and M.S. degrees in electrical engineering from Tatung University, Taipei, Taiwan, in 1983 and 1985, respectively and Ph.D. in electrical engineering from Texas Tech University, Lubbock, TX, U.S.A., in 1992. He is currently a Professor in the Department of Computer Science and Engineering at Tatung University, Taipei, Taiwan. His research interests include data mining, fuzzy modeling, information retrieval, and application systems design for handheld devices. He is a senior member of the IEEE, associate editor of the International Journal of Fuzzy Systems, and editor of the Journal of the Chinese Grey System Association. Li-Jen Kao is currently a Ph.D. candidate of Department of Computer Science and Engineering at Tatung University, Taipei, Taiwan. His research interests include spatial-temporal data mining and fuzzy modeling. He is currently an instructor of Taipei College of Maritime Technology, Taipei, Taiwan. Frode Eika Sandnes received a B.S. in computing science from the University of Newcastle Upon Tyne, England in 1993 and a Ph.D. in computer science from the University of Reading, England in 1997. He has several years of experience from the space industry developing communications and onboard systems for low-earth orbit environmental satellites. He is currently a Professor in the Department of Computer Science at Oslo University College, Norway. Dr. Sandnes’ research interests include multiprocessor scheduling, artificial intelligence and mobile human computer interaction.
151