Capturing the Aquatic Ecosystem Service Value of Water Quality Improvement and 5
Biodiversity Conservation: Defining Water Challenges and Correcting the Biases in Valuation Approach DISSERTATION
10
to attain the academic degree of Doctor of Natural Science (Dr.rer.nat.) of the Bayreuth Graduate School of Mathematical and Natural Sciences (BayNAT), University of Bayreuth Presented by
Ik-Chang Choi 15
born 06 July, 1975 in Gangnueng, Republic of Korea
Bayreuth, March 2018
This doctoral thesis was prepared at the department of Plant Ecology, University of Bayreuth 20
from April 2012 until April 2018 and was supervised by PD Dr. Trung Thanh Nguyen, Prof. Dr. Hio-Jung Shin, and Prof. Dr. John Tenhunen. This is a full reprint of the dissertation submitted to obtain the academic degree of Doctor of Natural Sciences (Dr. rer. nat.) and approved by the Bayreuth Graduate School of Mathematical and Natural Sciences (BayNAT) of the University of Bayreuth.
25
Date of submission: 27.04.2018 Date of defense: 23.10.2018
30
Acting director: Prof. Dr. Dirk Schüler 35
Doctoral committee: PD. Dr. Trung Thanh Nguyen (reviewer) Prof. Dr. Thomas Köllner (reviewer) Prof. Dr. Stefan Peiffer (chairman) 40
Prof. Dr. Mario Larch
i
Summary Human beings derive various benefits from water ecosystems and services. Sustainable provision of various kinds of water ecosystem services remains a challenge due to several 45
reasons, especially due to climate change and intensification of agricultural activities. In addition, tradeoffs in ecosystem services also arise and thus need to be considered. Without taking into account these issues, water ecosystem services are very likely to be reduced and subsequently hinder further improvement in human welfare. The conservation and improvement in water ecosystems and water services generate
50
considerable economic values in terms of open access to recreation and amenity, enhancement of biodiversity, water quality and water supply. Along with the growing importance of water ecosystem services, various water management policies have been developed in order to counteract the growing demands for limited water resources. However, many outdated and inefficient or insufficient water policies result in failure of providing
55
improved water ecosystem services, consequently causing a loss in social welfare. The specific objectives of this thesis are, therefore, 1) to review the evolution of contemporary policies of managing water ecosystem services and their challenges as well as discussing the drivers of water policy changes and providing recommendations on the formulation of new management policy on water ecosystem services; 2) to elicit households’
60
willingness of pay (WTP) for the land use restriction policy of enhancing water ecosystems and services with respect to aquatic biodiversity conservation and water quality improvement from the dichotomous choice (DC) contingent valuation (CV) method; 3) to examine and correct biases such as anchoring, shift, yea-saying and endogenous effects in DCCV data; 4) to estimate those total benefits based on the cost-benefit (CB) analysis along with eliciting the
65
WTP.
ii
In the second chapter, an opinion on state-of-the-art of changes and reforms of water policies as well as the challenges along with their policy implications for sustainable management of water ecosystem services in South Korea was provided. To meet new challenges for sustainable water ecosystem services management which are continuously 70
emerging in parallel with changes in ecosystems generated by physical, environmental and socio-economic challenges, two ideas: (i) provider-gets-principle (payment for ecosystem services) of sharing costs and benefits derived from the policy; and (ii) full-cost natural resource pricing-principle internalizing environmental externalities caused by the intensive use of the ecosystems were provided in this chapter.
75
In the third chapter, the WTP for a land use restriction policy in the Han River basin was examined using the double-bounded (DB) DCCV method which estimates benefits from the policy of improving water quality and ecosystem services. It also provided a robust way for the improvement of precision in estimating values of ecosystem services by controlling shift, anchoring, and yea-saying effects in the DBDC format. After correcting those biases,
80
the statistical precision of parameter estimates was improved. The estimated welfare gains were on average South Korean currency (KRW) 2,861 per month per household. The derived total benefits (KRW 297.73) of the policy were much greater than the total costs (KRW129.44 billion). In the fourth chapter of this thesis, the WTP of households for the water ecosystem
85
health (biodiversity) improvement was estimated using the single-bounded (SB) DCCV method. This chapter extended the CV literature by dealing with the endogenous effect of a proxy variable as another potential bias of the CV method, namely the subjective experience of negative environmental quality changes. As a result, the correction for the endogeneity bias facilitated the efficiency of parameter estimation in the WTP model. The mean WTP per
90
household accounted for around 46.8% (KRW 79.6) of the current water use charge (KRW iii
170 per cubic meter). The total benefit from conserving the biodiversity was around KRW 198.62 billion. In this thesis, along with the review of management policies on ecosystem services, their challenges and recommendations on the formulation of new policy the statistically 95
improved and reliable WTP in the SB- and DBDC format for improvement of water ecosystem services is estimated by correcting biases in the CV method. Based on the empirical results of correcting the biases presented in the CV data and total benefits derived from the CB analysis along with the WTP estimate, the statistical precision of parameter estimates was improved. Since the total benefits were also considerable, the land use policy
100
may significantly contribute to the improvement in water quality, biodiversity and ecosystem services.
iv
Zusammenfassung Menschen ziehen Nutzen aus aquatisches Ö kosystem und Wasserdienstleistungen. 105
Nachhaltige Bereitstellung von verschiedenen Arten von Ö kosystemleistungen des Wassers bleibt eine Herausforderung aus verschiedenen Gründen, insbesondere wegen des Klimawandels und wegen landwirtschaftlicher Intensivierung. Außerdem kommen die Tradeoffs zwischen Ö kosystemleistungen vor und damit müssen sie berücksichtigt werden. Ohne Berücksichtigung dieser Themen sind Ö kosystemleistungen des Wassers mit hoher
110
Wahrscheinlichkeit reduziert und in der Folge hindern sie weitere Verbesserung menschlicher Wohlfahrt. Beide Kommunikation und Verbesserung von aquatischem Ö kosystem bzw. der Wasserdienstleistungen generieren erheblichen wirtschaftlichen Nutzen in Bezug auf freien Zugang zur Erholung und Einrichtung, Steigerung der Biodiversität, Wasserqualität und
115
Wasserversorgung. Neben zunehmender Bedeutung von Ö kosystemleistungen des Wassers wurden verscheidende Wasserwirtschaftspolitiken entwickelt um wachsende Nachfragen nach beschränkten Wasserressourcen zu entgegenwirken. Allerdings führen überholte, uneffiziente, oder unzureichende Wasserwirtschaftspolitiken zu Ausfall von der Versorgung der verbesserten Ö kosystemleistungen des Wassers und in der Folge verursachen sie sozialen
120
Wohlfahrtsverlust. Konkrete Ziele von dieser Arbeit werden deshalb verfolgt 1) um Entwicklung von gegenwärtigen Wasserwirtschaftspolitiken und derer Herausforderungen zu überprüfen sowie Diskutieren der Treiber des Wandels von Wasserwirtschaftspolitiken und Empfehlungen zur Formulierung
125
neuer
Wasserwirtschaftsmanagementpolitik
zu
geben
2)
um
Zahlungsbereitschaft von Haushalten (WTP) für gesetzliche Nutzungsbeschränkung des Verbesserns von Ö kosystemtleistungen Wassers zu entlocken bezüglich aquatischer v
Biodiversitätskommunikation und Wasserqualitätsverbesserung von dichotomous choice (DC) contingent valuation (CV) Methode 3) um Neigungen wie verankernde, sich verschiebende, yea-saying und endogene Auswirkungen auf DCCV Daten zu untersuchen bzw. zu 130
korrigieren 4) um gesamte Nutzen auf der Basis von der Kosten-Nutzen Analyse (CB) zu schätzen neben dem Entlocken von WTP. Im zweiten Kapitel wird Folgendes gezeigt – Stellungsnahme aktueller Auswirkungen bzw. der Reform von Wasserwirtschaftspolitik sowie Herausforderungen neben politische Auswirkungen auf nachhaltigen Management der Ö kosystemleistungen Wassers in Südkorea.
135
Um
neue
Herausforderungen
des
stetig
auftauchende
nachhaltige
Ö kosystemleistungsmanagement Wassers zu begegnen, parallel zu Veränderungen von Ö kosystemen generiert von physisch, umweltpolitisch, sozioökonomische Herausforderungen, zwei Ideen: (1) Anbieter-Verdient-Prinzip (Zahlung für Ö kosystemleistungen) gesetzlicher Kosten- bzw. Nutzenteilung und (2) Vollkosten Rohstoffen Preis-Prinzip mit der Zielsetzung 140
auf Internalisierung umweltschädlicher Externalitäten, die durch intensive Nutzung von Ö kosystemen verursacht wurden, sind in disem Kapitel diskutiert. Im dritten Kapitel, sind WTP für die gesetzliche Nutzungsbeschränkung von Wasserbecken an Han River, unter Verwendung der double-bounded (DB) DCCV Methode, die Vorteile von der Wasserqualitätsverbesserungs- bzw. Ö kosystemleistungspolitik
145
kalkuliert. Sie bietet auch robuste Weise für die Verbesserung der Genauigkeit von Schätzung der Values von Ö kosystemleistungen beim verankernde, sich verschiebende, yea-saying und endogene Auswirkungen in DBDC format kontrollieren. Nachdem diese Biases korregiert sind, ist
statistische
Genauigkeit
von Parameterschätzung verbessert.
Geschätzter
Wohlfahrtsgewinn waren in der Höhe 2,861 Südkoreanische Währung (KRW) pro Monat per 150
Haushalt im Durchschnitt. Gesamte Nutzen (KRW 297.73) von der Politik waren wesentlich höher als Gesamtaufwand ( KRW 129.44 Milliarde). vi
In viertem Kapital von dieser Arbeit, sind die WTP von Haushalten für das Ö kosystem Wassers Gesundheits- ( bzw. Biodiversitäts-)verbesserung geschätzt, unter Verwendung der Single-bounded (SB) DCCV Methode. Dieser Kapitel erweitert CV Literatur 155
mit endogener Auswirkung auf Nährungsvariable als andere potenzielles Bias von CV Methode, sogennante subjektive Ergebnissen von negativer Veränderung der Umweltqualität. Infolgedessen,
ermöglicht
Korrektur
des
Endogenitätsbias
die
Effizienz
von
Parameterschätzung im WTP Modell. Mittelwert von WTP per Haushalt beträt ca. 46.8% (KRW 79.6) von derzeitigen Wasserverbrauchskosten (KRW 170 per Kubikmeter). 160
Gesamtkosten von Erhaltung der Biodiversität war ca. KRW 198.62 Milliarde. In dieser Arbeit, neben der Ü berprüfung von Wasserwirtschaftspolitiken, ihrer Herausforderungen und Empfehlungen zur Formulierung neuer Politik sind statistisch verbessert und zuverlässige WTP in the SB- und DBDC format, für Verbesserung der Ö kosystemleistungen Wassers, sind geschätzt durch Korrigierung der Baises von CV
165
Methode. Aufgrund von empirischer Nachweise über die Korrigierung der Biases, die in CV Daten präsentierten und von gesamtem Nutzen von CB Analyse neben der WTP Schätzung, ist statistische Genauigkeit von Parameterschätzung verbessert. Da gesamte Nutzen auch erheblich
ist,
kann
die
Landnutzungspolitik
vielleicht
wesentlich
Wasserqualitätsverbesserung, Biodiversität und Ö kosystemleistungen.
170
vii
beitragen
zu
Acknowledgements This study was carried out as part of the International Research Training Group TERRECO: Complex Terrain and Ecological Heterogeneity (GRK 1565/1), funded by the German 175
Research Foundation (DFG) at the University of Bayreuth (Germany) and the Korean Research Foundation (KRF) at the Kangwon National University (Republic of Korea). I sincerely thank my supervision committee for their genericity and guidance throughout this study: Prof. Dr. John Tenhunen, for offering me an opening to joining TERRECO; PD. Dr. Trung Thanh Nguyen, as my supervisor, for leading me through the whole study; Prof. Dr.
180
Hio-Jung Shin, for always encouraging me to do my best. They are good listeners and great mentors of my life. Without their support I could not have done this study. I would like to thank Dr. Hyun No Kim for spending much time agonizing over challenges of this study together and sharing his experiences which help in addressing them. I also wish to thank my friends and colleagues from TERRECO. I am lucky to have those
185
nice people in my life. I will never forget them. Lastly, I am grateful to my family: my wife Ji-Hee and two lovely sons Seong-Ho, Hyeon-Woo and my mom Hyeok-Mae and parents in law Wan-Geun, Myeong-Sik and my five sisters and brother in law and his wife. Their endurance, sacrifices, and unstinting support could lead me up to here. I love you all so much.
viii
190
Table of contents Summary ................................................................................................................................ iii Zusammenfassung ................................................................................................................. vi Acknowledgements ................................................................................................................ ix Table of contents .................................................................................................................... x
195
Abbreviations ...................................................................................................................... xiv List of figures ........................................................................................................................ xv List of tables......................................................................................................................... xvi List of individual contributions.......................................................................................... xvii Chapter 1 Synopsis ..................................................................................................................1
200
1.1 Problem statement and research motivation .................................................................................... 1 1.2 Research conceptual framework ...................................................................................................... 7 1.2.1 Concept of payment for ecosystem services (PES) .................................................................. 7 1.2.2 Overview of impact of policy change on ecosystem services................................................. 10 1.3 Research methodology ................................................................................................................... 11
205
1.3.1 Research area .......................................................................................................................... 11 1.3.2 Valuation of ecosystem services ............................................................................................. 14 Total economic value framework including use and non-use values............................................. 14 Contingent Valuation Method for Valuing Ecosystem Services .................................................... 16 1.3.3 Research object ....................................................................................................................... 18
210
1.4 Research main outputs ................................................................................................................... 19 1.4.1 Paper 1: Water Policy Reforms in South Korea: A Historical Review and Ongoing Challenges for Sustainable Water Governance and Management .......................................................................... 19
215
1.4.2 Paper 2: Willingness to Pay for a Highland Agricultural Restriction Policy to Improve Water Quality in South Korea: Correcting Anomalous Preference in Contingent Valuation Method ................................................................................................................................................. 20 1.4.3 Paper 3: Economic Valuation of the Aquatic Biodiversity Conservation in South Korea: Correcting for the Endogenety Bias in Contingent Valuation ............................................................. 21 1.5 Discussion ...................................................................................................................................... 22
ix
1.6 Conclusion and policy implication................................................................................................. 29 220
1.7 References ....................................................................................................................................... 31
Chapter 2 Water Policy Reforms in South Korea: A Historical Review and Ongoing Challenges for Sustainable Water Governance and Management ......................................40 2.1 Introduction
................................................................................................................................. 41
2.2 Characteristics of Water Resources in South Korea....................................................................... 43 225
2.2.1 Physical Characteristics........................................................................................................... 43 2.2.2 Socio-Economic Characteristics.............................................................................................. 47 2.2.3 Environmental Characteristics................................................................................................. 49 2.3 Water Policy Reforms in South Korea........................................................................................... 50 2.3.1 The Japanese Colonial Period (1910 to 1945) ........................................................................ 52
230
2.3.2 The Postwar Recovery Period (1945 to 1959)......................................................................... 52 2.3.3 Modern River Basin Governance System Development (1960 to 1990)................................ 53 2.3.4 Comprehensive Management of Water Resources: Environment-Friendly River Basin Development (1990 to Present) ........................................................................................................... 54 2.4 Challenges for Water Policy in South Korea.................................................................................. 59
235
2.4.1 Environmental and Physical Challenges ................................................................................. 60 2.4.1.1 Damage to Water Quality and Ecosystems of River Basins........................................... 60 2.4.1.2 Regional Water Use Conflict.......................................................................................... 61 2.4.2 Socio-Economic Challenges.................................................................................................... 63 2.4.2.1 Rapid Rise in Water Use as Economic Growth ............................................................. 63
240
2.4.2.2 Inadequate Water Pricing Mechanism............................................................................ 64 2.5 Concluding Remarks....................................................................................................................... 68 2.6 Acknowledgements......................................................................................................................... 70 2.7 References ....................................................................................................................................... 70
x
245
Chapter 3 Willingness to Pay for a Highland Agricultural Restriction Policy to Improve Water Quality in South Korea: Correcting Anomalous Preference in Contingent Valuation Method ............................................................................................................................76 3.1 Introduction
................................................................................................................................. 77
3.2 Methodology................................................................................................................................... 81 250
3.3 Study Area, Survey Design and Administration............................................................................. 88 3.3.1 Study area ............................................................................................................................... 88 3.3.2 Survey Design and Administration.......................................................................................... 91 3.4 Results and Discussion................................................................................................................... 93 3.4.1 Profile of Surveyed Households.............................................................................................. 93
255
3.4.2 Correcting the Potential Preference Anomalies and Willingness to Pay................................. 95 3.5 Benefit Calculations........................................................................................................................ 99 3.6 Conclusions and Policy Implication............................................................................................. 102 3.7 Acknowledgements....................................................................................................................... 104 3.8 References...................................................................................................................................... 104
260
3.9 Appendix........................................................................................................................................ 111 3.9.1 Water consumers questionnaire I........................................................................................... 111 3.9.2 Water consumers questionnaire II (Korean)........................................................................... 123
Chapter 4 Economic Valuation of the Aquatic Biodiversity Conservation in South Korea: Correcting for the Endogeneity Bias in Contingent Valuation............................................134 265
4.1 Introduction .................................................................................................................................. 135 4.2 The Paldang Lake Case Study...................................................................................................... 138 4.3 Methodology................................................................................................................................. 142 4.3.1 Measuring Welfare Change with Contingent Valuation Method Section............................. 142 4.3.2 Contingent Valuation Scenarios and Target Population........................................................ 144
270
4.3.3 Survey Design and Administration ....................................................................................... 146 4.3.4 Data Analysis. ....................................................................................................................... 147 4.4 Result and Discussioin.................................................................................................................. 151
xi
4.4.1 Profile of the Surveyed Households...................................................................................... 151 4.4.2 Correcting the Endogeneity Bias and Identifying the Determinants of WTP....................... 152 275
4.4.3 Willingness to Pay and Benefit Calculation.......................................................................... 157 4.5 Conclusions and Policy Implications............................................................................................ 160 4.6 Acknowledgements....................................................................................................................... 163 4.7 References...................................................................................................................................... 163 4.8 Appendix........................................................................................................................................ 170
280
4.8.1 Water consumers questionnaire I........................................................................................... 170 4.8.2 Water consumers questionnaire II (Korean)........................................................................... 180
(Eidesstattliche) Versicherungen und Erklärungen.........................................................189
xii
Abbreviations 285
290
295
MA
Millennium Ecosystem Assessment
DEFRA
Department for Environment, Food and Rural Affairs
MOLIT
Ministry of Land, Infrastructure and Transportation of Korea
OECD
Organization for Economic Co-operation and Development
SMG
Seoul Metropolitan Government
WTP
Willingness to Pay
TEV
Total Economic Values
RP
Revealed Preference
SP
Stated Preference
CVM
Contingent Valuation Method
SB
Single Bounded
DB
Double Bounded
DC
Dichotomous Choice
KRW
South Korean currency
xiii
300
List of figures Figure 1. 1 Conceptual framework of PES schemes.............................................................................. 9 Figure 1. 2 Overview of impact pathway of policy change on ecosystems and their services............ 11 Figure 1. 3 Research area considered in this thesis.............................................................................. 12 Figure 1. 4 Total economic value approach......................................................................................... 14
305
Figure 2. 1 The four major river basins in South Korea...................................................................... 44 Figure 2. 2 Utilization of water resources in South Korea. All the values are estimates from a 2007 base year............................................................................................................................................... 46
310
Figure 2. 3 Trends in normal GDP and total amount of water use. Total amount of using water in 2011 is a value estimated by the Ministry of Land, Infrastructure, and Transportation based on current water consumption trends................................................................................................................................ 48 Figure 2. 4 Population changes in rural and urban areas in South Korea. Urban areas are cities which have the population of more than 50,000. The Seoul metropolitan area includes Seoul city, Incheon city, and Gyeonggi province................................................................................................................ 48
315
Figure 2. 5 Change in water quality per year and change in water quality of 2012 between up‐ and downstream areas of the four major river basins.................................................................................. 50 Figure 2. 6 South Korea’s water policy reforms and their implications for future water policy making.................................................................................................................................................. 59
320
Figure 2. 7 The proportion of water supply (percentage of the population who has running water), recovering production costs via the water utility bills, the amount of water leaking from outdated water pipe networks, and per capita daily water use of South Korea................................................... 67 Figure 3. 1 The Han River basin in South Korea, study area.............................................................. 89 Figure 3. 2 Choice probability of the consistent and inconsistent responses to the “yes” bid follow-up question................................................................................................................................................ 96 Figure 4. 1 The study area, Han River Basin in South Korea............................................................ 139
xiv
325
List of tables Table 1. 1 Valuing ecosystem services through the TEV approach..................................................... 15 Table 2. 1 Korean seasonal weather distinction (1973 to 2007) ......................................................... 45 Table 2. 2 Historical water policy changes and reforms in South Korea............................................. 50 Table 2. 3 Current status of dams in South Korea............................................................................... 61
330
Table 2. 4 Challenges and implications of Korean water policy......................................................... 67 Table 3. 1 Area, population, and land use in the Han River basin....................................................... 90 Table 3. 2 The first and second bids proposed, and proportion of acceptance in the double-bounded contingent valuation survey.................................................................................................................. 92 Table 3. 3 Profile of households surveyed in the double-bounded contingent valuation method....... 95
335
Table 3. 4 Parameter estimates of the random-effects interval-data regression models...................... 98 Table 3. 5 Total benefit of the mid- and downstream areas estimated from the land use restriction policy in the upstream areas................................................................................................................ 100 Table 3. 6 Comparison result of the benefits and costs from the highland agriculture restriction policy in the Han River basin........................................................................................................................ 101
340
Table 4. 1 Management status of the water use charge...................................................................... 140 Table 4. 2 The bids proposed and the proportion of acceptance and refusal for each bid in the contingent valuation survey................................................................................................................ 146 Table 4. 3 Descriptive statistics of variables used in the WTP (willingness to pay) model.................................................................................................................................................. 150
345
Table 4. 4 Variable Parameter estimates of the naïve probit model versus the multivariate probit model.................................................................................................................................................. 153 Table 4. 5 Values and numbers observed on the variability of the WTP derived from Model 1 and Model.................................................................................................................................................. 157
350
Table 4. 6 Total benefit of the mid- and downstream areas generated by the aquatic biodiversity conservation in the Han River basin................................................................................................... 158
xv
List of individual contributions This thesis is composed of three articles, each in a separate manuscript. The first and second manuscripts were published in the Journal Water. The third manuscript was published in the 355
Journal Sustainability.
Paper 1 (Chapter 2): Authors: Ik-Chang Choi, Hio-Jung Shin, Trung Thanh Nguyen, and John Tenhunen Title: Water Policy Reforms in South Korea: A Historical Review and Ongoing Challenges 360
for Sustainable Water Governance and Management Journal: Water (impact factor 2017: 1.832) Status: Published (2017) Own and author contribution statement: Own contribution: concept and study design 60%, data acquisition 90%, data analysis and
365
figures 90%, discussion of results 80%, manuscript writing 70% Choi, I.K., Shin, H.J., Nguyen, T.T., and Tenhunen, J designed the research; Choi, I.K. collected research data; Choi, I.K. analyzed the data and created figures and tables; Choi, I.K., Shin, H.J., Nguyen, T.T., and Tenhunen, J interpreted and discussed results; Choi, I.K. wrote the first draft of the manuscript; Choi, I.K., Shin, H.J., Nguyen, T.T., and
370
Tenhunen, J revised the manuscript.
Paper 2 (Chapter 3): Authors: Ik-Chang Choi, Hyun-No Kim, Hio-Jung Shin, John Tenhunen and Trung Thanh Nguyen 375
Title: Willingness to Pay for a Highland Agricultural Restriction Policy to Improve Water Quality in South Korea: Correcting Anomalous Preference in Contingent Valuation Method xvi
Journal: Water (impact factor 2017: 1.832) Status: Published (2016) Own and author contribution statement: 380
Own contribution: concept and study design 50%, data acquisition 50%, data analysis and model development, figures 50%, discussion of results 50%, manuscript writing 50% Choi, I.K., Kim, H.N., Shin, H.J., Tenhunen, J., and Nguyen, T.T. designed the research; Choi, I.K., and Shin, H.J. collected research data; Choi, I.K., and Kim, H.N. analyzed the data and developed model; Choi, I.K., and Shin, H.J. created figures and tables; Choi, I.K.,
385
Kim, H.N., and Shin, H.J., and and Nguyen, T.T. interpreted and discussed results; Choi, I.K., and Shin, H.J. wrote the first draft of the manuscript; Choi, I.K., Kim, H.N., Shin, H.J., Tenhunen, J., and Nguyen, T.T. revised the manuscript.
Paper 3 (Chapter 4): 390
Authors: Ik-Chang Choi, Hyun No Kim, Hio-Jung Shin, John Tenhunen and Trung Thanh Nguyen Title: Economic Valuation of the Aquatic Biodiversity Conservation in South Korea: Correcting for the Endogeneity Bias in Contingent Valuation Journal: Sustainability (impact factor 2017: 1.789)
395
Status: Published (2017) Own contribution: concept and study design 70%, data acquisition 20%, data analysis and model development 80%, figures 100%, discussion of results 80%, manuscript writing 80% Choi, I.K., Kim, H.N., Shin, H.J., Tenhunen, J., and Nguyen, T.T. designed the research;
400
Choi, I.K., Kim, H.N., Shin, H.J. collected research data; Choi, I.K., and Kim, H.N. analyzed the data and develop model; Choi, I.K., and Kim, H.N. created figures and tables; Choi, I.K., Kim, H.N., Shin, H.J., Tenhunen, J., and Nguyen, T.T. interpreted and discussed results; ; Choi, I.K. wrote the first draft of the manuscript; Choi, I.K., Kim, H.N., Shin, H.J., Tenhunen, J., and Nguyen, T.T. revised the manuscript. xvii
405
Chapter 1 Synopsis 1.1 Problem statement and research motivation The Millennium Ecosystem Assessment (MA, 2005) defines a natural ecosystem as a dynamic complex of living organisms (animals, plants and micro-organisms) and the nonliving environment interacting as a functional unit. If one part is damaged it can have an
410
impact on the whole system (MA, 2005). Human beings benefit from these various natural ecosystems and their services. The MA classified all ecosystem services into four broad categories: 1) provisioning services (obtained products from ecosystems such as food, fibre, medicines), 2) regulating services (benefits from the results of ecosystem processes such as water purification, air quality maintenance, climate regulation); 3) cultural services (non-
415
material benefits from interaction with the natural environment such as recreation, education,); 4) supporting services (functions necessary for the production of other ecosystem services from which people benefit, such as soil formation, nutrient cycling) (MA, 2005). These categories indicate that ecosystems contribute to or enhance human welfare in various ways (Pagiola et al., 2004).
420
There have been several studies on the contributions of different ecosystem services to human well-being and on the estimation of monetary values of ecosystem services. For example, Willis et al. (2003) estimated the total value of annual benefits of forests and woodlands to people in Britain such as the values of providing opportunities for open access outdoor recreation (USD 589 million) (cultural services), supporting and enhancing
425
biodiversity (USD 579 million), contributing to the visual quality of the landscape (USD 225 million) (supporting services), and carbon sequestration (USD 589 million) (regulating services). Kettunen and ten Brink (2006) examined values of restoring and improving biodiversity-related services provided by various ecosystems which have been lost or 1
degraded throughout the EU. In particular, the estimated values after restoration of the 430
ecosystem and its services modified by the construction of the Danube dam in Germany include: the annual value of restored river fisheries (USD 16 million) (providing and cultural services); value provided by restored habitat for nitrogen and phosphorous absorption (USD 112.5 million) and cycling (USD 18.2 million) (regulating and supporting services); and value of tourism resulting from restored wetland habitat (USD 16 million) (cultural services). Kim
435
et al. (2016) examined the economic impact of water quality improvement and its stabilization in irrigation water storage infrastructure in Alberta, Canada. They found that the water infrastructure supports aquatic ecosystem services such as regulating water quality (regulating services) and providing residents living around reservoirs and visitors with recreation and visual amenities (cultural services). The calculated total values generated by
440
improved and stabilized water quality are ranging from USD 321 to 404 million. Those benefits for improved human well-being and economic development derived from ecosystems have been, however, accomplished by the trade-offs. This means that the modification of ecosystems to enhance one service can come at a cost to other services (MA, 2005; Kettunen and ten Brink, 2006; Nguyen, 2015). For example, agriculture ecosystems
445
provide diverse services such as increased food, fibre or bioenergy supply and natural habitats for the flora and fauna (Costamagna and Landis, 2006, Tscharntke et al., 2005, Knoche and Lupi, 2007). However, land conversion from forests to intensive agriculture, at the same time, degrades soils and leaches a fair amount of agrochemicals into rivers. These consequently cause water pollution and a decline in the fresh water supply and recreation opportunities
450
provided by aquatic ecosystems (Tilman et al., 2002; Nguyen and Tenhunen, 2013; Shin et al., 2016). Moreover, ecosystem services are frequently neglected in planning of natural resources management. The capacity of ecosystems to provide a variety of services have been, on numerous occasions, degraded by the combination of changed natural systems and 2
insufficient management effects (Folke et al., 2004; de Groot, 2006; Petz et al., 2012). Since 455
climate change has been, in addition, modifying the temperature and precipitation systems of natural ecosystems, it has caused a shift in water balances (Kabat et al., 2004; Canadell et al., 2007). These modifications in ecosystems caused by climate change and intensive agricultural activities, therefore, have a negative influence on ecosystem services (de Groot et al., 2010; Egoh et al., 2012; Ayanu et al., 2015). Without addressing these problems the benefits from
460
ecosystems and their services to people are more likely to be reduced. It will subsequently hinder further improvement in human welfare (MA, 2005; Baumgärtner and Quaas, 2010). As one of the classical natural ecosystems, aquatic ecosystems are very important for human well-being. They provide many benefits to society in terms of water-related resources and services. Varied policies on water systems and water services have rapidly evolved in
465
response to the ever-increasing demands for finite water resources throughout many parts of the world (Barson and Poff, 2002; Vugteveen and Lenders, 2009). However, there have been still significant challenges in managing scarce water resources due to the population and economic growth (industrialization and urbanization) and the potential effects of climate change (Araral and Wang, 2013). In addition to agricultural intensification for the stable food
470
supply which leads to degraded water quality (Nguyen et al., 2014), and climate change which causes increased spatial and temporal variations in water availability (OECD, 2012a), many key policies, institutions, and laws on aquatic ecosystems are outdated and not effectively or equitably enforced (Juliet et al., 2011). Since current water governance systems fail to manage and improve essential water systems and their services and to balance
475
environmental, social, and economic concerns (Kim et al., 2007; Luan, 2010; Seppälä, 2002; Rees, 1998), there have been many calls for reforms of water policies (Quevauviller, 2014). Therefore, 1) reviewing the evolution of contemporary policies on the aquatic ecosystems, services and challenges along with their policy implications, 2) providing an overview and 3
perspective on the history of those policies and 3) discussing the drivers of changes in the 480
policies would contribute to better understand importance in a sustainable use and development of water ecosystems and services. This was the first motivation for the thesis. Aquatic ecosystems have distinctive physical features such as mobility and variability in term of quality and quantity of their services (Hanemann, 2006; Young, 2005; Young and Loomis, 2014). Given that water flows from up- to downstream areas, the use and treatment
485
of water resources in the upper streams can have consequences for users in the lower streams. Thus, the associated changes in quality and quantity of the aquatic ecosystem services are at the centre of social conflicts between countries and communities (up- versus downstream areas) (Shin et al., 2009; UNW-DPAC, 2013). In many parts of the world, the leaching of agrochemicals such as fertilizers, pesticides and sediments derived from soil erosion in
490
upstream areas under intensive highland agricultural activities have been major causes of degrading and threatening downstream ecosystem services (George et al., 2009; Mitchell et al., 2009; Stoate et al., 2009; Kroon et al., 2012; Thorburn and Wilkinson, 2013). As a result, downstream residents support stopping highland agriculture susceptible to environmental problems, while highland farmers wish to continue these activities, which are the main source
495
of their income (Choi et al., 2016; Shin et al., 2009). A policy on preventing highland agriculture causes trade-offs in ecosystem services and conflicts between stakeholders e.g. water quality and social (opportunity) costs of abandoning highland agriculture; upstream farmers and downstream residents. To equally distribute those costs incurred by the policy, which in general upstream residents bear, and benefits from ecosystem services improved
500
through the policy, which in general downstream residents gain, there should be a financing mechanism not only to compensate for highland farmers’ expected income loss, but also to effectively manage ecosystem services (OECD, 2012b).
4
The point is, the benefits generated by a water quality improvement of ecosystem services are not traded in real markets (Hanemann, 2006). For the estimation of those benefits, 505
the use of non-market valuation methods is, thus, required (Young, 2005; Young and Loomis, 2014). These methods try to elicit the monetary values of non-marketed ecosystem services by virtue of examining preferences of people for the ecosystem services (Whitehead et al., 2008) and aggregating those preferences with respect to people’s choices and trade-offs associated with decision-making processes (Daily et al., 2000). Therefore, in competition with
510
various options to manage ecosystems and their services, an individual who makes a decision will weigh the benefits against the costs of every alternative and pick the optimal choice according to his preferences (Costanza, 2000). These approaches, however, come with their particular disadvantages. In particular, the uncertain information on the good valued and the unfamiliarity with the institutional design of the non-market valuation methods using
515
hypothetical markets and scenarios confuse people. They also cause diverse strategic biases, so-called anomalous preferences. This can not only lead to inconclusive results since it is unclear whether WTP is correct or not, but also increase biases (under- or overstate) in the WTP estimate (Chien, Huang and Shaw, 2005; DeShazo, 2002; Flachaire and Hollard, 2006; Gelo and Koch, 2015; Herridges and Shogren, 1996; Whitehead, 2002). It is, thus, essential to
520
find a more robust way of estimating the values of ecosystem services by controlling strategic biases in non-market valuation approaches. This can consequently contribute to deriving further reliable monetary value of the total benefits generated by an improvement in water ecosystem services, and to providing practical solutions that would be useful for the water ecosystems management. This was the second motivation for the thesis.
525
The last motivation for the thesis was on the provision of crucial information for a better understanding of the economic value of aquatic biodiversity which can raise the awareness of significance of water ecosystems conservation. The improvement in the 5
valuation models through considering the endogeneity as another potential bias of the nonmarket valuation methods was also taken into account in the thesis. Biodiversity in natural 530
ecosystems contributes to not only providing social-economic services, but also maintaining the ecological balance of natural resources (Poufoun et al., 2016). That means that the conservation of biodiversity can contribute to improving the value of various ecosystem services (Loomis et al., 2000; Loomis and White, 1996). Since it is hard to replace the impaired value of ecosystem services (Beaumont et al., 2008) biodiversity conservation can
535
present further environmental benefits to people, especially for future generations (CollaresPereire and Cowx, 2004). Across the world, many countries have made efforts to improve aquatic ecosystem services through the biodiversity conservation. However, water quality deterioration has continuously been a prime issue of managing the services. Soil erosion from intensive agricultural fields in upstream areas and its inflow to rivers are blamed for the
540
contaminated water problem in downstream areas (Choi et al., 2016; Pagiola et al., 2004). Moreover, the lack of pragmatic policies and funds for the conservation of aquatic biodiversity has led to the repeated water contamination and accelerated loss in aquatic ecosystem services (Lee, 2012). It is obvious that the loss in ecosystem services would cause a more serious welfare loss to various communities throughout up- and downstream areas. It
545
is, in this regard, essential that biodiversity threatened by water contamination should be the first priority in the conservation and improvement of aquatic ecosystems due to its importance to social welfare (Ressurreição, Gibbons and Dentinho, 2011). Non-market valuation has been widely used in many studies of measuring people’s preferences for biodiversity conservation (Boyle and Bishop, 1987; Bulte and van Kooten,
550
1999; Carson, Wilks and Imber, 1994; Kotchen and Reiling, 1998; Loomis et al., 2000; Stevens et al., 1991). However, this method has another potential problem about proxy variables on subjective perceptions of changes in water ecosystems and their services 6
(Whitehead, 2006). The subjective perceptions may be affected by unobserved characteristics of people, which influence their WTPs. The correlation of both the proxy variable and WTP 555
with the unobserved characteristics is likely to make the coefficient of the variable biased in a WTP model. This is called the endogeneity bias which would provide inconsistent parameter estimates in WTP models (Martínez-Espiñeira and Lyssenko, 2011; Whitehead, 2006). The bias in the valuation may lead to not only the elicitation of over- or underestimated WTPs, but also to a failure to achieve policy goals of conserving water ecosystems (Ressurreição et al.,
560
2011). It is, therefore, necessary to improve the statistical exactitude of parameter estimates by correcting the endogeneity bias. This can accordingly contribute to eliciting more precise benefits from water ecosystem services improved by the policy implementation of conserving aquatic biodiversity, and providing practical policy resolutions of managing water ecosystem services.
565
The next sections of the introduction section to this thesis involve 1) a theoretical section which reviews the conceptual framework of water ecosystem services and 2) a description of methodology of the water ecosystem services valuation. Following the introduction section, main results of the papers for the thesis and an in-depth discussion are presented in three and forth sections, respectively. Finally, conclusions and policy
570
implications are provided in the last section of this thesis.
1.2 Research conceptual framework 1.2.1 Concept of payment for ecosystem services (PES) Various instruments have been developed in order to conserve the natural ecosystems 575
providing diverse services for human beings. Among them, the market-based conservation is frequently considered as an efficient instrument because it is based on the market principles 7
of optimal allocation and use of the resources (Wunder 2005; Kumar and Muradian 2009). The key of this approach is, for instance, to change behavior of farmers in upstream areas through incentives which promote their choices of more environmental-friendly land uses 580
such as direct payments for conservation on private lands or trading systems designed to compensate for damage in one place by improvements (Pagiola et al., 2004). These schemes are called as payments for ecosystem services (PES) and further emphasize the fact that incentives for farmers can raise the provision of diverse ecosystem services (Antle and Valdivia, 2006; Kinzig et al., 2011).
585
In the late 1970s, the modern history of ecosystem services first began with the utilitarian framing of beneficial ecosystem functions for increasing public interest in biodiversity conservation. In the 1990s, a number of studies using methods of estimating the economic value of ecosystem services were continuously done (de Groot, 1987; Daily, 1997; Costanza et al., 1997; Gómez-Baggethun et al., 2010). At present ecosystem services have
590
been increasingly reaching economic decision-making through the widespread promotion of market based instruments for ecosystem conservation such as PES schemes (Landell-Mills and Porras, 2002; Pagiola and Platais, 2007; Engel et al., 2008; Pagiola, 2008). This has been defined as voluntary and conditional transactions over well-defined ecosystem services between at least one supplier and one user (Wunder, 2005). Figure 1.1 indicates a framework
595
of how to incorporate ecosystem services into the economic decision-making as PES schemes in markets.
8
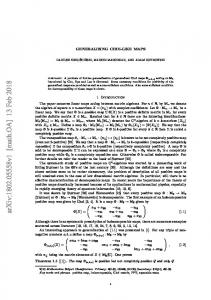
Figure 1.1 Conceptual framework of PES schemes (source: modified from Pagiola and Platais, 2007; Nguyen, 2015) 600
PES schemes have been developed as a policy combination (Landell-Mills and Porras, 2002; Pagiola et al., 2005; Engel et al., 2008; Drechsler et al., 2010) to multiply the provision of ecosystem services. Identifying and evaluating ecosystem services are necessary for implementing PES. Establishing payment mechanisms is also essential for promoting the 605
provision of those services (Elmqvist et al., 2010). In general, the land users as ecosystem service providers who carry out or sustain advisable land uses have the payments (Nguyen et al., 2013). As shown in Figure 1.1, the payments should be principally higher than the relinquished benefits of the service providers. Therefore, PES pursues to internalize an externality as the cost or benefit generated by the upstream land user’s activity that affect the
610
downstream resident who did not choose to incur that cost or benefit (Pagiola and Platais, 2007).
9
1.2.2 Overview of impact pathway of policy change on ecosystem services Economic valuation of ecosystem services contributes to better decision-making in several 615
ways by 1) highlighting more clearly the implications for human welfare and 2) ensuring that the policy assessment entirely considers the costs and benefits to the ecosystem services in markets including PES (Ahlheim, 2012). In order to understand the value of ecosystem services it is essential to characterize and quantify the relationships between ecosystems and the provision of ecosystem services,
620
and to identify the ways in which how ecosystem services have impacts on human wellbeing. A very simplified overview of an impact pathway approach which presents those relationships and ways is shown in Figure 1.2. The impact pathway reflects the types of changes that arise in the quality and quantity of ecosystem services as an effect of policy decision-making. Those changes in the value of ecosystem services between the baseline
625
option (no change) and the other policy option (change through conservation or protection) would be, in particular, evaluated in the context of cost-benefit (CB) analysis, which identifies changes in ecosystems and in the provision of ecosystem services caused by the chosen policy (DEFRA, 2007). These benefits can be translated into economic values using economic valuation techniques.
10
630
Figure 1.2 Overview of impact pathway of policy change on ecosystems and their services (source: modified from DEFRA, 2007)
1.3. Research methodology 635
1.3.1. Research area South Korea is located in East Asia on the south part of the Korean peninsula, which is surrounded by the three seas: the Yellow (West) Sea, the South Sea, and the East Sea. The country lies between 124° and 132° longitude and between 33° and 42° latitude. This geographical location makes the climate of the country to have four distinct seasons and a
640
continental or temperate monsoon climate (Min, 2011). The country has mountainous terrains in the eastern part which cover about 70% of the country’s territory (Kim et al., 2013). The main four rivers (Han, Geum, Nakdong, Yeongsan) run into the West Sea and the South Sea (Min, 2011; Sampson, 2002).
11
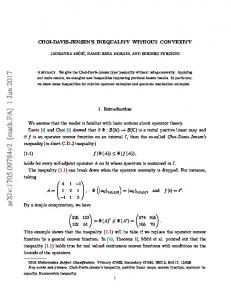
As shown in Figure 1.3 the Han River basin is the largest one and the primary source 645
of drinking water supply to the Seoul (capital) metropolitan area (largest population). The basin is also considered to have fine aquatic biodiversity, e.g. fish as a vital component of the stream food chain. However, the highland areas of the basin is, in particular, dominated by vegetable-producing agriculture such as Chinese cabbage and radish which is typified by the intensive use of agricultural chemicals (e.g., nitrogen and phosphorous). Soil erosion from the
650
upstream agricultural fields is accelerated by the summer monsoon and typhoons in the rainy season (June to September). This has been identified as hotspots of non-point pollution and caused the inflow of agro-chemically contaminated turbid water to the basin, which leads to the degradation of water quality and aquatic ecosystems such as fish habitat in every layer of the river. The frequent turbid water has accelerated loss in fish diversity due to the absence of
655
practical policies and finance for the conservation and protection of endangered aquatic biota (SMG, 2014; Kim, 2012; Shin et al., 2009).
Figure 1.3 Research area considered in this thesis
12
660
Along with the Han River Law in 1999 promulgated for more systematic water management, a water use charge that major water users in downstream areas (Seoul, Incheon, and part of Gyeonggi-do) that are supplied with water from upstream water source protection zones (part of Gyeonggi-do, Gangwon-do, and Chungcheongbuk-do) of the Han River basin have to pay was introduced based on the beneficiaries’ pay principle. The charge has been
665
increased from South Korean won (KRW) 80 per cubic meter in 1999 to KRW 170 per cubic meter in 2016 (SMG, 2014). Despite the implementation of diverse governmental measures for water quality improvement including the water use charge, conflicts over water rights between up- and downstream areas in the Han River basin have increasingly occurred (Kim, 2012). Due to the
670
repeated contaminated turbid water in the Basin the residents in downstream areas argues that the water use charge should be reduced or abolished, while upstream residents insist that overlapping regulations in the upstream areas should be eliminated and compensation for water quality improvement in the basin should increase (Kim et al., 2000; Kim, 2012). To prevent turbid water inflows to the basin, it is essential for the vegetable cultivation
675
to be converted to other alternatives such as perennial crops or forest trees in the highland areas. This is so-called ‘trade-offs’ between benefits through improvement in water quality and aquatic ecosystems and the forgone benefits of abandoning current highland vegetable farming. Through the implementation of the conversion policy for improving water quality and ecological status of the basin, it is obvious that residents in down- and midstream areas
680
are provided with more benefits from gaining safe and clean water. Economic activities of farmers in the highland agricultural fields are, on the other hand, restricted and their opportunity for potential economic benefits regarding water resources use is lost (Shin et al., 2016). For the realization of the equivalent distribution of benefits from water use among
13
stakeholders in the basin, a financing mechanism to compensate for highland farmers’ 685
expected income loss through the conversion is necessary. 1.3.2. Valuation of ecosystem services Total economic value framework including use and non-use values The value of natural resources is often considered within the framework of total economic value (TEV), and this framework can be used to valuate ecosystem services. Figure 1.3
690
summarizes TEV which comprises use and non-use values. TEV means the total benefit in human welfare from a policy measured by the net sum of the willingness to pay (WTP).
Figure 1.4 Total economic value approach (source: modified from Pagiola et al., 2004; DEFRA, 2007; Bateman, 2011) 695
Use value is comprised of three types of values. Direct use values include the value of consumptive uses (e.g. food products, timber for fuel or construction, medicinal products) and that of non-consumptive uses (e.g. recreation, landscape amenity). Indirect use values refer to other benefits that people have from services supported by natural ecosystems, including key 14
global life-support functions such as climate and water regulation, pollution filtering, soil 700
retention and provision, nutrient cycling, etc. Option values are from preserving the resources to use in the future. It, in other words, describes the value placed on maintaining ecosystems and their component species and habitats for possible future uses (Bateman, 2011; Pagiola et al., 2004; DEFRA, 2007). Non-use value (or passive use) refers to the enjoyment people may experience simply
705
by knowing that ecosystems exist even if they never expect to use those ones directly. There are three main components: 1) bequest value (attaching value from the fact that the ecosystem resource will be passed on to future generations); 2) altruistic value (attaching value to the availability of the ecosystem resource to others in the current generation); 3) existence value (existence of an ecosystem resource despite no actual or planned use of it) (Carson et al.,
710
1999; Freeman 2003; Young and Loomis, 2014). Table 1.1 Valuing ecosystem services through the TEV approach (source: modified from Pagiola et al., 2004; MA, 2005; DEFRA, 2007) Millennium Ecosystem Assessment (MA) framework
Total Ecosystem Value (TEV) framework Use Value
Services
Direct Provisioning
Regulating Cultural Supporting
Food; figre and fuel; biochemical, natural medicines, pharmaceuticals; fresh water supply Air quality regulation; climate, water, natural hazard regulation Cultural heritage; recreation and tourism; aesthetic values Primary production; nutrient cycling; soli formation
Non-use value
Indirect
●
● ●
●
Option Value
● ●
●
Supporting services are valued through the other categories of ecosystem services
The TEV and the MA framework for categorizing ecosystem services can be seen as 715
complementary. Both approaches can be combined as shown in Table 1.1. The TEV 15
framework is a useful tool for exploring what types of values for each ecosystem service we are trying to elicit. This helps in determining the valuation methods required to capture these values. Contingent Valuation Method for Valuing Ecosystem Services 720
Economic valuation attempts to elicit public preferences for changes in the state of ecosystem services in monetary terms. The main types of economic valuation methods available for estimating those preferences are revealed preference (RP) and stated preference (SP) methods. RP methods rely on data regarding individuals’ preferences for a marketable good which includes environmental attributes. These techniques rely on actual markets and include
725
market pricing, averting behavior, hedonic pricing, travel cost method, and random utility modelling. SP methods use carefully structured questionnaires to elicit individuals’ preferences for a given change in an ecosystem service. In principle, SP methods can be applied in a wide range of contexts because they are useful for estimating non-use values as a significant component of overall TEV for ecosystem services. The main options in this
730
approach are contingent valuation and choice modelling (Adamowicz et al., 2004; Bateman, 2007; Whitehead et al., 2008; Bateman et al., 2011) Contingent valuation method (CVM) is one of the most prevalent SP approaches (Bateman et al., 1995; Del Saz-Salazar and Guaita-Pradas, 2013) to estimate the total value (use and non-use value of an environmental good or service) (Carson and Hanemann, 2005,
735
Edwards and Anderson, 1987; Freeman, 1979). This method inquires respondent’s WTP for the change in environmental quality (e.g., hypothetical improvements in water quality) through the survey instrument in assessing the impact of the policy change on individual welfare (Chien et al., 2005). Given that the responses to a contingent valuation study are usually treated as random variables, a random component is incorporated into the individual’s
740
utility function and the probability of survey response is linked to the WTP distributions 16
based on the assumption that a respondent maximizes his utility (Carson and Hanemann, 2005; Hoyos and Mariel, 2010). Two popular dichotomous choice question formats (single-bounded (SB) and doublebounded (DB)) are applied in this thesis in order to elicit WTP for the quality change in 745
ecosystem services. This dichotomous choice (DC) format (referendum or closed-ended) gained considerable acceptance in the literature because of its incentive compatibility (i.e. it induces respondents to reveal their true preferences) and its substantial simplification of the cognitive task faced by respondents (Hoyos and Mariel, 2010). In the SB format respondents are asked for a yes-no answer to the WTP question attempting to identify if their true values
750
are lower or higher than a given bid. The DB format, on the other hand, includes two payment questions, offering two different bids. If the first bid is accepted (rejected), a higher bid (a lower bid) is proposed in the follow-up question so that an individual can make a decision whether he agrees to accept or reject the proposed bids. Since the individual’s WTP can be below or above a bid amount or between the two bid amounts, the double-bounded model
755
could have the potential to identify the WTP location more accurately, hence improving the estimates (Gelo and Koch, 2015). Therefore, this method can directly provide a monetary (Hicksian) measure of welfare associated with a discrete change in water quality (Haab and McConnell, 2002). The double-bounded dichotomous choice (DBDC) contingent valuation (CV) method
760
might, however, cause undesirable response effects, known as shift, anchoring, and yeasaying effects (Alberini et al., 1997; Herrridges and Shogren, 1996; Whitehead, 2002; Deshazo, 2002; Flachaire, 2006; Watson and Ryan, 2007). Cameron and Quiggin (1994) indicated that despite the high correlation between the WTP distributions signified by the first and second bids, the WTP distributions are not equivalent in the double-bounded model. This
765
is because the variance from the second WTP estimate is larger than the first. The offer of the 17
second bid could, in addition, surprise respondents due to their unfamiliarity with the institutional design of the DBDC CV method, thus causing diverse strategic answers (anomalous preferences) and less precise WTP estimates (Cooper et al., 2002; Bateman et al., 2008). Compared to the DB format, the SB format is less complex to survey and to analyze 770
the data, and is relatively free from potential preference anomalies such as anchoring and shift biases that the DB format has (Hanemann et al., 1991; Bishop and Heberlein, 1979). This method, however, has potential problems about proxy variables, e.g., attitudes toward and satisfaction levels for an environmental quality change as important determinants of WTP. A proxy variable based on subjective experience of environmental quality changes may be
775
influenced by the unobserved characteristics of respondents, which affect their WTPs. If the unobserved characteristics are correlated with both the subjective experience variable and the WTP, the coefficient of the variable will be biased in a WTP model. This is defined as the endogeneity bias (Whitehead, 2006). In other words, any WTP models with the existence of endogeneity bias would provide inconsistent parameter estimates (Martínez-Espiñeira and
780
Lyssenko, 2011). These problems, i.e. anomalous preferences and endogeneity bias in CV data are dealt with in our article 2 and 3 respectively. 1.3.3 Research objectives Despite the various water policy reforms for managing water ecosystems and services, including 1) the introduction of an additional water use charge in 1999 (payment that lowland
785
water users make for highland residents to reduce highland agricultural intensification), and 2) vast investments in water pollution treatment facilities, water problems such as the degradation of water quality and aquatic ecosystems (biodiversity) are still encountered, consequently resulting in a serious loss in social welfare. This indicates that the current water policy needs to be changed. A few studies have, in addition, tried to identify and control the
790
negative effects that CVM has (Alberini et al., 1997; Herrridges and Shogren, 1996; 18
Whitehead, 2002; Deshazo, 2002; Flachaire, 2006; Watson and Ryan, 2007; Cameron and Quiggin, 1994), but most of them show that controlling for those biases in CVM using the SB and DB dichotomous choice question formats may lead to a loss in efficiency and estimate precision (Gelo and Koch, 2015). 795
Therefore, the main objectives of this thesis are 1) to review the evolution of contemporary water policies in South Korea and their challenges as well as providing recommendations on the formulation of new policies of managing water ecosystem services; 2) to examine and correct those biases (anchoring, shift, yea-saying effects, endogeneity bias) in WTP data for the water policy from the DC CVM; 3) to estimate those total benefits based
800
on the CB analysis along with eliciting households’ WTP for conservation and improvement in water ecosystems and services. Those benefits derived by the implementation of the policy are able to be regarded as water ecosystem service values and practical solutions (adequate financing available to effectively manage water quality and aquatic ecosystems) that would be useful for the water management can be also provided through the CB analysis.
805
1.4 Research main outputs 1.4.1 Paper 1: Water Policy Reforms in South Korea: A Historical Review and Ongoing Challenges for Sustainable Water Governance and Management This study aims to provide an opinion on the state-of-the-art of changes and reforms of water
810
policies in South Korea, as well as the challenges along with their implications for sustainable water governance and management. In parallel with change in water resource characteristics generated by physical, environmental and socio-economic challenges such as: (1) uncertainties about climate change (flooding and drought) including seasonal and regional variation in precipitation; (2) significant increase in water use caused by rapid 19
815
urbanization and population growth in industrialized urban areas; (3) inadequate water pricing mechanism which covers only around 80% of the production cost and makes it harder to maintain water systems; and (4) recursive water quality degradation and conflicts over water rights between regions resulting from non-point source pollution in highland versus lowland areas, Korean water policies have been developed through diverse reforms
820
over 100 years. Nevertheless, new challenges for sustainable water management are continuously emerging. To meet those challenges we provide two ideas: (i) provider-getsprinciple (payment for ecosystem services) of cost-benefit sharing among stakeholders who benefit from water use; and (ii) water pricing applying full-cost pricing-principle internalizing environmental externalities caused by the intensive water use. Funds secured
825
from the application of those methods would facilitate: (1) support for upstream (rural) low income householders suffering from economic restrictions; (2) improvement in water facilities; and (3) efficient water use and demand management in South Korea’s water sectors. We expect that this paper can examine the lessons relevant to challenges that South Korea faces and offer some implications on the formulation of new integration and further
830
reforms of the institutions, laws and organizations responsible for managing water resources in South Korea. 1.4.2 Paper 2: Willingness to Pay for a Highland Agricultural Restriction Policy to Improve Water Quality in South Korea: Correcting Anomalous Preference in Contingent
835
Valuation Method This study examines the willingness to pay (WTP) for the highland agriculture restriction policy which aims to stabilize the water quality in the Han River basin, South Korea. To estimate the WTP, we use a double-bounded contingent valuation method and a randomeffects interval-data regression. We extend contingent valuation studies by dealing with the 20
840
potential preference anomalies (shift, anchoring, and inconsistent response effects). The result indicates that after the preference anomalies are corrected, the statistical precision of parameter estimates is improved. After correcting the potential preference anomalies, estimated welfare gains are on average South Korean currency (KRW) 2,861 per month per household. Based on the WTP estimate, the total benefits from the land use restriction policy
845
are around KRW 297.73 billion and the total costs are around KRW 129.44 billion. The net benefit is, thus, around KRW 168.29 billion. This study suggests several practical solutions that would be useful for the water management. First, a priority should be given to the valid compensation for the highland farmers’ expected income loss. Second, it is necessary to increase the unit cost of the highland purchase. Third, wasted or inefficiently used costs (e.g.,
850
overinvestment in waste treatment facilities, and temporary upstream community support) should be transferred to the program associated with high mountainous agriculture field purchase. Results of our analysis support South Korean legislators and land use policy makers with useful information for the approval and operationalization of the policy. 1.4.3 Paper 3:
855
Economic Valuation of the Aquatic Biodiversity Conservation in South Korea: Correcting for the Endogeneity Bias in Contingent Valuation In this study, we use the Contingent Valuation (CV) method to estimate households’ willingness to pay (WTP) for the aquatic ecosystem health (biodiversity) improvement. This paper extends CV studies by dealing with the endogenous effect of a proxy variable, namely
860
the subjective experience of negative environmental quality changes. The results show that the correction for the endogeneity bias facilitates the efficiency of parameter estimation in the empirical model. The mean WTP per household accounts for around 46.8% (KRW 79.6) of the current water use charge (KRW 170 per cubic meter). The total benefit from conserving the biodiversity is around KRW 198.62 billion. We found several factors that affect 21
865
households’ WTP for fish biodiversity conservation, suggesting the importance of these factors in the formulation of water policies associated with aquatic biodiversity. In addition, the inefficient water management costs should be redistributed to other projects or new programs such as for the fish biodiversity conservation.
870
1.5. Discussion The results presented in paper 1 demonstrate that the challenges in managing water resources are not constant over time. It is also hard to derive the exact magnitude and reliable implications in terms of water management and other associated impacts (Biswas, 2001; 2004; 2008). Although many changes in water policies have been undertaken in South Korea, and
875
other countries, there are still many challenges that need to be solved. These include environmental and physical, socio-economic challenges. The seasonal and regional characteristics of water resources in South Korea such as the concentration of approximately 69% of the annual precipitation in the summer, monsoon climate with regular landings of typhoons (MOLIT, 2011), and large differences in
880
precipitation along river basins (Koo et al., 2015; Lee, 2012) represent environmental challenges to make the country highly vulnerable to seasonal oscillation between floods and droughts, which make water quality worse and threaten ecosystems in river basins. Since 1999, chemically contaminated turbid water problems have continuously occurred along the Han River Basin. For example, the heavy rains during Typhoon Ewiniar in 2006 led to the
885
export of massive quantities of sediments to the Soyang Lake and, in turn, led to long-term turbid water discharge problems along the Han River Basin (Shin et al., 2009) when high soil erosion occurred in mountainous agricultural areas. Consequently, it has caused frequent conflicts over the responsibility for water quality management (water rights) among up-, mid-, 22
and downstream along the river basin, showing that existing water quality management 890
policies are facing challenges (Kim and Jeong, 2011). There is, accordingly, a growing need for a new allocation system of costs and benefits related to water supply and water quality improvement. However, an important obstacle to attain the goals around the world has been the failure to adequately address financial challenges such as the costs of attaining goals, how to achieve lower costs and more
895
efficiency, matching costs with available resources, which framework for and how to implement the cost-benefit sharing (OECD, 2007). It is obvious that economic instruments based on economic analysis of water uses such as water pricing play a vital and very effective role in financing water resources management. However, additional issues caused by applying the economic instruments such as the role of private sectors (and all stakeholders) and how to
900
elicit benefits from water services that are not traded in real markets should be considered on a case-by-case basis. In South Korea, the Han River basin is a major drinking water source and provides many tangible and intangible benefits to its mid- and downstream (Seoul metropolitan) areas. Partly from the benefits provided by the basin, the mid- and downstream areas have been
905
economically developed while the upstream areas have not. Despite the implementation of the water use charge policy to support communities and their people in the upstream areas, some problems regarding equal distribution of the benefits of using water resources between river basin stakeholders remain (Choi et al., 2016; Shin et al., 2016). It is necessary to pay closer attention to upstream areas’ roles as a provider of water services such as the improvement of
910
water quality and conservation of aquatic ecosystems, along with the provision of safe and stable water supplies to the mid- and downstream areas. The benefits that the upstream areas lose should be compensated (Choi et al., 2016) based on the provider gets principle, i.e., payment for ecosystem services (Hanley et al., 1998; Mauerhofer et al., 2013). 23
The results presented in paper 2 show that in comparison with the naïve (base) model 915
which does not consider a possible preference anomaly, the shift effect (δ) model which introduces a dummy variable (Dj) has a negative sign of the variable (δ = −1273.20) (a downward shift in WTP, δ < 0). This indicates that the shift model is improved. To grab the anchoring bias that respondents’ answers to the second payment questions may be affected by the first bids, we consider the concurrent existence of both shift and anchoring effects in the
920
shift–anchor model. As a result in this model, the anchoring effect is positive and statistically significant. This corresponds to the assumption of the standard anchoring effect model which shows the presence of anchoring bias. Finally, the result of the shift–anchor–inconsistency model which considers the combination of anchoring, shift, and inconsistent response effects indicates that as well as the accordance with the assumption of the standard shift and
925
anchoring effect models, the inconsistent response effect is positive (U = 0.06) (a upward shift in WTP). This implies that the yea-saying effect is statistically significant. We performed the log-likelihood test in order to evaluate the model fit between the models. The results show that the shift–anchor–inconsistency model considering all of the potential preference anomalies such as shift, anchoring, and inconsistent response effects has
930
a statistically more significant improvement in model fit. Based on this model, the monthly average WTP per household was estimated at KRW 2,861, resulting in sharp decline in the WTP value by 41.8% (around KRW 2,053) compared to that of the naïve model (around KRW 4,913), which does not consider any preference anomaly. This result indicates not only that as each of the potential preference anomalies is corrected, the log likelihoods increased
935
and the WTP values decreased, but also that correcting shift, anchoring, and inconsistent response effects simultaneously contribute to increasing the goodness of fit of the model, consequently deriving much better or more reliable WTP estimates. We calculate the total benefit generated by the highland agriculture restriction policy 24
and compare the benefits to the costs associated with land use policies to protect and improve 940
water quality supported by the water use charge in the basin. The result of calculated benefits to the mid- and downstream areas obtained from the land use restriction policy in the upstream areas. Based on the population (approximately 8.7 million households living in the mid- and downstream areas in 2013), the total benefits are calculated to be around KRW 297.73 billion per year. The downstream residents had the highest benefits at around KRW
945
156.20 billion per year and the midstream residents’ benefits were around KRW 141.53 billion per year. The implementation of the highland agriculture restriction policy aiming at water quality improvement patently restricts economic activities of the upstream residents including farmers. Instead, the mid- and downstream residents are entirely benefited by the policy for
950
the improvement of water conditions. Based on this circumstance, the water use charge is mainly used for community support programs in upstream areas of the basin, upstream farmland purchase and riparian zone management, construction and operation of waste treatment facilities. We considered the costs of the upstream farmland purchase and riparian zone management as a comparison item with the total benefits. In 2013, the costs were around
955
KRW 129.44 billion and accounted for 29.8% of the total charge, the second largest proportion after the construction and operation of waste treatment facilities. Results of the benefit–cost analysis show that the net benefit is around KRW 168.29 billion. The costs related to the upstream farmland purchase and riparian zone management in 2013 increased double compared to that in 2012 (Han River Management Committee). This
960
indicates that, to prevent the high soil erosion from highland agricultural fields, as a prime pollutant, from inflowing to the basin, the investment in purchasing upstream farmland has gradually increased. However, many of the upstream lands purchased (non-farming areas) are not relevant to the highland agriculture. Since the highland farmers who actually earn their 25
income from such summer crop production have a deep concern for their heavy income loss, 965
most of them do not want to give up farming in the highlands. To improve the negotiation for practical purchase of the high mountainous agricultural fields, valid compensation for the highland farmers’ income loss should be a high priority. To realize this, more money should be spent on highland purchase. Operational problems of the water use charge along with frequent turbid water discharge problems in the basin exist.
970
Wasteful and inefficient fund use for water quality control, e.g., overinvestment in waste treatment facilities and temporary expedients for supporting upstream communities, has been criticized by all local communities in the Han River basin (Kim, 2012; SMG, 2014). If these inefficiently used costs could be invested in other items such as the highland agriculture field purchase and riparian zone management, problems in terms of financing would be to some
975
extent resolved. The results presented in paper 3 indicated that based on the Wald test in Model 2 considering the endogeneity bias in the dichotomous choice question format, the null hypothesis that the correlation coefficient, ρ , among the two dichotomous variables experience and acceptance is equal to zero is rejected. Model 2, thus, results in a statistically
980
significant improvement in model fit compared to Model 1 which does not consider the endogeneity bias. The parameters of the explanatory variables estimated from Model 2 are associated with the correlation between the error terms of the experience and acceptance equations. In other words, if the respondents have the subjective experience of the negative aquatic
985
ecosystem changes, the presence of their unobserved characteristics is more likely to encourage the variables to advocate the aquatic biodiversity conservation (positive effect). If the unobserved characteristics leading to the endogeneity bias are, however, corrected, the 26
sign of the effect of experience turns negative. It is assumed that despite the contribution of the mid- and downstream residents to the water use charge aiming at water quality control, 990
many of them have observed and heard about the damage from contaminated turbid water to aquatic biota. It makes them skeptical about the effectiveness of the water use charge policy. Thus, they have a fairly negative attitude toward any levies on new programs. For the elicitation of households’ WTP for the aquatic biodiversity conservation in the Han River basin, based on Model 2, the proportion of the monthly mean WTP per household
995
was estimated at around 46.1% (KRW 78.4) of the current water use charge (KRW 170 per cubic meter), which was around 8.2% (KRW 13.9) higher than that of Model 1 (around 38.0%, KRW64.6). After accounting for the correlation (endogeneity bias) between the experience and the error terms in the WTP model, each of the parameters of the explanatory variables changed. The effect of correcting the endogeneity bias could be dependent on the
1000
size of the relevant target population, which means the change in the mean WTP affecting policy decision making could be different for the level of the correction effect according to the relevant population (Martínez-Espiñeira and Lyssenko, 2011). It apparently seems that the mid- and downstream residents gain a lot of benefits from the fish biodiversity conservation seeking aquatic ecosystem improvement, whereas the
1005
upstream residents do not. Under these circumstances, the total benefits from the conservation, are calculated in our study. Based on the water use charge (KRW170 per cubic meter) in 2014, the actual payments of mid- (Gyeonggi-do) and downstream areas (Seoul, Incheon) were at around KRW 193.93 billion and KRW 230.48 billion, respectively. Based on the proportion (46.1%, KRW 78.4) of the monthly mean WTP per household estimated in this study and the
1010
regional real payments for the water use charge, the total benefits were calculated to be around KRW195.65 billion per year. The residents in the downstream areas obtain the highest benefits at around KRW 106.25 billion per year. The benefits of the midstream residents are 27
around KRW 89.40 billion per year. Despite the implementation of the water use charge since 1999, there are still some 1015
problems regarding the distribution of the benefits along with contaminated turbid water resulting in the degradation of aquatic biodiversity. The inflow of massive soil loss from the highland fields to the basin is regarded as the primary non-point pollution sources which negatively affect water quality and aquatic biodiversity. To solve this problem, land use management in the highland fields such as the upstream farmland purchase should be a
1020
priority among all the programs supported by the water use charge. In particular, a preferential purchase of the highland vegetables fields, which have more than 150 slope causing severe soil erosion, can reduce soil losses by more than eighty-fold (Jung, 2005). This is consequently likely to decrease nutrient runoff (N, P2O5, K2O) and pollution intensity of turbid water (SI), resulting in improvement of aquatic ecological health (FAI) in the basin.
1025
Our paper 2 (2016) showed that the total benefits derived by the implementation of the highland agriculture restriction policy are much higher than the costs related to land use management policies. This means that the economic activities of the upstream areas are patently restricted by the land use policy, while the mid- and downstream areas have the total benefits from the policy. Based on this result, the land use policy may significantly contribute
1030
to aquatic biodiversity improvement resulting in a considerable increase in social welfare. However, the actual purchase of the upstream vegetable fields, the major source of non-point pollution, has not been implemented well. This is because due to the concern for a significant income loss, highland farmers are not willing to abandon their summer crop cultivation which is a major source of their income. To improve and conserve the aquatic
1035
biodiversity (ecosystems) in the basin, it is necessary to take further measures including increase in the (unit) costs for the highland purchase (Choi et al., 2016). 28
Since interest in aquatic ecosystem services has increased along with frequent turbid water discharge problems, there is a growing need for aquatic biodiversity conservation aimed at improving both aquatic ecosystems and social welfare. It is, thus, necessary and very 1040
important to more actively implement highland farmland purchases for aquatic biodiversity (ecosystem) conservation and improvement in the basin. If the practical costs could be reallocated to new or other items such as the highland purchase program, ongoing disputes between stakeholders regarding operation or management of the water use charge would be settled.
1045
1.6. Conclusion and policy implication Over 100 years, South Korea has developed water management policies through continuous responses to specific socio-economic conditions as described above and must be viewed as a series of stepwise reforms. Nevertheless, persistent and new water challenges emerge, 1050
including the need for an acceptable water quality in many regions, insufficient and ineffective practical implementation of the water management system (sharing of benefits and costs). We suggest that there is a need for a new sharing criterion on benefits and costs of water policies, e.g. water quality improvement and aquatic biodiversity conservation between up- and downstream areas based on the provider gets principle considering provision of
1055
environmental services (payment for ecosystem services). Long-term problem solutions require greater investments, new sharing principles and institutions to address the risks, uncertainties and conflicts over water quality and aquatic biodiversity in South Korea. In order to make practical land use restriction policies for water quality improvement and aquatic biodiversity conservation, the valid compensation for the highland farmers’
1060
income loss is necessary and this could be realized through increase in the unit cost of the 29
highland purchase. In terms of financing arrangement, wasted or inefficiently used costs (e.g., overinvestment in waste treatment facilities, and temporary upstream community support) should be spread across other cost items, in particular over the purchase program of the high mountainous agriculture fields. The results of our analysis provide South Korean legislators 1065
and land use policy makers with useful information for the approval and operationalization of the policy. Due to harm of the contaminated turbid water to aquatic biota, more positive highland purchases to improve and conserve aquatic biodiversity (ecosystem) is becoming a necessity in the basin. Obviously, the land use management policy contributes to preventing massive
1070
soil loss from the highland vegetable fields and its inflow to the basin. Above all, the purchase of the highland vegetable fields having steep slopes (more than 15 0) and causing drastic soil erosion (more than 8 times) is significantly able to contribute to maintaining a good aquatic ecological balance (biodiversity) of the basin by reducing the stress of fish habitats and improving fish diversity.
1075
Although the benefits from aquatic biodiversity improvement should be equally distributed among stakeholders in the basin, the mid- and downstream areas have almost all the benefits. On the contrary, the upstream areas (highland farmers) are under restrictions of their economic activities. For the efficient implementation of the highland vegetable field purchase, it is necessary that appropriate compensation for the abandonment of their highland
1080
cultivation causing significant income loss is guaranteed through practical measures such as a rise in unit costs for the highland purchases. To settle contentious issues on operation or management of the water use charge, reallocation of the realistic costs to the highland purchase program for the aquatic biodiversity conservation and improvement should be taken into consideration.
30
1085
1.7. Literature Adamowicz, W.L., Boxall, P. C., Haener, M., Zhang, Y., Dosman, D., Marois, J., 200 4. An assessment of the impacts of forest management on Aboriginal hunters: evidenc e from stated and revealed preference data. Forest Science 50(2) 139–152.
1090
Ahlheim, M. Integrated Water Resource Management and Payments for Eco-System Services. Presented in 3rd Water Research Horizon Confrerence 10/11 July 2012, Berlin. http://www.ufz.de/export/data/407/37379_3rdWRHC-Session3-Ahlheim.pdf Alberini, A.; Kanninen, B.; Carson, R. Modeling response incentive effect in dichotomous contingent valuation. Land Econ. 1997, 73, 309–324.
1095
Araral, E.; Wang, Y. Water demand management: Review of literature and comparison in South-East Asia. Int. J. Water Resour. Dev. 2013, 29, 434–450. Ayanu, Y.Z., Jentsch, A., Müller-Mahn, D., Rettberg, S., Romankiewicz, S., Koellner, T., 2015. Ecosystem engineer unleashed: Prosopis juliflora threatening ecosystem services? Regional Environmental Change 15, 155-167.
1100
Baron, J.S.; Poff, N.L.; Angermeier, P.L.; Dahm, C.N.; Gleick, P.H.; Hairston, N.G.; Jackson, R.B.; Johnston, C.A.; Richter, B.D.; Steinman, A.D. Meeting ecological and socieal needs for freshwater. Ecol. Appl.2002, 12, 1247–1260. Bateman, I.J., 2007. Valuing preferences regarding environmental change. In: Pretty, J., Ball, A., Benton, T., Guivant, J., Lee, D., Orr, D., Pfeffer, M., Ward, H. (Ed.), The SAGE handbook of environment and society. Sage, London, 155–171.
1105
Bateman, I.J.; Burgess, D.; Hutchinson, W.G.; Matthews, D.I. Learning design contingent valuation (LDCV): NOAA guidelines, preference learning and coherent arbitrariness. J. Environ. Econ. Manag. 2008, 55, 127–141. Bateman, I.J.; Langford, I.H.; Turner, R.K.; Willis, K.G.; Garrod, G.D. Elicitation and truncation effects in contingent valuation studies. Ecol. Econ. 1995, 12, 161–179.
1110
Bateman, I., Mace, G., Fezzi, C., Atkinson, G., Turner, K., 2011. Economic Analysis for Ecosystem Service Assessments. Environmental and Resource Economics 48(2) 177 -218. Baumgärtner, S., Quaas, M., 2010. What is sustainability economics? Ecological Economics 69, 445– 450.
1115
Beaumont, N.J.; Austen, M.C.; Mangi, S.C.; Townsend, M. Economic valuation for the conservation of marine biodiversity. Mar. Pollut. Bull. 2008, 56, 386–396. Bishop, R.C.; Heberlein, T.A. Measuring values of extra market goods: Are indirect measures biased? Am. J. Agric. Econ. 1979, 61, 926–930. Biswas, A.K. Integrated water resources management: A reassessment. Water Int. 2004, 29, 248–256, doi:10.1080/02508060408691775.
31
1120
Biswas, A.K. Integrated water resources management: Is it working? Int. J. Water Resour. Dev. 2008, 24, 5–22, doi:10.1080/07900620701871718. Biswas, A.K. Water policies in the developing world. Int. J. Water Resour. Dev. 2001, 17, 489–499, doi:10.1080/07900620120094082.
1125
Boyle, K.J.; Bishop, R.C. Valuing wildlife in benefit-cost analysis: A case study involving endangered species. Water Resour. Res. 1987, 23, 943–950. Bulte, E.H.; van Kooten, G.C. Marginal valuation of charismatic species: Implications for conservation. Environ. Resour. Econ. 1999, 14, 119–130. Cameron, T.A.; Quiggin, J. Estimation using contingent valuation data from dichotomous questionnaire. J. Environ. Econ. Manag. 1994, 27, 218–234.
1130
1135
Canadell, J.G., Le Quéré, C., Raupach, M.R., Field, C.B., Buitenhuis, E.T., Ciais, P., Conway, T.J., Gillett, N.P., Houghton, R.A., Marland, G., 2007. Contributions to accelerating atmospheric CO2 growth from economic activity, carbon intensity, and efficiency of natural sinks. PNAS 104, 18866– 18870.
Carson, R.T.; N.E. Floores, and R.C. Mitchell. 1999. The Theory and Measurement of Passive-Use Value. In Valuing Environmental Preferences, edited by Ian J. Bateman and Kenneth G. Willis. Oxford: Oxford University Press. Carson, R.T.; Hanemann,W.M. Contingent valuation. In Handbook of Environmental Economics; Mäler, K.G., Vincent, J.R., Eds.; Elsevier: New York, NY, USA, 2005; Volume 2, pp. 821–936.
1140
Carson, R.T.; Wilks, L.; Imber, D. Valuing the preservation of Australia’s Kakadu conservation zone. Oxf. Econ.Pap. 1994, 46, 727–749. Chien, Y.L.; Huang, C.J.; Shaw, D. A general model of starting point bias in double-bounded dichotomous contingent valuation surveys. J. Environ. Econ. Manag. 2005, 50, 362–377.
1145
Choi, I.C.; Kim, H.N.; Shin, H.J.; Tenhunen, J.; Nguyen, T.T. Willingness to Pay for a Highland Agricultural Restriction Policy to Improve Water Quality in South Korea: Correcting Anomalous Preference in Contingent Valuation Method. Water 2016, 8, 547. Collares-Pereira, M.J.; Cowx, I.G. The role of catchment scale environmental management in freshwater fish conservation. Fish. Manag. Ecol. 2004, 11, 303–312.
1150
Cooper, J.; Hanemann, M.; Signorello, G. One-and-one-half-bound dichotomous choice contingent valuation. Rev. Econ. Stat. 2002, 84, 741–750. Costamagna, A.C., Landis, D.A., 2006. Predators exert top-down control of soybean aphid across a gradient of agricultural management systems. Ecological Applications 16(4) 16191628.
1155
Costanza, R., 2000. Social Goals and the Valuation of Ecosystem Services. Ecosystems 3(1) 4-10.
32
Costanza, R., D'Arge, R., De Groot, R., Farber, S., Grasso, M., Hannon, B., Limburg, K., Naeem, S., O'Neill, R.V., Paruelo, J., Raskin, R.G., Sutton, P., Belt, M., 1997. The value of the world's ecosystem services and natural capital. Nature 387, 253-260. 1160
Daily, G.C., 1997. Nature’s services: Societal dependence on natural ecosystems. Island Press, Washington, D.C. Daily, G., Söderqvist, T., Aniyar, S., Arrow, K., Dasgupta, P., Ehrlich, P., Folke, C., Jansson, A., Jansson, B., Kautsky, N., 2000. The value of nature and the nature of value. de Groot, R.S., 1987. Environmental functions as a unifying concept for ecology and economics. The Environmentalist 7 (2), 105–109.
1165
1170
de Groot, R.S., 2006. Function-analysis and valuation as a tool to assess land use conflicts in planning for sustainable, multi-functional landscapes. Landscape and Urban Planning 75, 175-186. de Groot, R.S., Alkemade, R., Braat, L., Hein, L., Willemen, L., 2010. Challenges in integrating the concept of ecosystem services and values in landscape planning, management and decision making. Ecological Complexity 7, 260-272. Del Saz-Salazar, S.; Guaita-Pradas, I. On the value of drovers’ routes as environmental assets: A contingent valuation approach. Land Use Policy 2013, 32, 78–88.
1175
Department for Environment Food and Rural Affairs (DEFRA). An introductory guide to valuing ecosystem services; Defra Publications: London, UK, 2007. DeShazo, J.R. Designing transactions without framing effects in iterative question formats. J. Environ. Econ. Manag. 2002, 43, 360–385.
1180
Drechsler, M., Johst, K., Wätzold, F., Shogren, J. F., 2010. An agglomeration payment for cost-effective biodiversity conservation in spatially structured landscapes. Resource and Energy Economics 32, 261-275. Edwards, S.F.; Anderson, G.D. Overlooked biases in contingent valuation surveys: Some considerations. Land Econ. 1987, 63, 168–178.
1185
Egoh, B.N., O’Farrell, P.J., Koellner, T., Charef, A., Gurney, L.J., Abi, H.N., Egoh, M., Willemen, L., 2012. An African account of ecosystem service provision: use, threats and policy options for sustainable livelihoods. Ecosystem Services 2, 71-81. Elmqvist, T., Tuvendal, M., Krishnaswamy, J., Hylander, K., 2010. Ecosystem services: managing trade-offs between provisioning and regulating services. In: P. Kumar (eds.): Valuation of regulating services: from theory to practice. Routledge UK.
1190
Engel, S., Pagiola, S., Wunder, S., 2008. Designing payments for environmental services in theory and practice: an overview of the issue. Ecological Economics 65, 663–674. Folke, C., Carpenter, S., Walker, B., Scheffer, M., Elmqvist, T., Gunderson, L., Holling, C.S., 2004. Regime shifts, resilience, and biodiversity in ecosystem management. Annual Review of Ecology and Systematics 35,557–581. 33
1195
Freeman, A.M. The Benefits of Environmental Improvement: Theory and Practice; Johns Hopkins University Press: Baltimore, MD, USA, 1979. Freeman, A.M. 2003. The Measurement of Environmental and Resource Values: Theory and Methods. 2nd ed. Washington, DC: Resources for the Future. Flachaire, E.; Hollard, G. Controlling starting-point bias in double-bounded contingent valuation surveys. Land Econ. 2006, 82, 103–111.
1200
Gelo, D.; Koch, S.F. Contingent valuation of community forestry programs in Ethiopia: Controlling for preference anomalies in double-bounded CVM. Ecol. Econ. 2015, 114, 79–89. George, A.; Pierret, A.; Boonsaner, A.; Christian, V.; Planchon, O. Potential and limitations of Payments for Environmental Services (PES) as a means to manage watershed services in mainland Southeast Asia. Int. J. Commons 2009, 3, 16–40.
1205
Gómez-Baggethun, E.; de Groot, R.; Lomas, P.L.; Montes, C. The history of ecosystem services in economic theory and practice: From early notions to markets and payment schemes. Ecological Economics 69 (2010) 1209–1218 Haab, T.C.; McConnell, K.E. Valuing Environmental and Natural Resources: The Econometrics of Non-Market Valuation; Edward Elgar Publishing: Cheltenham, UK, 2002.
1210
Han River Management Committee. Water Use Charge Management Status. Available online: http://www.hanriver.or.kr (accessed on 2 September 2016). Hanemann, W.M. The economic conception of water. In Water Crisis: Myth or Reality? Rogers, P.P., Llamas, M.R., Martinez-Cortina, L., Eds.; Taylor and Francis: London, UK, 2006.
1215
Hanemann, M.; Loomis, J.; Kanninen, B. Statistical efficiency of double-bound dichotomous choice contingent valuation. Am. J. Agric. Econ. 1991, 73, 1255–1263. Hanley, N.; Kirkpatrick, H.; Simpson, I.; Oglethorpe, D. Principles for the provision of public goods from agriculture: Modeling moorland conservation in Scotland. Land Econ. 1998, 74, 102–113, doi:10.2307/3147216.
1220
Herridges, J.A.; Shogren, J.F. Starting point bias in dichotomous choice valuation with follow-up question. J. Environ. Econ. Manag. 1996, 30, 112–131. Hoyos, D.; Mariel, P. Contingent valuation: Past, present and future. Prague Econ. Pap. 2010, 19, 329–34.
1225
Juliet, C.S.; Gleick, P.H.; Cooley, H. Chapter 7: U.S. Water Policy Reform. In The World’s Water: The Biennial Report on Freshwater Resources; Gleick, P.H., Ed.; Island Press: Washington, DC, USA, 2011; pp. 143–155. Jung, K. Assessment of Soil Erosion Potential in Korea; Rural Development Administration: Suwon, Korea, 2005.
34
1230
Kabat, P., Claussen, M., Dirmeyer, P.A., Gash, G.H., de Guenni, L.B., Pielke, R.A., Vörömarty, C.J., Hutjes, R.W.A., Lütkemeier, S., 2004. Vegetation, water, humans and the climate. Springer-Verlag, Berlin-Heidelberg-New York, pp. 566. Kettunen, M. & ten Brink, P. 2006. Value of biodiversity- Documenting EU examples where biodiversity loss has led to the loss of ecosystem services. Final report for the European Commission. Institute for European Environmental Policy (IEEP), Brussels, Belgium. 131 pp.
1235
Kim, K.M. Improvement of the Han River Watershed Management Fund Policies; National Assembly Research Service (NARS) Issue Report 160; NARS: Seoul, Korea, 2012. Kim, H.N.; Boxall, P.C.; Adamowicz, W.L. Analysis of the impact of water quality changes on residential property prices. Water Resources and Economics 2016, 16, 1-14, https://doi.org/10.1016/j.wre.2016.11.003
1240
Kim, B.; Choi, K.; Kim, C.; Lee, U.; Kim, Y.H. The effect of summer monsoon on the distribution and loading of organic carbon in a deep reservoir, Lake Soyang, Korea. Water Res. 2000, 34, 3495–3504, doi:10.1016/S0043-1354(00)00104-4. Kim, Y.J.; Jeong, U.S. Water Resources: Their Current State and Assessment; Research Report: Working Paper 2011-01; Korea Environment Institute: Seoul, Korea, 2011.
1245
1250
Kim, J.K.; Jung, S.; Eom, J.S.; Jang, C.; Lee, Y.; Jeffrey, S.O.; Jung, M.S.; Kim, B. Dissolved and particulate organic carbon concentrations in stream water and relationships with land use in multiple-use watersheds of the Han River (Korea). Water Int. 2013, 38, 326–339, doi:10.1080/02508060.2013.769411. Kim, K.U.; Koh, J.K.; Lee, M.H. The Dynamics of Water Policy Change in South Korea. 2007. Available online: http://www.newater.uniosnabrueck.de/caiwa/data/papers%20session/F1/KoUn%20Kim%20et%20al%202007.pdf (accessed on 17 January 2017). Kinzig, A.P., Perrings, C., Chapin, F.S., Polasky, S., Smith, V.K., Tilman, D., Turner, B.L., 2011. Paying for ecosystem services – Promise and peril. Science 334(6056) 603-604.
1255
Knoche, S., Lupi, F., 2007. Valuing deer hunting ecosystem services from farm landscapes. Ecological Economics 64(2) 313-320. Koo, J.H.; Yoon, J.Y.; Sim, K.H.; Cho, H.K. A counterfactual assessment for interagency collaboration on water quality: The case of the Geum River basin, South Korea. Water Int. 2015, 40, 664–688, doi:10.1080/02508060.2015.1067749.
1260
Kotchen, M.J.; Reiling, S.D. Estimation and questioning economic values for endangered species: An application and discussion. Endanger. Species Update 1998, 15, 77–83. Kroon, F.; Kuhnert, P.; Henderson, B.; Wilkinson, S.; Henderson, A.; Abbott, B.; Brodie, J.; Turner, R. River loads of suspended solids, nitrogen, phosphorus and herbicides delivered to the Great Barrier Reef lagoon. Mar. Pollut. Bull. 2012, 65, 167–181.
1265
Kumar, P.; Muradian, R. Payment for Ecosystem Services (Ecological Economics and Human Well-Being); Oxford University Press: Oxford, UK, 2009 35
Landell-Mills, N., Porras, I.T., 2002. Silver Bullet or Fool's Gold? A Global Review of Markets for Environmental Services and their Impact on the Poor. IIED, London. 1270
Lee, J.S. Measuring the economic benefits of the Youngsan River Restoration Project in Kwangju, Korea, using contingent valuation. Water Int. 2012, 37, 859–870, doi:10.1080/02508060.2012.742698. Lee, S.D. A management planning for aquatic ecosystems damaged by increase in turbid water in the Bukhan River. River Cult. 2012, 8, 72–76. (In Korean).
1275
Luan, I.O.B. Singapore Water Management Policies and Practices. Int. J. Water Resour. Dev. 2010, 26, 65–80. Loomis, J.; Kent, P.; Strange, L.; Fausch, K.; Covich, A. Measuring the total economic value of restoring ecosystem services in an impaired river basin: Results from a contingent valuation survey. Ecol. Econ. 2000, 33, 103–117.
1280
Loomis, J.; White, D. Economic benefits of rare and endangered species. Ecol. Econ. 1996, 18, 197–206. Martínez-Espiñeira, R.; Lyssenko, N. Correcting for the endogeneity of pro-environment behavioral choices in contingent valuation. Ecol. Econ. 2011, 70, 1435–1439.
1285
Mauerhofer, V.; Hubacek, K.; Coleby, A. From polluter pays to provider gets: Distribution of rights and costs under payments for ecosystem services. Ecol. Soc. 2013, 18, 41, doi:10.5751/ES-06025-180441. Min, K.J. The Role of the State and the Market in the Korean Water Sector: Strategic Decision Marking Approach for Good Governance. Doctor’s Thesis, University of Bath School of Management, Bath, UK, January 2011.
1290
Millennium Ecosystem Assessment (MA). Ecosystems and Human Well-Being: Synthesis; Island Press: Washington, DC, USA, 2005. Ministry of Land, Infrastructure and Transportation of Korea (MOLIT). (2011–2020): Water Vision 2020 [The Long-Term Comprehensive Water Resource Plan (2011–2020): The Second Revised Water Vision 2020]; MOLIT: Sejong, Korea, 2011. (In Korean)
1295
Mitchell, A.; Reghenzani, J.; Faithful, J.; Furnas, M.; Brodie, J. Relationships between land use and nutrient concentrations in streams draining a ‘wet-tropics’ catchment in northern Australia. Mar. Freshw. Res. 2009, 60, 1097–1108. Nguyen, T.T. 2015. Gains and Losses in Ecosystem Services: Trade-off and Efficiency Perspectives. Habilitation Thesis. University of Bayreuth, Bayreuth
1300
Nguyen, T.T, Pham, V.D., Tenhunen, J., 2013. Linking regional land use and payments for forest hydrological services: A case study of Hoa Binh Reservoir in Vietnam. Land Use Policy 33, 130-140. Nguyen, T.T.; Ruidisch, M.; Koellner, T.; Tenhunen, J. Synergies and tradeoffs between nitrate leaching and net farm income: The case of nitrogen best management practices in South Korea. Agric. Ecosyst. Environ.2014, 186, 160–169. 36
1305
Nguyen, Trung Thanh and Tenhunen, John, Review of Integrated Ecological-Economic Analyses for Bioenergy Plants Under Climate Change at Local Scale (2013). Available at SSRN: https://ssrn.com/abstract=2777987 or http://dx.doi.org/10.2139/ssrn.2777987 Organization for Economic Co-operation and Development (OECD). Feasible Financing Strategies for Water Supply and Sanitation; OECD Publishing: Paris, France, 2007.
1310
Organization for Economic Co-Operation and Development (OECD). Meeting the Water Reform Challenge; OECD Publishing: Paris, France, 2012a. Organisation for Economic Cooperation and Development (OECD). A Framework for Financing Water Resources Management; OECD Publishing: Paris, France, 2012b.
1315
Pagiola, S., 2008. Payments for environmental services in Costa Rica. Ecological Economics 65, 712–724. Pagiola, S., Arcenas, A., Platais, G., 2005. Can payments for environmental services help reduce poverty? An exploration of the issues and the evidence to date from Latin America. World Development 33, 237-253.
1320
Pagiola, S., Platais,G., 2007. Payments for Environmental Services: From Theory to Practice. World Bank, Washington. Pagiola, S.; von Ritter, K.; Bishop, J. Assessing the Economic Value of Ecosystem Conservation; The World Bank Environment Department Paper No. 101; The World Bank: Washington, USA, 2004.
1325
1330
Pagiola, S.; Agostini, P.; Gobbi, J.; de Haan, C.; Ibrahim, M.; Murgueitio, E.; Ramírez, E.; Rosales, M.; Ruíz, J.P. Paying for Biodiversity Conservation Services in Agricultural Landscapes; The World Bank Environment Department Paper No. 96; The World Bank: Washington, DC, USA, 2004. Petz, K., Minca, E.L., Werners, S.E., Leemans, R., 2012. Managing the current and future supply of ecosystem services in the Hungarian and Romanian Tisza River Basin. Regional Environmental Change 12, 689-700. Poufoun, J.N.; Abildtrup, J.; Sonwa, D.J.; Delacote, P. The value of endangered forest elephants to local communities in a transboundary conservation landscape. Ecol. Econ. 2016, 126, 70–86.
1335
Quevauviller, P. European water policy and research on water-related topics—An overview. J. Hydrol. 2014, 518, 180–185. Rees, J.A. Regulation and private participation in the water and sanitation sector. Nat. Resour. Forum 1998, 22, 95–105. Ressurreição, A.; Gibbons, J.; Dentinho, T.P.; Kaiser, M.; Santos, R.S.; Edwards-Jones, G. Economic valuation of species loss in the open sea. Ecol. Econ. 2011, 70, 729–739.
1340
Sampson, M. Geomorphoology. In North Korea: A Geographic Overview; Palka, E.J., Galgano, F.A., Eds.; West Point: New York, NY, USA, 2002; pp. 23–29. 37
Seoul Metropolitan Government (SMG). A White Paper on Improving Water Use Charge System; SMG: Seoul, Korea, 2014. (In Korean) 1345
Seppälä, O.T. Effective water and sanitation policy reform implementation: Need for systemic approach and stakeholder participation. Water Policy 2002, 4, 367–388. Shin, H.J.; Kim, H.N.; Jeon, C.H.; Jo, M.H.; Nguyen, T.T.; Tenhunen, J. Benefit transfer for water management along the Han River in South Korea using Meta-Regression Analysis. Water 2016, 8, 492.
1350
Shin, H.J.; Jeon, C.H.; Choi, I.C.; Yeon, I.C. Estimation of beneficiary’s willingness to pay in mid and down-stream area to the water quality improvements in upper Bukhan River Basin. Seoul Stud. 2009, 10, 91–106. (In Korean) Stevens, T.; Echeverria, J.; Glass, R.; Hager, T.; More, T. Measuring the existence value of wildlife: What do CVM estimates really show? Land Econ. 1991, 67, 390–400.
1355
Stoate, C.; Báldi, A.; Beja, P.; Boatman, N.D.; Herzon, I.; van Doorn, A.; de Snoo, G.R.; Rakosy, L.; Ramwell, C. Ecological impacts of early 21st century agricultural change in Europe: A review. J. Environ. Manag. 2009, 91, 22–46. Thorburn, P.J.; Wilkinson, S.N. Conceptual frameworks for estimating the water quality benefits of improved agricultural management practices in large catchments. Agric. Ecosyst. Environ. 2013, 180, 192–209.
1360
Tilman, D.; Cassman, K.G.; Matson, P.A.; Naylor, R.; Polasky, S. Agricultural sustainability and intensive production practices. Nature 2002, 418, 671–677. Tscharntke, T., Klein, A.M., Kruess, A., Steffan-Dewenter, I., Thies, C., 2005. Landscape perspectives on agricultural intensification and biodiversity – ecosystem service management. Ecology Letters 8(8) 857-874.
1365
UN-Water Decade Programme on Advocacy and Communication (UNW-DPAC). Water cooperation in action: Approaches, tools and processes. In Proceedings of the International Annual UN-Water Zaragoza Conference 2012/2013, Zaragoza, Spain, 8–10 January 2013. Vugteveen, P.; Lenders, H.J.R. The duality of integrated water management: Science, policy or both? J. Integr. Environ. Sci. 2009, 6, 51–67.
1370
Watson, V.; Ryan, M. Exploring preference anomalies in double bounded contingent valuation. J. Health Econ. 2007, 26, 463–482. Whitehead, J.C. Incentive incompatibility and starting point-bias in iterative valuation question. Land Econ. 2002, 78, 285–297.
1375
Whitehead, J.C. Improving willingness to pay estimates for quality improvements through joint estimation with quality perceptions. South. Econ. J. 2006, 73, 100–111. Whitehead, J.C., Pattanayak, S.K., Van Houtven, G.L., Gelso, B.R., 2008. Combining revealed and stated preference data to estimate the nonmarket value of ecological serv ices: An assessment of the state of the science. Journal of Economic Surveys 22(5) 8 72-908. 38
1380
Willis, K.G.; Garrod, G.; Scarpa, R.; Powe, N.; Lovett, A.; Bateman, lan. J.; Hanley, N.; Macmillan, D.C. The Social and Environmental Benefits of Forests in Great Britain; Newcastle University Press: London, UK, 2003. Wunder, S., 2005. Payments for Environmental Services: Some Nuts and Bolts. Occasional Paper No. 42. Center for International Forestry Research, Nairobi, Kenya.
1385
Young, R.A. Determining the Economic Value of Water: Concepts and Methods; Resources for the Future Press: Washington, DC, USA, 2005. Young, R.A., and Loomis, J. B. (2014) Determining the Economic Value of Water: Concepts and Methods (2nd Edition). RFF Press, Routledge, New York, USA. 358 pp.
39
1390
Chapter 2: Water Policy Reforms in South Korea: A Historical Review
and
Ongoing
Challenges
for
Sustainable
Water
Governance and Management Ik-Chang Choi 1*, Hio-Jung Shin 2, Trung Thanh Nguyen 3 and John Tenhunen 1 1
1395
Bayreuth Center of Ecology and Environmental Research, University of Bayreuth, 95440
Bayreuth, Germany;
[email protected] 2
Department of Agricultural and Resource Economics, Kangwon National University, 24341
Chuncheon, Korea;
[email protected] 3
Institute for Environmental Economics and World Trade, University of Hannover, 30167
Hannover, Germany;
[email protected] 1400
* Correspondence:
[email protected]; Tel.: +82-44-415-7273
Abstract: This study aims to provide an opinion on the state-of-the-art of changes and reforms of water policies in South Korea, as well as the challenges along with their implications for sustainable water governance and management. In parallel with change in 1405
water resource characteristics generated by physical, environmental and socio-economic challenges such as: (1) uncertainties about climate change (flooding and drought) including seasonal and regional variation in precipitation; (2) significant increase in water use caused by rapid urbanization and population growth in industrialized urban areas; (3) inadequate water pricing mechanism which covers only around 80% of the production cost and makes it harder
1410
to maintain water systems; and (4) recursive water quality degradation and conflicts over water rights between regions resulting from non-point source pollution in highland versus lowland areas, Korean water policies have been developed through diverse reforms over 100 years. Nevertheless, new challenges for sustainable water management are continuously emerging. To meet those challenges we provide two ideas: (i) provider-gets-principle 40
1415
(payment for ecosystem services) of cost-benefit sharing among stakeholders who benefit from water use; and (ii) water pricing applying full-cost pricing-principle internalizing environmental externalities caused by the intensive water use. Funds secured from the application of those methods would facilitate: (1) support for upstream (rural) low income householders suffering from economic restrictions; (2) improvement in water facilities; and (3)
1420
efficient water use and demand management in South Korea’s water sectors. We expect that this paper can examine the lessons relevant to challenges that South Korea faces and offer some implications on the formulation of new integration and further reforms of the institutions, laws and organizations responsible for managing water resources in South Korea.
1425
2.1 Introduction Water systems are of vital importance for human well-being, providing many benefits to society in terms of water-related resources and services. For a long time, water policies have rapidly evolved in response to the ever-increasing demands that are being made on finite water resources in many parts of the world [1,2]. However, many countries worldwide still
1430
face significant challenges in managing their scarce water resources because of industrialization, urbanization, and the potential effects of climate change [3]. Due to population pressure caused by the industrialization and urbanization as the major factors for the economic growth, agricultural intensification with high external inputs of agrochemicals has been promoted, consequently leading to increasingly degraded water quality in many
1435
parts of the world [4], and climate change has increased spatial and temporal variations in water availability [5]. There are, in addition, many key water policies, institutions, and laws that are outdated and not effectively or equitably enforced [6]. Therefore, there have been many calls for water policy reforms in a number of countries [7], since current water
41
governance systems fail to provide essential water services and to balance environmental, 1440
social, and economic concerns [8–11]. South Korea is no exception to these water management challenges. Over the last several decades, the country has gained a surprisingly high level of economic growth with an average annual rate of the Gross Domestic Products (GDP) of 8.5% [12]. However, the economic growth is achieved at the expense of the environment [13,14], such as water
1445
shortages and water quality degradation [15], which became severe during 1990s [16]. The rapid expansion of the economy has resulted in serious degradation of water supplies and ecosystems from municipal, industrial and agricultural pollution. Population and industrial growth have placed increased pressures on limited available water resources, creating water use conflicts between stakeholders [17]. Despite the fact that various water policy reforms
1450
have been undertaken, including the introduction of an additional water use charge in 1999 for lowland water users to pay for highland residents to reduce highland agricultural intensification, and that vast investments in water pollution treatment facilities have been made, water pollution problems are still encountered [18,19], indicating that the current water policy needs to be changed.
1455
In order to provide policy makers and planners facing water management challenges in South Korea, this paper reviews the evolution of contemporary water policies in the country and the challenges along with their policy implications. Our review is an attempt to provide an overview and perspective on the history of water policy in South Korea and to discuss the drivers of water policy changes that have occurred. As stated by Moore et al.
1460
(2014) [20], understanding how policies change and the following effect on society is important as governments, civil society, and industry look to address growing water quantity and quality concerns. Increasing conflict associated with outdated or inadequate water allocation systems, and the need to consider the multiple interests of different water related 42
stakeholders, coupled with the growing industrial, agricultural and urban demand for fresh 1465
water, are all driving an interest in water policy reform [21,22]. Hopefully, this paper is able to examine the lessons related to South Korea’s challenges and provide recommendations on the formulation of new water policy in South Korea. Our paper is structured as follows. After this Introduction Section, Section 2 examines physical, socio-economic and environmental characteristics of water resources. Section 3
1470
reviews water policy reforms that have been undertaken since the colonial period started in 1910. Section 4 discusses the challenges and implications for water policy. Section 5 finally summarizes.
2.2 Characteristics of Water Resources in South Korea 1475
2.2.1 Physical Characteristic South Korea is located in East Asia on the south part of the Korean peninsula, which is surrounded by the three seas: the Yellow (West) Sea, the South Sea, and the East Sea. The longitude of the country lies between 124◦ and 132◦. Its latitude is between 33◦ and 42◦. This geographical location is a very significant part of determining the climate of the country
1480
which is classed as having four distinct seasons and a continental or temperate monsoon climate [23]. The country has a land area of around 99,596 km2, and mountainous terrains which cover about 70% of the country’s territory [24]. Most of the high mountains are located in the east area of the country and drop sharply to the East, while their height is gently lowered to
1485
the West and the South. That is why main four rivers run into the West (Yellow) Sea and the South Sea (see Figure 2.1) [23,25]. The Han River (length of 481.7 km, basin area of 26,018 km2) is the largest one of South Korea and flows through Seoul (largest population) 43
metropolitan areas including Inchon (third) to the West Sea. The Nakdong River (length of 506.17 km, basin area of 23,384 km2) which is the longest one of the country flowing to the 1490
South Sea accommodates two metropolises: Busan (second) and Daegu (fourth) and several industrial cities. The Geum River (length of 394.79 km, basin area of 9912.15 km2) begins from the central area of the country and ends in the West Sea. Daejeon and Sejong (fifth) belong to this basin. The Yeongsan River (length of 115.5 km, basin area of 3371 km2) is a river in southwestern South Korean. It runs through Gwangju (sixth) and eventually flows
1495
into the Yellow Sea [23].
Figure 2.1 The four major river basins in South Korea. As mentioned earlier, due to the Korean geographical situation in a temperate climate zone at the middle latitude of the Northern Hemisphere, the country has four different seasons 1500
(see Table 2.1). The winter (December to February) of the country is influenced by predominantly cold and dry northwesterly winds resulting from the Siberian high pressure system. Droughts in spring (March to May) are accompanied with northeasterly winds due to the influence of migratory anticyclones (Yangtze air mass), which brings clear and dry. In 44
summer (June to August), the influence of the North Pacific high-pressure system brings hot 1505
and humid weather [23]. South Korea has an annual precipitation of 1277.4 mm on average (1973–2007), which is 1.6 times more than the world’s average precipitation of 807 mm. The annual precipitation per capita (2660 m3) is, however, only one-sixth of that of the world (16,427 m3) [26]. The 10-year average precipitation has shown a gradual increase by average 2.1% from
1510
1103 mm in 1900s to 1350 mm in 2000s. The range of fluctuation in precipitation has been also growing such as minimum 754 mm in 1939 and maximum 1756 mm in 2003. More than half of the annual precipitation is concentrated during the rainy season including the summer monsoon and typhoons (June to September) which often result in flooding and damage to life and property. Only one-fifth, on the other hand, falls in a dry period (see Table 2.1)
1515
(November to April). This is mainly causing severe droughts and flooding [23,27]. During this period, there are also large differences in precipitation along regions and river basins due to rainfall patterns [28,29]. The annual precipitation ranges from 1100 mm to 1800 mm in the south and east areas around the Han River and Yeongsan River, while that of the central parts around the Geum River and the Nakdong River ranges from 1100 mm to 1400 mm [23,27].
1520
Table 2.1 Korean seasonal weather distinction (1973 to 2007). Season1 Month
Winter
Weather2
Cold, Dry
Mild, Dry
Hot, Humid
Serene, Dry
distinction
Snow
Clear
Typhoon, Heavy
Clear 278.3
151.0
48.2
42.4
1,277.4
Monthly average precipitation( mm, %) Monthly average renewable water resources(billi onm3, %)
Dec.
Spring Jan.
Feb.
Mar.
Summer Apr.
May
Jun.
Jul.
Fall Aug.
Sep.
Sum Oct.
Nov
23.2
27.1
31.8
49.8
77.1
94.5
rainfall3c 166 287.9
(1.8)
(2.1)
(2.5)
(3.9)
(6.0)
(7.4)
(13)
(22.5)
(21.8)
(11.8)
(3.8)
(3.3)
(100.0)
1.59
1.38
1.52
2.18
3.07
3.86
7.31
18.19
18.41
12.08
3.55
2.12
75.26
(2.1)
(1.8)
(2.0)
(2.9)
(4.1)
(5.1)
(9.7)
(24.2)
(24.5)
(16.1)
(4.7)
(2.8)
(100.0)
Note: The numbers in parentheses are the proportions of each contents, respectively.
45
Total amount of water resources of the country is 129.7 billion m3, as shown in Figure 2.2 (100%). The renewable water resources are, however, estimated at slightly more than half (58%, 75.3 billion m3). These are mostly discharged during the rainy period (June to 1525
September, 56.0 billion m3). In particular, heavy rains of the summer monsoon and typhoons cause floods in downstream urban areas of the four major river basins (see Figure 2.1). For human activities, no more than 33.3 billion m3 (26%) is used and 42 billion m3 (32%) flows directly to the sea due to the steep slope of high mountains and shallow layers of topsoil. The remainder (42%, 54.4 billion m3) is estimated to be lost by evaporation and transpiration
1530
(Figure 2.2) [26].
Figure 2.2 Utilization of water resources in South Korea. All the values are estimates from a 2007 base year.
46
1535
2.2.2 Socio-Economic Characteristics Figure 2.3 demonstrates that the nominal GDP of South Korea has increased from United States dollar (USD) 3.1 billion in 1965 to more than USD 1410.0 billion in 2014, with an annual average growth of 14.2% [30]. Along with the rapid economic growth, the country has faced considerable changes in industrial structure. For example, between 1960s and 1970s,
1540
total added value of the prime industry including agriculture to GDP had the highest ratio (28%). Through export-oriented industrialization and economic growth, its ratio significantly decreased to 2.8% in 2012. The ratio of that of the manufacturing industry such as heavy chemical and service industry inducing manufacturing business, on the other hand, increased from 16.9%, 40.4% in 1970 to 28.0%, 52.4% in 2012 respectively [31].
1545
The population of South Korea is around 50.7 million in 2014 and its density is around 506 persons/km2 [32], which makes it one of the world’s most densely populated nations [33]. Between 1960 and 2010, the population increased with an annual average of 7.0% from about 25 million to 48.6 million. It is noteworthy that the population in urban areas has increased from 28.0% (7.0 million) of the total population in 1960 to 81.9% (39.8 million) in
1550
2010. As shown in Figure 2.4, the Seoul (capital) metropolitan area, which covers only 11.8% of the nation’s total land area, accounts for 49.1% of the total population (approximately 23.8 million) [32]. This remarkable population movement was promoted by industrialization and urbanization, which can provide better social and economic opportunities such as income and education [23].
47
1555
Figure 2.3 Trends in normal GDP and total amount of water use. Total amount of using water in 2011 is a value estimated by the Ministry of Land, Infrastructure, and Transportation based on current water consumption trends
1560
Figure 2.4 Population changes in rural and urban areas in South Korea. Urban areas are cities which have the population of more than 50,000. The Seoul metropolitan area includes Seoul city, Incheon city, and Gyeonggi province.
48
1565
2.2.3 Environmental Characteristics In South Korea, water quality degradation in river basins has been a main factor influencing policies for water resources. The country is heavily dependent on river basins as the primary water source for human activities (around 90% dependency), which often causes the degradation of water quality [8], such as major drinking water contamination events in the
1570
early 1990s. Based on biochemical oxygen demand (BOD), indicating how fast biological organisms consume oxygen in water (good quality water in a low level, polluted water in a high level), change in water quality of the four main rivers is shown in Figure 2.5. Through intensive construction of treatment facilities in the mid-1990s, the water quality of the four river basins has improved. Water quality improvement has, however, slowed since the 2000s.
1575
The water quality in the Han River has been relatively stable below 1.5 mg/L of BOD concentration, while that in the Nackdong River and the Geum River have been even more variable. The level of water pollution in the Youngsan River has remained high [34]. Non-point source pollution has become main factors of making it harder to manage water quality in the river basins. In particular, there is a large difference in water quality
1580
between up- and downstream areas. Upstream areas of the main river basins have clean water (BOD concentration below 1 mg/L in general). There is a gradual decline in water quality from the midstream (BOD concentration in the range of 1.6 to 2.4 mg/L in general) to downstream areas (BOD concentration in the range of 1.7 to 2.9 mg/L in general) as presented in Figure 2.5 [27,34].
1585
49
Figure 2.5 Change in water quality per year and change in water quality of 2012 between up‐ and downstream areas of the four major river basins.
1590
2.3 Water Policy Reforms in South Korea Due to those physical, socio‐economic and environmental characteristics of water resources in South Korea, it is essentially needed for the country: (1) to mitigate flood risk; (2) to store water for uses in the other seasons; and (3) to protect or conserve water quality in the river basins. These feature in the fact that water policy has been the most important concerns all the
1595
time. The contemporary water governance of the country can be classified into the following periods: (i) the Japanese colonial period from 1910 to 1945; (ii) the postwar recovery period from 1945 to 1959; (iii) the modern river basin governance system development from 1960 to 1989; and (iiii) the comprehensive management of water resources: environment‐friendly river basin development from 1990 to the present (Table 2.2)
1600
Table 2.2 Historical water policy changes and reforms in South Korea. Period Japanese colonial period (1910–1945)
Features Construction of hydropower dams in North Korea for industrial development and irrigation dams in South Korea for land cultivation
50
Problems Mainly focused on stable food and energy provision for the Japanese
Lack of electric power provision due to North Korea’s interruption to power supply after liberation from Japan Postwar recovery period (1945–1950s)
Modern river basin governance system development (1960s–1980s)
Comprehensive management of water resources: environment-friendly river basin development (1990s–present)
Establishment of a 5-year Electric Power Development Plan Construction of 158 new irrigation dams To stabilize energy supply, food production, and economic development Promulgation of River Basin Law focusing on water supply and flood control (1961) Establishment of the Ten-Year Comprehensive Water Resource Development Plan(1966–1975) and Specific Multipurpose Dam Act (1966) Foundation of the Korea Water Resources Development Corporation (1967) Adoption of the first comprehensive river basin development concept with attention to in-land navigation Beginning of broad-scale river basin investigations into the four major river basins (Han, Nakdong, Keum, Youngsan) Revision of the River Basin Law (1971) Formulation of the Four Major River Basin Comprehensive Development Plan (1971–1981) Securing sufficient water supply for urban areas and irrigation projects for rapid economic growth Conversion from a single- to multiple-purposes dam construction Contribution to the development of large urban centers Establishment of the Comprehensive Long-term (1981–2001) Water Resource Development Plan (1980) A sharp rise in water demand and an actual water shortage during 1970s due to rapid industrialization and population growth Construction of additional 249 reservoirs Tap water contamination and other environmental accidents (Trihalomethanes in 1990, Phenol in 1991, etc.) Establishment of a new Long-term Comprehensive Water Resource Development Plan (1991–2011) First putting environment-friendly river basin restoration into water resource policy Promulgation of the Natural Environment Conservation Act (1991) Promotion from the Environment Agency to the Ministry of Environment in charge of tap water and sewage management (1994) Revision of the Long-term Comprehensive Plan for Water Resources (Amended and Supplemented Plan of 1997–2011) A growing concern about shortage of water supply and uncertainty from climate change (severe droughts and flooding) Increase in importance for environment-friendly water resource development and management Revision of the River Basin Law (1999) Changing social demands and a broad diversification in water needs Establishment of Water Vision 2020 (2001–2020) A need for the vision of a new policy paradigm in water resource development, use and consideration Establishment of the First Revision of Water Vision 2020 (2006) The lowest springtime precipitation ever recorded in 2001 Huge flood damage to property and lives by typhoons and torrential rains in 2002 and 2003 Combination of water resource management interests of various government agencies (Ministry of Environment, of Agriculture, and of Industry and Resources) Participation of expert groups from local community, civic,
51
Limited effectiveness of the program and a single purpose development project at regional focus (low population density and predominance of smallscale industry)
Deterioration of water quality in all water basins (high-intensity use of river as a resource utilized for economic growth)
A growing need for improvement and reorganization of water management system and institutions Conflicts over water rights (water supply and quality) between local governments (high- and lowland areas)
and technical organizations in the planning at an early stage Revision of the River Basin Law (2007) Implementation of river basin oriented national land renovation projects (four-river restoration project of 2008–2012) A new national land development paradigm (“low-carbon green growth”) Establishment of the Second Revision of Water Vision 2020 (2011) A growing demand in conservation and restoration of riverine environments, riparian ecosystems, and riverfront parks (recreation)
2.3.1 The Japanese Colonial Period (1910 to 1945) During this period, Japan continued to introduce advanced techniques such as civil engineering for irrigation and hydroelectric dam construction from the US [35] and conducted 1605
an investigation on water resources in major river basins across the country. Based on the research of water resources in the river basins, many large-scale hydropower dams were built in the northern part of Korea to serve industrial development, while many irrigation dams were constructed in the southern part of Korea to support land cultivation. Under Japanese rule, South Korea’s river basin development was based on securing a food supply by
1610
controlling floods and protecting agricultural lands through the river basin investigation and construction of irrigation dams in the river basins. Along with the outbreak of the Second World War in the 1940s, industrial hydropower and consumable water supply became an important matter as the country became more industrially developed. However, in this period, the implementation of a water policy on
1615
the river basin development and management was often a short-term effort. Those efforts under Japanese rule were mainly determined by the need to supply food and heavy industrial manufacturing for their people and the army [36]. 2.3.2 The Postwar Recovery Period (1945 to 1959) Since Korean independence from the Japanese in 1945, in addition to food shortage, South
1620
Korea suffered from insufficient supply of electric power because North Korea stopped the electrical power supply to South Korea, which was about 50% of total power demand in 52
South Korea at that time. To solve such urgent needs for food and power, a five-year Electric Power Development Plan was initiated and new 158 irrigation dams were constructed in river basins to stabilize energy supply, food production and economic development [27,37]. 1625
After the Korean War (1950-1953), the South Korean government also started to look into ways to consume as well as to control water. The effectiveness of the program considering both water control and water use, however, remained at regional focus and was characterized by a single-purpose river basin development project due to a low population density and a predominance of small-scale industries [36]. Nevertheless, this period may be
1630
viewed as a preparatory phase for the next period of comprehensive river basin development after the postwar recovery. 2.3.3 Modern River Basin Governance System Development (1960 to 1990) An organized Korean water management policy framework was initiated with the promulgation of River Basin Law in 1961 [36]. In 1967, the Korea Water Resource
1635
Development Corporation established under the River Basin Law was exclusively responsible for the implementation of the Ten-Year Comprehensive Water Resource Development Plan (1966–1975) and the Specific Multipurpose Dam Act of 1966 mainly aiming at constructing large-size dams for hydro-electric powers [36,38]. Unlike before 1960 characterized as peripheral and small-scale river basin development, in the 1960s, the comprehensive river
1640
basin development concept was first adopted in South Korea along with particular attention to in-land navigation [38], such as broad-scale investigations into the four major river basins, namely the Han, Nakdong, Keum and Youngsan Rivers [37]. The top priorities during 1970s were securing sufficient water supply for industrialization in urban areas and irrigation projects for stable food production [38]. This is
1645
because ensuring water supply for industrial and agricultural uses and reducing damages of 53
floods and droughts became indispensable for facilitating more rapid economic growth [8,36]. The River Basin Law was, accordingly, revised in 1971 to formulate the Four Major River Basin Comprehensive Development Plan (Comprehensive Plan of 1971–1981). The Comprehensive Plan led to the conversion from a single- to multiple-purposes dam 1650
construction (a milestone in the contemporary history of water policy of South Korea) and the critical contribution to the development of the current large urban centres of the country [36]. Rapid industrialization and urbanization, high population growth and agricultural intensification during 1970s led to a sharp increase in water demand, which caused an actual water shortage. In 1980, the Long-term Comprehensive Water Resource development Plan
1655
(1981–2001) was, therefore, commenced: (1) to expand the current dam networks to increase water supplies; and (2) to restore river basins to reduce natural disasters [36]. An additional 249 reservoirs were constructed to fulfill the rise in water demand and the ratio of restoration of the river basins increased from 48.3% in 1979 to 55.4% in 1989 [27]. Since the 1970s, the river basin development including the construction of multi-purpose dams significantly
1660
contributed to modernization of the four major river basins [36]. 2.3.4 Comprehensive Management of Water Resources: Environment-Friendly River Basin Development (1990 to Present) In South Korea, the construction of multi-purposes dams during the last period provided an adequate water supply and contributed to expanding water distribution systems in the 1990s
1665
[36]. Simultaneously, the most visible negative impact during this period is the deterioration of water quality in all water basins in the country due to the high-intensity use of river as a resource utilized for economic growth [38]. Contamination in tap water source and other environmental accidents such as detection of trihalomethanes in 1990, phenols in 1991, heavy metals and poisonous pesticides in 1994, and high levels of bacteria in 1993 and 1997 have
1670
raised many concerns and led to the reluctance of tap water as a drinking water source [39]. 54
The massive uses of chemical fertilizers, insecticides, and pesticides resulting from agricultural intensification in highland regions also contributed to accelerating the problems [13]. Water pollution was identified as one of the most serious environmental issues in South Korea [40] during this period. This led to a new paradigm of the river basin management 1675
policy [8]. Due to a variety of development projects promoted after the establishment of democratic regime in early 1990s, there were frequent conflicts between local governments over water quality deterioration. It sharply increased concerns about environmental issues. Consequently, a new measure for water resource management was required, resulting in a call
1680
for environment-friendly river basin restoration [38]. A new Long-term Comprehensive Water Resource Development Plan (1991–2011) was adopted in 1990, which made the environment-friendly river basin restoration into the water resource policy for the first time [8]. The Environment Administration was, accordingly, promoted to a ministerial level (Ministry of Environment) in 1994 and took charge of tap water and sewage management
1685
[37,41]. The first introduction of the environment-friendly river basin restoration concept, which is completely different from those between 1960s and 1980s, means a lot to South Korea’s water policy reform. At the planning stage of river basin restoration projects in this period, however, local authorities rarely considered improvement of ecological values of the river [38].
1690
In 1994, the National Land Use and Management Act facilitating land development around the Paldang Lake of the Han River basin, which is the main source of water supply for the Seoul metropolitan area considerably accelerated water quality deterioration [18,42]. Despite subsequent efforts of the Korean government to control water quality and quantity, the unsatisfactory results were continually derived [43]. The Han River Law was established
1695
in 1999 to improve water quality and manage drinking water sources and to support 55
communities in highland areas of the Han River Basin for compensation as an economic incentive to reduce the amount of chemical uses. This led to the introduction of an additional water use charge that downstream residents have to pay [33]. Water users of downstream areas such as Seoul city, Incheon city, and 25 districts of Gyeonggi-do, who were supplied 1700
with raw or purified water from upstream water conservation zones in 11 districts of Gyeonggi-do, Gangwon-do, and Chungcheongbuk-do, pay for this charge to compensate upstream communities and their people for regulating economic activities (e.g., housing and highland agriculture). Due to uncertainty about climate change, e.g., possible severe droughts and/or
1705
flooding which would inhibit economic growth, and the growing importance of environmentfriendly river basin restoration, the Long-Term Comprehensive Plan for Water Resources (Amended and Supplemented Plan of 1997–2011) was revised in 1996 [36]. The 1999 revised River Basin Law envisaged an overall improvement in national developmental planning. Nevertheless, the policies were implemented with skepticism, continued concerns about the
1710
safety of tap water, and conflicts over water rights along the river basins [37]. In 2000, new water policy strategies and specific plans were required to implement the vision of a new policy paradigm in considering the river basin development, use and conservation [36]. Revision of the River Basin Law in 1999 confronted changing social demands and a broad diversification in water needs. Accordingly, the Water Vision 2020
1715
(2001–2020) was established in 2001 with the contents of allowing efficient river basin restoration to deal with unusual droughts and floods, limited water resources, and water pollution [27,36]. Based on the River Basin Law revised in 1999, the Comprehensive Longterm Water Resource Plan, which is established every 20 years and reviewed every five years, became the water policy with a top priority in securing stable water resources and efficient
1720
use, development, and preservation of river basins [27]. However, river basin restoration 56
projects involving too much emphasis on engineering of water flow (dam-oriented construction), and ignoring stakeholder participation in decision-making, were still dominant during this period [38]. This, as a result, led to conflicts over the environmental suitability of dam construction and the decision-making process for national water resources plans [44]. 1725
Rapid environmental, social and economic changes after the turn of the century triggered changes in the Water Vision 2020 even as early as in 2001. The lowest springtime precipitation was ever recorded in 2001, leading to severe droughts that were unprecedented in history. Secondly, the typhoons and torrential rains in 2002 and 2003 resulted in extensive flood damage in terms of property and lives around the country. Strong demand for adequate
1730
water resource management forced the Water Vision 2020 to be revised in 2006. The longand mid-term water resource management concerns of various government agencies in the Ministry of Environment, Ministry of Agriculture, and Ministry of Industry and Resources, were to be combined. Furthermore, expert groups from local communities, civic, and technical organizations were able to participate in the river basin restoration planning at an
1735
early stage [36]. In spite of many regional river restoration projects with diverse forms of partnership, it was rare to find a special ordinance to define the role, structure, organization, and finance [38] which plays a vital role in the water resource management [23]. There was also a limit to a bottom-up approach to creation of a vision which not only shows what the regional water policy might look like and how it can work for the community [45], but also
1740
motivates local residents to participate in water project voluntarily [38]. Since the mid-2000s, climate change has been the most urgent issue in water management. With the River Basin Law revision in 2007, national efforts to ensure stable supply of water resources despite climate change have been addressed in the Long-term Comprehensive Water Resource Plan. The Korean government conducted river basin oriented
1745
national land renovation projects (four-river restoration project) along with a new national 57
land development paradigm (low-carbon green growth) [27]. As life quality improves with higher standards of living, a growing demand has arisen for the conservation of riverine environments, restoration of riparian ecosystems, and recreation which is being provided in riverfront parks. Based on this growing water demand, the Water Vision 2020 was second 1750
revised in 2011 [36]. Nevertheless, there are still growing challenges for improvement and reorganization of water management system and institutions to mitigate or resolve conflicts over water quality and supply between local governments. Despite Korean continuous water policy changes and reforms over 100 years, those
1755
physical, environmental and socio-economic challenges such as uncertainty about climate change (flooding and droughts), rapidly rising water use and water scarcity due to economic growth (industrialization and urbanization) impede sustainable socio-economic development and accelerate water quality deterioration, consequentially increasing the vulnerability of ecosystems (agricultural intensification in highland areas) in the river basins. Forming an
1760
integrative water resources management system at the river basin is, thus, crucial for ensuring the sustainable development (water use efficiency) and ecological security (conservation or improvement of ecosystem services) of river basins (Figure 2.6).
58
1765
Figure 2.6 South Korea’s water policy reforms and their implications for future water policy making.
2.4 Challenges for Water Policy in South Korea The challenges in managing water resources are neither homogenous nor constant over time [46,47]. While many risks and uncertainties are predictable, it is hard to derive the exact 1770
magnitude and reliable implications in terms of water management and other associated impacts [48]. Although many changes in water policies have been undertaken in South Korea, and other countries, there are still many challenges that need to be solved. These include environmental, physical and socio-economic challenges.
59
1775
2.4.1 Environmental and Physical Challenges 2.4.1.1 Damage to Water Quality and Ecosystems of River Basins The seasonal and regional characteristics of water resources in South Korea such as the concentration of approximately 69% of the annual precipitation in the middle of summer monsoon and typhoon [27] and large differences in precipitation along river basins [28,29]
1780
represent environmental challenges to make the country highly vulnerable to seasonal oscillation between floods and droughts, which make water quality worse and threaten ecosystems. Moreover, the renewable water resources of South Korean is at 1553 m3 per person per year which accounts for around 72.9% of that of China (2130 m 3) and around 48.1% of
1785
that of Japan (3232 m3), and considerably lower (18.5%) than that of the global average (8372 m3) [26]. This result shows that despite abundant precipitation, Korean water conditions are still poor due to dense population in its limited land space. Concentration of the population in large cities, including the Seoul metropolitan area, together with the regional variations in precipitation has often led to severe regional differences in renewable water resources per
1790
person per year. The Han River basin accommodating the Seoul metropolitan area has the lowest volume of local renewable water resources per person (annual average 907 m3 of renewable water resources during 1968–2007) compared with the other three major river basins [23]. Since 1999, chemically contaminated and turbid water problems have continuously
1795
occurred along the Han River Basin due to heavy rains. For example, the heavy rains during Typhoon Ewiniar in 2006 led to the export of massive quantities of sediments to the Soyang Lake and, in turn, led to long-term turbid water discharge problems along the Han River Basin [19] when high soil erosion occurred in mountainous agricultural areas. Consequently, 60
it has caused frequent conflicts over the responsibility for water quality management among 1800
up-, mid-, and downstream along the river basin. In South Korea, floods and droughts appear to be intensified over time and occur more frequently due to environmental and physical challenges caused by climate change. This, thus, causes serious socio–economic losses, environmental damages, and difficulty in managing water resources systems which result in changes in the hydrologic cycle and water availability
1805
[49]. In particular, regional and seasonal variations in precipitation have had negative impacts on water quality and the ecosystems in river basins. The damage to water environments causes conflicts over water rights between up- and downstream areas [19,50]. 2.4.1.2 Regional Water Use Conflict Due to the seasonal and regional variation in renewable water resources in South Korea, dam
1810
construction was adopted as the prime means for flood control and water supply and was planned particularly in the upstream areas of main rivers for water delivery to support the expansion of downstream urban and industrial areas [23]. The multi-purposes dams have contributed to urban and industrial water supply (10.9 billion m3, 32.7%) of the total water supply capacity (33.3 billion m3), and flood control (2.2 billion m3, 3.9%) of the total
1815
discharge (56.0 billion m3) is held back during the flooding period (Table 2.3) [27]. Table 2.3 Current status of dams in South Korea. Classification (million m3/Year) Multipurpose Hydroelectric Water supply Estuary
Number of Dams 15 12 19 12
12,588.9 1793.8 609.0 1258.3
Flood Control 2197.6 266.0 23.5 0.0
Water Supply 10,883.1 1335.0 880.5 2930.0
Irrigation Irrigation reservoir Flood control
6 17,643 1
2801.8 2457.0 2630.0
19.0 0.0 2630.0
2742.0 2457.0 0.0
Total
17,708
24,138.8
5136.1
21,227.6
Total Water Storage
61
Nevertheless, recent trends in precipitation variability along with economic growth intensify vulnerability to water pollution as well as damage from natural disasters, and lead to an increased need for a new water quality management system [51]. Moreover, conflicts over 1820
water-related issues, in particular frequent disputes between local governments in up- and downstream areas about the effectiveness of water use charges for water quality improvement shows that existing water quality management policies which the Korean government implements are facing challenges [19,29]. Conflicts over water rights between up- and downstream areas in South Korea have
1825
increasingly occurred despite governmental implementation of diverse measures for water quality improvement, e.g., a water use charge based on the beneficiary (or user) pays principle [18,50]. In particular, the inflow of agro-chemically contaminated turbid water caused by heavy rain at highland dry fields to the Han River Basin has exacerbated water quality problems [19,24,52]. The water use charge gradually increased from South Korean
1830
won (KRW) 80 per m3 in 1999 to KRW 170 per m3 in 2012 and has been maintained at this level up to now in 2016 [18,53]. The residents in downstream areas argues that the water use charge should be reduced or abolished, while upstream residents insist that overlapping regulations in the upstream areas should be eliminated and compensation for water quality improvement in the Han River basin should increase [18].
1835
There is, accordingly, a growing need for a new allocation system of costs and benefits related to water supply and quality improvement. However, an important obstacle to attain the goals around the world has been the failure to adequately address financial challenges such as the costs of attaining goals, how to achieve lower costs and more efficiency, matching costs with available resources, which framework for and how to
1840
implement the cost-benefit sharing [54]. It is obvious that economic instruments based on economic analysis of water uses such as water pricing play a vital and very effective role in 62
financing water resources management. However, additional issues caused by applying the economic instruments such as the role of private sectors (all stakeholders) and how to elicit benefits from water services that are not traded in real markets should be considered in a 1845
practical approach on a case-by-case basis. In South Korea, the Han River basin is a major drinking water source and provides many tangible and intangible benefits to its mid- and downstream (the Seoul metropolitan) areas. Based on the benefits provided by the basin, the mid- and downstream areas have been economically developed while the upstream areas have not. Despite the implementation of the
1850
water use charge to support communities and their people in the upstream areas, some problems regarding equal distribution of the benefits of using water resources between river basin stakeholders remain [55,56]. It is necessary to pay close attention to upstream areas’ roles as a provider of water services such as protection or conservation of water resources and ecosystems, along with provision of a safe and stable water supply to the mid- and
1855
downstream areas. These opportunity costs that the upstream areas lose by the regulations should be compensated [55] based on the provider gets principle, i.e., payment for ecosystem services [57,58]. To minimize negative effects caused by conflicts over water rights between local communities, it is obvious that a broader stakeholder involvement is needed in planning and decision-making of policies related to water rights [38].
1860
2.4.2 Socio-Economic Challenges 2.4.2.1 Rapid Rise in Water Use as Economic Growth Rapid industrialization, urbanization and population growth in urban and industrial areas around the four major river basins contributed to not only changing water environment such as intensive construction of water service systems to support the expanding Seoul
63
1865
metropolitan areas and industrial cities, but also deepening the socio-economic gap between urban and rural areas [33]. In particular, the striking population shift from rural to urban areas has been very significant for notable changes that have occurred in the socio-economic structure of South Korea. In particular, the high population density in relatively small areas results in extremely
1870
high local demand for water, that is, one of the crucial infra-structural inputs, which enhances the productivity of capital, labor, and other factors necessary for socio-economic development [59,60], with substantial influence on the planning for flood control and necessitating special measures to supply water year-round. It increased the need for construction of new water supply systems [50]. As a result, industrialization, urbanization and population growth
1875
triggered a sizeable increase in total water use by five times (5.1 billion m3 in 1965 to 25.7 billion m3 in 2011) (Figure 2.3) and have influenced strikingly the amount of water resource consumption and its pattern [60,61]. According to the second revised version of the Water Vision 2020 (2011–2020) [27], the total amount of water being used will continue to increase by an average of 1.2% per year
1880
based on current water consumption trends. Therefore, the stabilization of water demand would be one of the main drivers of the policy change and reform of South Korea’s water sector, causing shift from the development of new water resources to water demand control [23]. 4.2.2 Inadequate Water Pricing Mechanism
1885
During the recent decades, the national average water charge has risen on the average by 5.4% per year, from KRW (South Korean won) 211 per m3 in 1991 to KRW 660 per m3 in 2013, in proportion to the tap water by 5.6% per year, between KRW 260 per m3 in 1991 and KRW 849 per m3 in 2013. Nevertheless, the average water charge, which is different among 64
domestic, industrial, and other uses, covers only part (77.8% in 2013) of the production costs 1890
as shown in Figure 2.7. Water is priced without considering a full cost recovery principle, and environmental externalities are not taken into account. In particular, the domestic water use during a year of 2013 accounted for 63.5% (3.26 billion m3) of the total tap water consumption (5.13 billion m3), which is the highest proportion in use, while the rate of recovering production costs via the domestic water charge (KRW 482.8 per m3) is the lowest
1895
(56.8%) [62]. More seriously, the proportion of recovered production costs in the water utility bills has decreased on average by 1.2% per year, from 89.3% in 2003 to 77.8% in 2013. On the other hand, the daily water use per capita has increased from 265 L in 1998 up to 282 L in 2013 as illustrated in Figure 2.7 [62]. As stated in Kim (2013) [63], the Korean daily water
1900
use per capita is 1.2 times higher than that of the UK, 2 times than that in France and Germany, and 2.5 times than that in Denmark. The Korean low average water charge is most likely to result in excessive water use. Park and Choi (2006) [64] recently estimated the price of elasticity of water for domestic use using data from 176 local governments. As a result, the price coefficients ranged from -0.048 to -0.052, which means, if the
1905
price rises by 10%, water demand falls by around 0.5%. This value is lower than those of previous studies such as Jeon et al. (1995) [65], Kim (1996) [66], Gwack et al. (2002) [67]. Nevertheless, the water price can apparently contribute to managing water demand. First, it is true that a rise in the water price has an effect on water saving. Annual domestic water use is around 7.0 billion m3. Based on the price elasticity of -0.05, around 3.5 hundred million m3
1910
per year can be saved through the price increase. Despite the low price coefficients, considering attributes of water resources for which there is no substitute and recent continuous increase in water supply (production) costs, the water price would be a significantly effective tool to manage water demand. Conversely, the low water price can 65
contribute to increasing water use continuously and eventually has negative impact on water 1915
quality in the rivers [63]. Along with the dam development for water distribution between regions, the Korean government has continued investment in the multi-regional water supply system, resulting in increase in the water supply ratio (percentage of the population who has running water) from 16.8% in 1960 to 98.5% in 2013 (Figure 2.7) [63]. A continually rising water demand as well
1920
as outdated water management facilities in South Korea is, nevertheless, expected not only to intensify the imbalance between water supply and demand under the influences of climate change, but also to cause difficulties in mitigating uncertain water quality changes. Rational water pricing for the effective use and management of water in South Korea, e.g., water saving and environmental conservation, has become a key social and political issue
1925
due to the effects of climate change. The water charge, in particular, remains below the production cost [63]. Additionally, there is resistance of many Koreans to an increase in the water charge due to deep perception of water as a public good and of more governmental responsibilities for water distribution and use [68]. Experiences from other countries indicate that it is needed for South Korea to have a better water pricing system. The funds secured
1930
through appropriate water utility billing should then be used to support the water welfare of low income households as well as stakeholders in upstream areas where economic activities are restricted to ensure water quality protection in large reservoirs. Furthermore, support is required to invest in and improve water-related infrastructure, e.g., upgrading water processing facilities. Rational water pricing, which fully considers the cost of supply is
1935
critically necessary not only to obtaining funds for maintenance and development of waterrelated facilities, but also for saving water and effectively improving water quality in general [63] (Table 2.4).
66
1940
Figure 2.7 The proportion of water supply (percentage of the population who has running water), recovering production costs via the water utility bills, the amount of water leaking from outdated water pipe networks, and per capita daily water use of South Korea Table 2.4 Challenges and implications of Korean water policy. Challenges Conflicts over water quality and supply between local governments in highversus lowland areas
Implications Need for a new sharing criterion of benefits and costs from water quality policy (e.g., water use charge) between highand lowland areas Application of the provider gets principle considering provision of environmental services (payment for ecosystem services)
Inadequate water pricing mechanism (outdated water facilities, inefficient water demand and quality management)
Rational water pricing recovering the production costs based on the full cost recovery principle to effectively use and manage water Supporting low income households and the upstream areas damaged from dam construction and economic restrictions that result in the process of water quality protection Improving outdated water facilities and strengthening efficient water use and demand management (water saving, environment conservation)
67
1945
2.5 Concluding Remarks Monitoring and development of water resources have been important considerations in South Korea for over 100 years from the Japanese colonial period up to now. The characteristics of water availability and supply have been influenced by environmental changes as well as longterm shifts in social-economic factors. South Korea has developed water management policies
1950
through continuous response to such surrounding conditions above and must be viewed as a series of stepwise reforms. Nevertheless, persistent and new water challenges emerge, including a growing demand for water due to economic growth, the need for an acceptable water quality in many regions, insufficient and ineffective practical implementation of the water management system, and uncertainties due to climate change. As noted by Juliet et al.
1955
(2011) [6], the water management reforms in some foreign countries (South Africa, Australia, European Union countries, and Russia) have introduced innovative approaches to better cope with their water challenges, emphasizing soft-path water solutions that address inequitable water policies which are influencing ecosystems and the natural resource base. These include efficient water use and conservation, rational water pricing, provider gets principle (payment
1960
for ecosystem services), and additional aspects of public participatory water management. Examining the characteristics of water resources in South Korea, we demonstrate that South Korea is facing four major challenges in the water management policy and should reassess management approaches. First, water resource policy must confront the risks and uncertainties associated with climate change. Regional and seasonal differences in
1965
precipitation and in renewable water resources have resulted in droughts during the dry season (winter and spring, November-May) as well as flooding during the rainy season (summer monsoon and typhoon, June-September). Second, rapid industrialization, urbanization and population growth, particularly in the Seoul metropolitan area, have resulted 68
in remarkable changes in the socio-economic structure and pattern of water consumption. To 1970
provide adequate supply, many dams were constructed in the upstream areas of main river basins to store water for flood control, to generate electricity, and to stabilize water supply to the mid- and downstream areas. However, the supply has an upper limit and negative externalities, e.g. loss of riparian habitat, submergence of usable valley land, and water quality deterioration due to the need for highland farming on mountain slopes, have not been
1975
adequately compensated. Thus, a third need, namely maintenance of the system as well as compensation for externalities, is not appropriately supported by water use charges and water utility charges, which covers only about 80% of the production cost. Finally, water quality improvement in the four major river basins has slowed in recent years despite continuous investment in environmental treatment facilities after the environmental crises that occurred
1980
in the early 1990s. Non-point source pollution, such as the inflow of contaminated turbid water caused by heavy rain in the upstream highland dry fields has become a main cause of water quality degradation and has caused conflicts over water rights between local governments in highland versus lowland areas. In agreement with measures taken in other countries, we suggest that rational water
1985
utility pricing must be applied based on the full cost recovery principle to effectively use and manage water. The funds secured by recovering the production costs should be used: (1) to support low income households and the upstream areas damaged by dam construction as well as the economic restrictions that result in the process of water quality protection; (2) to improve outdated water facilities; and (3) to strengthen efficient water use and demand
1990
management. Secondly, there is a need for a new sharing criterion on benefits and costs of water quality policies (e.g., water use charge) between up and downstream areas based on the provider gets principle considering provision of environmental services (payment for ecosystem services). 69
Long-term problem solutions require greater investments, more technology, higher 1995
human capacities and intensified co-operation between countries, sectors, organizations and different societal strata. Therefore, plans to address the risks, uncertainties and conflicts over water will require new integration and further reforms of the institutions, laws and organizations responsible for managing water resources in South Korea.
2.6 Acknowledgments 2000
This study was carried out as part of the International Research Training Group TERRECO (GRK 1565/1) funded by the German Research Foundation (DFG) and the University of Bayreuth in the funding program Open Access Publishing, Germany.
2.7 References 2005
1. Baron, J.S.; Poff, N.L.; Angermeier, P.L.; Dahm, C.N.; Gleick, P.H.; Hairston, N.G.; Jackson, R.B.; Johnston, C.A.; Richter, B.D.; Steinman, A.D. Meeting ecological and socieal needs for freshwater. Ecol. Appl.2002, 12, 1247–1260. 2. Vugteveen, P.; Lenders, H.J.R. The duality of integrated water management: Science, policy or both? J. Integr. Environ. Sci. 2009, 6, 51–67.
2010
3. Araral, E.; Wang, Y. Water demand management: Review of literature and comparison in South-East Asia. Int. J. Water Resour. Dev. 2013, 29, 434–450. 4. Nguyen, T.T.; Ruidisch, M.; Koellner, T.; Tenhunen, J. Synergies and tradeoffs between nitrate leaching and net farm income: The case of nitrogen best management practices in South Korea. Agric. Ecosyst. Environ.2014, 186, 160–169.
2015
5. Organization for Economic Co-Operation and Development (OECD). Meeting the Water Reform Challenge; OECD Publishing: Paris, France, 2012. 6. Juliet, C.S.; Gleick, P.H.; Cooley, H. Chapter 7: U.S. Water Policy Reform. In The World’s Water: The Biennial Report on Freshwater Resources; Gleick, P.H., Ed.; Island Press: Washington, DC, USA, 2011; pp. 143–155.
2020
7. Quevauviller, P. European water policy and research on water-related topics—An overview. J. Hydrol. 2014, 518, 180–185.
70
8. Kim, K.U.; Koh, J.K.; Lee, M.H. The Dynamics of Water Policy Change in South Korea. 2007. Availableonline: http://www.newater.uniosnabrueck.de/caiwa/data/papers%20session/F1/KoUn%20Kim%20et% 20al%202007.pdf (accessed on 17 January 2017). 2025
9. Luan, I.O.B. Singapore Water Management Policies and Practices. Int. J. Water Resour. Dev. 2010, 26, 65–80. 10. Rees, J.A. Regulation and private participation in the water and sanitation sector Nat.Resour. Forum 1998, 22, 95–105.
2030
11. Seppälä, O.T. Effective water and sanitation policy reform implementation: Need for systemic approach and stakeholder participation. Water Policy 2002, 4, 367–388. 12. Han, S.Y.; Kwak, S.J.; Yoo, S.H. Valuing environmental impacts of large dam construction in Korea: An application of choice experiments. Environ. Impact Assess. Rev. 2008, 28, 256–266.
2035
13. Nguyen, T.T.; Hoang, V.N.; Seo, B. Cost and environmental efficiency of rice farms in South Korea. Agric. Econ. 2012, 43, 369–378. 14. Organization for Economic Co-Operation and Development (OECD). Evaluation of Agricultural Policy Reforms in Korea; OECD Publishing: Paris, France, 2008. 15. Cho, C.J. The Korean growth-management programs: Issues, problems and possible reforms. Land Use Policy 2002, 19, 13–27.
2040
2045
16. Kwak, S.J.; Russell, C.S. Contingent valuation in Korean environmental planning: A pilot application to the protection of drinking water quality in Seoul. Environ. Resour. Econ. 1994, 4, 511–526. 17. Labadie, J.W.; Fontane, D.G.; Lee, J.H.; Ko, I.W. Decision support system for adaptive river basin management: Application to the Geum River basin, Korea. Water Int. 2007, 32, 397–415. 18. Kim, K.M. Improvement of the Han River Watershed Management Fund Policies; National Assembly Research Service (NARS) Issue Report 160; NARS: Seoul, Korea, 2012.
2050
19. Shin, H.J.; Jeon, C.H.; Choi, I.C.; Yeon, I.C. Estimation of beneficiary’s willingness to pay in mid and down-stream area to the water quality improvements in upper Bukhan River Basin. Seoul Stud. 2009, 10, 91–106. (In Korean) 20. Moore, M.L.; von der Porten, S.; Plummer, R.; Brandes, O.M.; Baird, J. Water policy reform and innovation: A systematic review. Environ. Sci. Policy 2014, 38, 263–271. 21. Wheida, E.; Verhoeven, R. The role of “virtual water” in the water resources management of the Libyan Jamahiriya. Desalination 2007, 205, 312–316. 71
2055
22. Wilder, M. Water governance in Mexico: Political and economic apertures and a shifting state-citizen relationship. Ecol. Soc. 2010, 15, 22. 23. Min, K.J. The Role of the State and the Market in the Korean Water Sector: Strategic Decision Marking Approach for Good Governance. Doctor’s Thesis, University of Bath School of Management, Bath, UK, January 2011. Water 2017, 9, 717.
2060
2065
24. Kim, J.K.; Jung, S.; Eom, J.S.; Jang, C.; Lee, Y.; Jeffrey, S.O.; Jung, M.S.; Kim, B. Dissolved and particulate organic carbon concentrations in stream water and relationships with land use in multiple-use watersheds of the Han River (Korea). Water Int. 2013, 38, 326– 339. 25. Sampson, M. Geomorphoology. In North Korea: A Geographic Overview; Palka, E.J., Galgano, F.A., Eds.; West Point: New York, NY, USA, 2002; pp. 23–29. 26. Ministry of Land, Infrastructure and Transportation of Korea (MOLIT) & Korea Water Resources Corporation (K-water). Water for the Future: Water and Sustainable Development; K-Water: Daejeon, Korea, 2015.
2070
27. Ministry of Land, Infrastructure and Transportation of Korea (MOLIT). (2011–2020): Water Vision 2020 [The Long-Term Comprehensive Water Resource Plan (2011–2020): The Second Revised Water Vision 2020]; MOLIT: Sejong, Korea, 2011. (In Korean) 28. Koo, J.H.; Yoon, J.Y.; Sim, K.H.; Cho, H.K. A counterfactual assessment for interagency collaboration on water quality: The case of the Geum River basin, South Korea. Water Int. 2015, 40, 664–688.
2075
2080
29. Lee, J.S. Measuring the economic benefits of the Youngsan River Restoration Project in Kwangju, Korea, using contingent valuation. Water Int. 2012, 37, 859–870. 30. Statistics Korea (KOSTAT), South Korea. National Account [Data Set]. 2015. Available online: http://kosis.kr/eng/statisticsList/statisticsList_01List.jsp?vwcd=MT_ETITLE&parentId=L#Su bCont (accessed on 1 April 2016). 31. The Bank of Korea (ECOS), South Korea. National Account [Data Set]. 2015. Available online: https://ecos.bok.or.kr/ (accessed on 2 April 2016).
2085
32. Statistics Korea (KOSTAT), South Korea. The Population and Housing Census [Data Set]. 2015. Available online: http://kosis.kr/statisticsList/statisticsList_01List.jsp?vwcd=MT_ZTITLE&parentId=A#SubCo nt (accessed on 1 April 2016). 33. Choi, J.; Hearne, R.; Lee, K.; Roberts, D. The relation between water pollution and economic growth using the environmental Kuznets curve: A case study in South Korea. Water Int. 2015, 40, 499–512. 72
2090
34. National Institute of Environmental Research (NIER). 2012 National Water Quality Assessment; NIER: Incheon, Korea, 2013; (In Korean). Available online: http://webbook.me.go.kr/DLi-File/NIER/09/018/5552633.pdf (accessed on 10 May 2016). 35. Deason, J.P.; Shad, T.M.; Sherk, G.W. Water policy in the United States: A perspective. Water Policy 2001, 3, 175–192.
2095
2100
36. Oh, B.H. 2012 Modularization of Korea’s Development Experience: Korea’s River Basin Management Policy; Korea Development Institute School of Public Policy and Management: Seoul, Korea, 2013. 37. Yoon, S.Y. The water resource policy in South Korea. Water Future 2004, 37, 70–76. (In Korean) 38. Lee, S.; Choi, G.W. Governance in a river restoration project in South Korea: The case of Incheon.Water Resour. Manag. 2012, 26, 1165–1182. 39. Um, M.J.; Kwak, S.J.; Kim, T.Y. Estimating willingness to pay for improved drinking water quality using averting behavior method with perception measure. Environ. Resour. Econ. 2002, 21, 287–302.
2105
40. Organization for Economic Co-operation and Development (OECD). Environmental Performance Review; OECD Publishing: Paris, France, 2006. 41. Lee, S. Comparative research on river basin management in Korea and Japan. Korea Rev. Int. Stud. 2011, 14, 3–17. 42. Woo, H.; Kim, W. Floods on the Han River in Korea. Water Int. 1997, 22, 230–237.
2110
43. Kim, K.; Kim, K.; Yoo, C. Decision of minimum rain gauge density in a combined radarrain gauge rainfall observation system: A case study of the Imjin River Basin, Korea. Water Int. 2010, 35, 49–62. 44. Song, Y.I.; Park, D.; Shin, G.; Kim, C.; Grigg, N.S. Strategic environmental assessment for dam planning: A case study of South Korea0s experience. Water Int. 2010, 35, 397–408.
2115
45. Palmer, M.A.; Bernhard, E.S.; Allan, J.D.; Lake, P.S.; Alexander, G.; Brooks, S.; Carr, J.; Clayton, S.; Dahm, C.N.; Follstad Shah, J.; et al. Standards for ecologically successful river restoration. J. Appl. Ecol. 2005, 42, 208–217. 46. Biswas, A.K. Integrated water resources management: A reassessment. Water Int. 2004, 29, 248–256.
2120
47. Biswas, A.K. Integrated water resources management: Is it working? Int. J. Water Resour. Dev. 2008, 24, 5–22. 48. Biswas, A.K. Water policies in the developing world. Int. J. Water Resour. Dev. 2001, 17, 489–499. Water 2017, 9, 717 20 of 20
73
2125
49. Intergovernmental Panel on Climate Change. (IPCC). Climate Change 2007: The Physical Science Basis: Contribution of the Working Group I to the Fourth Assessment Report of the IPCC; Cambridge University Press: Cambridge, NY, USA, 2007. 50. Kim, Y.J.; Jeong, U.S. Water Resources: Their Current State and Assessment; Research Report: Working Paper 2011-01; Korea Environment Institute: Seoul, Korea, 2011.
2130
51. Lee, G.Y.; Bae, I.H. A Study on the Strategies of Acquiring Water Resources by Using Wells Near Surface Water; Policy Research Projects 2008-11; Gyeonggi Research Institute: Suwon, Korea, 2008. 52. Kim, B.; Choi, K.; Kim, C.; Lee, U.; Kim, Y.H. The effect of summer monsoon on the distribution and loading of organic carbon in a deep reservoir, Lake Soyang, Korea. Water Res. 2000, 34, 3495–3504. 53. Seoul Metropolitan Government (SMG). 2013 White Paper for Improvement of Water Use Charge; SMG: Seoul, Korea, 2014. (In Korean)
2135
54. Organization for Economic Co-operation and Development (OECD). Feasible Financing Strategies for Water Supply and Sanitation; OECD Publishing: Paris, France, 2007. 55. Choi, I.C.; Kim, H.N.; Shin, H.J.; Tenhunen, J.; Nguyen, T.T. Willingness to Pay for a Highland Agricultural Restriction Policy to Improve Water Quality in South Korea: Correcting Anomalous Preference in Contingent Valuation Method. Water 2016, 8, 547.
2140
2145
56. Shin, H.J.; Kim, H.N.; Jeon, C.H.; Jo, M.H.; Nguyen, T.T.; Tenhunen, J. Benefit transfer for water management along the Han River in South Korea using Meta-Regression Analysis. Water 2016, 8, 492. 57. Hanley, N.; Kirkpatrick, H.; Simpson, I.; Oglethorpe, D. Principles for the provision of public goods from agriculture: Modeling moorland conservation in Scotland. Land Econ. 1998, 74, 102–113. 58. Mauerhofer, V.; Hubacek, K.; Coleby, A. From polluter pays to provider gets: Distribution of rights and costs under payments for ecosystem services. Ecol. Soc. 2013, 18, 41.
2150
59. Dupont, D.P.; Renzetti, S. The role of water in manufacturing. Environ. Resour. Econ. 2001, 18, 411–432. 60. Yoo, S.H. Urban Water Consumption and Regional Economic Growth: The Case of Taejeon, Korea.Water Resour. Manag. 2007, 21, 1353–1361. 61. Yoo, S.H.; Yang, C.Y. Role of water utility in the Korean national economy. Int. J. Water Resour. Dev. 1999, 15, 527–541.
2155
62. Ministry of Environment of Korea (MOE). Statistics of Waterworks 2013; MOE: Sejong, Korea, 2014. 74
63. Kim, K.M. The Standard for the Water Supply Fare and Problems on the Current Rate Base; NARS Report: Recent Publications; National Assembly Research Service: Seoul, Korea, 2013; Volume 709. 2160
64. Park, D.H.; Choi, H.J. Panel Estimation of Price Elasticities on Residential Water Demand in Korea. J. Korean Soc. Water Wastewater 2006, 20, 527–534. 65. Jeon, C.H.; Yeom, M.B.; Hong, S.P. A Study on Investment Costs Sharing of Multiregional Water Supply Facilities; K-Water: Daejeon, Korea, 1995.
2165
66. Kim, G.I. Am Estimation Model of Water Demand; Korea Environmental Technology Research Institute: Seoul, Korea, 1996. Available online: http://webbook.me.go.kr/DLiFile/F000/149/14976_27193.pdf (accessed on 26 August 2017). 67. Kwak, S.J.; Lee, C.K. Estimating the Demand for Domestic Water in Seoul: Application of the Error Correction Model. Environ. Resour. Econ. Rev. 2002, 11, 81–98.
2170
68. Mun, H.J.; Kang, H.S.; Yoon, S.J. A Study on Policies Improving the Perception of Rational Water Use; Research Reports: Project Reports 2013-02-02; Korea Environment Institution: Seoul, Korea, 2013.
75
Chapter 3: Willingness to Pay for a Highland Agricultural Restriction 2175
Policy to Improve Water Quality in South Korea: Correcting Anomalous Preference in Contingent Valuation Method Ik-Chang Choi 1, Hyun-No Kim 2, Hio-Jung Shin 3*, John Tenhunen
1
and Trung
Thanh Nguyen 4 1
2180
Bayreuth Center of Ecology and Environmental Research, University of Bayreuth, 95440
Bayreuth,
Germany;
[email protected]
(I.-C.C.);
john.tenhunen@uni-
bayreuth.de (J.T.) 2
Environmental Policy Research Group, Korea Environment Institute, 30147 Sejong, Korea;
[email protected] 3
2185
Department of Agricultural and Resource Economics, Kangwon National University, 24341
Chuncheon, Korea 4
Institute for Environmental Economics and Word Trade, University of Hannover, 30167
Hannover, Germany;
[email protected] * Correspondence:
[email protected]; Tel.: +82-33-250-8667
2190
Abstract: This study examines the willingness to pay (WTP) for the highland agriculture restriction policy which aims to stabilize the water quality in the Han River basin, South Korea. To estimate the WTP, we use a double-bounded contingent valuation method and a random-effects interval-data regression. We extend contingent valuation studies by dealing with the potential preference anomalies (shift, anchoring, and inconsistent response effects).
2195
The result indicates that after the preference anomalies are corrected, the statistical precision of parameter estimates is improved. After correcting the potential preference anomalies, estimated welfare gains are on average South Korean currency (KRW) 2,861 per month per household. Based on the WTP estimate, the total benefits from the land use restriction policy 76
are around KRW 297.73 billion and the total costs are around KRW 129.44 billion. The net 2200
benefit is, thus, around KRW 168.29 billion. This study suggests several practical solutions that would be useful for the water management. First, a priority should be given to the valid compensation for the highland farmers’ expected income loss. Second, it is necessary to increase in the unit cost of the highland purchase. Third, wasted or inefficiently used costs (e.g., overinvestment in waste treatment facilities, and temporary upstream community
2205
support) should be transferred to the program associated with high mountainous agriculture field purchase. Results of our analysis support South Korean legislators and land use policy makers with useful information for the approval and operationalization of the policy.
3.1 Introduction 2210
Degradation of water quality is an ongoing issue for water resource users between high- and lowland areas [1]. Due to leaching of agrochemicals and the export of sediments caused by agricultural intensification in the highland areas, water pollution is very common along the river basin in East and Southeast Asian countries [2–7]. This results in degrading water quality, threatening aquatic ecosystems in downstream areas [8,9].
2215
In the highland areas of the Han River basin, South Korea which is the primary source of drinking water supply to the Seoul metropolitan area of South Korea, agriculture is dominated by vegetable (e.g., Chinese cabbage and radish) production and is characterized by a high level of chemical fertilizer inputs [10]. Because of the intensive use of agricultural chemicals, in particular nitrogen and phosphorous being the main pressures dominating the
2220
ecological status of the basin [11], they have been identified as hotspots of non-point pollution due to soil erosion accelerated by the monsoon climate, which causes deterioration of the important freshwater resources [12,13]. Even though several measures including the 77
introduction of a water use charge (water users in downstream areas such as Seoul, Incheon, and part of Gyeonggi-do that are supplied with water from upstream water source protection 2225
zones such as part of Gyeonggi-do, Gangwon-do, and Chungcheongbuk-do of the Han River basin have to pay), which has been increased from KRW 80 per cubic meter in 1999 to KRW 170 per cubic meter in 2012 [14] (KRW is the currency unit of South Korea and, at the time of the survey (year 2012), USD 1 equaled KRW 1,126.25) as an incentive to designate water source protection zones in upstream areas since 1975 have been implemented, water quality
2230
deterioration due to highland agricultural activities still continues. Thus, downstream water users have called for a highland agricultural restriction policy including the abolishment of highland vegetable cultivation [15]. However, such crop production is the main source of income for local farmers in the highland areas [16]. The current situation is that the Korean government and downstream residents support stopping agricultural activities susceptible to
2235
environmental problems, while highland farmers and local governments wish to continue these activities. Within this context, a highland agricultural restriction policy was proposed and has been under extensive discussion in public media and among land use policy makers [15]. The aim of the policy is to prevent turbid water inflows to the Han River basin via the conversion
2240
of vegetable cultivation to other alternatives such as perennial crops or forest trees in the highland areas, i.e. trade-offs between benefits through water quality improvement and opportunity costs of abandoning current highland agriculture. Obviously, if the policy is approved, it puts limits on economic activities of residents in the upstream areas in order to protect or improve water quality, which means they are deprived of opportunity for potential
2245
economic benefits with respect to utilizing natural resources. Residents in down- and midstream areas are, on the other hand, provided with safe and clean water through the implementation of the policy, which means they gain more benefits from the water use [17]. 78
To accomplish equal distribution of the benefits of using water resources between river basin stakeholders, there should be a financing mechanism to support highland farmers for the 2250
conversion in order to compensate for their expected income loss. Therefore, it is essential that the government should ensure adequate financing available to effectively manage water quality [18]. Since the benefits generated by water quality improvement are not traded in real markets [19], this requires the use of non-market valuation methods to estimate these benefits
2255
[20]. Among various non-market valuation methods, we used the double-bounded dichotomous choice contingent valuation method (CVM) to investigate the benefits associated with increase in water quality generated by a highland agricultural restriction policy. The double-bounded dichotomous choice CVM developed by Hanemann et al. (1991) [21] includes two payment questions, offering two different bids. If the first bid is accepted
2260
(rejected), a higher bid (a lower bid) is proposed in the follow-up question so that an individual can make a decision whether they agree to accept or reject the proposed bids. Since the individual’s willingness of pay (WTP) can be below or above a bid amount or between the two bid amounts, the double-bounded model could have the potential to identify the WTP location more accurately, hence improving the estimates [22].
2265
This method might, however, cause other undesirable response effects, known as shift [23], anchoring [24,25], and yea-saying effects [26–29]. Cameron and Quiggin (1994) [30] indicate that despite the high correlation between the WTP distributions signified by the first and second bids, the WTP distributions are not equivalent in the double-bounded model. This is because the variance from the second WTP estimate is larger than the first. The offer of the
2270
second bid could, in addition, surprise respondents due to their unfamiliarity with the institutional design of the double-bounded dichotomous choice CVM, thus causing diverse strategic answers (anomalous preferences) [31,32], and less precise WTP estimates [32]. 79
A few studies have tried to identify and control these effects [23–25,27,28,30], but most of them show that controlling for biases in the double-bounded dichotomous choice 2275
format may lead to a loss in efficiency and estimate precision [22]. In this study, we further examine respondents’ aberrant behavior by comparing the accepted bid amounts from the dichotomous choice question with the maximum WTP amounts from the open-ended question at the last stage of the contingent valuation survey. We assume that the inconsistent responses found from the comparison may include yea-saying, which shows more respondents’ strategic
2280
behavior [26]. We thus consider the aberrant responses as the inconsistent response effects including the yea-saying bias in this study. In this regard, our analysis aims: (1) to provide a robust way for the improvement of precision in model estimation by controlling shift, anchoring, and inconsistent response effects simultaneously in the double-bounded dichotomous choice CVM; (2) to examine
2285
households’ WTP for the highland agriculture restriction policy in the Han River basin; and (3) to derive the monetary value of the total benefits generated by the water quality improvement policy, and to provide practical solutions that would be useful for the water management based on the benefit–cost analysis. This study makes two contributions to the literature on the impact of water quality management policy on households’ preferences. In
2290
terms of methodological aspect, we use a double-bounded dichotomous choice CVM to identify the impacts of the land use restriction policy for water quality improvement and provide an empirical evidence of a statistically significant improvement in the doublebounded model fit by correcting potential preference anomalies. With respect to empirical aspect, we estimate the monetary value (benefits) which can be considered as an ecosystem
2295
service value derived from the improvement in water quality due to the implementation of the policy, conduct benefit–cost analysis, and provide practical solutions for the policy relevance.
80
Our paper is structured as follows. Section 2 presents the theoretical framework of the study, describing the CVM, random-effects interval-data regression models for the estimation of the welfare change associated with change in the environmental quality, and each of the 2300
preference anomalies in detail. Section 3 describes the study area, survey design, and administration. Empirical results and discussion are provided in Section 4. Based on the calculation of the benefits, benefit-cost analysis is conducted in Section 5. Conclusions and policy implications are summarized in Section 6. Final focus of this study is in the Han River basin.
2305
3.2 Methodology This study deals with the elicitation of the monetary values that people would trade off their income against the improvement of water quality induced by a land use policy such as the highland agricultural restriction program. The land use policy would lead to betterment of 2310
environmental condition in terms of water quality, for example, and consequently lead to a change in utility/welfare of individual water users. Therefore, the concept of WTP for changes in utility/welfare can be used to value the outcome of the policy [33–35]. This follows the principle that public policy should be based on the aggregation of individual preferences [20].
2315
A CVM is one of the most prevalent approaches [36,37] to estimate the total value (use and non-use value of an environmental good or service [38–40]. Regulating the use of non-marketed goods and services would limit their use to a so-called indirect use (non-use), which means stakeholders might benefit from the goods and services regardless of their intention to use [41]. Stated choices regarding changes in the policy identified via survey
2320
reveal actual (or true) behavior. This stated behavior can help to understand the differentiated 81
effects of the policy [42–44]. This method inquires respondent’s WTP for the change in environmental quality (e.g. hypothetical improvements in water quality) through the survey instrument in assessing the impact of the policy change on individual welfare [26,45]. Given that the responses to a contingent valuation study are usually treated as random variables, a 2325
random component is incorporated into the individual’s utility function and the probability of survey response is linked to the WTP distributions based on the assumption that a respondent maximizes his utility [38,46] Among different WTP elicitation methods, the popular double-bounded dichotomous choice question format is applied in this study [32,47–53]. Efficiency in the elicitation of
2330
WTP can be increased if repeated bid questions are used [46]. Respondents are asked about their WTP for proposed changes from given bid values. If the response to the initial bid is positive, a follow-up bid, higher than the initial bid, is asked, whereas, if the answer is negative, a follow-up bid, lower than the initial bid, is asked. Therefore, the method can directly provide a monetary (Hicksian) measure of welfare associated with a discrete change
2335
in water quality [46,54]. In the dichotomous choice (or closed-ended) question format, the probability that their WTP is equal to or greater than a certain amount of money (B) that the individuals would pay for water quality improvement is: Pr (yes) = Pr (WTP ≥ B) ≡ 1 - Fc(B),
(3.1)
where Fc(B) denotes the cumulative distribution function of WTP. A random utility model is 2340
a basic framework for analyzing dichotomous contingent valuation responses. In this model, a respondent certainly knows his utility function. This preference is, however, not entirely observable and is treated as a random variable. The random component of preferences (ε) is, thus, directly incorporated into the indirect utility function, V (Q, Y, P, Z, ε), where (Q) represents the scalar for water being valued, (P) is the vector of the prices of the market goods, 82
2345
(Z) is the socio-demographic characteristics, and (Y) is the respondent’s income, in order to obtain a WTP distribution. In the status quo, the utility function of the respondent is given by V(Q0, Y, P, Z, ε). When a change in water quality from the status quo (Q0) to the proposed alternative occurs, the utility function in the final state (Q1) is equal to V(Q1, Y - B, P, Z, ε). In this case, the compensating variation: C = C(Q0, Q1, Y, P, Z, ε), which presents WTP of the
2350
individual for a welfare gain (WTP = C) is defined as V1 (Q1, Y - C, P, Z, ε) = V0(Q0, Y, P, Z, ε). It also yields the respondent’s maximum WTP for the change from (Q0) to (Q1). If the respondents’ maximum WTP for the change from the initially deteriorated (Q0) to finally improved (Q1) water quality state is greater than or equal to the bid proposed (B), they will say “yes”. Following the dichotomous choice approach, the probability of “yes” answer can
2355
be written as: Pr (yes) = Pr {C (Q0, Q1, Y, P, Z, ε) ≥ B} = Pr {V (Q1, Y - B, P, Z, ε) ≥ V (Q0, Y, P, Z, ε)} ≡ 1 - Fc (B), (3.2) Let μWTP = E[WTP(Q0, Q1, Y, P, Z, ε)], σ2WTP = Var[WTP(Q0, Q1, Y, P, Z, ε)] and F(·) be the cumulative distribution function of the standardised variate ω= (WTP-μWTP)/σWTP. The probability function can be rewritten as:
2360
Pr(yes) = 1 - F[B – μWTP/ σWTP ] ≡ 1 - F(-α + βB),
(3.3)
where α = μWTP/σWTP and β = 1/σWTP. Equation (3.3), where the answer to the dichotomous choice question is a function of a monetary amount, is consistent with an economic model of maximizing utility (WTP) if it can be understood as the survivor function of a WTP distribution [38,46]. The econometric model used for WTP estimation is determined by the 2365
form of cumulative distribution function of WTP (C), Fc(B), and the distributional assumption of the random component of the utility function [55]. If Fc(B) follows a probit standard distribution and the model is linear, the expected mean WTP is:
83
Eε (WTP/α, β, Z) = αZ/β,
(3.4)
where α denotes the vector of parameters, Z the vector of characteristics of the respondent, 2370
and β the coefficient on the bid level representing the estimated marginal utility of income. In the double-bounded dichotomous choice CVM, a respondent (j) is presented with the first bid amount (B1), and the second (B2) for the water quality improvement program. There are, thus, four possible responses: (1) both “yes” and “yes” responses (WTPj ≥ B2); (2) a “yes” followed by a “no” (B1 ≤ WTPj < B2); (3) a “no” followed by a “yes” (B1 > WTPj ≥
2375
B2); and (4) both “no” and “no” responses (WTPj< B2), which means that the set of observed bid responses (preferences) yields a set of intervals for estimating WTP [22]. Based on its structure, the researcher is provided with additional WTP intervals of respondents. Estimating the model that the additional information is incorporated into the likelihood function plays a crucial role in improving model accuracy [22]. In addition, decisions or choices within a
2380
range of intervals are common in daily life and are appropriate for the valuation practice where respondents are unacquainted with the environmental goods or services being valued [56]. It also makes it easy for respondents to reveal their true WTP [57,58]. With the doublebounded dichotomous choice data, we estimate the interval data probit model initially formulated by Hanemann et al. (1991) [21]. This is the format in which the double-bounded
2385
model provides the greatest efficiency gains, along with the least equivocalness [54]. The formulation of general econometric double-bounded model is WTPji = μi + εji, where WTPji represents WTP of the jth respondent, and i = 1, 2 for the first and second responses, while μ1 and μ2 correspond to the means for the first and second responses, respectively. Under the assumption that μ = μ1 = μ2, the WTP for the respondent (j) can be
2390
rewritten as WTPj = μ + εj. If the response is “yes-yes” in sequence (B2 > B1), the probability can be simplified as Pr μ + εj > B1, μ + εj ≥ B2 = Pr μ + εj ≥ B2. If the response is “no-no” in 84
sequence (B2 < B1), the probability can be simplified as Pr μ + εj < B1, μ + εj < B2 = Pr μ + εj < B2. For “yes-no” and “no-yes” responses, the probability is that WTP falls in the interval. With the assumption that the random term is normally distributed, the respondent’s 2395
contribution to the likelihood function is: Lj (μ/B) = Pr(μ + εj ≥ B2)YY × Pr(B2 - μ> εj ≥ B1 – μ)YN × Pr(B1 - μ > εj ≥ B2 – μ)NY× Pr(μ + εj < B2)NN (3.5) where YY (“yes-yes”) = 1 and 0 otherwise; YN (“yes-no”) = 1 and 0 otherwise; NY (“no-yes”) = 1 and 0 otherwise; and NN (“no-no”) = 1 and 0 otherwise. The primary independence assumption developed by Hanemann et al. (1991) [21] of
2400
the double-bounded dichotomous choice CVM is that a respondent’s preference (WTP) remains the same over the first and second payment questions (i.e., true WTPji = WTPj1 = WTPj2), which means since observations are independent across the answers to the initial and subsequent payment questions, the preferences of respondents remain the same over the two answers. The double-bounded model, however, undergoes the preference anomalies
2405
signifying that the respondents’ answer to the second question might be influenced by the first bid proposed to them [23,24,28]. In other words, the response to the second bid is not always independent from the first bid, indicating that different WTP values could be derived from the same respondent. This can, consequently, lead to inconclusive results since it is unclear whether WTP is correct or not [22,30]. Among these potential anomalies violating the
2410
assumption above, the two most common are anchoring bias and shift effects. The anchoring bias follows if respondents who have uncertain information (a poor perception or description given by researchers as a base) on the good valued presume that the first bid is information on the true value of the good [24,25,59]. The respondents may, thus, anchor the value they place on a good in the first bid [60–63]. Based on the first bid, the
2415
respondent’s anchored preferences (γ) could be an adjustment of their previous WTP WTPj1. 85
The posterior WTP WTPj2 generated by the adjustment is, accordingly, a weighted average (1 - γ) of the true WTP WTPj1 and the level of the first bid (γB1) provided by the researcher: WTPj2 = (1 - γ) WTPj1 + γB1, where 0 ≤ γ ≤ 1 [22]. The more the anchoring effect (γ) increases the closer WTPj2 is to B1, thus increasing bias in the WTP estimate. 2420
Shift effects arise if respondents interpret the first bid as information on the true cost of the policy proposed. Under this perception, a respondent who accepts the first bid may regard the second bid as an offer of additional payment for the same object. Similarly, when a respondent refuses the first bid payment, the follow-up question could be interpreted as an offer for a lower quality level of the object [22,23]. In other words, the respondents’
2425
preferences shift between WTPj1 and WTPj2. Supposing a respondent’s response to the first payment question WTPj1 is based on his true WTP, then the response to the second payment question WTPj2 is based on his true WTP plus the shift effect of a follow up question. The shift effect is taken through the addition of a structural shift parameter (δ): WTPj2 = WTPj1 + δ, where 0 < δ [23]. A negative sign of the shift parameter shows that the follow up increases
2430
respondents’ probability of rejecting the second bid [29], thus leading to decline in the WTP [22]. In terms of yea-saying bias, respondents exaggerate their true WTP in order to accept researcher’s offers. In other words, they accept any bids proposed from the researcher without considering the bids as information on environmental goods valued [21], consequently,
2435
overstating their true WTP [26–28]. One possible explanation for the overstatement of the true WTP is the presence of the warm glow effect, which is an important factor affecting an individual’s decision to make a contribution to the goods [64,65]. The contingent valuation response may reflect the individual’s WTP for the moral satisfaction derived from contributing to the goods, not just the economic value of the goods. Therefore, WTP could be
2440
changed by levels of the moral satisfaction, which changes by the size of the contribution [66]. 86
There are many other factors influencing the decision to privately contribute to the environmental goods such as social pressure, guilt or sympathy. All of these factors including the warm glow bias may encourage a respondent to have a higher tendency to say “yes” to the contingent valuation survey question [26]. The yea-saying bias is mostly involved in 2445
ascending bid sequences, thus resulting in an upward bias in WTP [26,27,29]. In the last stage of the contingent valuation survey, respondents are asked the openended question associated with the maximum WTP in order to explore deviant responses to the dichotomous choice question. When facing open-ended question, respondents who are confident of their WTP in the dichotomous choice question may answer consistently.
2450
Respondents who overstate or understate their WTP in the dichotomous choice question may, on the other hand, answer inconsistently. The key of the potential anomaly between WTP values over the survey is the presence of anchoring bias, shift, and inconsistent response effects. To confirm our hypothesis that the respondents’ WTP over the survey will be significantly influenced by the potential preference
2455
anomalies, our CVM data are transformed into a panel data structure following Whitehead (2002) [25] in iterative valuation questions. The econometric model for respondent j = 1, . . . , N, who is observed at several time periods t = 1, . . . , T, can be formulated as: WTPjt = αt + δDj + γB1Dj + UWTPjmaxDj + εjt
(3.6)
where α is the intercept. δ, γ, and U are the shift, anchoring, and inconsistency parameters, 2460
respectively. WTPjmax is the maximum WTP amount from open-ended questions at the last stage of the survey. εjt = ut + νjt, where ut is the individual specific error term (random effect) which varies across respondents but is time invariant. It explains the WTP due to the respondent’s unobservable characteristics. νjt is the random error term which varies across time and respondents. With the assumption that both error terms are independently and 87
2465
identically distributed with mean zero (N (0, σ2u), N (0, σ2ν)), Dj in the observed WTPjt which is located in interval, lower and upper bounds, denotes a dummy variable with the value of one Dj = 1 with follow-up questions in the double-bounded contingent valuation survey and zero otherwise [25]. If the anchoring bias exists, the anchoring parameter (γ) will be positive (0 < γ < 1)
2470
and statistically significant. If the shift effect is present, the shift parameter (δ) will be negative (δ < 0) and statistically significant. If the inconsistent response effect exists, the inconsistency parameter (U) will be positive (U > 0) and statistically significant. The correlation coefficient between the answers (ρ = σ2ν / σ2u+ σ2ν) is a measure of the ratio of the variance of the panel-level variance component in the model. In this study, the random-effects
2475
interval-data regression models in Stata (command “xtintreg”) are used with the panel data. To focus on the examinations of the preference anomalies, socio-demographic variables are not included in the model.
3.3 Study Area, Survey Design and Administration 2480
3.3.1 Study Area The Han River basin lies on five administrative districts, namely Seoul, Incheon, Gyeonggido, Gangwon-do, and Chungcheongbuk-do. The basin includes Paldang Lake, Bukhan River and Namhan River (Figure 3.1). The area of the basin is 24,988 km2 and accounts for 69.6% of the total area of these five administrative districts (35,927 km2). The population of the
2485
basin is about 20 million, accounting for 71.5% of total population in the five administrative districts (approximately 29 million). Regarding land uses, forests cover the greatest area (69.1%) of the five administrative districts, followed by rice paddy fields (7.9%) and highland crops fields (7.7%) (Table 3.1). Some areas of the Han River basin are designated as water 88
source protection zones following Article IV of the Han River Law. These areas correspond 2490
to
191.3
km2
distributed in
Gyeonggi-do
(78.2%),
Gangwon-do
(11.0%),
and
Chungcheongbuk-do (10.8%) [67].
Figure 3.1 The Han River basin in South Korea, study area Due to the monsoon climate condition, it is essential to store water in the rainy season 2495
in preparation for the dry season. A large number of dams, Chungju, Hoengseong, and Goesanin in the Namhan River basin, and Peace, Hwacheon, Soyanggang, Chuncheon, Uiam, and Cheongpyeong in the Buckhan River basin, were built in the Han River basin during the last four decades for the development of hydroelectric power, flood control, and dealing with an increasing water demand for domestic, industrial and agricultural uses. It has been
2500
substantially needed to sustain the rapid economic growth and population expansion of the Seoul metropolitan area downstream of the Han River.
89
In 2011, the average biochemical oxygen demand (BOD) concentration in the Namhan River basin ranged from 0.47 to 3.48 mg/L. Total phosphorus concentration was also very high and originated from pollutants released from highly concentrated population areas, 2505
livestock farming and agricultural activities associated with the production of summer crops such as Chinese cabbage and radish in the highland areas of the basin. In particular, heavy rain events have caused the turbidity of water to worsen, leading to increases in water treatment costs and decreases in the quality of ecosystems [14]. For example, heavy rain events during typhoon Ewiniar in 2006 led to the export of a massive quantity of sediments to
2510
Soyang Lake and, in turn, caused long term discharge problems within the basin. For instance, the number of nepthelometric turbidity units (NTU) of water was twenty five times higher in 2006 (328 NTU) than in 2005 (13 NTU) [15]. Table 3.1 Area, population, and land use in the Han River basin. Administrative district
Land Use in the 5 Administrative Districts (km2) Forest
Seoul Incheon Gyeonggi_do Gangwon_do Chungcheongbuk_do Total
148 (0.6) 410 (1.7) 5518 (22.2) 13,721 (55.3) 5015 (20.2) 24,812 (100)
Rice Paddy 15 (0.5) 184 (6.5) 1375 (48.5) 590 (20.8) 669 (23.6) 2833 (100)
Highland Vegetables 13 (0.5) 86 (3.1) 952 (34.6) 1,036 (37.6) 666 (24.2) 2753 (100)
Others 120 (0.6) 140 (0.7) 3191 (16.6) 12,095 (62.9) 3680 (19.1) 19,226 (100)
Total 605 (1.7) 1029 (2.9) 10,167 (28.3) 16,693 (46.5) 7433 (20.7) 35,927 (100)
The Han River Basin Area (km2) 605 (2.4) 99 (0.4) 7886 (31.6) 12,355 (49.4) 4043 (16.2) 24,988 (100)
Population (Thousand) 10,575 (51.8) 980 (4.8) 7476 (36.6) 914 (4.5) 487 (2.4) 20,432 (100)
Water Protection Zone Area (km2) 0 (0.0) 0 (0.0) 149.6 (78.2) 21.1 (11.0) 20.6 (10.8) 191.3 (100)
Note: The numbers in parentheses are the proportions of each contents, respectively. 2515
The highland areas (over 400 m in altitude) of the Han River basin are well developed for highland agriculture during the summer season. Heavy rain events during the summer season further accelerate soil erosion and nutrient runoff in the highland fields where about 50% of the highland fields have more than 15◦ slope. Since agrochemicals are intensively overused, 2520
the fertility of the topsoil is poor. For example, highland Chinese cabbage and radish farmers 90
in Gangwon Province apply 1.4 times more nitrogen (N), 2.4 times more phosphoric acid (P2O5), and 2.0 times more potassium oxide (K2O) than the regulated standards [10]. This has led to a high level of concentrated turbid water in rivers and lakes of the basin, considerably decreasing water quality and degrading aquatic ecosystem [14,15]. 2525
3.3.2 Survey Design and Administration In this study, the head of households of the Han River basin was targeted for the contingent valuation survey. The survey includes questions related to the respondents’ WTP for the land use policy such as the highland agricultural restriction program, as well as information about their socio-demographic characteristics. We provided the respondents with the information of
2530
contingent valuation scenario as a means of taking plausible future alternatives into account [68] on: (1) the importance of highland vegetable farming, which plays a vital role in the supply of domestic summer crops (since summer Chinese cabbage and radishes can only be produced in the highland agriculture fields due to the low temperature during the summer season, it is very critical to satisfy domestic consumers with their fresh produce); (2) the
2535
primary cause of soil erosion in the highland dry fields with steep slopes and the consequential turbidity in water; (3) their current and potential damages to the Han River basin; (4) the proposal of the highland agriculture restriction policy as its alternative; and (5) the need for financing mechanisms to support highland farmers for the conversion and the compensation for their income loss.
2540
We held focus group discussions, which included 50 random residents over 19 years old recruited from the Han River basin (five administrative districts) to obtain information on their perceptions and preferences for water use and its quality. Based on this preliminary analysis using data gathered from the focus group meetings, four bid levels of payments in the double-bounded dichotomous choice format were set up as follows: Type A, KRW 2,000
2545
(higher KRW 4,000 or lower KRW 1,000); Type B, KRW 4,000 (higher KRW 8,000 or lower 91
KRW 2,000); Type C, KRW 6,000 (higher KRW 12,000 or lower KRW 3,000); and Type D, KRW 8,000 (higher KRW 16,000 or lower KRW 4,000). The first bid level of each type is proposed to the respondents. When the answer is positive, a doubled value for the bid is asked, and, when the answer is negative, a half value for the bid is asked. In terms of recognizing 2550
inconsistent responses, an open-ended question deriving the maximum WTP amount was asked at the last stage of the questionnaire. The first and second bids and ratio of acceptances for each bid are represented in Table 3.2. Table 3.2 The first and second bids proposed, and proportion of acceptance in the double-bounded contingent valuation survey. “No” Bid Follow-Up (KRW) 1000
2555
Acceptance Ratio
First Bid (KRW)
Acceptance Ratio
0.03 (0.04)
2000
0.52 (0.58)
“Yes” Bid Follow-Up (KRW) 4000
2000
0.01 (0.00)
4000
0.38 (0.38)
8000
0.57 (0.20)
3000
0.00 (0.00)
6000
0.36 (0.35)
12,000
0.54 (0.09)
4000
0.00 (0.00)
8000
0.34 (0.18)
16,000
0.72 (0.13)
Acceptance Ratio 0.47 (0.34)
Note: Respondents are asked for a yes-no answer to the WTP question with the first bids assigned randomly. If positive, a new question with a higher bid is asked (“yes” bid follow-up). If negative, a new question with a lower bid is asked (“no” bid follow-up). Acceptance ratio is the proportion of “yes” responses to each bid. The values in parentheses are the percentage after correcting inconsistent responses with open-ended WTPs.
2560
Internet survey methods were employed instead of face-to-face interviews due to time and budget constraints. Sheehan (2001) [69] highlighted that many studies have touted the promise of e-mail surveys for research. With rapidly growing access rate to the Internet around the world in general and in South Korea in particular, researchers obtain many 2565
important advantages from online surveys by email or on the web, including cost efficiency and effective survey administration with respect to time and resource management [70–74]. By precise tracking of e-mailed surveys, the researcher can know the number of undeliverable e-mail as well as what time the e-mail survey was opened, replied to and deleted. This can improve sampling procedures [75]. People are apt to give longer open-ended responses to e92
2570
mail, which tend to be more candid, than other types of surveys. This can also increase response quality [75,76] by avoiding the problem of social desirability and interviewer biases, both well-known problems of face-to-face interview surveys [77]. For the sampling approach, we used a quota sample technique, as an important kind of non-probability samples. We set quotas on key variables, which shape who is chosen for the
2575
sample, so-called quota controls such as age, gender, and regional population. It could not only balance the bias inherent in using public hearings to gauge wider public sentiment, but also provide the additional information on respondents at a substantially lower cost and in much less time than a probability sample could [78,79]. The sample size of 2015 households with ±5% sampling error was accepted based on the 2011 demographics of the five
2580
administrative districts of the Han River basin. The CVM questionnaires were evenly and randomly distributed to each administrative district in order to prevent the survey from being substantially conducted in populous downstream areas and one bid level from being concentrated in one district. The information on socio-demographic characteristics of households crucial for the
2585
valuation is widely used by planners and policymakers for programmatic purposes, in particular for the planning of community institutions, and for determining the community needs and requirements. In addition, changes in household characteristics have an impact on the decision-making regarding allocations and the distribution of goods and services [80,81].
2590
3.4 Results and Discussion 3.4.1 Profile of Surveyed Households For the households surveyed in this study, the number of male (53.6%) was slightly larger than that of female (46.4%). In the contingent valuation survey, the responses of household 93
head or their spouse are very important because they directly make it possible for the 2595
researcher to achieve a better idea about the variables that affect their true WTP and explain differences in consumption behavior regarding goods and services [82]. The response rate for the respondents who did not have children or did not reside together with their children (52.9%) was slightly higher than that of respondents who had children residing together (47.1%). The number of household members is negatively
2600
correlated with the WTP of the household for the highland restriction policy. This is because household budgets are tighter for larger families than for smaller families with the same income [83]. The number of surveyed households of upstream areas (40.1%) was almost the same as that of downstream areas (39.9%). Due to repeated water quality deterioration, downstream
2605
residents may be more likely to accept the highland agricultural restriction policy on water quality improvement, while upstream residents may be more likely to reject the policy because of the concern about a potential income loss from constraints of economic activities. The average number of years respondents had stayed in their current residence was about 23 years. The respondents who lived longer in the Han River basin may give more
2610
reliable answers to WTP questions because they directly or indirectly observed more water quality problems [15]: 96.6% of the respondents agreed that the turbid water inflow prevention measure is needed for water quality improvement; 95.7% also agreed that the individuals have to take responsibility for conserving and managing water quality. The average annual income of respondents was in the range of 35.0 to 40.0 million
2615
KRW and those who earned from 30.0 to 39.9 million KRW per year (20.9%) were the largest proportion. Income variable tends to have positive direction in payment for social benefit improvement because respondents with higher levels of income may be more likely to 94
desire clean and safe drinking water [84]. Table 3.3 presents profile of households surveyed in this study method. 2620
Table 3.3 Profile of households surveyed in the double-bounded contingent valuation method. Questions Annual total household income
Gender Household size Current residence (downstream: 1, 2; midstream: 3; upstream: 4, 5)
Number of years respondent has resided in the current residence (year) Individual importance of water quality conservation and management Need for the turbid water inflow prevention measure to the Han River basin
Examples 1. Less than 2.0 2. 2.0 to less than 3.0 3. 3.0 to less than 4.0 4. 4.0 to less than 5.0 5. 5.0 to less than 6.0 6. More than 6.0 1. Male 2. Female 1. No children 2. Residing with children 1. Seoul 2. Incheon 3. Gyeonggi_do 4. Gangwon_do 5. Chuncheongbuk_do
Proportion (%) 14.1 17.3 20.9 16.0 11.5 20.2 53.6 46.4 52.9 47.1 19.9 20.0 20.0 20.1 20.0 22.5
1. Important 2. Unimportant 1. Necessary 2. Unnecessary
95.7 4.3 96.6 3.4
3.4.2 Correcting the Potential Preference Anomalies and Willingness to Pay Around 54.0% of the respondents accepted the highland agricultural restriction program for 2625
water quality improvement of the Han River basin. In addition, we detected that about 21.4% of the respondents who are in favor of the highland restriction policy gave lower WTP values in the open-ended questions than the accepted bid in the follow-up questions (inconsistency between the open-ended WTP value and the chosen closed-end bid in intervals). Figure 3.2 shows that although the bid level in the “yes” bid follow-up question increases, the proportion
2630
of “yes-yes” responses of the 54% respondents accepting the policy increases, violating the basic consumer theory. Regardless of a rise or fall in the bid level, the proportion of “yes-yes” responses of the respondents who made contradictory answers across the closed-ended and 95
the open-ended questions was very high, showing 100% probability for bid choice. This might come from some factors including the yea-saying bias. As mentioned earlier, the 2635
presence of yea-saying bias in the CVM may be motivated by the warm glow effect, which results from the private contribution (moral satisfaction, social pressure, guilt, and sympathy) to the environmental goods [26]. On the other hand, as the bid levels increase, the proportion of “yes-yes” responses of the respondents who gave consistent answers to the closed-ended and the open-ended questions decreases.
2640
Figure 3.2 Choice probability of the consistent and inconsistent responses to the “yes” bid follow-up question.
Table 3.4 presents the results of the random-effects interval-data regression models. The 2645
naïve model is defined as the base random-effects interval-data model, which is unconcerned about possible preference anomalies. The shift effect is introduced as a dummy variable (Dj), defined as the shift effect model. The results indicate the negative sign of this variable (δ = 1273.20), which is occasionally mentioned as the nay-saying effect (a downward shift in WTP). While this is contrary to the yea-saying effect founded by Chien et al. (2005) [26], it is 96
2650
consistent with Gelo and Koch (2015) [22], Alberini et al. (1997) [23], and Whitehead (2002) [25] (δ < 0). In the anchoring effect model, B1Dj is introduced to grab potential anchoring bias, i.e., respondents’ answers to the second payment questions may be affected by the first bids. The results show that the coefficient of the anchoring variable B1Dj is negative (γ = -0.04) and
2655
statistically significant (p < 0.01). This violates the assumption that if the second response is anchored to the first bid amount the coefficient of B1Dj will be positive and its value lies in between zero and one (0 < γ < 1). As stated by Whitehead (2002) [25], the negative anchoring effect might be attributed to model misspecification because the starting bid amount is interacted with the shift dummy variable.
2660
While our result is in line with Gelo
and Koch (2015) [22], and Whitehead (2002) [25], it is opposed to Chien et al. (2005) [26] and Flachaire and Hollard (2006) [28]. To confirm that the anchoring bias may be incorrectly capturing other effects, we consider the concurrent existence of both shift and anchoring effects, defined as the shift– anchor model. The results of this model indicate that the shift effect is negative and
2665
statistically significant, which is identical with the single shift effect model. The anchoring effect is positive and statistically significant, which is corresponding to the assumption of the standard anchoring effect model showing presence of anchoring bias. Finally, the shift–anchor–inconsistency model, considering the combination of anchoring, shift, and inconsistent response effects, shows that the results of shift and anchoring effects
2670
accord with the assumption of the standard shift and anchoring effect models. The inconsistent response effect is positive (U = 0.06) (a upward shift in WTP) implying the yeasaying effect is statistically significant. Some previous studies [22,85,86] classified the inconsistent response into a “no” response to the second bid for controlling the yea-saying 97
behavior. However, we directly consider the inconsistent responses in the shift–anchor– 2675
inconsistency effect interval-data model, which could be the main difference. Table 3.4 Parameter estimates of the random-effects interval-data regression models. Model
Naïve
Shift
Anchor
Shift-Anchor
Variable
β (std.err) 4977.94 *** (34.76)
β (std.err) 5038.13 *** (54.09) −1273.20 *** (43.89)
β (std.err) 5117.47 *** (53.04)
β (std.err) 5008.51 *** (149.31) −2012.2 *** (214.75) 0.50 *** (0.05)
α δ γ
−0.04 *** (0.01)
U
2680
Shift-AnchorInconsistency 1 β (std.err) 5025.02 *** (30.40) −2127.36 *** (71.76) 0.42 *** (0.02) 0.06 *** (0.01) 0.99 ***
0.99 *** 0.99 *** 0.99 *** 0.99 *** ρ Log −1750.71 −1656.01 −1744.76 −1469.50 −1424.87 likelihood Observations 1091 1091 1091 1091 1091 Mean WTP 4913.23 3715.98 5050.90 2957.82 2860.46 Note: α is the intercept; δ, γ, and U are the shfit, anchroring, and inconsistency paraemters, respectively; and ρ is the coefficient of the proportion of the total variance contributed by panel-level variance components (sigma_e and sigma_u). *** p < 0.01; 1 We also estimated the random-effects interval-data regression models with socio-economic variables such as income, gender, household size, etc., and examined the goodness of fit compared to the shift–anchor–inconsistency model. This result shows that the shift–anchor–inconsistency is statistically better than the other model. Thus, we used the shift–anchor–inconsistency model without socio-demographic variables in order to estimate the mean WTP per household.
2685
For evaluation of model fit between the models, we performed the log-likelihood test. In comparison with the two models which have high log likelihoods, shift–anchor– inconsistency versus shift–anchor, the results show that the shift–anchor–inconsistency model, which considers shift, anchoring, and inconsistent response effects all together, results in a 2690
statistically significant improvement in model fit. Another focus of this study lies on the elicitation of the respondents’ WTP for the highland agriculture restriction policy in the Han River basin. The mean WTP values in Table 3.4 were adjusted to constant 2013 Korean currency (KRW) by applying a Consumer Price 98
Index (CPI) provided by Statistics Korea [87] to take into account inflationary effects. On the 2695
basis of the shift–anchor–inconsistency model, the monthly average WTP per household was estimated at KRW 2,861. This WTP value sharply declined by 41.8% (around KRW 2,053) compared to that of the naïve model (around KRW 4,913), which does not consider any preference anomaly. As each of the potential preference anomalies is, in turn, corrected, the log likelihoods increased and the WTP values decreased. This result indicates that correcting
2700
shift, anchoring, and inconsistent response effects simultaneously contribute to increasing the goodness of fit of the model, consequently deriving much better or more reliable WTP estimates. We do not take the single anchor model into consideration since this model violates the assumption about the range of γ parameter (0 < γ < 1).
2705
3.5 Benefit Calculations Final focus of this study is the calculation of the benefits generated by water quality improvement due to the implementation of the highland agriculture restriction policy in the Han River basin. Before the benefit calculation, we need to define who these benefits from the policy belong to, or who the beneficiaries are. In South Korea, the Han River basin is a
2710
primary source of drinking water supply as well as providing many tangible and intangible benefits to its mid- and downstream areas. Based on the benefits provided by the Han River, the mid- and downstream areas have been economically developed (urban or metropolitan areas) while the upstream areas have not (rural areas) [17]. Although the water use charge has been, since 1999, implemented for supporting communities and their people in the upstream
2715
areas and water quality improvement programs in the basin, some problems pertaining to the distribution of the benefits still remain along with frequent turbid water discharge problems.
99
The implementation of the highland agriculture restriction policy aiming at water quality improvement patently restricts economic activities of the upstream residents including farmers. Instead, the mid- and downstream residents are entirely benefited by the policy for 2720
the improvement of water conditions. Based on this circumstance, we calculate the total benefit generated by the highland agriculture restriction policy and compare the benefits to the costs associated with land use policies to protect and improve water quality in the basin. The result of calculated benefits to the mid- and downstream areas obtained from the land use restriction policy in the upstream areas is shown in Table 3.5. Based on the
2725
population (approximately 8.7 million households) provided by Statistic Korea in 2013 [87], the total benefits are calculated to be around KRW 297.73 billion per year. The downstream residents had the highest benefits at around KRW 156.20 billion per year and the midstream residents’ benefits were around KRW 141.53 billion per year (see Table 3.5).
2730
Table 3.5 Total benefit of the mid- and downstream areas estimated from the land use restriction policy in the upstream areas. Mean WTP Total Benefit Administrative Location Household Province (KRW/Month) (Billion KWR/Year) Seoul 3,567,727 122.46 Downstream Incheon 982,811 2860.46 33.74 Gyeonggi_do Midstream 4,123,072 141.53 Total
8,673,610
297.73
Note: The number of households and the annual average income per household are obtained from the Statistics Korea in 2013.
We made a comparison of these total benefits with the costs associated with land use 2735
policies to protect and improve water quality supported by the water use charge. The water use charge is mainly used for community support programs in upstream areas of the basin, upstream farmland purchase and riparian zone management, construction and operation of waste treatment facilities, etc. We considered the costs of the upstream farmland purchase and 100
riparian zone management as a comparison item with the total benefits. In 2013, the costs 2740
were around KRW 129.44 billion and accounted for 29.8% of the total charge, the second largest proportion after the construction and operation of waste treatment facilities. Table 3.6 shows the results of benefit–cost comparison. The net benefit is around KRW 168.29 billion (see Table 3.6).
2745
Table 3.6 Comparison result of the benefits and costs from the highland agriculture restriction policy in the Han River basin. Administrative Province
Total Benefit (A) (Billion KWR/Year)
Total Cost (B) (Billion KWR/Year)
Net Benefit (A−B)
Mid- and downstream areas
297.73
129.44
168.29
The costs related to the upstream farmland purchase and riparian zone management in 2013 increased double compared to that in 2012 [88]. This indicates that, to prevent the high soil erosion from highland agricultural fields, as a prime pollutant, from inflowing to the 2750
basin, the investment cost of purchasing upstream farmland has gradually increased. However, many of the upstream lands purchased (non-farming areas) are not relevant to the highland agriculture. Since the highland farmers who actually earn their income from such summer crop production have deep concern for their heavy income loss, most of them do not want to give up farming in the highlands.
2755
To improve the negotiation for practical purchase of the high mountainous agricultural fields, valid compensation for the highland farmers’ income loss should be a high priority. To realize this, there is a need to increase the unit cost of the highland purchase, which means more costs should be invested in the highland purchase programs. Operational problems of the water use charge along with frequent turbid water
2760
discharge problems in the basin exist. Wasteful and inefficient fund use for water quality 101
control, e.g., overinvestment in waste treatment facilities and temporary expedients for supporting upstream communities, has been criticized by all local communities in the Han River basin [14,89]. If these inefficiently used costs could be invested in other items such as the highland agriculture field purchase and riparian zone management, problems in terms of 2765
financing would be to some extent resolved.
3.6 Conclusions and Policy Implication This study aims at: (1) examining potential preference anomalies such as shift, anchoring, and inconsistent response effects when the double-bounded dichotomous choice question format 2770
is used in the contingent valuation survey; (2) eliciting WTP of the respondent for the highland agriculture restriction policy on water quality improvement in the Han River basin, South Korea; and (3) comparing the total benefits from the policy to the total cost of land use restriction policies to improve water quality. Before implementing the land use policy, it is necessary to examine the preferences of residents for the policy. This result could be used to
2775
value the outcome (i.e., change in utility/welfare of individual water users through water quality improvement). However, the use of water as an environmental (or non-market) good frequently accompanies non-priced side effects (i.e., environmental externalities). Therefore, the contingent valuation method could be used in order to elicit the preferences (WTP) and carry out economic valuation for the water policy making. When respondents are, however,
2780
faced with new or unfamiliar environmental goods or services, they are likely to experience uncertainty [90] such as systematic WTP response bias [32,85], which is caused by a lack of experience with market for non-traded goods [22]. Thus, preference anomalies of respondents may exist and bring about incorrect assessment of the water policy.
102
In this study, these potential preference anomalies are tested by the random-effects 2785
interval-data regression models. The empirical results indicated that significantly anomalous preferences are presented in our survey data. As the shift, anchoring, and inconsistent response effects were corrected in order, the statistical precision of parameter estimates was also improved. After correcting the potential preference anomalies, estimated welfare gains are on average KRW 2,861 per month per household. Based on the WTP estimate, the total
2790
benefits from the highland agriculture restriction policy are around KRW 297.73 billion and the total costs are around KRW 129.44 billion. The net benefit is, thus, around KRW 168.29 billion. In order to make practical land use restriction policies, the valid compensation for the highland farmers’ income loss is necessary and this could be realized through increase in the
2795
unit cost of the highland purchase. In terms of financing arrangement, wasted or inefficiently used costs (e.g., overinvestment in waste treatment facilities, and temporary upstream community support) should be spread across other cost items, in particular over the purchase program of the high mountainous agriculture fields. The results of our analysis provide South Korean legislators and land use policy makers with useful information for the approval and
2800
operationalization of the policy. As stated by the Millennium Ecosystem Assessment [91], water bodies provide various ecosystem services such as food provision, biodiversity, recreation, tourism, amenities, drinking water, etc. to society. In this study, we consider only one service, water quality improvement generated by land use restriction policy. The total benefits estimated
2805
from our analysis are also associated with the water quality improvement due to the implementation of the policy.
103
3.7 Acknowledgments This study was carried out as part of the International Research Training Group TERRECO 2810
(GRK 1565/1) funded by the German Research Foundation (DFG) and the University of Bayreuth in the funding programme Open Access Publishing, Germany and the National Research Foundation of Korea (NRF), Korea.
3.8 References 2815
1. UN-Water Decade Programme on Advocacy and Communication (UNW-DPAC). Water cooperation in action: Approaches, tools and processes. In Proceedings of the International Annual UN-Water Zaragoza Conference 2012/2013, Zaragoza, Spain, 8–10 January 2013. 2. George, A.; Pierret, A.; Boonsaner, A.; Christian, V.; Planchon, O. Potential and limitations of Payments for Environmental Services (PES) as a means to manage watershed services in mainland Southeast Asia. Int. J. Commons 2009, 3, 16–40.
2820
3. Hoang, V.N.; Nguyen, T.T. Analyses of environmental efficiency variations: A nutrient balance approach. Ecol. Econ. 2013, 86, 37–46. 4. Kroon, F.; Kuhnert, P.; Henderson, B.; Wilkinson, S.; Henderson, A.; Abbott, B.; Brodie, J.; Turner, R. River loads of suspended solids, nitrogen, phosphorus and herbicides delivered to the Great Barrier Reef lagoon. Mar. Pollut. Bull. 2012, 65, 167–181.
2825
2830
5. Mitchell, A.; Reghenzani, J.; Faithful, J.; Furnas, M.; Brodie, J. Relationships between land use and nutrient concentrations in streams draining a ‘wet-tropics’ catchment in northern Australia. Mar. Freshw. Res. 2009, 60, 1097–1108. 6. Stoate, C.; Báldi, A.; Beja, P.; Boatman, N.D.; Herzon, I.; van Doorn, A.; de Snoo, G.R.; Rakosy, L.; Ramwell, C. Ecological impacts of early 21st century agricultural change in Europe: A review. J. Environ. Manag. 2009, 91, 22–46. 7. Thorburn, P.J.; Wilkinson, S.N. Conceptual frameworks for estimating the water quality benefits of improved agricultural management practices in large catchments. Agric. Ecosyst. Environ. 2013, 180, 192–209.
2835
8. Tilman, D.; Cassman, K.G.; Matson, P.A.; Naylor, R.; Polasky, S. Agricultural sustainability and intensive production practices. Nature 2002, 418, 671–677. 9. Nguyen, T.T.; Ruidish, M.; Koellner, T.; Tenhunen, J. Synergies and tradeoffs between nitrate leaching and net farm income: The case of best nitrogen management practices in South Korea. Agric. Ecosyst. Environ.2014, 186, 160–169. 104
2840
10. Nguyen, T.T.; Hoang, N.V.; Seo, B. Cost and environmental efficiency of rice farms in South Korea. Agric. Econ.2012, 43, 367–376. 11. Galioto, F.; Marconi, V.; Raggi, M.; Viaggi, D. An Assessment of Disproportionate Costs in WFD: The Experience of Emilia-Romagna. Water 2013, 5, 1967–1995. [CrossRef]
2845
12. Park, J.H.; Duan, L.; Kim, B.; Mitchell, M.J.; Shibata, H. Potential effects of climate change and variability on watershed biogeochemical processes and water quality in Northeast Asia. Environ. Int. 2010, 36, 212–225. 13. Arnhold, S.; Lindner, S.; Lee, B.; Martin, E.; Kettering, J.; Nguyen, T.; Koellner, T.; Ok, Y.S.; Huwe, B. Conventional and organic farming: Soil erosion and conservation potential for row crop cultivation. Geoderma 2014, 219–220, 89–105.
2850
14. Kim, K.M. Improvement of the Han River Watershed Management Fund Policies; National Assembly Research Service (NARS) Issue Report 160; NARS: Seoul, Korea, 2012. 15. Shin, H.J.; Jeon, C.H.; Choi, I.C.; Yeon, I.C. Estimation of beneficiary’s willingness to pay in mid and down-stream area to the water quality improvements in upper Bukhan River Basin. Seoul Stud. 2009, 10, 91–106. (In Korean)
2855
16. Shin, Y.K.; Kim, C.G.; Kim, T.Y.; Joo, J.H. A Basic Study for Environmentally Friendly Reorganization of Highland Agriculture; Korea Rural Economic Institute (KREI) Research Report R517; KREI: Seoul, Korea, 2005. 17. Shin, H.J.; Kim, H.N.; Jeon, C.H.; Jo, M.H.; Nguyen, T.T.; Tenhunen, J. Benefit transfer for water management along the Han River in South Korea using Meta-Regression Analysis. Water 2016, 8, 492.
2860
18. Organisation for Economic Cooperation and Development (OECD). A Framework for Financing Water Resources Management; OECD Publishing: Paris, France, 2012. 19. Hanemann, W.M. The economic conception of water. In Water Crisis: Myth or Reality? Rogers, P.P., Llamas, M.R., Martinez-Cortina, L., Eds.; Taylor and Francis: London, UK, 2006.
2865
20. Young, R.A. Determining the Economic Value of Water: Concepts and Methods; Resources for the Future Press: Washington, DC, USA, 2005. 21. Hanemann, W.M.; Loomis, J.; Kanninen, B. Statistical efficiency of double-bounded dichotomous choice contingent valuation. Am. J. Agric. Econ. 1991, 73, 1255–1263.
2870
22. Gelo, D.; Koch, S.F. Contingent valuation of community forestry programs in Ethiopia: Controlling for preference anomalies in double-bounded CVM. Ecol. Econ. 2015, 114, 79–89. 23. Alberini, A.; Kanninen, B.; Carson, R. Modeling response incentive effect in dichotomous contingent valuation. Land Econ. 1997, 73, 309–324. 105
24. Herridges, J.A.; Shogren, J.F. Starting point bias in dichotomous choice valuation with follow-up question. J. Environ. Econ. Manag. 1996, 30, 112–131. 2875
25. Whitehead, J.C. Incentive incompatibility and starting point-bias in iterative valuation question. Land Econ. 2002, 78, 285–297. 26. Chien, Y.L.; Huang, C.J.; Shaw, D. A general model of starting point bias in doublebounded dichotomous contingent valuation surveys. J. Environ. Econ. Manag. 2005, 50, 362– 377.
2880
27. DeShazo, J.R. Designing transactions without framing effects in iterative question formats. J. Environ. Econ. Manag. 2002, 43, 360–385. 28. Flachaire, E.; Hollard, G. Controlling starting-point bias in double-bounded contingent valuation surveys. Land Econ. 2006, 82, 103–111.
2885
29. Watson, V.; Ryan, M. Exploring preference anomalies in double bounded contingent valuation. J. Health Econ.2007, 26, 463–482. 30. Cameron, T.A.; Quiggin, J. Estimation using contingent valuation data from dichotomous questionnaire. J. Environ. Econ. Manag. 1994, 27, 218–234. 31. Cooper, J.; Hanemann, M.; Signorello, G. One-and-one-half-bound dichotomous choice contingent valuation. Rev. Econ. Stat. 2002, 84, 741–750.
2890
32. Bateman, I.J.; Burgess, D.; Hutchinson, W.G.; Matthews, D.I. Learning design contingent valuation (LDCV): NOAA guidelines, preference learning and coherent arbitrariness. J. Environ. Econ. Manag. 2008, 55, 127–141. 33. Mitchell, R.C.; Carson, R.T. Using Surveys to Value Public Goods: The Contingent Valuation Method; Resources for the Future (RFF) Press: Washington, DC, USA, 1989.
2895
34. Boardman, A.E.; Greenberg, D.H.; Vining, A.R.; Weimer, D.L. Cost-Benefit Analysis: Concepts and Practice, 4th ed.; Prentice Hall: Upper Saddle River, NJ, USA, 2011. 35. Boyle, K.J.; Bishop, R.C.; Welsh, M.P. Starting point bias in contingent valuation bidding games. Land Econ.1985, 61, 188–194.
2900
36. Bateman, I.J.; Langford, I.H.; Turner, R.K.; Willis, K.G.; Garrod, G.D. Elicitation and truncation effects in contingent valuation studies. Ecol. Econ. 1995, 12, 161–179. 37. Del Saz-Salazar, S.; Guaita-Pradas, I. On the value of drovers’ routes as environmental assets: A contingent valuation approach. Land Use Policy 2013, 32, 78–88.
2905
38. Carson, R.T.; Hanemann, W.M. Contingent valuation. In Handbook of Environmental Economics; Mäler, K.G., Vincent, J.R., Eds.; Elsevier: New York, NY, USA, 2005; Volume 2, pp. 821–936. 106
39. Edwards, S.F.; Anderson, G.D. Overlooked biases in contingent valuation surveys: Some considerations. Land Econ. 1987, 63, 168–178. 40. Freeman, A.M. The Benefits of Environmental Improvement: Theory and Practice; Johns Hopkins University Press: Baltimore, MD, USA, 1979. 2910
2915
41. Van Zanten, B.T.; Verburg, P.H.; Espinosa, M.; Gomez-y-Paloma, S.; Galimberti, G.; Kantelhardt, J.; Kapfer, M.; Lefebvre, M.; Manrique, R.; Piorr, A.; et al. European agricultural landscapes, common agricultural policy and ecosystem services: A review. Agron. Sustain. Dev. 2014, 34, 309–325. 42. Bartolini, F.; Viaggi, D. The common agricultural policy and the determinants of changes in EU farm size. Land Use Policy 2013, 31, 126–135. 43. Viaggi, D.; Raggi, M.; Gomez-y-Paloma, S. Farm-household investment behaviour and the CAP decoupling: Methodological issues in assessing policy impacts. J. Policy Model. 2011, 33, 127–145.
2920
44. Viaggi, D.; Raggi, M.; Gomez-y-Paloma, S. Understanding the determinants of investment reactions to decoupling of the Common Agricultural Policy. Land Use Policy 2011, 28, 495–505. 45. Viaggi, D.; Gomez-y-Paloma, S.; Mishra, A.; Raggi, M. The role of the EU Common agricultural policy: Assessing multiple effects in alternative policy scenarios. Land Use Policy 2013, 31, 99–101.
2925
46. Hoyos, D.; Mariel, P. Contingent valuation: Past, present and future. Prague Econ. Pap. 2010, 19, 329–343. 47. Brouwer, R.; Martín-Ortega, J. Modeling self-censoring of polluter pays protest votes in stated preference research to support resource damage estimations in environmental liability. Resour. Energy Econ. 2012, 34, 151–166.
2930
2935
48. Fischhoff, B.; Furby, L. Measuring values: A conceptual framework for interpreting transactions with special reference to contingent valuation of visibility. J. Risk Uncertain. 1988, 1, 147–184. 49. Frew, E. Benefit assessment for CBA studies in healthcare using CV methods. In Applied Methods of Cost-Benefit Analysis in Health Care; McIntosh, E., Clarke, P., Frew, E., Louviere, J., Eds.; Oxford University Press: Oxford, UK, 2010; pp. 97–118. 50. Hanemann, W.M. Some issues in continuous and discrete response contingent valuation studies. Northeast. J. Agric. Econ. 1985, 14, 5–13. 51. Hanemann, W.M.; Kanninen, B. The statistical analysis of discrete-response CV data. In Valuing Environmental Preferences: Theory and Practice of the Contingent Valuation 107
2940
Method in the US, EU, and Developing Countries; Bateman, I.J., Willis, K.G., Eds.; Oxford University Press: Oxford, UK, 1999; pp. 302–441. 52. Plott, C.R.; Kathryn, Z. The willingness to pay-willingness to accept gap, the “Endowment Effect”, subject misconceptions, and experimental procedures for eliciting valuations. Am. Econ. Rev. 2005, 95, 530–545.
2945
53. Poufoun, J.N.; Abildtrup, J.; Sonwa, D.J.; Delacote, P. The value of endangered forest elephants to local communities in a transboundary conservation landscape. Ecol. Econ. 2016, 126, 70–86. 54. Haab, T.C.; McConnell, K.E. Valuing Environmental and Natural Resources: The Econometrics of Non-Market Valuation; Edward Elgar Publishing: Cheltenham, UK, 2002.
2950
2955
55. Donfouet, H.P.P.; Jeanty, P.W.; Mahieu, P.-A. Dealing with internal inconsistency in double-bounded dichotomous choice: An application to community-based health insurance. Empir. Econ. 2014, 46, 317–328. 56. Belyaev, Y.; Kriström, B. Two-Step Approach to Self-Selected Interval Data in Elicitation Surveys. 2012. Available online: http://ssrn.com/abstract=2071077 (accessed on 18 April 2016). 57. Mahieu, P.-A.; Riera, P.; Giergiczny, M. Determinants of willingness-to-pay for water pollution abatement: A point and interval data payment card application. J. Environ. Manag. 2012, 108, 49–53.
2960
58. Welsh, M.P.; Poe, G.L. Elicitation effects in contingent valuation: Comparisons to a multiple bounded discrete choice approach. J. Environ. Econ. Manag. 1998, 36, 170–185. 59. Kahnemann, D.; Slovic, P.; Tversky, A. Judgment Under Uncertainty: Heuristics and Biases; Cambridge University Press: New York, NY, USA, 1982. 60. Ariely, D.; Lowenstein, G.; Prelec, D. Coherent arbitrariness: Stable demand curves without stable preferences. Q. J. Econ. 2003, 118, 73–106.
2965
61. Bergman, O.; Ellingsen, T.; Johannesson, M.; Svensson, C. Anchoring and cognitive ability. Econ. Lett. 2010, 107, 66–68. 62. Veronesi, M.; Alberini, A.; Cooper, J.C. Implications of bid design and willingness-to-pay distribution for starting point bias in double-bounded dichotomous choice contingent valuation surveys. Environ. Resour. Econ. 2011, 49, 199–215.
2970
63. Wilson, T.; Houston, C.; Etling, K.; Brekke, N. A new look at anchoring effects: Basic anchoring and its antecedents. J. Exp. Psychol. Gen. 1996, 125, 387–402. 64. Andreoni, J. Giving with impure altruism: Applications to charity and Ricardian equivalence. J. Political. Econ. 1989, 97, 1447–1458. 108
65. Becker, G.S. A theory of social interactions. J. Political. Econ. 1974, 82, 1063–1093. 2975
66. Kahneman, D.; Knetsch, J.L. Valuing public goods: The purchase of moral satisfaction. J. Environ. Econ. Manag.1992, 22, 57–70. 67. National Institute of Environmental Research (NIER). Nationwide Pollutant Investigation in 2010; NIER: Incheon, Korea, 2011.
2980
68. Raggi, M.; Sardonini, L.; Viaggi, D. The effects of the Common Agricultural Policy on exit strategies and land re-allocation. Land Use Policy 2013, 31, 114–125. 69. Sheehan, K.B. E-mail survey response rates: A review. J. Comput. Med. Commun. 2001, 6. 70. Kwak, N.; Radler, B. A Comparision between mail and web surveys: Response pattern, respondent profile, and data quality. J. Off. Stat. 2002, 18, 257–273.
2985
71. Schaefer, D.R.; Dillman, D.A. Development of a standard e-mail methodology: Results of an experiment. Public Opin. Q. 1998, 62, 378–397. 72. Schmidt, W.C. Worldwide web survey research: Benefits, potential problems, and solutions. Behav. Res. Methods 1997, 29, 274–279.
2990
73. Smith, C.B. Casting the net: Surveying an Internet population. J. Comput. Med. Commun. 1997, 3. 74. Weible, R.; Wallace, J. The impact of the internet on data collection. Mark. Res. 1998, 10, 19–23.
2995
75. Paolo, A.M.; Bonaminio, G.A.; Gibson, C.; Patridge, T.; Kallail, K. Response rate comparisons of e-mail and mail distributed student evaluations. Teach. Learn. Med. 2000, 12, 81–84. 76. Bachmann, D.; Elfrink, J.; Vazzana, G. E-mail and snail mail face off in rematch. Mark. Res. 1999, 11, 11–15. 77. Krysan, M.; Schuman, H.; Scott, L.J.; Beatty, P. Response rates and response content in mail versus face to face surveys. Public Opin. Q. 1994, 58, 381–399.
3000
78. Gschwend, T. Analyzing quota sample data and the peer-review process. Fr. Politics 2005, 3, 88–91. 79. Northrop, A. Sampling and data collection. In Handbook of Research Methods in Public Administation, 2nd ed.; Miller, G.J., Whicker, M.L., Eds.; Marcel Dekker Inc.: New York, NY, USA, 1999.
3005
80. Ayad, M.; Barrère, B.; Otto, J. Demographic and Socioeconomic Characteristics of Households; Macro International Inc.: Calverton, MD, USA, 1997. 109
81. Ekouevi, K.; Ayad, M.; Barrère, B.; Cantor, D.C. Household structure from a comparative perspective. In Presented at the Demographic and Health Surveys Word Conference, Washington, DC, USA, 5–7 August 1991. 3010
82. Ahlheim, M.; Schneider, F. Considering household size in contingent valuation studies. Environ. Econ. 2013, 4, 112–123. 83. Awad, I.; Holländer, R. Applying contingent valuation method to measure the total economic value of domestic water services: A case study in Ramallah Governorate, Palestine. Eur. J. Econ. Financ. Adm. Sci.2010, 20, 76–93.
3015
3020
84. Florkowski, W.J.; Moon, W.; Resurrecction, A.V.A.; Paraskova, P.; Beuchat, L.R.; Chinnan, M.S.; Jordanov, J. Demographic and Socio-Economic Characteristics and the Consumption of Dietary Foods: An Illustration from an Economy in Transition; Faculty Series 98-05; University of Georgia Press: Athens, GA, USA, 1998. 85. Carlsson, F.; Köhlin, G.; Mekonnen, A. Contingent Valuation of Community Plantations in Ethiopia: A Look into Value Elicitation Formats and Intra-Household Preference Variations; Working Papers in Economics, No. 151; Göteborg University: Gothenburg, Sweden, 2004. 86. Köhlin, G. Contingent valuation in project planning and evaluation: The case of social forestry in Orissa, India. Environ. Dev. Econ. 2001, 6, 237–258.
3025
87. Statistics Korea (KOSTAT), Korean Statistic Information Service (KOSIS). Available online: http://kosis.kr/statisticsList/statisticsList_01List.jsp?vwcd=MT_ZTITLE&parentId=A (accessed on 18 October 2016). 88. Han River Management Committee. Water Use Charge Management Status. Available online: http://www.hanriver.or.kr (accessed on 2 September 2016).
3030
3035
89. Seoul Metropolitan Government (SMG). A White Paper on Improving Water Use Charge System; SMG: Seoul, Korea, 2014. 90. Plott, C.R. Rational individual behaviour in markets and social choice process: The discovered preference hypothesis. In The Rational Foundations of Economic Behaviour; Arrow, K., Colombatto, E., Perlaman, M., Schmidt, K., Eds.; St Martin’s Press: New York, NY, USA, 1996; pp. 225–250. 91. Millennium Ecosystem Assessment (MEA). Ecosystems and Human Well-Being: Synthesis; Island Press: Washington, DC, USA, 2005.
110
3040
3.9 Appendix 3.9.1 Water consumers questionnaire I SQ1. Gender 1. Male SQ2. Age (
3045
2. Female year)
1. 19 to 29 2. 30s 3. 40s 4. Over 50 SQ3. Residential districts
3050
1. Seoul 2. Incheon 3. Gyeonggi-do 4. Gangwon-do 5. Chuncheongbuk-do
3055
6. Otherwise ☞ Interview closing
SQ4. Head of the household 1. Yes
2. No ☞ Interview closing
PART A. Water quality perception and water use behavior in the Han River basin A1. Do you know the fact that the Han River is a source of water that is supplied to your 3060
residential district? 1. Yes
2. No
A2. Please tell us what you normally use the tap water or the Han River for (multiple responses) 1. Drinking water 3065
2. Water for living 111
3. Water for commercial use (fishing, recreation) 4. Private water activities (swimming, fishing, boating, water-skiing, windsurfing) 5. Enjoying river scenery 6. Artistic activities such as pictures and paintings 3070
7. Experience in natural 8. Water for agricultural use 9. Otherwise A3. What is the distance from your residence to the Han River? 1. Less than 10km
3075
2. 10 to 30km 3. 30 to 50km 4. 50 to 70km 5. 70 to 100km 6. 100 to 150km
3080
7. 150 to 200km 8. More than 200km A4. How often do you see the Han River in your daily life including commuting? 1. One or more per day 2. One or more per week
3085
3. One or more per month 4. Hardly 5. Never A5. How do you feel about the quality of water in the Han River? 1. Excellent ☞ Go to A5-1
3090
2. Good ☞ Go to A5-1 3. Normal ☞ Go to A5-2 4. Bad ☞ Go to A5-3 5. Very bad ☞ Go to A5-3
A5-1. Why do you think that the Han River has good water quality? 112
3095
1. It looks clean 2. Tap water can be drunk without purifying 3. Most of the media say that the water quality is good in the Han River 4. It is possible to swim in the Han River 5. It is possible to eat fish taken in the Han River
3100
6. It does not smell in the Han River 7. Otherwise A5-2. Why do you think that the Han River has normal water quality? 1. It looks clean 2. Tap water can be drunk without purifying
3105
3. Most of the media say that the water quality is good in the Han River 4. It is possible to swim in the Han River 5. It is possible to eat fish taken in the Han River 6. It does not smell in the Han River 7. Otherwise
3110
A5-3. Why do you think that the Han River has bad water quality? 1. It does not look clean 2. It is not possible to drink tap water without purifying 3. Most of the media say that the water quality is bad in the Han River 4. It is not possible to swim in the Han River
3115
5. It is not possible to eat fish taken in the Han River 6. It smells in the Han River 7. Otherwise PART B. Opinions on conservation and management of water quality B1. How important do you think that conserving or managing water quality is at the
3120
individual level? 1. Very important 2. Important 3. Normal 4. Unimportant 113
3125
5. Totally unimportant B2. How important do you think that conserving or managing water quality is at the national level?? 1. Very important 2. Important
3130
3. Normal 4. Unimportant 5. Totally unimportant B3. What do you think the main pollutants are in the Han River? (Multiple responses) 1. Factory waste water
3135
2. Mine waste water 3. Domestic sewage 4. Water-related leisure activities 5. Industrial waste dumping 6. Landfill leachate
3140
7. Inflow of contaminated rainwater 8. Soil erosion from upstream high mountainous agricultural fields in the Han River basin 9. Otherwise PART C. Opinions on the policy for soil erosion prevention and its cost-sharing system C1. During summer monsoon, have you seen the turbid water caused by soil erosion from
3145
upstream areas in the Han River basin? 1. Yes ☞ Go to C1-1
2. No ☞ Go to C1-2
C1-1. What did you think of the turbid water in the Han River? (Multiple responses) ☞ Go to C2 1. Boiling drinking water or installing a water purifier 3150
2. Cost increase in purifying tap water at the national or local government level 3. Damage to aquatic ecosystems such as fish and plants 4. Impossible to play in the water such as swimming and boating 5. Aesthetically unpleasing view 114
6. As time goes by it will return to normal 3155
7. No problem C1-2. What will you do if the turbid water is prevalent in the Han River? Or what do you think about prevalent turbid water in the Han River? (Multiple responses) 1. Boiling drinking water or installing a water purifier 2. Cost increase in purifying tap water at the national or local government level
3160
3. Damage to aquatic ecosystems such as fish and plants 4. Impossible to play in the water such as swimming and boating 5. Aesthetically unpleasing view 6. As time goes by it will return to normal 7. No problem
3165
C2. What do you think the main causes of inflow of turbid water to the Han River are? 1. Natural factors such as typhoons and heavy rainfalls 2. Human factors in failing to prevent damage resulting from soil erosion 3. A combination of natural and human factors C3. Do you think it is necessary to prevent turbid water caused by soil erosion in upstream
3170
areas from flowing into downstream areas in the Han River basin? 1. Very necessary 2. Somewhat necessary 3. Not really necessary 4. Wholly unnecessary
3175
C4. Who should pay for the turbid water prevention measure in the Han River basin? 1. Local governments or their citizens who benefit from water quality improved by the measure 2. Local governments or their citizens who produce pollution sources and cause turbid water 3. Both beneficiaries and polluters
3180
C5. What do you suggest as a better financing method for the turbid water prevention in the Han River?
115
1. Securing funds through reduction or abolition of existing programs of the central or local governments 2. A tax levied on people’s benefits from the restoration of environmental pollution 3185
3. People’s or businesses’ voluntary donations 4. Otherwise PART D. Domestic radish, Chinese cabbage, and Kimchi purchase intention D1. Do you think radish and cabbage, as a main ingredient of Kimchi you have at home or in the restaurant are all domestically produced?
3190
1. Yes ☞ Go to D2-1
2. No ☞ Go to D2
D2. Do you think domestic radish and cabbage must be used at home or in the restaurant? 1. Yes ☞ Go to D2-1
2. No ☞ Go to E1
D2-1. Due to the radish and cabbage produced in high mountainous agricultural fields during the summer season, Korean people can have Kimchi throughout the year. However, due to 3195
floods and droughts during the summer and land use restriction programs if the supply of both radish and cabbage is not smooth, prices in domestic radishes and cabbages may sharply increase. Consequently, this may lead to significant increase in importing foreign radish, cabbage, and Kimchi, especially from China. Are going to purchase only domestic radish, cabbage, and Kimchi despite a sharp rise in their prices?
3200
1. Yes ☞ Go to D2-1-1
2. No ☞ Go to E1
D2-1-1. Why do you want to have only domestic radish and cabbage or Kimchi? Is the main reason the food safety? 1. Yes ☞ Go to D2-1-1-1
2. No ☞ Go to D2-1-1-2
D2-1-1-1. If the food safety of imported agricultural products (radish and cabbage or Kimchi) 3205
is guaranteed are you willing to purchase them? ☞ Go to E1 1. Yes
2. No
D2-1-1-2. What is another reason if the main reason is not the food safety? 116
1. Eating domestic products is better for health 2. Purchasing domestic products is help to farmers 3210
3. Domestic products are fresher 4. Otherwise PART E. Willingness to pay for soil erosion prevention policy Before cultivating radish and Chinese cabbage (RCC) in the fall, during the hot summer only RCC produced in high mountainous agricultural fields radish can be supplied and enable Korean people to have domestic Kimchi all through the year. However, the summer RCC are mostly produce in high mountain areas that have an altitude more than 400m and cause massive soil erosion during the summer monsoon. The inflow of the soil that contains significant agrochemicals to the Han River leads to the contaminated turbid water
Damage from the soil erosion in high mountainous agricultural fields in the lower reaches of the Han River
1. Destruction of habitats of animals and plants 2. Sharp increase in purifying drinking water or unfit to drink 3. Poor river landscape, causing significant inconvenient for downstream residents and negatively affecting tourism
Gangwon province, an upstream area in the Han River basin, has around 85% of the highland vegetable-producing areas. The soil erosion from those areas is the main cause of the contaminated turbid water in the Han River basin.
We make two assumptions
1. After the discontinuance of radish and Chinese cabbage in high mountain areas conversion to other crops can significantly contribute to preventing soil erosion 2. Since 2013 a policy for fully restricting the highland vegetable–producing agriculture is scheduled to run
117
Possible results after the assumption 1. Need for alternatives such as compensating for farmers’ income loss from the highland radish and Chinese cabbage producing restriction policy 2. Need for the thorough quarantine to guarantee the safety of foreign (China) vegetables which are fairly imported to remove concerns over a sharp rise in vegetable prices caused by the highland agriculture abandonment (Government’s additional costs) ∵ Consequently, the highland agriculture restriction policy can contribute to preventing the inflow of the contaminated turbid water to the Han River. It, however, means that the government or individuals should pay for the policy (additional costs) in order to gain those benefits
In this case, alternatives (alternative crops or compensation) to ensure farmers to gain income more than profits from existing highland agriculture are necessary to make them abandon their vegetable producing. In addition, relatively cheap vegetables imported from should be supplied to prevent price increases in domestic summer radish, cabbage, and Kimchi caused by the highland agriculture abandonment.
E1. Do you agree with the highland agriculture restriction policy in upstream areas of the Han 3215
River basin for preventing the turbid water in the downstream areas which is caused by soil erosion from highland radish and Chinese cabbage producing areas? 1. Yes ☞ Go to E1-1
2. No ☞ Go to E1-2
E1-1. What do you think the most effective method (alternative) is? Please answer after careful consideration of benefits from each alternative and costs incurred by implementation 3220
of those alternatives ☞ Go to E2
Alternatives
Conversion from radish and Chines cabbage (RCC) into
Benefits
118
Costs
1
Other crops of 100% which do not cause soil erosion
Other crops of 50% which do not cause soil erosion 2 Forest of 50% for producing timber and biofuel
Other crops of 50% which do not cause soil erosion 3
Forest of 50% in which all of the economic activities(clearing or cutting) are prohibited Forest of 50% for producing timber and biofuel
4
5
Forest of 50% in which all of the economic activities(clearing or cutting) are prohibited
Forest of 100% for producing timber and biofuel
Decline in RCC prices in domestic markets resulting from increase in cheap RCC imports
Decline in domestic timber and biofuel (DTB) prices resulting from increase in cheap DTB imports
Easily managed food safety Decline in RCC prices in domestic markets resulting from increase in cheap RCC imports
Degraded multifunctionality of forest
Easily managed food safety Decline in domestic timber and biofuel (DTB) prices resulting from increase in cheap DTB imports Decline in RCC prices in domestic markets resulting from increase in cheap RCC imports Easily managed food safety Improved multifunctionality of forest Decline in domestic timber and biofuel (DTB) prices resulting from increase in cheap DTB imports Improved multifunctionality of forest
Decline in domestic timber and biofuel (DTB) prices resulting from increase in DTB production
Degraded multifunctionality of forest
Decline in domestic timber and biofuel (DTB) prices resulting from increase in cheap DTB imports
Decline in RCC prices in domestic markets resulting from increase in cheap RCC imports Increase in costs of managing food safety Decline in RCC prices in domestic markets resulting from increase in cheap RCC imports Increase in costs of managing food safety Degraded multifunctionality of forest
119
6
Forest of 100% in which all of the economic activities(clearing or cutting) are prohibited
Decline in RCC prices in domestic markets resulting from increase in cheap RCC imports Improved multifunctionality of forest
Increase in costs of managing food safety Decline in domestic timber and biofuel (DTB) prices resulting from increase in cheap DTB imports
E1-2. What is the reason why you do not agree with the highland agriculture restriction policy? (Multiple responses) 1. Because abandoning the RCC cultivation in high mountain areas can have a significantly 3225
negative impact on local economies 2. Because abandoning the RCC cultivation in high mountain areas can have a significantly negative impact on local farmers 3. Because abandoning the RCC cultivation in high mountain areas can have a significantly negative impact on the national economy
3230
4. Because due to decline in the production of domestic RCC during the summer prices of domestic RCC can be sharply rise 5. Because additional costs are necessary for the highland agriculture restriction policy 6. Because there might be other alternative methods to prevent only soil erosion without abandoning RCC cultivation
3235
7. Because farmers who cultivate RCC in high mountain areas have to take care of it by themselves 8. Otherwise E2. Are you willing to pay KRW ( ) per month by tax for preventing the contaminated turbid water in the Han River basin?
3240
1. Yes ☞ Go to E2-1
2. No ☞ Go to E2-2
E2-1. Are you willing to pay KRW ( ) per month by tax for preventing the contaminated turbid water in the Han River basin? 120
1. Yes ☞ Go to E2-1-1
2. No ☞ Go to E2-1-2
E2-1-1. Are you willing to pay KRW ( ) per month by tax for preventing the contaminated 3245
turbid water in the Han River basin? 1. Yes ☞ Go to E3
2. No ☞ Go to E3
E2-1-2. Are you willing to pay KRW (
) per month by tax for preventing the contaminated
turbid water in the Han River basin? 1. Yes ☞ Go to E3 3250
2. No ☞ Go to E3
E2-2. Are you willing to pay KRW ( ) per month by tax for preventing the contaminated turbid water in the Han River basin? 1. Yes ☞ Go to E2-2-1
2. No ☞ Go to E2-2-2
E2-2-1. Are you willing to pay KRW ( ) per month by tax for preventing the contaminated turbid water in the Han River basin? 3255
1. Yes ☞ Go to E3
2. No ☞ Go to E3
E2-2-2. Are you willing to pay KRW ( ) per month by tax for preventing the contaminated turbid water in the Han River basin? 1. Yes ☞ Go to E3
2. No ☞ Go to E3
E3. Please indicate the final accepted amount regardless of ‘yes’ or ‘no’ response. How much 3260
is the largest amount of money would you pay for the policy of restricting highland vegetableproducing agriculture in order to prevent soil erosion and contaminated turbid water in the Han River basin?
KRW (
) per month (Include respondents who said KRW ‘0’ ☞ Go
to E4) E4. What is the reason why you don't want to pay for the expense? 3265
1. I can't afford it financially. 2. Government should have responsibility for environmental issues 3. Local government should have responsibility for environmental preventative measures 4. It has intent to tax more as a turbid water prevention measure 121
5. I have no idea which alternative is the most practical for the turbid water prevention 3270
6. Otherwise PART F. Social economic background FQ1. Do you have children? (Multiple responses) 1. No child 2. Infants / Kindergartener
3275
3. Elementary school 4. Middle school 5. High school FQ2. How many years have lived in your current city? (
) years
FQ3. Where were you born? 3280
1. Districts associated with the Han River basin 2. Districts associated with the Geum, Nakdong, Yeongsan River basins except the Han River 3. Districts unrelated to the Han, Geum, Nakdong, YeonGsan River basins FQ4. What is your highest level of academic education? Elementary school 1
3285
2
3
4
5
6
Middle
High
College /
school
school
University
1
2
3
Master 1
2
3
1
DQ5. How much do you earn per year in your household? 1. Less than 10 million won 2. 10 million won to less than 20 million won 3. 20 million won to less than 30 million won 4. 30 million won to less than 40 million won
3290
2
5. 40 million won to less than 50 million won 6. 50 million won to less than 60 million won 7. 60 million won to less than 70 million won 8. 70 million won to less than 80 million won 9. 80 million won to less than 90 million won 122
3
4
1
2
Ph.D 1
2
3
4
5
3295
10. 90 million won to less than 100 million won 11. More than 100 million won DQ6. Please, mark ‘√’ Very much ☜ ① ② ③ Do you think that the information given in this questionnaire is sufficient to answer? Do you think that the information given in this questionnaire is the same as what you know? Do you think that the information given in this questionnaire is enough to be understood?
3.9.2 Water consumers questionnaire II (Korean) 3300
SQ1.성별 ① 남자 ② 여자 SQ2. 연령 (만
세)
① 만 19 – 29 세 3305
② 30 대 ③ 40 대 ④ 50 대 이상 SQ3. 거주지역 ① 서울
3310
② 인천 ③ 경기도 ④ 강원도 ⑤ 충청북도 ⑥ 기타 ☞ 면접종료
3315
SQ4. 가구 세대주 ① 예 ② 아니오 ☞ 면접종료
123
④
⑤
☞ Very little
PART A. 한강(북한강, 남한강) 이용 행태 및 수질(水質)에 대한 견해 A1. 선생님께서 거주하고 계신 지역의 식수원이 한강(북한강, 남한강)이라는 사실을 알고 계 3320
십니까? ① 알고 있다
② 모르고 있다
A2. 평소에 수돗물과 한강(북한강, 남한강)을 어떠한 용도로 이용 또는 활용 하십니까? (복수응답 가능)
3325
① 식수
② 일반 생활 용수
③ 사업용(어업, 레크레이션 등)
④ 물놀이(수영, 낚시, 뱃놀이, 수상스키, 윈드서핑
등) ⑤ 하천경관 감상
⑥ 사진, 그림 등 예술 활동
⑦ 자연체험 학습
⑧ 농업 용수
⑨ 기타 ( ) 3330
A3. 선생님께서 거주하고 계신 지역은 한강(북한강, 남한강)에서 어느 정도 거리에 위치하고 있습니까? ① 10Km 이내 ② 10-30Km 이내 ⑤ 70-100Km 이내
③ 30-50Km 이내
⑥ 100-150Km 이내
④ 50-70Km 이내
⑦ 150-200Km 이내
⑧ 200Km 이상
A4. 선생님께서는 일상 생활(출/퇴근을 포함)을 하면서 한강(북한강, 남한강)을 어느 3335
정도 자주 보십니까? ① 매일 1 회 이상
② 1 주일에 1 회 이상 ③ 한달에 1 회 이상 ④ 거의 보지 못한다 ⑤
전혀 보지 못한다 A5. 평소 한강(북한강, 남한강)을 이용 또는 활용하면서 수질이 어떻다고 생각하십니까? ① 매우 좋다 ☞ A5-1 로 3340
② 좋다 ☞ A5-1 로 ③ 보통이다 ☞ A5-2 로
④ 나쁘다 ☞ A5-3 로 ⑤ 매우 나쁘다 ☞ A5-3 로 A5-1. 한강(북한강, 남한강)의 수질(水質)이 좋다고 생각하시는 이유는 무엇입니까? ① 보기에 깨끗해 보이기 때문에 ② 수돗물을 그냥 마실 수 있기 때문에 ③ 방송, 신문 등 언론매체에서 수질이 좋다고 하기 때문에
3345
④ 물놀이를 할 수 있기 때문에
124
⑤ 한강에서 잡히는 물고기를 먹을 수 있기 때문에 ⑥ 한강 물에서 냄새가 나지 않기 때문에 ⑦ 배를 타고 보니 깨끗해 보여서 ⑧ 기타 ( 3350
)
A5-2. 한강(북한강, 남한강)의 수질(水質)이 보통이라고 생각하시는 이유는 무엇입니까? ① 보기에 깨끗해 보이기 때문에 ② 수돗물을 그냥 마실 수 있기 때문에 ③ 방송, 신문 등 언론매체에서 수질이 좋다고 하기 때문에 ④ 물놀이를 할 수 있기 때문에
3355
⑤ 한강에서 잡히는 물고기를 먹을 수 있기 때문에 ⑥ 한강 물에서 냄새가 나지 않기 때문에 ⑦ 배를 타고 보니 깨끗해 보여서 ⑧ 기타 (
)
A5-3. 한강(북한강, 남한강)의 수질(水質)이 나쁘다고 생각하시는 이유는 무엇입니까? 3360
① 보기에 깨끗해 보이지 않기 때문에 ② 수돗물을 그냥 마실 수 없기 때문에 ③ 방송, 신문 등 언론매체에서 수질이 나쁘다고 하기 때문에 ④ 물놀이를 할 수 없기 때문에 ⑤ 한강에서 잡히는 물고기를 먹을 수 없기 때문에
3365
⑥ 한강 물에서 역한 냄새가 나기 때문에 ⑦ 배를 타고 보니 지저분해 보여서 ⑧ 기타 (
)
PART B. 수질(水質) 보전 및 관리에 관한 견해 B1. 선생님께서는 개인적 차원에서 수질(水質)을 보호하고 관리하는 것이 얼마나 3370
중요하다고 생각하십니까? ① 매우 중요하다
② 중요하다
③ 보통이다
④ 중요하지 않다
⑤ 전혀 중요하지 않다
125
B2. 그렇다면, 이번에는 국가적 차원에서 수질(水質)을 보호하고 관리하는 것이 얼마나 중요하다고 생각하십니까? 3375
① 매우 중요하다
② 중요하다
③ 보통이다
④ 중요하지 않다
⑤ 전혀 중요하지 않다
B3. 선생님께서는 수질(水質)을 오염시키는 주(主)원인이 무엇이라고 생각하십니까? 순서대로 1 순위부터 2 순위까지 응답해 주십시오. 1 순위 ( ), 2 순위 ( )
3380
① 공장 폐수
② 광산 폐수
③ 생활 하수
④ 물놀이
⑤ 산업 폐기물 투기
⑥ 쓰레기매립장(처리장)으로부터의 침출수
⑦ 자동차도로의 (오염된) 빗물 유입 ⑧ 한강(북한강, 남한강) 상류 고랭지농업의 토사 유출
⑨ 기타 ( )
PART C. 토사 유출 방지 정책 및 비용 부담 주체에 관한 의견 3385
C1. 선생님께서는 한강(북한강, 남한강) 상류의 토사 유출로 인하여 한강(북한강, 남한강) 하류가 흙탕물이 된 것을 본 경험이 있습니까? ① 예 ☞ C1-1 로
② 아니오 ☞ C1-2 로
C1-1. 그렇다면, 흙탕물로 변한 한강(북한강, 남한강)을 보고 어떤 생각이 들었습니까? (복수 응답 가능) ☞ 응답 후 C2 로 3390
① 수돗물을 끓여 먹거나 정수기 설치 등 대책을 세워야 할 것 같다 ② 국가나 지자체 차원에서 수돗물 정화에 예산이 늘어날 것 같다 ③ 물고기들이나 식물들의 생태계가 파괴 될 것 같다 ④ 수영, 보트놀이 등과 같은 물놀이가 불가능할 것 같다 ⑤ 미관상 좋지 않다
3395
⑥ 시간이 지나면 원래의 상태로 돌아 갈 것 같다
⑦ 아무런 문제없다
C1-2. 만약, 여름철 집중 호우 등의 영향으로 한강 상류 지역의 토사가 유출되어 한강이 흙탕물로 변한다면 어떤 생각이 들것 같습니까? (복수 응답 가능) ① 수돗물을 끓여 먹거나 정수기 설치 등 대책을 세워야 할 것 같다 ② 국가나 지자체 차원에서 수돗물 정화에 예산이 늘어날 것 같다 3400
③ 물고기들이나 식물들의 생태계가 파괴 될 것 같다 ④ 수영, 보트놀이 등과 같은 물놀이가 불가능할 것 같다 ⑤ 미관상 좋지 않다
126
⑥ 시간이 지나면 원래의 상태로 돌아 갈 것 같다
⑦ 아무런 문제없다
C2. 선생님께서는 한강(북한강, 남한강)의 흙탕물 유입의 주요 원인이 무엇이라고 3405
생각하십니까? ① 태풍, 집중호우와 같은 자연적 요인 ② 토사 유출 피해를 방지하지 못한 인적 요인 ③ 자연적 요인과 인적 요인의 복합적 원인 C3. 선생님께서는 한강(북한강, 남한강) 상류의 토사 유출로 인하여 한강(북한강,
3410
남한강) 하류에 흙탕물이 생기는 것을 방지하기 위한 대책이 필요하다고 생각하십니까? ① 매우 필요 ② 어느 정도 필요 ③ 필요하지 않음 ④ 전혀 필요하지 않음 C4. 선생님께서는 흙탕물 방지 대책 수립을 위한 비용은 누가 부담해야 한다고 생각하십니까? ① 맑은 한강으로 인해 혜택을 받는 지자체 및 주민이 부담
3415
② 흙탕물을 발생시킨 원인자 또는(및) 지자체가 부담 ③ 혜택을 받는 쪽과 원인을 제공한 쪽 모두 비용을 나누어 부담 C5. 선생님께서는 한강(북한강, 남한강) 하류의 흙탕물 방지 대책 수립을 위한 비용이 어떻게 조달되어야 한다고 생각하십니까? ① 정부 또는 지방자치단체의 기존 사업을 축소/폐지하여 예산 확보 후 조달
3420
② 국민들에게 환경오염 복구를 위한 명목의 세금 추가 징수로 조달 ③ 국민 또는 기업의 자발적 기부금을 통해 조달 ④ 기타 (
)
PART D. 국내산 무/배추, 김치 구매 의향 D1. 선생님께서 가정이나 식당에서 먹는 김치의 주재료인 무/배추가 모두 국내산이라고 3425
생각하십니까? ① 예 ☞ D2-1 로
② 아니오 ☞ D2 로
D2. 그렇다면, 김치의 주재료인 무/배추가 반드시 국내산이어야 한다고 생각하십니까? ① 예 ☞ D2-1 로
② 아니오 ☞ E1 으로
D2-1. 우리나라는 여름에 출하되는 고랭지 무/배추로 인하여 1 년 내내 국내산 김치를 3430
먹을 수 있습니다. 그러나 여름철 홍수나 가뭄으로 인해 고랭지 지역의 무/배추가
127
원활히 공급되지 못할 경우 국내산 무/배추 가격이 급등하여 외국산(중국) 무/배추와 김치를 먹을 수도 있습니다. 선생님께서는 국내산 무/배추의 가격이 급등하는 경우에도 국내산 무/배추 또는 김치만을 구입하여 드십니까? ① 예 ☞ D2-1-1 로 3435
② 아니오 ☞ E1 로
D2-1-1.국내산 무/배추 또는 김치만을 구입해서 드시고자 하는 이유가 안전성 때문입니까? ① 예 ☞ D2-1-1-1 로
② 아니오 ☞ D2-1-1-2 로
D2-1-1-1. 외국산(중국) 수입 무/배추나 김치의 안전성 문제가 해결될 경우 외국산(중국) 수입 무/배추나 김치를 구입해서 드실 의향이 있습니까? ☞ 응답 후 E1 으로 3440
① 예
② 아니오
D2-1-1-2. 안전성 때문이 아니라면, 다른 이유는 무엇입니까? ① 국내산 농산물을 먹는 것이 건강에 좋기 때문에 ② 국내산 농산물을 구입하는 것이 농민에게 도움이 되기 때문에 ③ 국내산 농산물이 신선하기 때문에 3445
④ 기타 ( )
PART E. 토사 유출 방지 정책 수립을 위한 비용 지불 의사액 ※ 아래의 내용을 읽고 답하여 주십시오. 가을에 무/배추가 출하되기 전까지 강원도 등 고랭지 지역에서 생산되는 무/배추 만이 김치의 주원료로 공급되어 한여름에도 우리나라 국민들이 국내산 김치를 먹을 수 있습니다. 그러나 고랭지 지역에서의 무/배추는 400m 이상의 산간 경사지에서 생산되기 때문에 비가 오면 많은 토사가 하천으로 유입되어 하천을 흙탕물로 만들게 됩니다. 고랭지 지역 토사 유출로 인한 피해 ① 한강(북한강/남한강) 하류 지역의 동 ․ 식물의 서식지가 파괴 ② 한강(북한강/남한강) 하류 지역의 식수 사용을 위한 정화 처리 비용 상승 또는 식수 사용 불가능 ③ 한강(북한강/남한강) 하류 지역의 하천경관이 나빠져 하천을 생활 반경에 두고
128
있는 주민들의 피해 발생 ④ 한강(북한강/남한강) 하류 지역의 하천경관이 나빠져 관광 불가능 이러한 한강(북한강/남한강)의 흙탕물 변화는 무/배추 고랭지 농업의 약 85% 가 위치한 강원도 고랭지 농업지대의 토사 유출이 주요 원인인 것으로 조사되었습니다. 여기서 2 가지 가정을 하겠습니다. 가정 ① : 고랭지 지역의 무/배추 생산행위 중단 후 토사유출을 방지할 수 있는 타(他)작목 전환 대안이 있다고 가정 가정 ② : 2013 년부터 고랭지 지역의 무/배추 경작행위를 전면 중단하는 정책이 실행된다고 가정 가정 후 발생 가능한 사례 발생 사례 ① : 고랭지 무/배추 경작으로 수익을 얻던 농민들을 위해 수익을 보장해 줄 대안 필요 발생 사례 ② : 고랭지 무/배추 경작 포기로 인하여 여름철 국내 무/배추 가격 상승을 우려 조치를 해결하기 위한 해결책으로 중국산 채소 수입. 이 경우 식품안전 보장을 위해 철저한 검사와 검역이 필요 (정부 추가 예산 발생) ∵ 결과적으로 고랭지 무/배추 경작을 전면 중단하여 흙탕물이 발생하지 않게 됨으로써 얻는 이익을 위하여 국가든 개인이든 추가적 비용을 지불해야 한다는 것을 의미 이 경우 한강 상류 무/배추 경작 농업인들에게 기존의 무/배추로부터 얻어 왔던 수익 이상을 보장할 수 있는 대안(대체작목 제시 또는 보상)이 제시되어야 고랭지 무/배추 경작인들이 무/배추 경작을 포기할 수 있을 것입니다. 또한 한강 상류 고랭지 무/배추 경작 포기로 인하여 여름철에 국내산 무/배추 가격이 상승하게 되어 가격상승을 막기 위한 조치로 중국으로부터 무/배추를 수입해서 싼 가격에 무/배추를 공급해야 합니다.
E1. 위의 글을 읽으신 후, 선생님께서는 한강(북한강/남한강) 상류 고랭지 농업 3450
지역에서의 무/배추 경작 행위로 비가 오면 토사가 유출되어 한강(북한강/남한강) 하류
129
지역이 흙탕물로 변하는 것을 방지하기 위하여 한강(북한강/남한강) 상류 고랭지 농업 지역에서의 무/배추 경작 행위를 제한하는 정책에 찬성하십니까? 반대하십니까? ① 찬성한다
☞ E1-1 로
② 반대한다
☞ E1-2 로
E1-1. 한강(북한강/남한강) 상류 고랭지 농업 지역의 토사 유출로 한강(북한강/남한강) 3455
하류가 흙탕물로 변하는 것을 방지하기 위해 한강(북한강/남한강) 상류 고랭지 농업 지역에서의 무/배추 경작 행위에 제한이 필요하다면, 다음 중 가장 효과적일 것 같은 방법은 무엇이라고 생각하십니까? 각각의 대안으로 전환 될 경우에 얻게 되는 혜택과 포기해야 되는 혜택을 검토한 후 응답해 주십시오. ☞ 응답 후 E2 로 대안
고랭지 무/배추 경작지 전환
대안
토사 유출이 발생하지 않는 다른 작물로
①
모두 전환
얻게 되는 혜택
포기해야 하는 혜택
전환 작물의 해외수입 대체
목재/바이오연료 해외수입
가격하락/식품안전성관리 용이
대체/가격하락 산림의 공익적 기능효과
전환 작물의 해외수입 대체 토사 유출이 발생하지 않는 다른 작물과
가격하락/식품안전성관리
목재/바이오 연료용 산림을 각각 50%의
용이
대안 ②
비율로 전환
산림의 공익적 기능효과
목재/바이오연료 해외수입 대체/가격하락 전환 작물의 해외수입 대체
토사유출이 발생하지 않는 다른 작물과 대안 ③
가격하락/식품안전성관리 개발이 금지되는 절대 산림을 각각 50%의
용이
목재/바이오연료 해외수입 대체/가격하락
비율로 전환 산림의 공익적 기능효과 목재/바이오 연료용 산림과 개발이
목재/바이오연료 해외수입
대안 ④
전환 작물의 해외수입 대체 금지되는 절대 산림을 각각 50%의 비율로 전환
대체/가격하락 가격하락/식품안전성관리 용이 산림의 공익적 기능효과 전환 작물의 해외수입 대체
대안
목재/바이오연료 해외수입
가격하락/식품안전성관리
목재/바이오 연료용 산림으로 모두 전환 ⑤
대체/가격하락
용이 산림의 공익적 기능효과 전환 작물의 해외수입 대체 가격하락/식품안전성관리
대안 개발이 금지되는 절대 산림으로 모두 전환
산림의 공익적 기능효과
용이
⑥ 목재/바이오연료 해외수입 대체/가격하락
130
3460
E1-2. 그렇다면, 한강 상류 고랭지 농업 지역에서의 무/배추 경작행위를 제한하는 정책에 반대하는 이유는 무엇입니까? (복수응답 가능) ① 고랭지 지역에서의 무/배추 경작 전면 중단은 해당 지역 경제에 피해를 주기 때문에 ② 고랭지 지역에서의 무/배추 경작 전면 중단은 해당 지역 농민에게 피해를 주기 때문에
3465
③ 고랭지 지역에서의 무/배추 경작 전면 중단은 국가 경제에 피해를 주기 때문에 ④ 국내산 무/배추 생산량 감소로 인해 여름철 국내산 무/배추 가격이 오르기 때문에 ⑤ 무/배추 경작행위를 제한하는 정책에 따라 추가적인 예산이 소요되기 때문에 ⑥ 무/배추 경작은 유지하면서 경작 지역의 토사유출만을 방지하는 정책이 있을 수 있기 때문에
3470
⑦ 강원도 고랭지 농업인 스스로 알아서 할 일이기 때문에 ⑧ 기타 (
)
E2. 선생님께서는 한강이 흙탕물로 오염되는 것을 방지하기 위해, 월 ( ) 원의 세금을 추가로 납부하실 의향이 있습니까? ① 예 ☞ E2-1 로 3475
② 아니오 ☞ E2-2 로
E2-1. 그렇다면, 월 ( ) 원의 세금을 추가로 납부하실 의향이 있습니까? ① 예 ☞ E2-1-1 로
② 아니오 ☞ E2-1-2 로
E2-1-1. 그렇다면, 월 ( ) 원의 세금을 추가로 납부하실 의향이 있습니까? ① 예 ☞ E3 로
② 아니오 ☞ E3 로
E2-1-2. 그렇다면, 월 ( ) 원의 세금을 추가로 납부하실 의향이 있습니까? 3480
① 예 ☞ E3 로
② 아니오 ☞ E3 로
E2-2. 그렇다면, 월 ( ) 원의 세금을 추가로 납부하실 의향이 있습니까? ① 예 ☞ E2-2-1 로
② 아니오 ☞ E2-2-2 로
E2-2-1. 그렇다면, 월 ( ) 원의 세금을 추가로 납부하실 의향이 있습니까? ① 예 ☞ E3 로 3485
② 아니오 ☞ E3 로
E2-2-2. 그렇다면, 월 ( ) 원의 세금을 추가로 납부하실 의향이 있습니까? ① 예 ☞ E3 로
② 아니오 ☞ E3 로
131
E3. 앞에서 ‘예’ 또는 ‘아니오’라고 답하신 것에 상관없이 최종적으로 납부하실 의향이 있는 금액을 아래에 적어주십시오. 선생님께서는 한강의 수질 보호를 위한 토사유출 방지 정책을 위해 매 월 추가로 납부하실 의향이 있는 세금은 최대 얼마입니까? 3490
월 (
)원 E4. 선생님께서 한강 수질 보호를 위한 토사유출 방지
정책을 반대하는 이유는 무엇입니까? ① 추가적으로 세금을 납부할 여유가 없기 때문에 ② 한강을 깨끗하게 보전하는 것은 정부가 책임지는 것이기 때문에 ③ 한강 상류의 흙탕물 유입 차단은 해당 지자체가 책임지는 것이기 때문에 3495
④ 흙탕물 발생을 방지를 위한 명목으로 세금을 더 걷으려는 꼼수일 수 있기 때문에 ⑤ 여러 가지 대안이 있을 수 있는데 어떤 것이 가장 좋은 대안인지 모르기 때문에 ⑥ 기타 ( )
PART F. 일반적 사항 DQ1. 선생님께서는 아래 연령대에 속한 자녀가 있습니까? (복수 응답 가능) 3500
① 자녀 없음
② 태아/유아(초등학교 입학전까지) ③ 초등학생 ④ 중학생 ⑤ 고등학생
DQ2. 선생님께서는 현재 거주하고 계신 곳을 포함하여 한강(북한강, 남한강) 관련 지역에 얼마나 거주 하셨습니까?
(
) 년
DQ3. 선생님의 출생지는 어디십니까? ① 한강 관련 지역 ② 한강 외 4 대강 관련지역 ③ 한강 포함 4 대강과 관련이 없는 지역 3505
DQ4. 선생님께서는 학교 교육을 어디까지 받으셨습니까? 초등학교 1
2
3
4
중학교 5
6
1
2
고등학교 3
1
2
3
대학교 1
2
3
석사 4
1
2
박사 1
2
3
4
5
DQ5. 가족 모두의 (세금 공제 전) 연간 총 소득은 다음 중 어디에 해당 되십니까? (단, 혼자 독립하여 살고 있는 경우는 본인의 소득만을 고려하여 주십시오) ①1 천만원 미만 ② 1 천만원∼2 천만원 미만 ③ 2 천만원∼3 천만원 미만 3510
④ 3 천만원∼4 천만원 미만 ⑤ 4 천만원∼5 천만원 미만 ⑥ 5 천만원∼6 천만원 미만 ⑦ 6 천만원∼7 천만원 미만 ⑧ 7 천만원∼8 천만원 미만 ⑨ 8 천만원∼9 천만원 미만 ⑩ 9 천만원∼1 억원 미만
⑪ 1 억원 이상
132
DQ6. 설문지 전반에 대한 질문입니다. 각각의 항목에 대해서 해당되는 곳에 체크 하여 주십시오. 매우
내 용
그렇다
6-1. 설문지를 작성하는데 제공된 정보는 충분했다고 생각하십니까? 6-2. 각각의 제공된 정보들이 귀하가 알고 있던 것과 동일합니까? 6-3. 설문지의 정보 및 설문지 작성을 잘 이해했습니까? 3515
133
그렇다
보통
아니다
매우 아니다
Chapter 4: Economic Valuation of the Aquatic Biodiversity Conservation in 3520
South Korea: Correcting for the Endogeneity Bias in Contingent Valuation Ik-Chang Choi 1*, Hyun-No Kim 2, Hio-Jung Shin 3, John Tenhunen
1
and Trung
Thanh Nguyen 4 1
Bayreuth Center of Ecology and Environmental Research, University of Bayreuth, Bayreuth
95440, Germany;
[email protected] 3525
2
Environmental Policy Research Group, Korea Environment Institute, Sejong 30147, Korea;
[email protected] 3
Department of Agricultural and Resource Economics, Kangwon National University,
Chuncheon 24341, Korea;
[email protected] 4
3530
Institute for Environmental Economics and World Trade, University of Hannover, Hannover
30167, Germany;
[email protected] * Correspondence:
[email protected]; Tel.: +82-44-415-7981
Abstract: In this study, we use the Contingent Valuation (CV) method to estimate households’ willingness to pay (WTP) for the aquatic ecosystem health (biodiversity) 3535
improvement. This paper extends CV studies by dealing with the endogenous effect of a proxy variable, namely the subjective experience of negative environmental quality changes. The results show that the correction for the endogeneity bias facilitates the efficiency of parameter estimation in the empirical model. The mean WTP per household accounts for around 46.8% (KRW 79.6) of the current water use charge (KRW 170 per cubic meter). The
3540
total benefit from conserving the biodiversity is around KRW 198.62 billion. We found several factors that affect households’ WTP for fish biodiversity conservation, suggesting the importance of these factors in the formulation of water policies associated with aquatic biodiversity. In addition, the inefficient water management costs should be redistributed to other projects or new programs such as for the fish biodiversity conservation. 134
3545
4.1. Introduction Fish is at the very top of the aquatic ecosystem food chain and is widely used as a water quality indicator organism [1,2]. Rich fish diversity contributes to not only the provision of social-economic services, but also to the maintenance of the ecological balance of natural resources [3]. The restoration of fish habitats and the increases in populations of endangered
3550
fish can, thus, contribute to an improved provision of various ecosystem services [4,5]. On the contrary, decreases in fish biodiversity may have an adverse impact on the value of cultural services of aquatic ecosystems such as recreation, ecotourism, and education. Once the cultural value is distorted it can never be replaced [6]. Therefore, fish biodiversity conservation confers wider environmental benefits and also protects aquatic biodiversity for
3555
future generations [7]. The Han River basin is a primary source of drinking water for the Seoul metropolitan area in South Korea [8,9]. This basin is considered to have better aquatic biodiversity as a vital component of the stream food chain such as trophic diatom, benthic macroinvertebrate, and fish compared to other basins [10]. However, despite continuous efforts of the Korean
3560
government, the water quality of the basin has been an issue for years. The Han River Drinking Water Source Quality Improvement and Residents Support Act (hereafter “The Han River Law”) was, accordingly, established in 1999. A water use charge was introduced as a prime financial source for water quality improvement as stipulated in the Han River Law. Residents in the mid- and downstream areas in the Han basin (Seoul, Incheon, and part of
3565
Gyeonggi-do) who are supplied with water from upstream water source protection zones (part of Gyeonggi-do, Gangwon-do, and Chungcheongbuk-do) have to pay a water use charge [11,12].
135
One of the most severe water quality problems in the basin is attributed to water turbidity. This problem has occurred along with heavy rain events during the summer 3570
monsoon [8,13]. A high level of soil erosion from mountainous agricultural fields in upstream areas of the basin is also blamed for the contaminated turbid water problem [8,13]. An increase in turbidity levels is a primary cause of degrading water quality which leads to the degradation of aquatic ecosystems [14]. The negative effects of turbid water include, for example, breathing disorders, reduction in fertility, stunted growth, and destruction or
3575
degradation of fish habitat in all layers of the river from top to bottom [15–18]. Although fish diversity provides an important source of nutrition (food), commerce, and recreation for people [19,20], the frequent contaminated turbid water has accelerated loss in fish diversity due to the absence of practical policies and finance for the conservation and protection of endangered aquatic biota [21].
3580
Taking fish diversity to social-economic services and ecological balance into account, endangered fish species extinction would lead to a severe welfare loss to all communities in the basin. This loss indicates that fish species endangered by turbid water should have a high priority in biodiversity conservation and water management decisions which influence social well-being [22]. Consequently, economic valuation studies on fish biodiversity conservation
3585
would provide policy makers with crucial information for a better understanding of the economic value of fish biodiversity. Such information can raise the awareness of the significance of aquatic biodiversity conservation. The contingent valuation (CV) method as a stated preference approach has been widely used in the literature due to its capability of measuring the non-market value of
3590
ecosystem services [5,23]. Accordingly, there have been a number of studies using the CV method in order to measure a public preference for aquatic biota conservation [24–31]. Most of them are, however, based on single fish species which have the public’s great attention. 136
Since many people express a strong preference for conserving their favorite individual species, the WTPs may be overrated by the bias in the valuation literature. The biased information 3595
may result in a failure to fulfill conservation policy aims [22]. Despite its popularity, the CV method has potential problems about proxy variables, e.g., attitudes toward and satisfaction levels for an environmental quality change as important determinants of WTP [32]. A proxy variable based on subjective experience of environmental quality changes may be influenced by the unobserved characteristics of respondents, which
3600
affect their WTPs. If the unobserved characteristics are correlated with both the subjective experience variable and the WTP, the coefficient of the variable will be biased in a WTP model. This is defined as the endogeneity bias [32]. In other words, any WTP models with the existence of endogeneity bias would provide inconsistent parameter estimates [33]. Against these circumstances, we, first of all, investigate the factors that affect
3605
households’ WTP for aquatic biodiversity conservation in the Han River basin. Instead of single fish species, wider assessments of aquatic biodiversity conservation are carried out based on the change in fish communities influenced by turbid water. Secondly, we examine and correct the endogeneity bias of a proxy variable underlying unobservable characteristics based on the subjective experience (direct or indirect) of negative environmental quality
3610
changes caused by the turbid water. Finally, we elicit households’ WTP for aquatic biodiversity conservation and estimate the total benefits. Our study contributes to the literature in two aspects. Methodologically, we use a bivariate probit model to improve the statistical accuracy of parameter estimates through correction of the endogeneity bias, a potential problem of the CV method. Empirically, we
3615
calculate the total benefits (monetary value), which are regarded as an ecosystem service
137
value elicited from the improvement in aquatic biodiversity due to the policy enforcement, and provide pragmatic settlement for the policy relation. Our paper is structured as follows. Section 2 presents the description of case study areas including the issues associated with the distribution of water use charges and 3620
degradation and destruction of aquatic ecosystems (endangered fish communities). Section 3 describes the methodology of the study. The empirical results and discussion are presented in Section 4. Section 5 summarizes the conclusions and policy implications.
4.2 The Paldang Lake Case Study 3625
The Han River basin lies on Seoul and Incheon (downstream), Gyeonggi-do (midstream), and Gangwon-do and Chungcheongbuk-do (upstream) (Figure 4.1). The area and human population of the basin are 24,988 km2 and around 20.4 million, respectively. The upstream areas have the highest proportion of the area (65.6%, 16,398 km2), followed by the mid(31.6%, 7886 km2) and the downstream areas (2.8%, 704 km2). On the contrary, the
3630
downstream areas have the highest proportion of the population (56.6%, around 11.5 million), followed by the mid- (36.6%, around 7.5 million) and the upstream areas (6.9%, 1.4 million). The highland area for vegetable production in the basin which leads to the high soil erosion as a prime cause of the contaminated turbid water problem is 2753 km2. Around 61.8% (1702 km2) of the vegetable areas belong to the upstream areas. The water source protection zones
3635
in the basin correspond to 191.3 km2 and are predominated around the Paldang Lake in the midstream area (78.2%) [8,12].
138
Figure 4.1 The study area, Han River Basin in South Korea. Around the Paldang Lake as a main drinking water source in the Han River, basin 3640
pollution control and waste treatment facilities have been established and expanded year by year in order to protect or improve water quality. However, it has not been improved and there were growing needs for more systematic water management. The Han River Law was accordingly promulgated in 1999. Following the beneficiaries’ pay principle, a water use charge was introduced to arrange finance required for the Han River management fund. The
3645
charge has been increased from KRW 80 per cubic meter in 1999 to KRW 170 per cubic meter in 2014 (KRW is the currency unit of South Korea, and at the time of the survey (year 2014), USD 1 equaled KRW 1053.30) [11]. The residents in the mid- and downstream areas who receive various tangible and intangible benefits from the Han River have to pay this charge to the fund [8,9].
3650
The Han River basin management fund is used for (1) construction and operation of waste treatment facilities; (2) upstream land purchase and riparian zone management; (3) 139
upstream community support program; (4) water quality improvement programs such as natural stream restoration, non-point pollution source treatment, eco-friendly clean industry development, and drinking water source management; (5) operating expenses; and (6) total 3655
pollutant load management [12] (Table 4.1). Table 4.1 Management status of the water use charge. Items of Expenditure (Unit: KRW Billion) Waste treatment facility Land purchase, riparian zone management Upstream community support Water quality improvement support Operating expenses Total pollutant load management Sum 1
1999– 2002
2003
2004
2005
2006
2007
2008
2009
2010
2011
2012
2013
2014
291.49 (45.9)
147.91 (50.9)
117.93 (43.5)
156.03 (48.1)
123.31 (34.6)
136.91 (45.1)
178.21 (42.5)
203.99 (43.2)
192.06 (46.5)
255.29 (58.1)
253.03 (58.1)
170.16 (39.2)
205.85 (45.0)
76.29 (12.0)
26.82 (9.2)
51.67 (19.1)
59.69 (18.4)
116.23 (32.6)
54.69 (18.0)
109.47 (26.1)
132.33 (28.0)
94.19 (22.8)
64.85 (14.8)
61.58 (14.1)
129.44 (29.8)
115.28 (25.2)
198.16 (31.2)
80.80 (27.8)
68.33 (25.2)
72.38 (22.3)
73.24 (20.5)
65.61 (21.6)
77.17 (18.4)
75.48 (16.0)
67.46 (16.3)
66.35 (15.1)
66.15 (15.2)
69.31 (16.0)
69.67 (15.2)
65.03 (10.2)
30.76 (10.6)
28.48 (10.5)
30.70 (9.5)
36.79 (10.3)
38.23 (12.6)
45.37 (10.8)
51.81 (11.0)
49.38 (12.0)
41.90 (9.5)
42.98 (9.9)
53.24 (12.3)
51.70 (11.3)
4.40 (0.7)
4.48 (1.5)
4.60 (1.7)
5.40 (1.7)
5.90 (1.6)
6.06 (2.0)
6.62 (1.6)
6.66 (1.4)
6.62 (1.6)
6.94 (1.6)
7.27 (1.7)
7.29 (1.7)
8.05 (1.8)
0.00 (0.0)
0.00 (0.0)
0.00 (0.0)
0.00 (0.0)
1.39 (0.4)
2.10 (0.7)
2.35 (0.6)
1.70 (0.4)
3.34 (0.8)
3.89 (0.9)
4.59 (1.0)
4.20 (1.0)
6.65 (1.5) 1
636.46 (100.0)
290.78 (100.0)
271.01 (100.0)
324.20 (100.0)
356.86 (100.0)
303.60 (100.0)
419.19 (100.0)
471.97 (100.0)
413.05 (100.0)
439.22 (100.0)
435.59 (100.0)
433.63 (100.0)
457.21 (100.0)
The values in parentheses are the proportions of each expenditure item to total water use charges.
Contaminated turbid water which is released from high mountainous agricultural fields in upstream areas of the basin is still persistent. During the summer season, the 3660
highland vegetable farming is well developed in upstream areas over 400 m in altitude from the Han River basin. Intensively overusing chemical fertilizers such as nitrogen (N), phosphoric acid (P2O5), and potassium oxide (K2O) cause the topsoil to be poor. Farmers in the highland areas use 1.4 times of N, 2.4 times of P2O5, and 2.0 times of K2O more than the standard level of fertilizers recommended by the government [8,34]. Since about 50% of the
3665
highland fields descend steeply (more than 15◦ slope), soil erosion and nutrient runoff in the highland fields are further accelerated by heavy rain events during the summer season [8,35]. As stated by Kwak (2005) [36], the annual soil losses in the highland vegetable fields which have more than 15◦ slope are an average of 624.69 tons per hectare. This is eight times larger than those in other crop fields. Comparing with the Organization for Economic 140
3670
Cooperation Development (OECD) norm for annual soil losses (average 11 tons per hectare), only 17.8% of the highland fields (below 7◦ slope) meet the norm and the rest (82.2%) cause serious soil losses. This has led to a sharp rise in turbidity levels and a decline in water quality, consequently degrading the aquatic ecosystems of the basin. The fish assessment index (FAI) is one of the biological indicators for aquatic
3675
ecological health assessment using the composition and diversity of collected fish species. The FAI is classified into four categories: “A (Excellent): 87.5 ≤ FAI ≤ 100”, “B (Good): 56.2 ≤ FAI < 87.5”, “C (Fair): 25.0 ≤ FAI < 56.2”, and “D (Poor): 0 ≤ FAI < 25.0”. The higher the value of FAI, the better the ecological health [10,37,38]. Based on the FAI, fish species living in category D (poor water quality) such as Silurusasotus, Cyprinuscarpio, and
3680
Carassiusauratus, which are much less affected by turbid water, are dominant in the Paldang Lake [21]. The proportion of fish species living in category A (excellent water quality) of the basin
such
as
Rhynchocyprisoxycephalus,
Rhynchocypriskumgangensis,
and
Brachymystaxlenok had been sharply reduced from 22.2% in 2008 to 12.5% in 2011 [10]. Stress index (SI) is another useful tool for predicting the effects of the pollution 3685
intensity of turbid water [39]. The higher the value of SI, the more stressful the fish habitat is. Kim et al. (2007) [15] investigated the impacts of turbid water on the individual number, density, and communities of fish by comparing the SI of fish habitat in a turbid (Daegi) stream (TS) with that in a non-turbid (Bongsan) stream (NTS). It showed that the TS with a mean SI of 10.3 has an eighty-four times higher stressful fish habitat than the NTS with a
3690
mean SI of 5.3. The NTS is dominated by Rhynchocypriskumgangensis (around 86.4%) living in category A (excellent water quality), whereas the TS is dominated by Zacco platypus or koreanus (around 32.0%), Orthriasnudus, Iksookimiakoreensis, and Pseudogobioesocinus (around 37.5%) living in category C (fair water quality) and category D (poor water quality). Fish density in the NTS was 4.1 times higher than that in the TS. Similarly, the fish 141
3695
community in the NTS is very analogous to that in natural streams of similar size. On the other hand, the TS has totally different fish communities. These results show that the inflow of massive soil to streams destroys fish habitats by filling spaces between gravel and crevices in rocks. It also degrades biodiversity through a break in the food chain caused by burying periphyton and benthos as primary producers. Fish communities may be considerably
3700
changed under strong stresses provoked by contaminated turbid water as aquatic chronic toxicity, risking the ecological balance of the basin [15,40,41]. Operational problems of the fund have been, in addition, posed along with frequent turbid water discharge problems in the Han River basin. The wasteful and inefficient use of the fund for water quality control, e.g., overinvestment in waste treatment facilities, underperforming
3705
land purchase of riparian zones, temporary community support, has been criticized by all local communities (stakeholders) [8,11]. While residents in the downstream areas call for the refusal or abolition of the water use charge, residents in the upstream areas ask for further compensation for their contributions for providing aquatic ecosystems services for the lowland areas [8,12].The responsibility for aquatic biodiversity conservation is still in dispute
3710
between stakeholders of the river system, without evaluating the economic benefits from conservation. Still, not much is known about the economic value of aquatic biodiversity and also the potential impact of its loss on social well-being [43].
4.3 Methodology 3715
4.3.1 Measuring Welfare Change with Contingent Valuation Method Section Ecosystem services are contributions of ecosystem structure (various species composition making up the biophysical architecture) and function (capacity to provide goods and services that satisfy human needs, directly and indirectly) to human well-being [44–46], by (1) 142
creating economic wealth (income) and (2) preventing damages that impose costs on society. 3720
Therefore, both of these issues should be accounted for in policy assessments [47]. In the Han River basin, current measures and budgets required for aquatic biodiversity conservation are, however, insufficient to reduce contaminated turbid water from degrading aquatic ecosystems. There are, moreover, few studies associated with measuring positive and negative effects of the conservation policy. It is, thus, important to assess the economic
3725
benefits (monetary values) generated by the policy in order to derive optimal levels of conservation. This can help to gain reliable and objective information on trade-offs between benefits through aquatic biodiversity improvement and opportunity costs of abandoning economic and recreational activities [14,48]. The economic values of aquatic biodiversity are defined in the context of human welfare
3730
[49] and estimated by exploiting its effects on human welfare [23]. Individuals’ welfare can be affected by changes in quality of aquatic biodiversity [50]. As noted by Hicks (1943) [51], the concept of compensating surplus (CS) can be used to measure gain or loss from aquatic biodiversity. This welfare measure can be interpreted as individuals’ WTP for proposed new programs, improving quality in aquatic biodiversity which increases their welfare [23,50].
3735
An alternative is the estimation of the willingness to accept (WTA) to compensate for the loss of aquatic biodiversity. However, it is widely believed that the WTA measure is rarely used in the stated preference approach (SPA) because the SPA is not incentive-compatible for WTA measure. The National Oceanic and Atmospheric Administration (NOAA) Blue Ribbon Panel on the CV also recommends researchers to measure WTP which is likely to provide
3740
(cautious) lower values, not WTA which may provide higher values [51]. We, thus, apply WTP approaches to elicit the individuals’ preference for aquatic biodiversity conservation [52–56]. 143
This method is based on hypothetical scenarios which are similar to real conditions for aquatic biodiversity conservation. This can be much clearer by considering the relation 3745
between the expenditure function as dual to the indirect utility function and the Hicksian CS measure. The CV approach can be a way of estimating changes in the expenditure function or in the indirect utility function [57]. It has the capability of appropriately gaining the CS for an increase in the quality of aquatic biodiversity [23]. 4.3.2 Contingent Valuation Scenarios and Target Population
3750
In this study, we take into account aquatic biodiversity with regard to the abundance of fish communities, i.e., fish assessment index (FAI) and stress index (SI) showing the condition of aquatic ecosystems, according to water quality categories. Hwang et al. (2013) [10] indicated that based on the mean FAI in a recent three year period (2010 to 2012), the Han River basin overall belongs to category B (good water quality), but its FAI slightly decreased from 60.6
3755
(2007 to 2009) to 59.9 (2010 to 2012). A close look at the result revealed that the proportion of category A (excellent water quality) decreased from 22.1% to 14.6%, whereas the proportion of category C (fair water quality) increased from 26.1% to 29.5%. As stated by Mills et al. (1985) [58], if the concentration of suspended solids (SS) lasts for 31 days in a range of more than 25 mg·L−1 per year or for 11 days in a range of more than 80 mg·L−1 per year, it causes serious
3760
damage to fish habitats in rivers. This is equivalent to a mean SI ranging from 9.8 to 10.0 year−1 corresponding to Kim et al. (2007) [15] (SI of 10.3 in the turbid stream of the basin). In this respect, it is evident that the habitat of aquatic life in the basin has been influenced by contaminated turbid water, which indicates that fish communities are most likely to change under significant environmental stress caused by contaminated turbid water. Thus, we
3765
evaluate the WTP stated by households directly or indirectly associated with the basin in order to improve current levels of the mean FAI and SI. In the hypothetical market scenario, respondents are asked to choose a bid proposed or state a value for the improvement of the 144
levels of mean FAI and SI 1) by increasing the proportion of water quality category A by around 15% (from 14.6% to 30.0%) and decrease that of category C by around 15% (from 3770
29.5% to 15.0%), and (2) by reducing or keeping the concentration of SS below 25 mg·L−1 per year which have no negative impact on the habitat of aquatic life, consequently leading to abundance of fish communities (aquatic biodiversity) in the basin. Following Whitehead et al. (1995) [59], the mid- and downstream on-site users of water from the Paldang Lake in the Han River basin are surveyed in this study. This is based on
3775
their acquaintance with the goods, and also with the fact that the WTPs of on-site users are more reliable because non-users do not take into account their income constraints when presenting their WTP. The CV results developed with direct knowledge of the goods, which narrows the gap between hypothetical and real markets, are valid [60]. To elicit households’ WTP, we use the single-bounded (SB) dichotomous choice
3780
question format in which respondents are asked for a yes-no answer to the WTP question developed by Alberini (1995) [61], Bishop and Heberlein (1979) [62], Haab and McConnell (2002) [57], and Hanemann et al. (1991) [26]. Compared to the double-bounded (DB) format in which respondents are asked a second dichotomous choice question that depends on the answer to the first, the SB format derives less information from respondents and is thus less
3785
efficient. It is, however, less complex to implement the survey and to analyze the data, and is relatively free from potential preference anomalies such as anchoring and shift biases that the DB format has [3,26,63]. To set up a good bid level (or starting point), which promotes respondents to reveal their true WTP [64,65], we first had discussions with two focus groups which include each 20
3790
household heads over 19 years old. The heads are randomly selected from the mid- and downstream target population in order to gain information on (1) the preference for water use 145
and water quality; (2) the perception of water use charges and aquatic biodiversity conservation; and (3) the level of WTP for the aquatic biodiversity conservation. Based on this preliminary analysis using data gathered from the focus group meetings, the bid levels for 3795
the WTP are Type A-20% (KRW 34), Type B-40% (KRW 68), Type C-60% (KRW 102), Type D-80% (KRW 136), and Type E-100% (KRW 170) of the current water use charge (170 KRW per cubic meter). Table 4.2 shows each type of bid level proposed and the proportion of respondents’ acceptance and refusal for each bid.
3800
Table 4.2 The bids proposed and the proportion of acceptance and refusal for each bid in the contingent valuation survey. Type of Bid Levels (KRW)
Type A Type B 20% (34) 40% (68)
Type C Type D Type E 60% (102) 80% (136) 100% (170) 1
Acceptance proportion Refusal proportion
0.75 0.25
0.37 0.63
0.52 0.48
0.21 0.79
0.23 0.77
1
The values in parentheses are the amounts of money corresponding to each type of bid level (proportion of the standard water use charge). They were provided together for the convenience of respondents choosing a bid proposed.
3805
4.3.3 Survey Design and Administration A quota sampling approach as a non-probability sample technique is used in this CV study. The main advantage of this quota sampling is to provide further information at a lower cost and in a faster time than a probability sample approach [66,67]. Setting up three quotas such as age, gender, and regional population, the sample size of 500 households with ±5%
3810
sampling error was decided based on the 2013 demographics of the mid- and downstream areas in the Han River basin. To prevent one bid level from being concentrated in one district, each type of bid level is evenly and randomly distributed to each district: midstream-288 (Type A-57, Type B-57, Type C-56, Type D-58, and Type E-58) and downstream-212 (Type A-43, Type B-43, Type C-42, Type D-42, and Type E-42).
146
3815
The survey was carried out via e-mail instead of face-to-face interviews because it is being touted as a cost-effective and efficient survey implementation tool in many studies [68– 73]. Specific tracking of the number of lost e-mails and the time the e-mail survey was started, replied to, and deleted can improve sampling procedures [74]. The e-mail survey can also increase response quality. This is because respondents are prone to give longer, more detailed,
3820
and plainer responses by e-mail compared to other types of surveys [74,75]. 4.3.4 Data Analysis We use a bivariate probit model to examine the determinants of households’ WTP. The probit model not only generates predicted values between 0 and 1, but also fits well to the non-linear relationship between the probabilities and the explanatory variables [76,77]. The probit model
3825
is defined as: 𝑦𝑗∗
𝑦𝑗 = 1 if 𝑦𝑗∗ > 𝑏𝑖𝑑𝑗 = β𝑋𝑗 + 𝜀𝑗 , { 𝑦𝑗 = 0 if 𝑦𝑗∗ ≤ 𝑏𝑖𝑑𝑗
(4.1)
where 𝑦𝑗∗ represents the unobservable jth respondent’ actual WTP for aquatic biodiversity conservation; 𝑋𝑗 is a vector of the explanatory variables; β is a vector of parameters of explanatory variables; 𝜀𝑗 is the unobservable random component distributed 𝑁 (0, 𝜎); and 𝑦𝑗 is the discrete response of the jth respondent to the bid, 𝑏𝑖𝑑𝑗 , payment question (yes = 1 or 3830
no = 0). As stated by Whitehead (2006) [32], the WTP model for an improvement in aquatic biodiversity is 𝑊𝑇𝑃𝑗 = β𝑋1𝑗 + θ𝑠𝑒𝑗 + 𝜀1𝑗 , where 𝑠𝑒𝑗 is a subjective experience (both direct and indirect) of the environmental quality change, and θ is a parameter of the subjective experience. If the subjective experience variable is omitted, the WTP model is 𝑊𝑇𝑃𝑗 =
3835
β𝑋1𝑗 + 𝑒1𝑗 , where 𝑒1𝑗 is the new error term: 𝑒1𝑗 = θ𝑠𝑒𝑗 + 𝜀1𝑗 . If the subjective experience variable is correlated with any of the components of 𝑋1𝑗 , 𝑒1𝑗 is not separate from the 147
independent variables, thus leading to a bias in parameters of the 𝑋1𝑗 due to the correlation with the subjective experience of the quality change. The potential endogeneity bias can result from the inclusion of the subjective experience 3840
variable as a proxy variable. The level of the experience of the quality change is a subjective judgment which differs across individuals. The model of the subjective experience can be denoted as 𝑠𝑒𝑗 = π𝑋2𝑗 + 𝜀2𝑗 , where 𝑋2𝑗 is a vector of variables which present the level of the subjective experience of the change in environmental quality, π is a vector of parameters of the 𝑋2𝑗 , and 𝜀2𝑗 is a normally distributed error term. By putting the subjective experience
3845
model, 𝑠𝑒𝑗 , in the former WTP model, the new WTP model can be generated as 𝑊𝑇𝑃𝑗 = β𝑋1𝑗 + θ(π𝑋2𝑗 + 𝜀2𝑗 ) + 𝜀1𝑗 . If the common unobservable factors have an impact on both the subjectively perceived quality and the WTP, the correlation between 𝜀1𝑗 and 𝜀2𝑗 leads to another correlation between the subjective perception variable and the error term in the WTP model [32].
3850
If there are, in other words, the same unobserved characteristics of the individuals that influence their likelihood of gaining subjective experience of the environmental quality change and their WTP as well, basic (naïve) probit models may cause the biased and inconsistent parameter on the subjective experience variable because they would reveal the mixed effect of the subjective experience and unobservable attitudes towards the
3855
environmental quality changes. The endogeneity bias would be positive or negative if the sign of the effect of the unobserved characteristics of the individuals is the same or opposite, respectively [33]. The potential endogeneity bias may lead to unreliable estimates of households’ WTP. In particular, the relation between the subjective experience of the quality change and the
148
3860
response to the bid payment question (WTP) may be biased. Therefore, we used a twoequation bivariate probit model as follows [78,79]. ∗ 𝑦1𝑗 = β1 𝑋1𝑗 + 𝜀1𝑗
(4.2) ∗ 𝑦2𝑗
= 𝜔𝑦1𝑗 + β2 𝑋2𝑗 + 𝜀2𝑗 ,
𝑦1𝑗 (𝑒𝑥𝑝𝑒𝑟𝑖𝑒𝑛𝑐𝑒) = {
1 if 𝑆𝐸𝑗∗ > 0 1 if 𝑊𝑇𝑃𝑗∗ > 𝑏𝑖𝑑𝑗 ( ) , 𝑦 𝑎𝑐𝑐𝑒𝑝𝑡𝑎𝑛𝑐𝑒 = { 0 if 𝑆𝐸𝑗∗ ≤ 0 2𝑗 0 if 𝑊𝑇𝑃𝑗∗ ≤ 𝑏𝑖𝑑𝑗
∗ ∗ 𝑦1𝑗 and 𝑦2𝑗 are latent variables and are not observable. S𝐸𝑗∗ indicates the inclination to
have the subjective experience of the environmental quality change, 𝑊𝑇𝑃𝑗∗ shows the inclination to accept the bid proposed in the payment question, implying the WTP for the 3865
aquatic biodiversity conservation. The two latent variables can be, however, observed from the dichotomous variables, 𝑦1𝑗 (whether a respondent has directly or indirectly experienced environmental quality changes) and 𝑦2𝑗 (actual answer of a respondent to the bid payment question). S𝐸𝑗∗ and 𝑊𝑇𝑃𝑗∗ can be, thus, associated with the two reciprocative and observable dichotomous variables, experience and acceptance.
3870
Following Cappellari and Jenkins (2003) [80], the relation between experience and acceptance was modeled along with a bivariate probit model using the mvprobit in STATA. This can enable the unobserved variables, S𝐸𝑗∗ and 𝑊𝑇𝑃𝑗∗ , to be jointly distributed as a multivariate normal with a free correlation coefficient, ρ [33]. We first derived the determinants of WTP using the naïve model (Model 1) where acceptance is the dependent
3875
variable with the explanatory variables including experience. We then attempted to control the potentially endogenous experience using the bivariate probit model. One equation where experience is the dependent variable and the basic WTP equation (accept) simultaneously included in the multivariate probit model (Model 2). The variables in the experience equation 149
would reflect only on S𝐸𝑗∗ , but not on 𝑊𝑇𝑃𝑗∗ after correcting for parameters of other 3880
variables in the model. The variation in S𝐸𝑗∗ which is not correlated with the variation in 𝑊𝑇𝑃𝑗∗ may enhance the elicitation of the relation between experience and acceptance, while correcting for the correlation between the experience and the error terms in the WTP model. Following Ahlheim and Schneider (2013) [81], Farolfi et al. (2007) [82], Jones et al. (2008) [83], Mendonca and Tilton (2000) [84], Ojeda et al. (2008) [85], Phuong and
3885
Gpalakrishana (2003) [86], and Zhongmin et al. (2003) [87], we hypothesize that the households’ WTP for the aquatic biodiversity conservation are affected by (1) five sociodemographic variables for their characteristics: gender (male or female, dummy variable), age (year), children (whether to have children residing together, dummy variable), current residence of respondents (Gyeonggi-do: midstream, Seoul and Incheon: downstream, dummy
3890
variable), and income (low, med, high, dummy variable) and (2) two proxy variables for the quality change such as the perception of water quality (a 5-point Likert scale with a range from (1) very bad to (5) very good), and the subjective experience of environmental quality changes (yes or no, dummy variable). Table 4.3 presents the descriptive statistics (variable definition, mean, and standard deviation) of those variables used in the bivariate probit model.
3895
Table 4.3 Descriptive statistics of variables used in the WTP model. Variable
Definition of Variable
Mean Value
Std. Dev.
gender
Gender of respondent (1 = male, 0 = otherwise, dummy variable)
0.50
0.50
age
Age in years
42.41
11.47
0.34
0.09
children
region_d1
1 if respondent resides with children together, 0 = otherwise (dummy variable) 1 if respondent lives in Gyeonggido belonging to the midstream area in Han River basin, 0 = otherwise (dummy variable)
150
Classification
Rate (%)
1. Male 2. Female 1. Less than 30 2. 30 to less than 40 3. 40 to less than 50 4. 50 to less than 60 5. More than 60
49.6 50.4 19.0 21.4 22.6 32.2 4.8
0.47
1. No children 2. Residing with children
66.2 33.8
0.29
1. Gyeonggi_do 2. Seoul 3. Incheon
57.0 33.0 10.0
region_d2
region_d3
lowincome_d1
medincome_d2
highincome_d3 wqpercep (water quality perception)
experience
1 if respondent lives in Seoul belonging to the downstream area in the Han River basin, 0 = otherwise (dummy variable) 1 if respondent lives in Incheon belonging to the downstream area in the Han River basin, 0 = otherwise (dummy variable) 1 if income of respondent is less than KRW 30 million, 0 = otherwise (dummy variable) 1 if income of respondent is between KRW 30 million to less than KRW 50 million, 0 = otherwise (dummy variable) 1 if income of respondent is more than KRW 50 million, 0 = otherwise (dummy variable) Respondent’s current water quality perception (1 = very bad, 2 = bad, 3 = normal, 4 = good, 5 = very good) 1 if respondent has directly or indirectly (media) experienced environmental quality changes (turbid water, perish of fish, algal), 0 = otherwise (dummy variable)
0.58
0.49
0.33
0.47
0.23
0.42 1. Less than 20.0 2. 20.0 to less than 40.0 3. 40.0 to less than 60.0 4. 60.0 to less than 80.0 5. More than 80.0
10.4 29.2 31.2 17.0 12.2
0.33
0.47
0.44
0.50
2.94
0.77
1. Bad 2. Normal 3. Good
27.0 51.4 21.6
0.69
0.46
1. Experienced 2. Inexperienced
69.2 30.8
4.4 Result and Discussion 4.4.1. Profile of the Surveyed Households Of the 500 households surveyed in this study, the average income was in the range of KRW 3900
40.0 million to less than KRW 50.0 million per year per household. In general, higher income households may not be significantly affected by a deduction from their total income for the bid amount. The household member variable is likely to have a negative influence on WTP. As household member increases, budgets tighten for larger families and their WTP decreases [81,88]. Gyeonggi-do is close to the Paldang Lake as a prime water source and has the largest
3905
benefits from the use of water resources (i.e., drinking, fishing, recreation, etc.) provided by the Paldang Lake. They are also close to the upstream area (Gangwon-do) including most of the high mountainous agricultural fields as a prime source of non-point pollution. Water quality deterioration caused by turbid water may lead to a decline in the benefits of the 151
household in Gyeonggi-do [89,90]. If households have greater negative experiences and 3910
perceptions of the current water quality and fully recognize that the Paldang Lake provides diverse benefits to them, they may be more willing to pay for the aquatic ecosystem conservation program [13] (see Table 4.3). Nearly all of the respondents (99.2%) felt the necessity of the aquatic biodiversity conservation program for the aquatic ecosystem health improvement in the Han River basin,
3915
whereas around 73.0% of the respondents accepted the program. The prime reason for the refusal (27.0%) of the program was that respondents are highly skeptical of the effect of the program (74.0%), followed by uncertain benefits of water users gained from the program (19.3%). This consequence shows that the mid- and downstream residents tend to distrust existing water management policies including the water use charge. They also doubt the
3920
benefits they will receive from the new programs proposed. 4.4.2 Correcting the Endogeneity Bias and Identifying the Determinants of WTP To explore anomalous answers to the dichotomous choice (closed-end) question, respondents are asked with the open-ended question to specify their maximum WTP at the last stage of the CV survey. Respondents who are certain of their WTP in the closed-end question may
3925
respond to the open-ended question consistently. Those who aberrantly reveal their WTP in the closed-end question may, on the contrary, respond inconsistently [8]. We did not find any inconsistent results between the accepted closed-end bid in intervals and the open-ended WTP value. Since the accepted bid in the SB question is at broader intervals compared to that in the double-bounded (DB) question, there might be to some extent a limit to minutely detect
3930
aberrant responses through the comparison of the two questions. We, nevertheless, tried to reduce any possibility of other biases affecting respondents’ WTP in the CV data. Since the result shows that the inconsistent response bias might not be present, we, thus, focused on controlling the endogeneity bias in this study. 152
Table 4.4 shows the results of Model 1 which does not consider the endogeneity bias versus 3935
Model 2 (combination of experience and acceptance equations) which controls the bias. Based on the Wald test in Model 2, the null hypothesis that the correlation coefficient, ρ, among the two dichotomous variables experience and acceptance is equal to zero is rejected. The latter model considering the endogeneity bias, therefore, results in a statistically significant improvement in model fit.
3940
Table 4.4 Variable Parameter estimates of the naïve probit model versus the multivariate probit model.
bid
Model 1 Naïve Model Acceptance −0.011 ***
experience
0.245 **
gender
−0.001
0.220 ***
0.108
age
−0.001
0.006
0.001
children
0.373
0.281
0.408 ***
neardistance_d1
0.308 **
0.012
0.262
middistance_d2
−0.194 **
0.020
−0.132
medincome_d2
−0.234 ***
−0.011
−0.201 ***
highincome_d3
−0.222 ***
−0.052
−0.212 ***
wqpercep
−0.200 ***
0.210 **
−0.060
constant
1.396 **
−0.673 **
1.501 ***
Variables
Model 2 Multivariate Model Experience Acceptance −0.008 *** −1.159 ***
fardistance_d3 lowincome_d1
ρ Log-likelihood
0.825 *** −289.400
𝑥 2 (1) = 5.894 ***
Wald test of ρ = 0 Observations
−589.420
500
500
*** p < 0.01, ** p < 0.05, * p < 0.10.
The result of the Model 1 can be contrasted with that of the Model 2. As discussed earlier, 3945
the higher the level of the bid proposed increases, the higher the probability of accepting the 153
bid decreases. The bid, accordingly, has negative and significant parameter estimates across the two models. We can confirm that the effect of experience on WTP is significant in both models. However, its sign conversely changed from being positive in Model 1 to negative in Model 2. This is because the positive correlation, ρ, between experience and the error terms 3950
in Model 1 exists. Due to the correlation, the true effect of experience on WTP is most likely to be biased. The parameters of the explanatory variables estimated from Model 2 are associated with the correlation between the error terms of the experience and acceptance equations. In other words, if the respondents have the subjective experience of the negative aquatic ecosystem
3955
changes, the presence of their unobserved characteristics is more likely to encourage the variables to advocate the aquatic biodiversity conservation (positive effect). If the unobserved characteristics leading to the endogeneity bias are, however, corrected, the sign of the effect of experience turns negative. It is assumed that despite the contribution of the mid- and downstream residents to the water use charge aiming at water quality control, many of them
3960
have observed and heard about the damage from contaminated turbid water to aquatic biota. It makes them skeptical of the effectiveness of the water use charge. Thus, they have a fairly negative attitude toward any levies on new programs. The respondents who are aware that the Paldang Lake provides tangible and intangible benefits such as drinking water, recreational activities, and aesthetic amenities for them were
3965
not only favorable to the aquatic biodiversity conservation program, but were also more likely to pay for the program. The long term turbid water discharge problems have, however, made it harder for the mid- and downstream residents to have those benefits. In particular, the residents who have observed and heard negative changes in environmental quality may try to find alternatives where they can enjoy outdoor activities again (experience). Those who
3970
already contribute to finding the alternative solution and regaining the benefits in different 154
areas may be less likely to accept the payment proposed for the aquatic biodiversity conservation in the Han River. Contrary to the result from Model 1, the regional difference in WTP among the mid- and downstream areas (region_d1, region_d2, region_d3) and the perception of current water 3975
quality (wqpercep) were not significantly correlated with households’ WTP in Model 2. Our expectation was that as households have benefits from the Paldang Lake and have more negative water quality perception, the possibility for bid choice increases. The reason is because they gain more benefits from using water resources provided by the Paldang Lake. They also recognize that the aquatic biodiversity conservation program will have a direct and
3980
positive impact on water quality and their local economy [13]. However, after correcting for the bias of experience in Model 2, the effects of region and wqpercep on WTP were not significant. They might be affected by the (true) change in the sign and the effect of experience. This means the two variables’ parameters derived from Model 1 may be inaccurate due to the impact of experience which have endogeneity bias, resulting in the
3985
biased WTP estimates. In fact, there would be no WTP difference among the mid- and downstream areas in the Han River basin since all residents along the river would have experienced the turbidity problems. It is usually considered that income (lowincome_d1, medincome_d2, highincome_d3) should be positively correlated with WTP [50,91,92]. The sign of the income variable was,
3990
however, negative in Model 1 after controlling the endogeneity bias contrary to our expectation. There can be a different interpretation of this consequence as low and middle income households would be willing to pay more for the aquatic biodiversity conservation program than high income households. In other words, the low and middle income households are more susceptible to water quality and aquatic ecosystem conditions. If the
3995
water quality and the aquatic ecosystem conditions are, for instance, improved through the 155
program, the low and middle income households can decrease not only the costs of drinking water purification, but also transfer costs of enjoying the recreational activities in different areas. By contrast, the high income households can easily find alternatives [9]. Our results are consistent with Stevens et al. (1991) [93] and Shin (1994) [94] who reported the negative 4000
income effects on WTP. Stevens et al. (1991) [93] discovered the negative effect of income in both closed-end and open-ended Tobit models in estimating the existence value of wildlife using the CV method. They stated that most of respondents who would pay revealed behavior contradictory to the neoclassical theory underlying the CV method [24] (p. 399). Shin (1994) [93] also detected the negative sign of income in identifying conservation values of
4005
environmental goods indicating that the option value in trading practices for possible future use of wilderness resources seems to be more vital to low and middle income people. The parameter of the income variable estimated in our study, thus, has statistical and economical significance. Many empirical CV studies show results where the stated WTP decreases along with an
4010
increase in household members (children) (negative effect) [94–96]. However, our results show that the larger households are, particularly having more children, the higher their WTPs are. This means the variable children has a positive effect on the WTP. It is particularly the younger members who will be able to enjoy the benefits derived from the aquatic biodiversity conservation since those benefits will be available only in the distant future. Larger
4015
households should, thus, have a higher WTP for the program than smaller households. Some of the members of larger households will enjoy these benefits longer than the members of the smaller households. Most of them are most likely to be children and will live longer after the implementation of the aquatic biodiversity improvement program and its aim accomplishment [81].
4020
156
4.4.3 Willingness to Pay and Benefit Calculation Another focus of this study lies on the elicitation of households’ WTP for the aquatic biodiversity conservation in the Han River basin. Along with the mean WTP, values and numbers observed on the variability of the WTP elicited from the two models are presented in 4025
Table 4.5. Based on Model 2, the proportion of the monthly mean WTP per household was estimated at around 46.1% (KRW 78.4) of the current water use charge (KRW 170 per cubic meter), which was around 8.2% (KRW 13.9) higher than that of Model 1 (around 38.0%, KRW 64.6). After accounting for the correlation (endogeneity bias) between the experience and the error terms in the WTP model, each of the parameters of the explanatory variables
4030
changed. The effect of correcting the endogeneity bias could be dependent on the size of the relevant target population, which means the change in the mean WTP affecting policy decision making could be different for the level of the correction effect according to the relevant population [33].
4035
Table 4.5 Values and numbers observed on the variability of the WTP derived from Model 1 and Model 2. Distribution
5%
25%
50%
75%
95%
100%
Mean
Model 1
33.56
52.07
56.18
75.69
101.48
129.73
64.61
Model 2 Observation
12.61 25
52.21 100
53.25 125
126.02 125
165.67 100
185.24 1 25
78.47 500
WTP
1
Each of the WTP values elicited from Model 1 and Model 2 are presented at 5%, 25%, 50%, 75%, 95%, and 100% in ascending order. The observation is the numbers observed at each range of the percentage levels.
4040
It apparently seems that the mid- and downstream residents gain a lot of benefits from the fish biodiversity conservation seeking aquatic ecosystem improvement, whereas the upstream residents do not. Under these circumstances, the total benefits from the conservation, which entirely belong to the mid- and downstream areas, are calculated in our study. Table 4.6 presents the results of the benefit calculation. Based on the water use charge (KRW 170 per 157
4045
cubic meter) in 2014, the actual payments of mid- (Gyeonggi-do) and downstream areas (Seoul, Incheon) were at around KRW 193.93 billion and KRW 230.48 billion, respectively. Based on the proportion (46.1%, KRW 78.4) of the monthly mean WTP per household estimated in this study and the regional real payments for the water use charge, the total benefits were calculated to be around KRW 195.65 billion per year. The residents in the
4050
downstream areas obtain the highest benefits at around KRW 106.25 billion per year. The benefits of the midstream residents are around KRW 89.40 billion per year (Table 4.6). Table 4.6 Total benefit of the mid- and downstream areas generated by the aquatic biodiversity conservation in the Han River basin. Administrative District Gyeonggi-do Seoul Incheon Total
Midstream Downstream
Water Use Charge(Billion KRW/Year) 193.93 178.54 51.94 424.41 1
Mean WTP (%) (KRW/Month /Cubic Meter) 46.1 (78.4)
Total Benefit (Billion KRW/Year) 89.40 82.31 23.94 195.65
1
4055
The total sum of regional water use charges in 2014 was around KRW 443.46 billion. Since we consider the benefits of only three administrative districts, the payments of K-water (KRW 19.06 billion) as a government organization were excluded from the total water use charge.
Despite the implementation of the water use charge since 1999, there are still some problems regarding the distribution of the benefits along with contaminated turbid water 4060
resulting in the destruction or degradation of aquatic biodiversity. As we discussed earlier, the inflow of massive soil loss from the highland fields to the basin is regarded as the primary non-point pollution sources which negatively affect water quality and aquatic biodiversity. To solve this problem, land use management in the highland fields such as the upstream farmland purchase should be a priority among all the programs supported by the water use charge. In
4065
particular, a preferential purchase of the highland vegetables fields, which have more than 15° slope causing severe soil erosion, can reduce soil losses by more than eighty-fold [36]. This is
158
consequently likely to decrease nutrient runoff (N, P2 O5 , K 2 O) and pollution intensity of turbid water (SI), resulting in improvement of aquatic ecological health (FAI) in the basin. Choi et al. (2016) [8] show that total benefits derived by the implementation of the 4070
highland agriculture restriction policy are much higher than the costs related to land use management policies. This means that the economic activities of the upstream areas are patently restricted by the land use policy, while the mid- and downstream areas have the total benefits from the policy. Based on this result, the land use policy may significantly contribute to aquatic biodiversity improvement resulting in a considerable increase in social welfare.
4075
However, the actual purchase of the upstream vegetable fields, the major source of nonpoint pollution, has not been implemented well. This is because due to the concern for significant income loss, the highland farmers are not willing to abandon their summer crop cultivation which is a major source of their income. To improve and conserve the aquatic biodiversity (ecosystems) in the basin, it is necessary to take further aggressive measures
4080
including increase in the (unit) costs for the highland purchase [8]. Since interest in aquatic ecosystem services has increased along with frequent turbid water discharge problems, there is a growing need for aquatic biodiversity conservation aimed at improving both aquatic ecosystems and social welfare. It is, thus, necessary and very important to more actively implement highland farmland purchases for aquatic biodiversity
4085
(ecosystem) conservation and improvement in the basin. If the practical costs could be reallocated to new or other items such as the highland purchase program, ongoing disputes between stakeholders regarding operation or management of the water use charge would be settled.
4090
159
4.5 Conclusions and Policy Implications This study aimed (1) to identify the determinants of households’ WTP for the fish biodiversity conservation aimed at improving aquatic ecosystems (biodiversity) in the Han River basin, (2) to investigate and correct the endogeneity bias of a proxy variable such as a 4095
subjective experience (direct or indirect) of negative environmental quality changes caused by the contaminated turbid water, and (3) to derive households’ WTP, examine differences in the WTP before and after controlling the endogeneity bias, and calculate the total benefit generated from aquatic biodiversity conservation.
To elicit the WTP (preferences) for aquatic biodiversity conservation, we used the 4100
contingent valuation (CV) method, as a popular economic valuation technique in biodiversity conservation. The CV method, however, has some potential problems. In particular, the omission of variables considering heterogeneity in perceptions of respondents of environmental quality levels between the status quo and hypothetical changes described in the CV survey increases the error of the WTP estimates. To solve the problem, proxy variables
4105
such as a subjective experience of environmental quality changes (experience) can be included in the WTP model. However, the correlation between experience and WTP affected by the unobserved characteristics of respondents may cause the endogeneity bias, leading to inconsistent parameter estimates.
We used a bivariate (multivariate) probit model (Model 2) in order to correct the potential 4110
endogeneity bias. The results show that Model 2 has greater statistical accuracy in parameter estimates compared to the naïve probit model (Model 1) without considering the bias. The coefficient of experience was endogenously biased (positively correlated) with WTP in Model 1. In Model 2, its sign and effect changed to negative (true effect). We assume that respondents who have observed and heard about damages to aquatic life due to the 160
4115
contaminated turbid water may be more skeptical of the effectiveness of the water use charge and also negative about that of newly proposed water policies. Since the long-term turbidity problems have been experienced by all districts along the Han River basin, there may be no WTP difference between residents of the mid- and downstream areas in the basin. In addition, those who have already found the alternatives or regained the benefits in different areas are
4120
less likely to accept the aquatic biodiversity conservation policy in the basin. Households who reside with children (children) and have a lower income level (lowincome) may be more willing to pay for the aquatic biodiversity conservation. It seems that the higher income households can afford to find alternatives for enjoying their outdoor activities, which means that they are less responsive to environmental quality changes. If the
4125
Han River basin is qualitatively improved through the conservation program, the lower income households can save travel time and costs by enjoying the outdoor activities around the basin close to their residences. They are, thus, more affected by changes in the environmental quality. Since the younger household members will live longer after the policy enforcement and the attainment of its goal, they will be able to enjoy the benefits of the rich
4130
aquatic biodiversity longer. The households residing with children are likely to have a higher WTP for the aquatic biodiversity conservation than those without children. The mean WTP per month per household is estimated at around 46.1% (KRW 78.4) of the current water use charge (KRW 170 per cubic meter). Based on the mean WTP per household and the real annual payments (KRW 424.41 billion) of the mid- and downstream
4135
areas for the water use charge in 2014, the total benefit from the improvement of the aquatic ecosystems generated by the fish biodiversity conservation is calculated at around KRW 195.65 billion.
161
Due to harm of the contaminated turbid water to aquatic biota, more positive highland purchases to improve and conserve aquatic biodiversity (ecosystem) is becoming a necessity 4140
in the basin. Obviously, the land use management policy contributes to preventing massive soil loss from the highland vegetable fields and its inflow to the basin. Above all, the purchase of the highland vegetable fields having steep slopes (more than 15°) and causing drastic soil erosion (more than 8 times) is significantly able to contribute to maintaining a good aquatic ecological balance (biodiversity) of the basin by reducing the stress of fish
4145
habitats (SI) and improving fish diversity (FAI). Although the benefits from aquatic biodiversity improvement should be equally distributed among stakeholders in the basin, the mid- and downstream areas have almost all the benefits. On the contrary, the upstream areas (highland farmers) are under restrictions of their economic activities. For the efficient implementation of the highland vegetable field
4150
purchase, it is necessary that appropriate compensation for the abandonment of their highland cultivation causing significant income loss is guaranteed through practical measures such as a rise in unit costs for the highland purchases. To settle contentious issues on operation or management of the water use charge, reallocation of the realistic costs to the highland purchase program for the aquatic biodiversity conservation and improvement should be taken
4155
into consideration. Society is provided a wide variety of ecosystem services such as food provision, biodiversity, recreation, drinking water, etc. from water bodies [97]. The total benefit calculated in our study is involved in only one service, aquatic biodiversity improvement created by the fish biodiversity conservation policy.
4160
162
4.6 Acknowledgments This study was carried out as part of the International Research Training Group TERRECO (GRK 1565/1) funded by the German Research Foundation (DFG) and the University of 4165
Bayreuth in the funding programme Open Access Publishing.
4.7 References
4170
1. Barbour, M.T.; Gerritsen, J.; Snyder, B.D.; Stribling, J.B. Rapid Bioassessment Protocols for Use in Streams and Wadeable Rivers: Periphyton, Benthic Macroinvertebrates and Fish, 2nd ed.; EPA 841-B-99-002; US EPA Office of Water: Washington, DC, USA, 1999. 2. Karr, J.R. Assessment of Biotic Integrity using Fish Communities. Fisheries 1981, 6, 21– 27.
4175
3. Poufoun, J.N.; Abildtrup, J.; Sonwa, D.J.; Delacote, P. The value of endangered forest elephants to local communities in a transboundary conservation landscape. Ecol. Econ. 2016, 126, 70–86. 4. Loomis, J.; White, D. Economic benefits of rare and endangered species. Ecol. Econ. 1996, 18, 197–206.
4180
5. Loomis, J.; Kent, P.; Strange, L.; Fausch, K.; Covich, A. Measuring the total economic value of restoring ecosystem services in an impaired river basin: Results from a contingent valuation survey. Ecol. Econ. 2000, 33, 103–117. 6. Beaumont, N.J.; Austen, M.C.; Mangi, S.C.; Townsend, M. Economic valuation for the conservation of marine biodiversity. Mar. Pollut. Bull. 2008, 56, 386–396. 7. Collares-Pereira, M.J.; Cowx, I.G. The role of catchment scale environmental management in freshwater fish conservation. Fish. Manag. Ecol. 2004, 11, 303–312.
4185
4190
8. Choi, I.C.; Kim, H.N.; Shin, H.J.; Tenhunen, J.; Nguyen, T.T. Willingness to Pay for a Highland Agricultural Restriction Policy to Improve Water Quality in South Korea: Correcting Anomalous Preference in Contingent Valuation Method. Water 2016, 8, 547. 9. Shin, H.J.; Kim, H.N.; Jeon, C.H.; Jo, M.H.; Nguyen, T.T.; Tenhunen, J. Benefit transfer for water management along the Han River in South Korea using Meta-Regression Analysis. Water 2016, 8, 492.
163
10. Hwang, S.J. Nationwide Aquatic Ecological Monitoring Program; National Institute of Environmental Research (NIER): Incheon, Korea, 2013. (In Korean) 11. Seoul Metropolitan Government (SMG). A White Paper on Improving Water Use Charge System; SMG: Seoul, Korea, 2014. (In Korean) 4195
4200
12. Kim, K.M. Improvement of the Han River Watershed Management Fund Policies; National Assembly Research Service (NARS) Issue Report 160; NARS: Seoul, Korea, 2012. (In Korean) 13. Shin, H.J.; Jeon, C.H.; Choi, I.C.; Yeon, I.C. Estimation of beneficiary’s willingness to pay in mid and down-stream area to the water quality improvements in upper Bukhan River Basin. Seoul Stud. 2009, 10, 91–106. (In Korean). 14. Pagiola, S.; Agostini, P.; Gobbi, J.; de Haan, C.; Ibrahim, M.; Murgueitio, E.; Ramírez, E.; Rosales, M.; Ruíz, J.P. Paying for Biodiversity Conservation Services in Agricultural Landscapes; The World Bank Environment Department Paper No. 96; The World Bank: Washington, DC, USA, 2004.
4205
15. Kim, J.K.; Choi, J.S.; Jang, Y.S.; Lee, K.Y.; Kim, B.C. Effects of Turbid Water on Fish Community: Case Studies of the Daegi Stream and the Bong-san Stream. Korean J. Ecol. Environ. 2007, 40, 459–467. (In Korean). 16. Bash, J.; Berman, C.; Bolton, S. Effects of Turbidity and Suspended Solids on Salmonids; WA-RD 526.1; Center for treamside Studies: Seattle, WA, USA, 2001.
4210
17. Boon, P.J.; Davis, B.R.; Petts, G.E. Global Perspectives on River Conservation: Science, Policy and Practice; John Wiley and Sons Ltd.: New York, NY, USA, 2000. 18. Dudgeon, D. River Rehabilitation for Conservation of Fish Biodiversity in Monsoonal Asia. Ecol. Soc. 2005, 10, 15.
4215
19. Beard, T.D., Jr.; Arlinghaus, R.; Cooke, S.J.; McIntyre, P.B.; de Silva, S.; Bartley, D.; Cowx, I.G. Ecosystem approach to inland fisheries: Research needs and implementation strategies. Biol. Lett. 2011, 7, 481–483. 20. Food and Agriculture Organization (FAO). The State of World Fisheries and Aquaculture; FAO of the United Nations: Rome, Italy, 2010.
4220
21. Lee, S.D. A management planning for aquatic ecosystems damaged by increase in turbid water in the Bukhan River. River Cult. 2012, 8, 72–76. (In Korean). 22. Ressurreição, A.; Gibbons, J.; Dentinho, T.P.; Kaiser, M.; Santos, R.S.; Edwards-Jones, G. Economic valuation of species loss in the open sea. Ecol. Econ. 2011, 70, 729–739. 23. Mitchell, R.C.; Carson, R.T. Using Surveys to Value Public Goods: The Contingent Valuation Method; Resources for the Future (RFF) Press: Washington, DC, USA, 1989. 164
4225
24. Stevens, T.; Echeverria, J.; Glass, R.; Hager, T.; More, T. Measuring the existence value of wildlife: What do CVM estimates really show? Land Econ. 1991, 67, 390–400. 25. Bulte, E.H.; van Kooten, G.C. Marginal valuation of charismatic species: Implications for conservation. Environ. Resour. Econ. 1999, 14, 119–130.
4230
26. Hanemann, M.; Loomis, J.; Kanninen, B. Statistical efficiency of double-bound dichotomous choice contingent valuation. Am. J. Agric. Econ. 1991, 73, 1255–1263. 27. Olsen, D.; Richards, J.; Scott, D. Existence and sport values for doubling the size of Columbia river basin salmon and steelhead runs. Rivers 1991, 2, 44–56. 28. Kotchen, M.J.; Reiling, S.D. Estimation and questioning economic values for endangered species: An application and discussion. Endanger. Species Update 1998, 15, 77–83.
4235
29. Cummings, R.P.; Ganderton, P.; McGuckin, T. Substitution effects in CVM values. Am. J. Agric. Econ. 1994, 76, 205–214. 30. Boyle, K.J.; Bishop, R.C. Valuing wildlife in benefit-cost analysis: A case study involving endangered species. Water Resour. Res. 1987, 23, 943–950.
4240
31. Carson, R.T.; Wilks, L.; Imber, D. Valuing the preservation of Australia’s Kakadu conservation zone. Oxf. Econ. Pap. 1994, 46, 727–749. 32. Whitehead, J.C. Improving willingness to pay estimates for quality improvements through joint estimation with quality perceptions. South. Econ. J. 2006, 73, 100–111. 33. Martínez-Espiñeira, R.; Lyssenko, N. Correcting for the endogeneity of pro-environment behavioral choices in contingent valuation. Ecol. Econ. 2011, 70, 1435–1439.
4245
34. Ministry of Environment (MOE). Comprehensive Plan for Reduction of the Non-Point Pollution Source in the Highland Field; MOE: Sejong, Korea, 2004. 35. Nguyen, T.T.; Hoang, N.V.; Seo, B. Cost and environmental efficiency of rice farms in South Korea. Agric. Econ. 2012, 43, 367–376.
4250
4255
36. Jung, K. Assessment of Soil Erosion Potential in Korea; Rural Development Administration: Suwon, Korea, 2005. 37. Noh, S.Y.; Choi, H.L.; Park, J.Y.; Hwang, S.J.; Kim, S.H.; Lee, J.A. Ecological Health Assessment using Fish for the Han River and Nakdong River in Korea. J. Korean Soc. Water Environ. 2015, 31, 319–327. 38. Ministry of Environment (MOE) and National Institute of Environmental Research (NIER). Waterwide Aquatic Ecological Monitoring Program (V); MOE and NIER: Sejong, Korea, 2012. 39. Newcombe, T.W.; MacDonald, D.D. Effects of suspended sediments on aquatic ecosystems. N. Am. J. Fish. Manag. 1991, 11, 72–82. 165
4260
40. Maret, T.R.; Burton, T.A.; Harvey, G.W.; Clark, W.H. Field Testing of New Monitoring Protocols to Assess Brown Trout Spawning Habitant in Idaho Streams. N. Am. J. Fish. Manag. 1993, 13, 567–580. 41. Cederholm, C.J.; Salo, E.O. The Effects of Logging Road Landslide Siltation on the Salmon and Trout Spawning Gravels of Stequaleho Creek and the Clear Water River Basin, Jefferson County, Washington, 1972–1978; FRO-UW-7915; Fisheries Research Institute: Seattle, WA, USA, 1979.
4265
42. Turpie, J.K. The existence value of biodiversity in South Africa: How interest, experience, knowledge, income and perceived level of threat influence local willingness to pay. Ecol. Econ. 2003, 46, 199–216. 43. Burkhard, B.; de Groot, R.; Costanza, R.; Seppelt, R.; Jørgensen, S.E.; Potschin, M. Solutions for sustaining natural capital and ecosystem services. Ecol. Indic. 2012, 21, 1–6.
4270
4275
44. Crossman, N.D.; Burkhard, B.; Nedkov, S.; Willemen, L.; Petz, K.; Palomo, L.; Drakou, E.G.; Martín-Lopez, B.; McPhearson, T.; Boyanova, K. A blueprint for mapping and modeling ecosystem services. Ecosyst. Serv. 2013, 4, 4–14. 45. De Groot, R.S.; Alkemade, R.; Braat, L.; Hein, L.; Willemen, L. Challenges in integrating the concept of ecosystem services and values in landscape planning, management and decision making. Ecol. Complex. 2010, 7, 260–272. 46. Department for Environment, Food and Rural Affairs (DEFRA). An Introductory Guide to Valuing Ecosystem Services; DEFRA: London, UK, 2007. 47. Lehtonen, E.; Kuuluvainen, J.; Pouta, E.; Rekola, M.; Li, C.Z. Non-market benefits of forest conservation in southern Finland. Environ. Sci. Policy 2003, 6, 195–204.
4280
48. Krieger, D.J. The Economic Values of Forest Ecosystem Services: A Review; The Wilderness Society: Washington, DC, USA, 2004. 49. Mezgebo, A.; Tessema, W.; Asfaw, Z. Economic Values of Irrigation Water in Wondo Genet District, Ethiopia: An Application of Contingent Valuation method. J. Econ. Sustain. Dev. 2013, 4, 2222–2855.
4285
50. Hicks, J.R. History of Economic Doctrine. Econ. Hist. Rev. 1943, a13, 111–115. 51. Alberini, A.; Kahn, J.R. (Eds.) Handbook on Contingent Valuation; Edward Elgar Publishing Inc.: Massachusetts, MA, USA, 2006. 52. Bandara, R.; Tisdell, C. Comparison of rural and urban attitudes to the conservation of Asian elephants in Sri Lanka: Empirical evidence. Biol. Conserv. 2003, 110, 327–342.
166
4290
4295
53. Baral, N.; Gautam, R.; Timilsina, N.; Bhat, M.G. Conservation implications of contingent valuation of critically endangered White-rumped Vulture Gyps bengalensis in South Asia. Int. J. Biodivers. Sci. Manag. 2007, 3, 145–156. 54. Baral, N.; Stern, M.J.; Bhattarai, R. Contingent valuation of ecotourism in Annapurna conservation area, Nepal: Implications for sustainable park finance and local development. Ecol. Econ. 2008, 66, 218–227. 55. De Mendonca, M.J.C.; Sachsida, A.; Loureiro, P.R.A. A study on the valuing biodiversity: The case of three endangered species in Brazil. Ecol. Econ. 2003, 46, 9–18. 56. Haab, T.C.; McConnell, K.E. Valuing Environmental and Natural Resources: The Econometrics of Non-Market Valuation; Edward Elgar Publishing: Cheltenham, UK, 2002.
4300
4305
57. Mills, W.B.; Porcella, D.B.; Ungs, M.J.; GhErini, S.A.; Summers, K.V. Water Quality Assessment: A Screening Procedure for Toxic and Conventional Pollutionsinsurface and Ground Water; Report 600/6-85/0.02a; U.S. Environmental Protection Agency: Athens, GA, USA, 1985. 58. Whitehead, J.C.; Blomquist, G.C.; Hoban, T.J.; Clifford, W.B. Assessing the validityand reliability of contingent values: A comparison of on-site users, off-site users, and non-users. J. Environ. Econ. Manag. 1995, 29, 238–251. 59. Paradiso, M.; Trisorio, A. The effect of knowledge on the disparity between hypothetical and real willingness to pay. Appl. Econ. 2001, 33, 1359–1364.
4310
60. Alberini, A. Efficiency vs bias of willingness-to-pay estimates: Bivariate and interval-data models. J. Environ.Econ. Manag. 1995, 29, 169–180. 61. Bishop, R.C.; Heberlein, T.A. Measuring values of extra market goods: Are indirect measures biased? Am. J. Agric. Econ. 1979, 61, 926–930. 62. Herridges, J.A.; Shogren, J.F. Starting point bias in dichotomous choice valuation with follow-up question. J. Environ. Econ. Manag. 1996, 30, 112–131.
4315
4320
63. Bateman, I.J.; Burgess, D.; Hutchinson, W.G.; Matthews, D.I. Learning design contingent valuation (LDCV): NOAA guidelines, preference learning and coherent arbitrariness. J. Environ. Econ. Manag. 2008, 55, 127–141. 64. Brouwer, R.; Martín-Ortega, J. Modeling self-censoring of polluter pays protest votes in stated preference research to support resource damage estimations in environmental liability. Resour. Energy Econ. 2012, 34, 151–166. 65. Gschwend, T. Analyzing quota sample data and the peer-review process. Fr. Politics 2005, 3, 88–91.
167
4325
66. Northrop, A. Sampling and data collection. In Handbook of Research Methods in Public Administation, 2nd ed.; Miller, G.J., Whicker, M.L., Eds.; Marcel Dekker Inc.: New York, NY, USA, 1999. 67. Kwak, N.; Radler, B. A Comparision between mail and web surveys: Response pattern, respondent profile, and data quality. J. Off. Stat. 2002, 18, 257–273. 68. Schaefer, D.R.; Dillman, D.A. Development of a standard e-mail methodology: Results of an experiment. Public Opin. Q. 1998, 62, 378–397.
4330
69. Schmidt, W.C. Worldwide web survey research: Benefits, potential problems, and solutions. Behav. Res. Methods 1997, 29, 274–279. 70. Smith, C.B. Casting the net: Surveying an Internet population. J. Comput. Med. Commun. 1997, 3.
4335
71. Weible, R.; Wallace, J. The impact of the internet on data collection. Mark. Res. 1998, 10, 19–23. 72. Sheehan, K.B. E-mail survey response rates: A review. J. Comput. Med. Commun. 2001, 6.
4340
73. Paolo, A.M.; Bonaminio, G.A.; Gibson, C.; Patridge, T.; Kallail, K. Response rate comparisons of e-mail and mail distributed student evaluations. Teach. Learn. Med. 2000, 12, 81–84. 74. Bachmann, D.; Elfrink, J.; Vazzana, G. E-mail and snail mail face off in rematch. Mark. Res. 1999, 11, 11–15. 75. Pindyck, R.S.; Rubinfeld, D.C. Econometric Models and Econometric Forecasts, 2nd ed.; Mcgraw-HillBook Co.: New York, NY, USA, 1981.
4345
76. Gujarati, D.N. Basic Econometrics, 4th ed.; Mcgraw-HillBook Co.: New York, NY, USA, 2004. 77. Maddala, G.S. Limited dependent and qualitative variables in econometrics; Cambridge University Press: New York, NY, USA, 1983.
4350
78. Wilde, J. Identification of multiple equation probit models with endogenous dummy regressors. Econ. Lett.2000, 3, 309–312. 79. Cappellari, L.; Jenkins, S.P. Multivariate probit regression using simulated maximum likelihood. Stata J. 2003, 3, 278–294. 80. Ahlheim, M.; Schneider, F. Considering household size in contingent valuation studies. Environ. Econ. 2013, 4, 112–123.
168
4355
4360
81. Farolfi, S.; Mabugu, R.; Ntshingila, S. Domestic Water Use and Values in Swaziland: A Cotingent Valuation Analysis. Agrekon 2007, 46, 157–170. Available online: http://ageconsearch.umn.edu/handle/10130 (accessed on 24 January 2017). 82. Jones, N.; Sophoulis, C.M.; Malesios, C. Economic valuation of coastal water quality and protest responses: A case study in Mitilini, Greece. J. Socio Econ. 2008, 37, 2478–2491. 83. Mendonca, A.F.; Tilton, J.E. A Contingent Valuation Study of the Environmental Costs of Mining in the Brazilizn Amazon. J. Miner. Energy 2000, 15, 21–32. 84. Ojeda, M.; Mayer, A.; Solomon, B. Economic Valuation of Environmental Services Sustained by Water Flows in the Yaqui River Delta. Ecol. Econ. 2008, 65, 155–166.
4365
4370
85. Phuong, D.; Gopalakrishnan, C. An Application of the Contingent Valuation Method to Estimate the Loss of Value of Water Resources due to Pesticide Contamination: The Case of the Mekong Delta-Vietnam. J. Water Resour. Dev. 2003, 19, 617–633. 86. Zhongmin, X.; Guodong, C.; Zhinqiang, Z.; Zhiyong, S.; Loomis, J. Applying contingent valuation in China to measure the total economic value of restoring ecosystem services in Ejina region. Ecol. Econ. 2003, 44, 345–358. 87. Chambers, C.M.; Chambers, P.E.; Whitehead, J.C. Contingent valuation of quasi-public goods: Validity, reliability, and application to valuing a historic site. Public Financ. Rev. 1998, 26, 137–154.
4375
88. Bateman, I.J.; Day, B.H.; Georgiou, S.; Lake, I. The aggregation of environmental benefit values: Welfare measures, distance decay and total WTP. Ecol. Econ. 2006, 60, 450–460. 89. Pate, J.; Loomis, J. The effect of distance on willingness to pay values: A case study of wetlands and salmon in California. Ecol. Econ. 1997, 3, 199–207.
4380
90. Awad, I.; Holländer, R. Applying contingent valuation method to measure the total economic value of domestic water services: A case study in Ramallah Governorate, Palestine. Eur. J. Econ. Financ. Adm. Sci. 2010, 20, 76–93. 91. Torgler, B.; García-Valiñas, M.A. The determinants of individuals’ attitudes towards preventing environmental damage. Ecol. Econ. 2007, 2–3, 536–552. 92. Shin, H. Identifying the Relationship Between Preservation Values of Environmental Resources. Ph.D. Thesis, Colorado State University, Fort Collins, CO, USA, 1994.
4385
93. Aprahamian, F.; Chanel, O.; Luchini, S. Modeling starting point bias as unobserved heterogeneity in contingent valuation surveys: An application to air pollution. Am. J. Agric. Econ. 2007, 89, 533–547.
169
4390
94. Ahlheim, M.; Frör, O.; Lehr, U.; Wagenhals, G.; Wolf, U. Contingent Valuation of Mining Land Reclamation; IAW-Report Heft; Institut für Volkswirtschaftslehre, Universität Hohenheim: Stuttgart, Germany, 2004. 95. Liu, J.-T.; Hammitt, J.K.; Wang, J.-D.; Tsou, M.-W. Valuation of the risk of SARS in Taiwan. Health Econ. 2005, 14, 83–91. 96. Millennium Ecosystem Assessment (MEA). Ecosystems and Human Well-Being: Synthesis; Island Press: Washington, DC, USA, 2005.
4395
4.9 Appendix 4.9.1 Water consumers questionnaire I SQ1. Head of the househhold 2. No ☞ Interview closing
1. Yes 4400
SQ2. Gender 1. Male SQ3. Age (
2. Female year)
1. 19 to 29 2. 30s 4405
3. 40s 4. 50s 5 Over 60 SQ4. Residential districts 1. Seoul
4410
2. Incheon 3. Gyeonggi-do 4. Otherwise ☞ Interview closing
PART A. Water use behavior and water quality perception in the Han River (Paldang Lake)
170
4415
A1. Do you know the fact that the Han River is a source of water that is supplied to your residence? 1. Yes
2. No
A2. The Han River is a major drinking water source of your residential district. What do you normally use the tap water or the Han River for? (multiple responses) 4420
1. Water for living (dish-washing, laundry, shower) 2. Water for commercial use (fishing, recreation) 3. Private water activities (swimming, fishing, boating, water-skiing, windsurfing) 4. Enjoying river scenery
5. Artistic activities such as pictures and paintings 4425
6. Experience in natural (education) 7. Water for agricultural use 8. Otherwise
A3. What is the distance from your residence to the Han River? 1. less than 10km 4430
2. 10 to 30km 3. 30 to 50km 4. 50 to 70km 5. 70 to 100km 6. 100 to 150km
4435
7. 150 to 200km 8. More than 200km A4. Do you see the Han River in your daily life including commuting at least once per season (every 3 months)? 1. Yes
4440
2. No
A5. How do you feel about the quality of water in the Han River? 1. Excellent ☞ Go to A5-1 2. Good ☞ Go to A5-1 3. Normal ☞ Go to B1 171
4. Bad ☞ Go to A5-2 4445
5. Very bad ☞ Go to A5-2 A5-1. Why do you think that the Han River has good water quality?
1. It looks clean from a distance 2. It looks clean in near view (on a boat) 3. Tap water can be drunk without purifying 4450
4. Most of the media say that the water quality is good in the Han River 5. It is possible to swim in the Han River 6. It is possible to eat fish in the Han River 7 It does not smell in the Han River 8. Otherwise
4455
A5-2. Why do you think that the Han River has normal water quality? 1. It does not look clean from a distance 2. It does not look clean in near view (on a boat) 3. It is not possible to drink tap water without purifying 4. Most of the media say that the water quality is bad in the Han River
4460
5. It is not possible to swim in the Han River 6 It is not possible to eat fish taken in the Han River 7. It smells in the Han River 8. Otherwise
PART B. Opinions on evaluating and managing water quality according to climate 4465
change B1. In recent decases have you experienced tap water problems, expeically during the summer monsoon or dry season (spring and winter)? Yes
NO
B1-1. Rust (red water)
①
②
B1-2. Odor
①
②
B1-3. Impurity
①
②
B1-4. Turbid water
①
②
172
B2. Do you think water quality in the Han River can be degraded (or changed) by climate change? 4470
1. Yes
2. No
B3. What do you think the main pollutants are in the Han River? Please write the numbers in order. (1st :
2nd :
)
1. Factory waste water 2. Mine waste water 4475
3. Domestic sewage 4. Water-related leisure activities 5. Industrial waste dumping 6. Landfill leachate 7. Inflow of contaminated rainwater
4480
8. Soil erosion from upstream high mountainous agricultural fields in the Han River basin 9. Otherwise B4. How important do you think that managing water quality under climate change is at the individual and the national levels?
4485
Water quality
Very
management
important
Individual
National
Totally
important
Normal
Unimportant
①
②
③
④
⑤
①
②
③
④
⑤
unimportant
B5. What do you think the most suitable method is for water quality management under climate change? 1. Strict management standard and sufficient funds are necessary due to the inporatance of water quality manaagemtn 2. Reducing costs of managing water quality should be focused on instead of strict water
4490
quality management 3. Standard and costs of water quality management are aleady excessive PART C. Changes in aquatic ecosystems from climate change and opinions on conserving aquatic ecosystems in the Han River 173
C1. In recent years have you directly observed or seen or heard of water quality problems 4495
during the summer monsoon or drought? (Including the media such as TV, radio, newspaper, and internet) 있음
없음
C1-1. Contaminated turbid water caused by soil erosion from high mountainous agricultural fields in upstream areas of the Han River
①
②
C1-2. Algal blooms and odor
①
②
C2. Have you directly seen or indirectly heard of negative effects of those highly contaminated turbid water and algal blooms on aquatic ecosystems in the Han River? (e.g. 4500
aquatic organisms such as fish and plants extinction or death) (Including the media such as TV, radio, newspaper, and internet) 1. Yes
☞ Go to C2-1
2. No
☞ Go to C2-2
C2-1. What do you think about those negative impacts on aquatic ecosystems in the Han River (Multiple responses) 4505
1. Aquatic ecosystems (fish and plants) will be destroyed 2. National or local governments’water quality purifying costs will increase 3. Countermeasures such as boiling tap water and installing purifier should be prepared 4. Water activities such as swimming and boating may be impossible 5. Aesthetically unpleasing view
4510
6. As time goes by it will return to normal 7. No problem 8. Otherwise C2-2. What will you do if you experience those negative impacts on aquatic ecosystems in the Han River? (Multiple responses)
4515
1. Aquatic ecosystems (fish and plants) will be destroyed 2. National or local governments’water quality purifying costs will increase 3. Countermeasures such as boiling tap water and installing purifier should be prepared 4. Water activities such as swimming and boating may be impossible 5. Aesthetically unpleasing view
4520
6. As time goes by it will return to normal 7. No problem 8. Otherwise 174
C3. Do you think a measure to prevent aquatic organism extinction and ecosystem drestruction caused by the highly contaminated turbid water and algal blooms during the 4525
summer monsoon or drought in the Han River is necessary? 1. Very necessary 2. Somewhat necessary 3. Not really necessary 4. Wholly unnecessary
4530
C4. What do you think the aquatic ecosystem drestruction prevention measure should be financed by? 1. Securing funds through reduction or abolition of existing programs of the central or local governments 2. A tax levied on people’s benefits from the restoration of environmental pollution
4535
3. People’s or businesses’ voluntary donations 4. Water use charge to businesses using the Han River 5. Otherwise C5. A wide range of benefits from sustainable aquatic ecosystem conservation in the HanRiver are as below. How important do you think they are? Very Totally Important Normal Unimportant importante unimportant C4-1. Commerical purposes such as fishing C4-2. Non-commerical purposes such as medical and scientific uses of aquatic organisms C4-3. Recreation, educational purposes through experience of aquatic ecosystems C4-4.Protecting functons of aquatic organismas such as water quality purification and water quantity regulation C4-5. Providing natural landscape and drinkging water for Seoul metropolitna areas(Seoul, Incheon, Gyeonggi-do) C4-6. Inheritance of clean aquatic ecosystems to future generations
①
②
③
④
⑤
①
②
③
④
⑤
①
②
③
④
⑤
①
②
③
④
⑤
①
②
③
④
⑤
①
②
③
④
⑤
4540
175
PART D. Willingness to pay for the aquatic ecosystem conservation policy Resurlts of water pollution caused by higly contaminated turbid water and algar blooms during the summer monsson and drought in the Han River basin ① Breathing disorders, reduction in fertility, stunted growth ② Destruction or degradation of fish habitat in all layers of the river from top to bottom ③ Increase in plankton and fish mortality ▶ Han River aquatic ecosystem health assessment (Minestry of Environment and National Environmental Protection Institute, 2008;2009; 2010; 2011; 2012) Fish assessment Indext (FAI) is one of the biological indicators for aquatic ecological health assessment using the composition and diversity of collected fish species. < FAI classification and characteristics> Classification
A
B
C
D
Water quality
Excellent
Good
Noraml
Bad
Score
87.5≤ FAI ≤100
56.2≤ FAI