Detection and tracking of a moving human in image space . ..... struction from monocular videos, programs were developed to recover 3D models .... applications: visualization and virtual reality require mainly a good visual ..... Seo and Hong, 1999 ...... Each matrix Ti has rank 2 and is computed only using image correspon-.
.
Doctoral Thesis ETH No. 16562
IMAGE-BASED MODELING FOR OBJECT AND HUMAN RECONSTRUCTION A dissertation submitted to the SWISS FEDERAL INSTITUTE OF TECHNOLOGY (ETH) - ZURICH
for the degree of Doctor of Technical Sciences
presented by FABIO REMONDINO Dipl.Ing., Politecnico di Milano born 04.02.1974 citizen of Italy
accepted on the recommendation of Prof. Dr. Armin Grün, examiner ETH Zurich, Switzerland Prof. Dr. Petros Patias, co-examiner Aristoteles University, Thessaloniki, Greece
Zurich 2006
.
CONTENTS
CONTENTS .................................................................................................................... i FOREWORD ................................................................................................................ vii ABSTRACT .................................................................................................................. ix RIASSUNTO ................................................................................................................. xi 1. INTRODUCTION ....................................................................................................... 1 1.1. 3D Modeling ....................................................................................................... 1 1.1.1. Photogrammetry ......................................................................................... 4 1.1.2. Computer Vision ......................................................................................... 5 1.2. Motivations, objectives and contributions ........................................................... 5 1.3. Overview and organization ................................................................................. 7 2. PROJECTIVE GEOMETRY ....................................................................................... 9 2.1. Geometry layers ................................................................................................. 9 2.2. Homogeneous coordinates: points, lines, planes and conics ........................... 10 2.3. Projective transformation .................................................................................. 11 2.3.1. Mosaic from overlapping images .............................................................. 13 2.4. Projective invariants ......................................................................................... 14 2.4.1. Cross-ratio for distance measurements .................................................... 16 2.4.1.1. Accuracy of the measurements ......................................................... 17 2.5. Projective camera model .................................................................................. 18 2.6. The reconstruction problem .............................................................................. 18
i
CONTENTS
3. 3D MODELING FROM IMAGES .............................................................................. 21 3.1. 3D modeling overview ...................................................................................... 21 3.2. Terrestrial image-based 3D modeling .............................................................. 24 3.2.1. Design and recovery of the network geometry ........................................ 27 3.2.2. Surface measurements ............................................................................. 27 3.2.3. From 3D point clouds to surfaces ............................................................. 29 3.2.3.1. Triangulation or mesh generation ...................................................... 31 3.2.4. Texturing and visualization ....................................................................... 31 3.3. 3D modeling from a single image ..................................................................... 34 3.4. Examples .......................................................................................................... 35 3.4.1. 3D Modeling of the Great Buddha of Bamiyan, Afghanistan .................... 35 3.4.1.1. Fusing real with virtual ....................................................................... 38 3.4.2. Interactive 3D modeling of architectures ................................................... 38 3.5. Final considerations .......................................................................................... 39 4. CALIBRATION AND ORIENTATION OF IMAGE SEQUENCES ............................ 41 4.1. Orientation approaches .................................................................................... 42 4.2. Automated tie point extraction .......................................................................... 43 4.2.1. Correspondences in ‘short range motion’ ................................................. 44 4.2.1.1. Least Squares Matching (LSM) ......................................................... 45 4.2.2. Correspondences in ‘long range motion’ .................................................. 46 4.2.2.1. Interest points .................................................................................... 46 4.2.2.2. First matching process ...................................................................... 47 4.2.2.3. Filtering process to remove outliers .................................................. 47 4.2.2.4. Relative orientation between image pairs ......................................... 48 4.2.2.5. Guided matching process .................................................................. 49 4.2.2.6. Relative orientation between a triplet of images ................................ 49 4.2.2.7. Tracking the found correspondences throughout the sequence ....... 51 4.2.3. Correspondences in wide baseline images .............................................. 52 4.2.4. Considerations on the approach for automated tie point extraction .......... 55 4.3. Bundle adjustment ............................................................................................ 56 4.3.1. Datum definition and adjustment constraints ............................................ 58 4.3.1.1. Inner constraints or free net adjustment ............................................ 59 4.3.1.2. Functional constraints ...................................................................... 59 4.3.2. Further considerations on the APs ............................................................ 59 4.3.3. Blunder detection ...................................................................................... 60 4.4. Approximative values for the adjustment’s unknowns ...................................... 61 4.4.1. Approximations for the camera exterior parameters ................................. 61 4.4.2. Approximations for the interior camera parameters .................................. 61 4.4.2.1. Automated vanishing points detection ............................................... 62 4.4.2.2. Decomposition of the projective camera matrix ................................ 65
ii
CONTENTS
4.5. Linear features bundle adjustment ................................................................... 65 4.6. Calibration and orientation of stationary but freely rotating cameras ............... 66 4.6.1. The projective camera model ................................................................... 66 4.6.1.1. Obtaining the rotation angle from the projective transformation ...... 68 4.6.2. Simplified perspective camera model ....................................................... 68 4.7. Calibration of stationary and fixed camera ....................................................... 69 5. HUMAN BODY MODELING AND MOVEMENT RECONSTRUCTION .................. 73 5.1. 3D Modeling of human characters ................................................................... 73 5.1.1. Overview on static human shape capturing .............................................. 74 5.1.2. Overview on human movement detection and reconstruction .................. 75 5.1.2.1. Gait analysis ...................................................................................... 76 5.2. Image-based reconstruction of static human body shape ................................ 76 5.3. Forensic metrology ........................................................................................... 78 5.3.1. Detection and tracking of a moving human in image space ..................... 78 5.4. Markerless motion capture from monocular videos .......................................... 81 5.4.1. Deterministic pose estimation ................................................................... 82 5.4.1.1. Application to video sequences ......................................................... 85 5.4.2. Human modeling and animation ............................................................... 86 5.4.2.1. Polygonal model fitting ...................................................................... 86 5.4.2.2. Comparison between real-world and H-Anim models ....................... 89 6. EXPERIMENTS ....................................................................................................... 91 6.1. Automated markerless tie point extraction ....................................................... 91 6.1.1. The house sequence ................................................................................ 91 6.1.1.1. Problem and goal .............................................................................. 91 6.1.1.2. Methodology and results ................................................................... 91 6.1.1.3. Considerations .................................................................................. 93 6.1.2. The dinosaur sequence ............................................................................ 93 6.1.2.1. Problem and goal .............................................................................. 93 6.1.2.2. Methodology and results ................................................................... 93 6.1.2.3. Considerations .................................................................................. 93 6.1.3. A Buddha tower of Bayon, Angkor, Cambodia ......................................... 94 6.1.3.1. Problem and goal .............................................................................. 94 6.1.3.2. Methodology and results ................................................................... 94 6.1.3.3. Considerations .................................................................................. 95 6.2. 3D modeling of an architectural object ............................................................. 97 6.2.1. Problem and goal ...................................................................................... 97 6.2.2. Methodology and results ........................................................................... 97 6.2.3. Considerations .......................................................................................... 97 6.3. Human body shape modeling from images ...................................................... 99
iii
CONTENTS
6.3.1. Reconstruction of static human shape from an image sequence ............. 99 6.3.1.1. Problem and goal .............................................................................. 99 6.3.1.2. Methodology and results ................................................................... 99 6.3.1.3. Considerations ................................................................................ 100 6.3.2. Face modeling from existing videos ........................................................ 100 6.3.2.1. Problem and goal ............................................................................ 100 6.3.2.2. Methodology and results ................................................................. 101 6.3.2.3. Considerations ................................................................................ 101 6.4. Photogrammetric analysis of monocular videos ............................................. 102 6.4.1. The dunking sequence ............................................................................ 102 6.4.1.1. Calibration and orientation .............................................................. 102 6.4.1.2. Metric measurements of the dunk movement ................................. 103 6.4.1.3. 3D modeling of the moving character .............................................. 105 6.4.2. The walking sequence ............................................................................ 107 6.4.2.1. Calibration and orientation .............................................................. 107 6.4.2.2. 3D modeling of the moving character .............................................. 109 6.5. Cultural Heritage object modeling .................................................................. 110 6.5.1. 3D modeling of the Great Buddha of Bamiyan, Afghanistan .................. 110 6.5.2. 3D modeling of the empty niche of the Great Buddha of Bamiyan ......... 111 7. CONCLUSIONS ..................................................................................................... 115 7.1. Summary of the achievements ....................................................................... 115 7.2. Automated markerless image orientation ....................................................... 115 7.3. 3D models from images .................................................................................. 116 7.4. Human character reconstruction .................................................................... 117 7.5. Future work ..................................................................................................... 117 Appendix A. Detectors and descriptors ................................................................ 119 A.1. Operators for photogrammetric applications .................................................. 119 A.2. Point and region detectors ............................................................................. 119 A.2.1. Point detectors ........................................................................................ 119 A.2.2. Region detectors .................................................................................... 120 A.3. Descriptors ..................................................................................................... 121 A.4. Experimental setup and results ...................................................................... 122 A.4.1. Interest point detection under different image transformations .............. 122 A.4.2. Localization accuracy ............................................................................. 122 A.4.3. Quantitative analysis based on the relative orientation .......................... 124 A.5. Location accuracy improvement for detectors and descriptors ...................... 125 A.6. Conclusions .................................................................................................... 127
iv
CONTENTS
Appendix B. Alternative form of the coplanarity condition ................................. 129 B.1. Relative orientation between two images ...................................................... 129 B.2. Estimating the Fundamental matrix ............................................................... 131 B.2.1. Least squares and iterative techniques .................................................. 131 B.2.2. Robust estimators .................................................................................. 132 B.2.2.1. RANSAC ........................................................................................ 132 B.2.2.2. Least Median Squares (LMedS) .................................................... 133 B.2.2.3. Consideration on robust estimators ............................................... 133 BIBLIOGRAPHY ....................................................................................................... 135 ACKNOWLEDMENTS ............................................................................................... 159
v
CONTENTS
vi
FOREWORD
Image-based modeling for object and human reconstruction is a very broad topic, which includes many methodological issues and applications of Photogrammetry. This thesis focuses on the methods which are used in terrestrial photogrammetric applications. Here, in the course of the past years two schools have developed: methods which are typical for Computer Vision and those which originated in Photogrammetry. The goal of this work is to compare both concepts critically with each other and to arrive, wherever possible, at syntheses and useful combinations. This presents one of the very few attempts to extract from both schools a depository of methods and procedures which allow to formulate optimal solutions. This constitutes a very appropriate procedure, because both schools have developed parallel to each other, with very little exchange and transition activities. One of the major goals in research and development is the automatization of the object extraction and modeling process. This is achieved nowadays only in very few exceptional, simple cases. Therefore this constitutes a challenging scientific topic. On the other hand this is also a topic of great practical relevance, because many existing (architecture, cultural heritage, biomechanics, sports, etc.) and new application fields (movies, TV, computer games, etc.) are strongly interested in progress in this area. This work is concerned with static and moving objects, in the last case only with humans. It consists of four main chapters. Chapter 3 (Modeling from Images) discusses in detail the individual steps of the modeling process (design-measurement-structuring-visualization/analysis). In this context particular emphasis is put on the surface measurement and structuring aspects, on texture mapping and visualization. This is supported by a typical example: the 3D modeling of the Great Buddha of Bamiyan, Afghanistan. Chapter 4 (Calibration and Orientation of Image Sequences) starts with a systematization of the major different orientation approaches, as applied to image sequences. It discusses the tie point extraction problem for short base length cases and focuses then on the long base length case. Here it presents techniques for interest point extraction, Least Squares Matching, filtering for outlier removal and relative orientation with pairs and triplets. Special attention is given to the establishment of correspondences. Another focus is on the calibration and orientation of rotating camera images, which is later used in practical cases.
vii
FOREWORD
Chapter 5 (Human Body Modeling and Movement Reconstruction) addresses the important research issues of human body modeling and motion capture without the use of artificial markers. Special attention is devoted to markerless motion capture from monocular videos, a very hard problem to solve, because it combines the lack of markers with the fact of having only single image sequences of uncalibrated cameras available. Solutions for this task are very crucial for cases where objects and/or movements have to be reconstructed from already existing film or video sequences. Here the connection to the animation of the human body is also established. Chapter 6 (Experiments) presents a broad spectrum of automated markerless orientations and human body shape determinations. This includes the following examples: toy house, toy dinosaur, Buddha tower of Bayon (Angkor, Cambodia), NIKH building (Dublin, Ireland), human body and face, various scenes of a basketball player. A subchapter is devoted to the reconstruction of the Great Buddha of Bamiyan, Afghanistan and its empty niche. As special and very hard cases the face modeling and 3D human pose estimation from already existing monocular video sequences are treated. This thesis gives a valuable synthesis of the current state-of-the-art in close-range static object modeling and human shape and movement capture from images. It includes a rich survey of existing methods and procedures and clearly points out the differences between computer vision and photogrammetric approaches. The great variety of different approaches and the lack of comprehensive testing makes a sound taxation very difficult. Comparative tests do not exist up to now. Also, the many different application cases, with the great variety of diverse prerequisites, assumptions and image configurations make it difficult to carry out such tests, which could be of general validity. It is the merit of the author to have shed critical light onto some of the existing procedures. Another achievement lies in the fact that for the first time the connection between photogrammetric modeling and animation was established from a photogrammetrist's point of view. Fabio's innovative contributions include work on markerless automated tie point extraction, image orientation, human body shape recovery and motion estimation from monocular video sequences. However, there is still room for improvement and it will be a long time until accurate, robust and generally applicable methods become available. Fabio's work represents a very valuable contribution to the broad and demanding issue of automated image-based modeling. I would like to congratulate him to his achievements and hope that this work will stimulate further studies on these important topics. Zürich, July 2006
viii
Prof. Dr. Armin Grün
ABSTRACT
ABSTRACT
The topic of this research is the investigation of the image-based approach for the 3D modeling of close-range scenes, static objects and moving human characters. Three-dimensional (3D) modeling from images is a great topic of investigation in the research community, even if range sensors are becoming more and more a common source and a good alternative for the generation of 3D information. The interest in 3D modeling is motivated by a wide spectrum of applications, such as video games, animation, navigation of autonomous vehicles, object recognition, surveillance and visualization. In particular, the production of 3D models from existing images or old movies would allow the generation of new scenes involving objects or human characters who may be unavailable for other modeling techniques. Techniques for 3D modeling have been rapidly advancing over the past few years although most of them focus on single objects or specific applications such as architecture or city mapping. Nowadays the accurate and fully automated reconstruction of 3D models from image data is still a challenging problem. Most of the current approaches developed to recover accurate 3D models are based on semi-automatic procedures, therefore the introduction of new reliable and automated algorithms is one of the key goals in the photogrammetric and vision communities. In fact fully automated image-based approaches generally do not work under certain image network configuration or are not reliable enough for some applications, like cultural heritage documentation. Automated image-based methods require good features in multiple images and very short baselines between consecutive frames to extract dense depth maps and complete 3D models. But these requirements are not satisfied in some practical situations, due to occlusions, illumination changes and lack of texture. Automated processes often end up with areas containing too many features that are not all needed for the object modeling and areas with very few features to produce a complete and detailed model. Automated reconstruction methods generally do not report good accuracy, limiting their use for applications that require only nice-looking 3D models. Furthermore, post processing operations are often required, which means that the user interaction is still needed. Therefore fully automated procedures are generally limited in finding point correspondences and camera poses while for the surface measurement phase the user interaction is generally preferred, in particular for architectures. The image-based modeling of an object should be meant as the complete process that starts from the acquisition system and ends with a virtual model in three dimensions visible interactively on a computer. The photogrammetric modeling pipeline consists of few well known steps: calibra-
ix
ABSTRACT
tion and orientation, surface measurement and point cloud generation, structuring and modeling of the object geometry, visualization and analysis. Different efforts have been done to increase the level of automation within these steps and broaden the use of the image-based modeling technology. So far, however, the efforts to completely automate the processing, from the image acquisition to the output of a 3D model, are not always successful or not applicable in many 3D modeling projects. In this dissertation different techniques developed to analyze existing sequence of images and partially automate the process of constructing digital 3D models of static objects or moving human characters are reported. In particular the work investigates if automated and markerless sensor orientation is feasible and under which conditions, if it is possible to recover complete and detailed 3D models of complex objects using automated measurement procedures, which kind of (3D) information can be retrieved from existing image data as well as the capabilities or limits of photogrammetric algorithms in dealing with uncalibrated images and zooming effects. For the investigations, sets of available or self-acquired images, as well as frames digitized from existing monocular videos are used. The possibility to automatically orient an image sequence heavily depends on the type of images, acquisition and scene. Compared to other research approaches, the developed method for the automated tie point extraction and image orientation relies on accurate feature location achieved using least squares matching measurement algorithm and a statistical analysis of the matched and adjustment results. The reported examples demonstrate its capabilities also for the orientation of images acquired under a wide baseline. A photogrammetric bundle adjustment is always employed to recover the camera parameters and the 3D object coordinates. On the other hand, the analysis of moving human characters using a monocular video is based on a deterministic approach together with constraints and assumptions on the imaged scene as well as on the human’s shape and movement. The developed photogrammetric pipeline can accommodate different input data and different types of human motions. The resulted 3D characters and scene information can be used for visualization or animation purposes or in biometric applications with medium accuracy requirements. For the automated tie point extraction phase, programs for the feature extraction and the relative orientation between image pairs and triplets were implemented, together with a graphical tool to display the recovered correspondences and epipolar geometry. Concerning the human reconstruction from monocular videos, programs were developed to recover 3D models from single images and combine them under the same reference system in case of image sequence analysis.
x
RIASSUNTO
RIASSUNTO
Il tema di questa ricerca è l’investigazione del processo di modellazione tridimensionale di oggetti o persone a partire da immagini. La modellazione tridimensionale (3D) basata su immagini e’ un argomento di ricerca molto investigato anche se recentemente sensori attivi (come il laser scanner) sono molto usati e a volte preferiti alle immagini nei progetti di modellazione tridimensionale a computer. L’interesse per la modellazione a computer e’ spinto dalla grande gamma di applicazione esistenti, come i video giochi, la navigazione automatica di veicoli, il riconoscimento automatico di oggetti, la sorveglianza, la documentazione e la visualizzazione. In particolare, la ricostruzione di modelli 3D a partira da vecchie immagini o video permette di generare nuove scene virtuali inedite e rappresentare persone che non possono esserre digitalizzate con altri sistemi attuali perche’ non disponibili o defunte. Le attuali tecniche per la modellazione 3D da immagini stanno rapidamente evolvendosi, ma le ricerche sono spesso focalizzate su oggetti o applicazioni specifiche. La completa automazione del processo di modellazione basato su immagini e’ comunque ancora una grande sfida per i ricercatori. Attualmente la maggior parte dei processi vede l’interazione di un operatore percio’ lo sviluppo di nuove procedure per aumentare l’automazione nella ricostruzione virtuale e’ uno dei punti chiave delle attuali ricerche della fotogrammetria e della computer vision. Infatti metodi di modellazione che vengono dichiariti completamente automatici non funzionano con molte sequenze di immagini e non sono affidabili per certe applicazioni come la documentazione di beni culturali, dove precisione e dettaglio sono fattori molto importanti. Metodi completamente automatici necessitano una buona tessitura nelle foto, piccole basi tra i centri di presa, assenza di occlusioni e costante luminosita’ nelle immagini. Ma nei casi pratici questi requisiti non possono essere spesso mantenuti, portando al fallimento del processo automatico o alla generazioni di modelli virtuali grezzi. Spesso questi processi estraggono molte corrispondenze in zone non necessarie per le fasi successive della modellazione e riportano precisioni molto scarse, limitando il loro utilizzo ad applicazioni che richiedono modelli 3D per visualizzazione e non per una precisa documentazione. La modellazione di un oggetto in tre dimensioni e’ un processo complesso che dovrebbe essere inteso come una serie di passaggi che iniziano con l’acquisizione dei dati e terminano con la visualizzazione del modello a computer. La modellazione con metodi fotogrammetrici consiste
xi
RIASSUNTO
di pochi ma ben noti passi: calibrazione ed orientamento delle immagini, misurazione di punti sulla superficie dell’oggetto, generazione di una superficie poligonale, tessitura e visualizzazione. Recentemente molti sforzi sono stati fatti per aumentare il livello di automazione di questi passaggi e allargare l’utilizzo della tecnologia di modellazione basata sulle immagini. Purtroppo gli sforzi non hanno ancora prodotto molti risultati affidabili e tuttora i risultati migliori sono quelli ottenuti con metodi interattivi. In questo lavoro di ricerca, diversi metodi sviluppati per analizzare immagini o video esistenti e parzialmente automatizzare alcune fasi del processo di costruzione di modelli 3D sono presentati e discussi. In particolare, scene con oggetti statici e persone in movimento sono state considerate. Il lavoro cerca di automatizzare la fase di ricerca dei punti omologhi tra le immagini (senza l’utilizzo di target) e di ricavare modelli virtuali da immagini gia’ esistenti, analizzando le potenzialita’ e i limiti della fotogrammetria nell’analisi di vecchi filmati o immagini, dove i parametri della camera sono assenti o variazioni di focale sono presenti. Per le investigazioni, immagini disponibili in Internet o acquisite personalmente e filmati monoculari digitalizzati da vecchie videocassette sono utilizzati. La possibilita’ di orientare (e calibrare) automaticamente una sequenza di immagini dipende fortemente dal tipo di dati a disposizione, dalla procedura d’acquisizione e dalla scena ripresa. Se paragonato ad altri approcci sviluppatti nella comunita’ scentifica, il lavoro fatto e’ basato su punti d’interesse correlati con procedure ai minimi quadrati e supportato da analisi statistiche. Il metodo e’ affidabile anche per immagini acquisite con una larga base tra i centri di presa. Il metodo di compensazione a stelle proiettive (bundle adjustment) e’ utilizzato per ricavare i parametri incogniti della camera e le coordinate oggetto dei punti estratti automaticamente. Per l’analisi e restituzione di persone in movimento usando filamti esistenti, e’ stato sviluppato un processo deterministico, supportato da vincoli e ipotesi sulla scena ripresa e sulla forma della persona. Il processo fotogrammetrico e’ in grado di analizzare diversi tipo video e diversi tipi di movimenti delle persone. I modelli 3D delle persone e le informazioni sulla scena sono ricavati principalmente per scopi di visualizzazione e per applicazione biomediche che non richiedono altissime precisioni. Per l’estrazione automatica di punti omologhi tra le immagini e il loro orientamento relativo, diversi programmi sono stati sviluppati, insieme ad un tool per la visualizzazione grafica dei risultati. Per la ricostruzione dei movimenti delle persone, e’ stato sviluppato un software in grado di estrarre modelli 3D dalle immagini singole e poi combinarli tra loro nello stesso sistema di riferimento.
xii
1 INTRODUCTION
Three-dimensional (3D) modeling from images is a great topic of investigation in the research community, even if range sensors are becoming more and more a common source and a good alternative for generating 3D information. 3D image-based modeling of an object should be meant as the complete process that starts from the acquisition system and ends with a virtual model in three dimensions visible interactively on a computer. Techniques for 3D modeling have been rapidly advancing over the past few years although most focus on single objects or specific applications such as architecture and city mapping. Nowadays the accurate and fully automated reconstruction of 3D models from images or videos is still a challenging problem. Most of the current approaches developed to recover accurate 3D models are based on semi-automatic procedures, therefore the introduction of new reliable and automated algorithms is one of the key goals in the photogrammetric and vision communities. The interest in 3D modeling is motivated by a wide spectrum of applications, such as video games, animation, navigation of autonomous vehicles, object recognition, surveillance and visualization. In particular, the production of 3D models from existing images or movies would allow the generation of new scenes involving objects or human characters who may be unavailable for other modeling techniques. This dissertation deals with the image-based modeling problem in close-range applications. Different techniques developed to analyze existing sequences of images and partially automate the process of constructing digital 3D models of static objects or moving human characters are reported. Sets of available or self-acquired images, as well as frames digitized from existing monocular videos are used.
1.1 3D Modeling Three-dimensional (3D) modeling of scenes and human characters from images is an intensive and long lasting research problem in the vision and photogrammetric communities. Nowadays
1
Chapter 1. INTRODUCTION
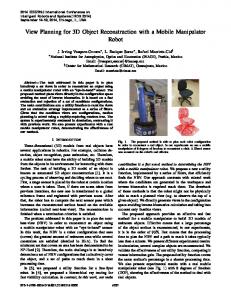
different applications require 3D models, from the traditional inspections and robotics applications (in the machine vision field) to the recent interest for visualization, animation and multimedia representation. The involved fields vary from cultural heritage to movies production, from industry to education. Of course the requirements for 3D modeling change according to the applications: visualization and virtual reality require mainly a good visual quality of the digital model, city modeling has higher demands while medicine and industrial inspections need very accurate measures. Digital models are present everywhere in the actual society, their use and diffusion are becoming very popular, also through the Internet and even low-costs computers can display them. But although it is very easy to create a simple 3D model of an object, the generation of accurate and (photo)-realistic computer models of complex scenes or human characters still requires great modeling efforts. Nowadays 3D modeling is mainly achieved with image data, range sensors or a combination of both (Figure 1.1), even if other information like CAD, surveying or GPS data is generally inserted and combined during a modeling project. Images need a mathematical model to derive the object coordinates while range data contains already the three-dimensional coordinates necessary for the modeling. Image-based procedures are widely used, in particular for industrial applications, architectural objects or for precise terrain and city modeling. Range sensors (laser scanners and stripe projection systems) are becoming very popular, in particular for modeling highly detailed objects. After the measurements, the data must be structured and a consistent polygonal surface generated to build a realistic representation of the acquired scene. A photorealistic visualization can afterwards be generated by texturing the virtual model with image information.
Figure 1.1. Simplified 3D modeling process: image-based (left) and range-based (right). Recently, a combination of the two approaches proved to be a good solution in different 3D modeling projects.
So far there is no single modeling approach that works for all types of environment and at the same time is fully automated and satisfies the requirements of every application [El-Hakim, 2001]. Multi-sensor data fusion techniques can combine data from multiple sensors and related information from associated databases, to achieve better accuracies and results that could be achieved by using a single sensor alone. An example is the integration of range sensors and close-range photogrammetry. The two approaches can complete each other and, in general, their combination satisfies all the application requirements (except the fact that nowadays the costs of
2
Section 1.1. 3D Modeling
range sensors are still very high). In case of complex and large architectural objects, the basic shapes and texture information can be achieved from high-resolution images while the fine geometric details can be recovered with a range sensor [Beraldin et al., 2005]. Potentially photogrammetry is able to provide for all the fine details of an object, but if performed entirely by an operator, can be time consuming and impractical, in particular for large-scale projects. On the other hand, fully automated image-based approaches might not work under certain image network configurations or are not reliable enough for some applications, like cultural heritage documentation. In fact automated methods [Fitzgibbon and Zisserman, 1998; Pollefeys et al., 1999; Mayer, 2003; Nister, 2004] require good features in multiple images and very short baselines between consecutive images. But these requirements are not satisfied in some practical situations, due to occlusions, illumination changes and lack of texture. Therefore fully automated procedures are generally limited in finding point correspondences and camera poses [e.g. Remondino, 2004; Roth, 2004; Läbe and Förstner, 2005; Roncella et al., 2005]. Automated processes often end up with areas containing too many features that are not all needed for the object modeling and areas with very few features to produce a complete model. Automated reconstruction methods reported an accuracy of 1:20, limiting their use for applications that require only nice-looking 3D models [Pollefeys et al., 1999]. Furthermore, post processing operations are often required, which means that user interaction is still needed. Indeed the most impressive results are achieved with interactive approaches and taking advantage of environment constraints [e.g. Debevec et al., 1996; Grün, 2000; El-Hakim, 2002; Gerth et al., 2005]. For different applications, such as documentation or virtual museums, semi-automated or manual measurements are still preferred, as smoothed results, missing details or lack of accuracy are not accepted. Interactive photogrammetric methods in modeling projects, even if not fast and automated as projective methods, can provide accuracy in the range of 1:1000-1:5000. Different efforts have been done to increase the level of automation and broaden the use of the image-based modeling technology. So far, however, the efforts to completely automate the processing, from the image acquisition to the final virtual 3D model, are not always successful or not applicable in many applications (like complex architectures or for detailed and accurate reconstructions). 3D measurement and modeling from images obviously requires that relevant points are visible in multiple image. This is often not possible either because the points or regions of interest are hidden or because there is no mark, edge, or visual feature to extract. Therefore approaches to extract 3D information from single images are often necessary [Van den Heuvel, 1998a; ElHakim, 2000; Khalil and Grussenmeyer, 2002; Remondino and Roditakis, 2003]. The realistic modeling of human characters has also been deeply investigated in the last decade, in particular using image data. Recently the demand of 3D human models is drastically increased for applications like movies, video games, ergonomics, e-commerce, virtual environments and medicine. For many applications, a complete human model consists of the 3D shape and the movements of the body. Most of the available systems consider these two modeling procedures as separate even if they are very closed. A standard approach to capture the static 3D shape (and texture) of an entire human body uses laser scanner technology. It is an expensive method but it can generate a whole body model in ca 20 seconds [e.g. CyberwareTM]. On the other hand, precise information related to character movements is generally acquired with motion capture techniques. They generally involve the tracking of human’s movements using sensor-based hardware [e.g. AscensionTM, Motion AnalysisTM, ViconTM] and prove an effective and successfully means to replicate the movements. In between, single- or multi-stations videogrammetry offers an attractive alternative technique, requiring cheap sensors, allowing markerless tracking and providing, at the same time, information for 3D shapes and movements. Model-based approaches are very
3
Chapter 1. INTRODUCTION
common, in particular with monocular video streams, while deterministic approaches are almost neglected, often due to the difficulties in recovering the camera parameters and due to limb occlusions. Moreover the analysis of existing videos can allow the generation of 3D models of characters who may be long dead or unavailable for common modeling techniques. In this work, different concepts from (close-range) photogrammetry and computer vision are used and discussed. The two disciplines are strictly related in the image-based modeling problem; they almost have the same goals and objectives even if they often describe the same ideas using different formulations or approaches.
1.1.1 Photogrammetry One of the main task of traditional photogrammetry is the precise 3D reconstruction of an object given a (minimal) set of images. But in the last years, with the increasing use of digital cameras, the number of used images is increasing (compared to the past), mainly due to texture mapping applications. Features like points and lines are observed in the images and 3D coordinates are determined, in a given coordinate system, under a central projection mathematical model (collinearity). Photogrammetry aims to get the best possible accuracy with a certain system and image network. This is required by its main applications, like mapping, industrial measurements, deformations or movements analysis, etc. Therefore mainly calibrated cameras are used (cameras with known calibration parameters), to avoid deficiencies and speed up the measurements process. With the increasing use of consumer digital cameras, uncalibrated cameras (cameras with unknown calibration parameters) became very popular and common also in photogrammetry. They are used within a self-calibrating adjustment which can recover, under particular network conditions, all the camera parameters (including lens distortion). In most of the photogrammetric applications, the uncertainty of the measurements is taken into account and a final statistical analysis is performed. In close-range photogrammetry few commercial packages can recover fully automatically the orientation and calibration parameters of a network of images, using colour coded targets [iWitnessTM] or exterior orientation devices [V-StarTM, DPA-ProTM, AustralisTM]. Automated markerless sensor orientation is still a hard task in close range and it is gaining interest in the research community. On the other hand, aerial photogrammetry presents a different situation, as the orientation parameters are nowadays often given (calibration protocol and GPS/INS values) while the tie points can be more easily and automatically extracted (compared to the terrestrial case) due to the simpler network configuration. Commercial photogrammetric digital stations have some tools for the automated relative orientation of stereo pairs (HATSTM from Helava/Leica, ISDMTM from ZI, MATCH-ATTM from Inpho), but they generally fail with tilted close-range images. The measured image correspondences are used to estimate all the unknown parameters (interior, exterior and additional parameters) and their estimation is usually attempted as unbiased, minimum variance estimation and performed with the mathematical model of Gauss-Markov (least squares adjustment), leading to a global minimization of the reprojection error (bundle adjustment). This model allow to express each observation in terms of known or unknown parameters, to include constraints between the unknowns and to use weight matrices to treat the observations and the unknown parameters as stochastic variables. The mathematical model of the central projection is non-linear, therefore it must be linearized, requiring good initial approximations of the unknowns. In many applications the determination of these approximations is still the most time consuming part. For non-photogrammetrists, this need of initial values is an impediment to adopt the rigorous photogrammetric adjustment (as it is for the required image coordinates referenced to the principal point and for the necessity to model systematic errors using additional parame-
4
Section 1.2. Motivations, objectives and contributions
ters). Therefore projective geometry formulations appeared to be a good alternative as they could be solved in a linear manner.
1.1.2 Computer Vision In computer vision the relation between 3D objects and 2D images is always expressed with the central projection model, but a linear representation is used and achieved by means of projective geometry (Section 2). All the elements of the interior and exterior orientation are grouped in a 3x4 matrix, the projection camera matrix; it is an homogeneous matrix (11 degrees of freedom) and has rank 3 (see Section 2.5). Projective geometry, as part of the more general Euclidean geometry, allows to represent the geometric entities (points, lines, planes) as vectors and to express some relations (like the relative orientation or the 2D-3D mapping) in linear form (therefore no approximate values are required in the image registration phase). However, the linearity of these formulation is achieved using more elements (e.g. more image correspondences) than the minimum required in other conventional representations. Another disadvantage of the projective linear formulations is that a non-linear distortion camera model cannot easily be included in the system. Nevertheless, some approaches describing the integration of non-linear distortion models into the projective camera model can be found in [Niini, 1994; Fitzgibbon, 2001]. The main applications in computer vision are not very different from the photogrammetric ones, but often suboptimal solutions are satisfactory. Generally the main tasks of computer vision are the image orientation and 3D object reconstruction (structure from motion) as well as robotics applications, tracking of moving objects and image inspection. Often the focus is on specific automated techniques, such as stereo-vision or continuous image streams with short baselines, with the assumption of no restriction on the motion and no knowledge of the camera. These two extremely different points of view have led to studies that are useful only in limited applications. The accuracy of the results is not the main goal of the applications while their automation is much more important. In the 3D reconstruction problem, first a projective reconstruction is performed and then it is generally upgraded into an Euclidean result. Usually image sequences acquired with a very short baseline are used, to facilitate the search of correspondences. Changes of the focal length are sometimes allowed but they generally assume no distortion and neglectable affinity and shear parameters. Different frameworks are able to recover all the camera interior parameters under weak network geometry, even if their determination could not be considered reliable due to the high correlation between the system parameters. The vision researchers have reformulated different algorithms already published by photogrammetrists in the 60’s (e.g. the coplanarity condition; see Appendix B). The advantage of these (linear) re-formulations is mainly the fact that they do not need initial approximations and that many proposed frameworks are more general, allowing the use of uncalibrated cameras and only image correspondences.
1.2 Motivations, objectives and contributions The image-based modeling process involves many steps, but some of these are not yet fully automated or reliable for the generation of accurate results. Between these steps, automated markerless sensor orientation is one of the most attractive and difficult research theme in close-range photogrammetry and computer vision, in particular if wide baseline images are used. Nowadays human interaction is often required, in terms of manual measurements or using coded targets. Furthermore, the analysis of image data, allow to recover 3D information of objects, in particular in all those applications where images are the only possible source of documentation. Considering this, a flexible, reliable and as automated as possible procedure for the image orientation and determination of 3D information is required to increase the level of automation in the data pro-
5
Chapter 1. INTRODUCTION
cessing chain. Therefore a research work has been carried out, with these main objectives: • investigate if automated markerless sensor orientation is feasible and under which conditions; • investigate the possibility to recover complete and detailed 3D models of complex objects using automated measurement procedures; • investigate which kind of (3D) information can be retrieved from existing images or videos; • investigate the capabilities and limits of photogrammetric algorithms in dealing with uncalibrated images and zooming effects. Therefore the presented work (see next three tables for a summary of the main contributions) deals with the (automated) sensor orientation of a generic set of images, the analysis of old sequences for the recovery of scene’s information and 3D models as well as the general imagebased modeling problem of complex objects.
Table 1.1. Contributions to the automated and markerless image orientation
Projective camera model
Short baseline
Large baseline
Wide baseline
Tomasi and Kanade, 1991; Nister, 2001
Fitzgibbon and Zisserman, 1998; Pollefeys et al., 1999
Matas et al., 2002; Lowe, 2004
Perspective camera model Table 1.2. Contributions to the calibration and orientation of rotating cameras Self-acquired sequences Projective camera model
Perspective camera model
Existing videos
Fix interior parameters
Hartley, 1994b
Varying interior parameters
De Agapito et al., 1998; Seo and Hong, 1999
Fix interior parameters
Wester-Ebbinghaus, 1982; Brown, 1985; Pontinen, 2002;
Varying interior parameters
Table 1.3. Contributions to the 3D human shape and movement reconstruction using markerless videogrammetry
Model-based / Probabilistic approach Model-free / Deterministic approach
6
Monocular videogrammetry
Multi-station videogrammetry
Yamamoto, 1998; Sidenbladh et al., 2000; Urtasun and Fua, 2004;
Gavrila and Davis, 1996; Vedula and Baker, 1999; Fua et al., 2000; Plaenkers, 2001; D’Apuzzo, 2003;
Section 1.3. Overview and organization
1.3 Overview and organization After this introduction, Section 2 briefly reports some fundaments of projective geometry necessary throughout the dissertation. Section 3 explains in detail the full image-based modeling problem and process, reviewing different approaches and showing some examples. Section 4 deals with the calibration and orientation procedure for image sequences: an automated pipeline for the tie point extraction is described as well as a procedure to calibrate and orient static or rotating cameras. Human body modeling and movement reconstruction from monocular videos are reported in Section 5: after an overview of human modeling, image sequences are used to recover a 3D model of static character while existing monocular videos are analyzed to recover a 3D human character and his movements. Some applications are reported in Section 6, while Section 7 gives some conclusions and future works. Two appendices conclude the dissertation. Appendix A describes some interest operators and region descriptors for photogrammetric applications. Appendix B reviews the coplanarity condition between two images in a linear form and reports about robust estimators used to cope with outliers in the data during automated procedures.
7
Chapter 1. INTRODUCTION
8
2 PROJECTIVE GEOMETRY
The algorithms and procedures developed in the photogrammetric community have been formulated mainly in Euclidean geometry, in particular in the aerial case. In fact the 3D space is often seen as an euclidean space, with euclidean geometry as the best tool for its modeling, as it preserves lengths, angles, parallelism and orthogonality under different transformations. However projective geometry is often a more adequate framework, as euclidean is much more complicated and is only a small part of it. In projective geometry, the duality principle allows to consider lines and points as identical and the use of homogeneous coordinates helps to have linear and easier equations. Moreover, the recent developments in the vision community pushed the use of projective geometry also among photogrammetric researchers, in particular in close-range applications. Indeed the new approaches can easily cope with non-linear equations, which can be re-formulated in linear mode or exploit the advantages of eigenvalues and eigenvectors analysis or matrix decompositions (e.g. to retrieve the camera parameters). Some of the work presented in this thesis is based on projective geometry’s concepts. Therefore the following sections introduce and briefly describe some fundamentals necessary throughout the dissertation. This short survey has been inspired by [Semple and Kneebone, 1954; Faugeras, 1993; Hartley and Zisserman, 2000; Faugeras and Luong, 2001] where more comprehensive descriptions are given.
2.1 Geometry layers In general, 3D geometry can be divided in layers (or stratum), each one containing a simpler structure than the others. This concept of stratification of 3D geometry is strictly related to the hierarchy of geometric transformations acting on geometric entities and leaving invariant certain properties of them. Each layer has some invariants, i.e. a property of a geometric configuration whose value is not altered by any transformation. The first stratum is the projective one: it is the
9
Chapter 2. PROJECTIVE GEOMETRY
less structured, has the least number of invariants and the largest group of transformations associated with it. Then comes the affine stratum, the metric (corresponding to the group of similarities transformations) and finally the euclidean stratum. In Table 2.1 the different strata and the associated geometric transformations are presented. Table 2.1. 2D and 3D geometry with their layers and transformation invariants. GEOMETRY
DEGREES OF FREEDOM
Euclidean
similarity
affine
projective
3 or 6
4 or 7
6 or 12
8 or 15
X
X
X
X
TRANSFORMATION: rotation & translation isotropic scaling
X
X
shear
X
perspective projection
X
INVARIANTS: distance, area
X
angles, ratios of distances
X
X
parallelism, center of mass, ratio of areas
X
X
X
incidence, cross-ratio, collinearity
X
X
X
X
2.2 Homogeneous coordinates: points, lines, planes and conics Homogeneous coordinates are a good projective geometry’s tool that plays the same role as Cartesian coordinates in Euclidean geometry. Consider a point X in a n-dimensional space with Car··· tesian coordinates given by the n-tuple ( X1, X··2 …X n ) ∈ R , the corresponding point in homogeneous coordinates is given by the (n+1)-tuples w ( X1, X··2 …···, X n + 1 ) ∀ w ≠ 0 . On the other hand, given a vector X in homogeneous coordinates w ( X1, X··2 …···, Xn + 1 ) ∀ w ≠ 0 , the corresponding representation in Cartesian coordinates is given by ( X1 ⁄ X···n + 1, …Xn ⁄ X···n + 1 ) if Xn + 1 ≠ 0 . For visualization purposes, the homogeneous vectors must be normalized, by means of Euclidean normalization (the homogeneous part of the vector has Euclidean norm equal to 1) or spherical normalization (normalization of the entire vector to 1). In 2D space, a point x is represented with its Cartesian coordinates (x1, x2)T. In the projective plane, x is represented by (x1, x2, 1)T or (αx1,α x2, α)T ∀a ≠ 0 , as the overall scaling is not impor2
tant. An homogeneous point with the last coordinate ≠ 0 corresponds to a finite point in ℜ ; the points with the last coordinate = 0 are called ideal points or point at infinity. The line l is represented as ax1+bx2+c=0 with (a,b,c)T as the line’s parameters. If we represent a point x in homogeneous coordinates, the previous equation is rewritten as: T
x l = 0
10
(2.1)
Section 2.3. Projective transformation
i.e. the inner (or scalar product) between the two vectors, that can be also expressed as: T
l x = 0
(2.2)
Given two lines l = (a,b,c)T and l’ = (a’,b’,c’)T, their intersection x is simply defined as their cross product (or vector product): x = l × l'
(2.3)
Two parallel lines intersect at infinity, but with the homogeneous notation, their intersection can always be expressed with Equation 2.3. Finally, given two points x and x’, the line l passing through them is defined as (vector product): l = x × x'
(2.4)
The line at infinity is defined as the line where all the points at infinity lie and it is expressed as T l ∞ = ( 0, 0, 1 ) .
In 3D space, a point( x, y, z ) ∈ R
3
has its homogeneous representation as (x1, x2, x3, x4)T,
∀x 4 ≠ 0 . A plane can be defined as π1x+π2y+π3z+π4=0 and its homogeneous representation is a
4-vector π=(π1,π1,π1,π1)T. A point x lying on the plane π is expressed as (scalar product): T
π x = 0
(2.5)
From previous equations (compare Equation 2.2 and Equation 2.5), it can be seen that the role of a line or a plane is dual to that of a point (if these entities are represented in homogeneous coordinates). So, the duality principle states that a theorem T regarding planes and points (or points and lines) has a dual theorem T’ where the word plane is replaced with point and vice versa. Another important entity in projective geometry is the conic: it is a curve described with a second degree equation in a plane like: 2
2
a 1 x + a 2 xy + a 3 y + a 4 x + a 5 y + a 6 = 0
(2.6)
while in homogeneous coordinates a conic has the form: 2
2
a1 x1 + a2 x1 x2 + a3 x2 + a4 x1 + a5 x2 + a6 = 0
(2.7)
or in matrix form T
x Cx = 0
(2.8)
with C the symmetric matrix containing the ai coefficients. The C matrix is not affected if multiplied with a non-zero scale factor and it has 5 degrees of freedom. In particular, the absolute conic is a conic on the plane at infinity, consisting of points (x, y, z, t) such that t=0 and x2+y2+z2=0. In matrix form, with P=(x,y,z)T, the absolute conic is defined as T
P P = 0
(2.9)
2.3 Projective transformation Geometry is the study of some properties invariant under groups of transformations. So, 2D (or 3D) projective geometry is the study of the properties of the projective plane P2 (or P3) which are invariant under a group of transformations called projectivities. A projectivity (also called projective transformation or homography) is an invertible mapping h from points in P2 (homogeneous
11
Chapter 2. PROJECTIVE GEOMETRY
vectors) to itself such that three points x1, x2, x3 lie on the same line if and only if h(x1), h(x2) and h(x3) also lie on it. Therefore a mapping h from P2 to P2 represent a projective transformation if there exists a non-singular 3x3 matrix H such that for each point in P2 it is true that h(x)=Hx. A projective transformation (or homography) is usually represented as: x 1'
h 11 h 12 h 13 x 1 (2.10)
x 2' = h 21 h 22 h 23 x 2 x 3'
h 31 h 32 h 33 x 3
The nine elements of the matrix H can be multiplied by an arbitrary non-zero factor without altering the result of the transformation. H is an homogeneous matrix, as in the homogeneous representation of a point, only the ratio between the matrix’s elements is significant. Therefore, as there are only 8 independent ratios between the 9 elements of H, the projective transformation has 8 degrees of freedom. Two or more overlapping images can be considered related with a projective transformation if: 1. the imaged scene is planar and there is an arbitrary camera motion (e.g. rotation and translation). 2. a generic 3D scene is imaged with a camera rotating around its vertical axis. 3. the camera is freely moving and viewing a very far away scene. A projective transformation is usually employed to remove the projective distortion effects from a perspective image, therefore it is used to rectify images (of planar surfaces) or for the generation of image mosaics (Figure 2.3), as described in Section 2.3.1. Equation 2.10 can be easily linearized in the elements of H and at least four corresponding points (well distributed and noncollinear) can be used to solve for H with a least squares solution.
B A
B
Figure 2.1. Image rectification with a projective transformation (A) and mosaic of 3 images (B) [Remondino, 2003].
In some applications, due to the image acquisition, a projective transformation cannot be directly used to rectify an image according to a specific plane. In these cases, a stratified approach based on an affine and metric rectification can be employed [Liebowitz, 2001].
12
Section 2.3. Projective transformation
Figure 2.2. Projective and affine transformation of a square. In the projective case, the line at infinity is mapped in a finite position.
In a perspective image of a planar surface (Figure 2.2), the line at infinity is imaged as the vanishing line of the plane (and it can be computed intersecting image lines). An image can be rectified applying a projecting transformation T such that this line is mapped to its canonical position l ∞ = ( 0, 0, 1 )
T
: 1 0 0 T = 0 1 0 TA l1 l2 l3
(2.11)
where TA is a planar affine transformation with 6 degrees of freedom so defined: a 11 a 12 t x TA = a a t 21 22 y 0
(2.12)
0 0
TA should restore angles and length ratios for non-parallel lines.
Figure 2.3. Image rectification using a stratified approach (from projective to affine to euclidean): a standard projective transformation (according to the ground plane) could not correctly rectify the image.
2.3.1 Mosaic from overlapping images There are mainly three approaches to generate a panoramic view (or image mosaic) and they are based on: • Single images acquired almost from the same position (just rotating the camera): it is the traditional method where a panoramic view is generated stitching and registering together the different overlapping images. • Mirror techniques: they use single or double mirror, providing for high capturing rate but low resolutions.
13
Chapter 2. PROJECTIVE GEOMETRY
• Rotating linear array devices: these are panoramic cameras able to capture a 360 degrees view in one scan. A mosaic generated from multiple overlapping and possibly cocentric images is the easiest and most used method. The images can be acquired using a tripod or just rotating manually the camera around its vertical axis. It is a low cost technique, sometimes time consuming as non-linear optimization algorithms are used for the registration and blending of the images, based on a projective transformation between image pairs. The images are transformed according to a reference frame, aligned and blended together into a wider image. A common approach is based on the following steps: 1. selection of corresponding points (x, y) and (x’, y’) between the image pairs I and I’; 2. compute the projective transformation between the two images recovering the 8 parameters iteratively by minimize the sum of the squared intensity errors E: E =
∑ [ I' ( x', y' ) – I ( x, y ) ]
2
(2.13)
i
over all the corresponding pixels pairs i. 3. blend the resampled image I’ with the reference image I using a bilinear weighting function (weighted average) and project the new image on a plane.
Figure 2.4. Image mosaic automatically generated using 3 images of a shelf: in the zoomed details, areas near the image borders are shown.
More than 30 commercial packages are available on the market to produce mosaics and panoramas. They distinguish in the extent of automation and in the requirements for the input data. Usually the input images should be provided in the correct acquisition order, while some studies proved the possibility to generate panoramas also from unordered image sequences [Brown et al., 2005].The source format is usually JPEG, while the output file can have different formats (MOV, IVR, PAN, etc.). After the stitching of the single images, the panorama is usually warped applying a particular projection for better visualization. There are mainly four types of projections (planar, cylindrical, spherical and cubic) and they differ in the CPU requests and distortion correction. The panoramic image can then be visualized with special viewers that allow also interactive navigation. Panoramic views created with this approach are very useful for virtual tours [e.g. WorldHeritage-Tour], virtual reality and e-commerce.
2.4 Projective invariants The invariants are often related to geometric entities which serve to upgrade the structure of the geometry to a higher level of the stratification. An important property of projective geometry
14
Section 2.4. Projective invariants
transformations is the fact that some measurements are invariant under these transformations (see Table 2.1). In the Euclidean geometry the main transformations are rotation and translation and the most important invariants are distances and angles. For all the projective transformations, the fundamental invariant is the cross-ratio. The cross-ratio is defined for four collinear points (Figure 2.5) or four concurrent lines. Concerning points, the cross-ratio τ is defined as: d ( p 3, p 1 )d ( p 4, p 2 ) τ = CR ( p 1, p 2, p 3, p 4 ) = ------------------------------------------d ( p 3, p 2 )d ( p 4, p 1 )
(2.14)
where d(pi, pj) is the Euclidean distance between pi and pj. As projective transformation does not preserve distances or ratios of distances but ratios of ratios of distances, it follows that: CR ( p 1, p 2, p 3, p 4 ) = CR ( p 1', p 2', p 3', p 4' )
(2.15)
The four points defining a cross-ratio invariant can be permuted 4! times. But there are only six distinct values of the cross-ratio within the 24 permutations: ⎧ 1 1 - τ---------– 1- ---------τ -⎫ , , ⎨ τ, --τ-, 1 – τ, ---------1 – τ τ τ – 1 ⎬⎭ ⎩
(2.16)
These six values can create confusion in using the cross-ratio as index for measurements, as the order of the points along a line can change after a projective transformation. Therefore a more independent invariant can be defined as rational function of the cross-ratio: 2
3
(τ – τ + 1) j ( τ ) = -----------------------------2 2 τ (τ – 1)
(2.17)
This is not affected by the permutations of the four points pi and is called the j-invariant. As points and lines are dual in projective geometry, the cross-ratio exists also for lines and is defined as: sin θ 13 sin θ 24 CR ( l 1, l 2, l 3, l 4 ) = -----------------------------sin θ 23 sin θ 14
(2.18)
where θij is the angle between line i and j (Figure 2.5). Each line cutting the pencil of lines li defines four points pi. The pencil and the points define two cross-ratios and it is valid that: CR ( p 1, p 2, p 3, p 4 ) = CR ( l 1, l 2, l 3, l 4 )
(2.19)
Figure 2.5. Cross-ratio invariant. Four points pi aligned undergoing a projective transformation (left). The three sets of collinear points are related by a line-to-line projectivity and all the sets have the same cross-ratio (center). The pencil of lines li has a cross-ratio defined by the angles between the lines (right).
During the image acquisition process, the image plane and the object plane are related with a projective relationship (Figure 2.6). The relationship between the image and the object plane is
15
Chapter 2. PROJECTIVE GEOMETRY
specified if the coordinates of at least four corresponding points in each of the two projectively related planes are given. Denoting with Xu, Yu, xn and yn the unknown and known object and image vectors of an additional point in object space and by subscripts 1,2,3 and 4 the known points, the 2D invariance property is given by: det [ x 1 x 2 x 3 ] det [ x 1 x 4 x n ] det [ X 1 X 2 X 3 ] det [ X 1 X 4 X u ] --------------------------------- ⋅ --------------------------------- – ------------------------------------ ⋅ ------------------------------------ = 0 det [ x 1 x 2 x 4 ] det [ x 1 x 3 x n ] det [ X 1 X 2 X 4 ] det [ X 1 X 3 X u ]
(2.20)
with det the determinant of the 3x3 matrices generated associating the 3 point vectors xi and Xi. Equation 2.20 represents a linear equation in the unknown vector Xu. Interchanging the positions of any two points in all the determinant of Equation 2.20, a new equation is obtained and the Xu coordinates can be computed.
Figure 2.6. Projective relationship between two planes. Given the coordinates of 4 corresponding points, any other point can be recovered.
2.4.1 Cross-ratio for distance measurements The cross-ratio invariant can also be applied to points lying on (parallel) planes. Consider Figure 2.7-A, where points T and B, lying respectively on plane P’ and P, are at a distance H and perpendicular to a reference direction V3. In image space they are specified respectively by the corresponding image points t and b that are on two planes defined by the two vanishing points v1 and v2 (Figure 2.7-B). The image point c is defined as the intersection of the line joining the corresponding points C and C’ with the vanishing line lv1v2. The image point c (representing the camera center C) lies on a plane at distance HC from the reference plane P. With this configuration, the four points b, t, c and v3 are aligned (along the vertical reference direction) and they define a cross-ratio. At the same time, in object space, the points B, T, C’ and V3 define the same crossratio, therefore, from Equation 2.15: d ( b, c )d ( t, v 3 ) d ( B, C )d ( T, ∞ ) τ = ---------------------------------- = -------------------------------------d ( T, C )d ( B, ∞ ) d ( t, c )d ( b, v 3 )
(2.21)
as V3 in object space is at infinity. The right side of Equation 2.21 becomes [HC-(HC-H)] and we get: d ( t, c )d ( b, v 3 ) H- = 1 – --------------------------------------HC d ( b, c )d ( t, v 3 )
16
(2.22)
Section 2.4. Projective invariants
Therefore, if a reference distance H is known, we can compute the height of the camera HC and then any other distance between two planes perpendicular to the reference direction. The reference direction does not need to be the vertical one; moreover, if the camera position C is between the points B and T, the cross ratio is still valid, even if Equation 2.22 is slightly different (because of the different order of the points). Similar results, with an algebraic representation of Equation 2.22 and an uncertainty analysis, are presented in [Criminisi, 1999], involving the 3x4 projective matrix of the camera and avoiding possible problems with the order of the points in the crossratio computation.
A
B
C
Figure 2.7. Two parallel planes P and P’ in object (A) and image space (B), perpendicular to the vertical reference direction V3. The cross-ratio defined by the distance between the two parallel planes (C).
2.4.1.1 Accuracy of the measurements A covariance estimation of the measurements obtained with Equation 2.22 can be obtained with the error propagation law. If we consider our equations as a continuously differentiable function y=f(x), with Σxx the covariance matrix of the data x, the covariance matrix Σyy of y can be expressed as: Σ yy = ( ∇f )Σ xx ∇f
T
(2.23)
∂y with the ∇ operator representing the Jacobian of y function, i.e. ----- . ∂x The accuracy of the measurements depends on the accuracy of the measured distances di between the points, the variance of the vanishing points and the accuracy of the reference distance. The precision of the points defining the distances is determined by the (manual) measurement or by the cross product used to find them. The variance of a cross product c = p × p' can be computed for each single component of the resulting homogeneous vector c using Equation 2.23: 2
2
2
2 2
2
2
2
2
σc = x2 σy + x3 σy + y2 σx + y3 σx 1
2
3
2
2
2
2
2
3
2
2
2
2
2
3
2
2
1
2
2
3
2
2
2
2
1
(2.24)
1
2
σc = x1 σy + x2 σy + y1 σx + y2 σx 3
2
2
σc = x1 σy + x3 σy + y1 σx + y3 σx 2
1
If correlations are not considered, the accuracy of the Euclidean distance d between two points (required e.g. in Equation 2.22) is given by: ∂d 2 2 ∂d 2 2 ∂d 2 2 ∂d 2 2 2 σ d = ⎛ -------⎞ σ x + ⎛ -------⎞ σ y + ⎛ -------⎞ σ x + ⎛ -------⎞ σ y ⎝ ∂x i⎠ ⎝ ∂y i⎠ ⎝ ∂x j⎠ ⎝ ∂y j⎠ i i j j
(2.25)
while the variance of the estimated measurement H in Equation 2.22 becomes: ∂H 2 2 2 σ H = ⎛ ----------⎞ σ H + ⎝ ∂H C⎠ C
∂H
-⎞ ∑ ⎛⎝ -----∂d ⎠ i
2
2
σd
(2.26) i
17
Chapter 2. PROJECTIVE GEOMETRY
2.5 Projective camera model The image acquisition process performed by a projective camera is described with a sequence of three projective transformations: 1. a 3D mapping from the object coordinate system into the camera coordinate system; 2. a mapping from the 3D camera coordinate system into the 2D image plane; 3. a mapping to change the coordinate system in the image plane. The pinhole camera model describes the mapping of a 3D point X = (X,Y,Z)T into a 2D point x = (x,y)T lying on the image plane at the intersection of the line joining the point X and the center of projection of the camera. If the projection center is at distance f from the image plane, using triangle properties, it can be shown that: X x = f --Z Y y = f --Z
(2.27)
The image formation in a pinhole camera model can be linearly represented by using homogeneous coordinates and the overall projective imaging process is given by: x = PX
(2.28)
where P is called projective camera matrix and is represented as: P = K [ Rt ]
(2.29)
with R a 3x3 rotation matrix, t a 3x1 translation vector and K the 3x3 upper triangular camera matrix containing the interior parameters and defined as: fx s x0 K =
0 fy y0
(2.30)
0 0 1
with • fx and fy represent the camera focal length in terms of pixel dimensions in the x and y directions respectively; • s represents the skew parameter; • x0 and y0 represent the principal point position in terms of pixel dimensions. If the camera projection center is represented with a 4-vector C = (X0,Y0,Z0,T0)T, it can be recovered using the condition PC=0 and solved using the SVD of the P matrix: X0 Y0 Z0 T0
= det [ p 2, p 3, p 4 ] = – det [ p 1, p 3, p 4 ] = det [ p 1, p 2, p 4 ] = – det [ p 1, p 2, p 3 ]
(2.31)
with pi the columns of the P matrix.
2.6 The reconstruction problem Let us consider a set of 3D object points Xk (k=1,...m) which are seen from n cameras, each one associated with a projective camera matrix Pi (i=1,...n). The xij homogeneous coordinates of the projected m-th point onto the n-th image are related to the object points through the Pi matrices
18
Section 2.6. The reconstruction problem
and provide a projective reconstruction (defined up to a scale factor) such that: i
xj ≅ Pi Xj
(2.32)
without any a priori knowledge of scene and cameras. Given the camera matrices Pi and the corresponding points xij, the computation of the intersecting points Xk is called triangulation. Since a projective structure is often not sufficient, the next step is to obtain an Euclidean (metric) reconstruction which requires a similarity transformation composed of a rigid translation and an uniform scale factor. This step is called autocalibration or self-calibration and is usually achieved through the stratification idea (using all the available information, the projective reconstructed model is firstly upgraded to an affine model which is then used as initialization for the Euclidean reconstruction). The most common approaches use constraints on the interior camera parameters, which are generally assumed as constant. A first approach was proposed in [Maybank and Faugeras, 1992], using the Kruppa equations [Kruppa, 1913]: given two images, these equations impose that the epipolar lines which correspond to the epipolar planes tangent to the absolute conic should be tangent to its projection in both images. Knowing the epipolar geometry between at least three images (taken from different positions), a system of polynomial equations can be built and the interior parameters of the camera can be grouped in a matrix K, called the Kruppa coefficient matrix, representing the dual of the image of the absolute conic. The camera interior parameters are recovered by means of Cholesky factorization of K. It has been reported that the method requires extremely accurate computation of the epipolar geometry and that with many images the method threatens to be unworkable, due to the growing number of potential solutions. In [Hartley, 1994d] a minimization of the differences between the computed interior parameters and those obtained with a factorization of the projective camera matrix is performed. The author comments his work as usable for any number of views but lengthy and difficult to implement. [Triggs, 1997] and [Heyden and Aström, 1997] worked on the idea of the absolute quadratic, an entity which encodes both the absolute conic and the plane at infinity. All these approaches encounter problems in the solution of all the camera interior parameters at once from the non-linear equations. Therefore other methods, based on a stratified approach were presented. [Pollefeys et al., 1996; Pollefeys and Van Gool, 1997; Pollefeys et al., 1999] proposed a method based on the modulus constraint which can obtain a metric calibration from at least three views with constant or varying interior parameters. Finally other researchers tried to take advantage from restricted camera motion, like pure translation [Armstrong et al., 1994], pure rotation [Hartley, 1994b] or planar motion [Armstrong et al., 1996]. The use of projective geometry for camera calibration and scene reconstruction can lead to ambiguities in the solution: this is mainly due to some critical motions of the camera that generate more solutions which satisfy all the applied constraints on the camera parameters. Studies of critical motion sequences for projective reconstruction and self-calibration are presented in [Sturm, 1997; Hartley, 2000; Kahl et al., 2000; Kahl et al., 2001]. Despite all these different approaches and formulations, the problem is generally solved with non linear algorithms, requiring an initialization of the solution. Most of the approaches are tested mainly on self-acquired images or synthetic data and they all show degradation as noise increases; and the more camera constraints are used (e.g. zero-skew, squared pixel), the more accurate are the results. A general approach, for generic motion and estimation of all the camera interior parameters (including lens distortion) is not yet available. Furthermore, the accuracy is never considered as the primary goal: different tests showed that methods based on projective geometry result in geometric errors in the range of 4-5% [e.g. Pollefeys et al., 1999] which is a relative accuracy of 1:20.
19
Chapter 2. PROJECTIVE GEOMETRY
20
3 3D MODELING FROM IMAGES
3.1 3D modeling overview 3D modeling of an object can be seen as the complete process that starts from the data acquisition and ends with a virtual model in three dimensions visible interactively on a computer. Often 3D modeling is meant only as the process of converting a measured point cloud into a mesh or textured surface while it should describe a more complete and general process. 3D modeling of objects and scenes is required in many applications and recently has become a very important and fundamental step, in particular for cultural heritage digital archiving. The motivations are different: documentation in case of loss or damage, virtual tourism and museum, education resources, interaction without risk of damages, etc. The requirements specified by many applications (like digital archiving, mapping, etc.) are the high geometric accuracy, the photo-realism of the results, the modeling of the complete details as well as the automation, the low costs, the portability and flexibility of the modeling technique. Therefore, selecting the most appropriate technique for a given application is not always an easy task. The most general classification of 3D object measurement and reconstruction techniques can be done in contact (CMM, rulers, bearing, etc.) and non-contact (X-ray, SAR, photogrammetry, etc.) methods. Non-contact measurement methods can use X-rays, light waves, micro waves or ultrasonic. They are widely used, in particular in industrial applications, heritage modeling and documentation or scene reconstruction. Nowadays the generation of a 3D model is mainly achieved using non-contact systems based on light waves, in particular active or passive sensors (Figure 3.1). In some applications, other information like CAD, surveying or GPS data are also used and combined during the modeling project. Active sensors provide directly range data containing the three-dimensional coordinates necessary for the mesh generation phase. Passive sensors provide for images that need a mathe-
21
Chapter 3. 3D MODELING FROM IMAGES
matical model to derive the 3D object coordinates. After the measurements, the data must be structured and a consistent polygonal surface generated to build a realistic representation of the modeled scene. A photo-realistic visualization can afterwards be generated texturing the virtual model with image information. We can actually distinguish four alternative methods1 for object and scene modeling: 1. Image-based rendering (IBR): it does not include the generation of a geometric 3D model but, for particular objects and under specific camera motions and scene conditions, it might be considered a good technique for the generation of virtual views [Kang, 1999; Shum and Kang, 2000]. IBR creates novel views of 3D environments directly from input images. The technique relies on either accurately knowing the camera positions or perform automatic stereo matching that, in the absence of geometric data, requires a large number of closely spaced images to succeed. Object occlusions and discontinuities, particularly in large-scale and geometrically complex environments, will affect the output. The ability to move freely into the scene and viewing objects from any position may be limited depending on the method used. Therefore IBR method is generally used for applications requiring limited visualization. 2. Image-based modeling (IBM): it is the widely used method for geometric surfaces of architectural objects [Streilein, 1994; Debevec et al., 1996; Van den Heuvel, 1999a; El-Hakim, 2002] or for precise terrain and city modeling [Grün, 2000]. In most of the cases, the most impressive and accurate results still remain those achieved with interactive approaches. IBM methods use 2D image measurements (correspondences) to recover 3D object information (e.g. photogrammetry) or they estimate surface normals instead of 3D data like shape from shading [Horn and Brooks, 1989], shape from texture [Kender, 1978], shape from specularity [Healey and Binford, 1987], shape from contour (medical applications) [Minoru and Nakamura, 1993; Ulipinar and Nevatia, 1995], shape from 2D edge gradients [Winkelback and Wahl, 2001]. Passive image-based methods acquire 3D measurements from single or multi-stations; they use projective geometry or perspective camera model; they are very portable and the sensors are often low-cost. 3. Range-based modeling: this method captures directly the 3D geometric information of an object. It is based on expensive active sensors and generally provides for highly detailed and accurate representation of any shape. The sensors rely on artificial lights or patter projection [Rioux et al., 1987; Besl, 1988]. Since many years structured light [Maas, 1992; Gartner et al., 1995; Sablatnig and Menard, 1997], coded light [Wahl, 1984] or laser light [Sequeira et al., 1999] are used for the measurements of objects. In the last twenty-five years many progresses have been made in the field of solid-state electronics and photonics and many 3D sensing have been developed [Beraldin et al., 2000; Blais, 2004]. Nowadays many commercial solutions are available [BreukmannTM, CyberwareTM, CyraxTM, ShapeGrabberTM, RieglTM], based on triangulation (with laser light or stripes projection), time-of-flight, continuous wave, interferometry or reflectivity measurements principle. They are becoming a very common tool for the scientific community but also for non-expert users like the average cultural heritage professionals. These sensors are quite expensive, designed for specific applications and depend on the reflective characteristics of the surface. Most of the systems focus only on the acquisition of the 3D geometry, providing only a monochrome intensity value for each range value. Other systems have a color camera attached to the instrument, at a known configuration, so that the acquired texture is always registered with the geometry. However, 1. Computer animation software (3DMaxTM, LightwaveTM, MayaTM) is also used for the generation of 3D models, generally without using real measurements. Starting from simple elements like polygonal boxes, the packages can subdivide and smooth the geometric entities using splines and provide for realistic results. This kind of software is mainly used for movie production, architectural and object design.
22
Section 3.1. 3D modeling overview
this approach may not provide the best results since the ideal conditions for taking the images may not coincide with those for scanning. Therefore the generation of realistic 3D models is often supported with textures obtained from separate high-resolution color digital cameras [Beraldin et al., 2002; Guidi et al., 2003]. The accuracy at a given range varies significantly from one scanner to another. Also, due to object size, shape and occlusions, it is usually necessary to perform multiple scans from different locations to cover every part of the object: the alignment and integration of the different scans can affect the final accuracy of the 3D model. Furthermore, range sensors have often problems with edges where blunders or smoothing effects might appear. 4. Combination of image- and range-based modeling: different investigation on sensor integration have been performed in [El-Hakim and Beraldin, 1994, 1995]. Photogrammetry and laser scanner have been combined in particular for complex or large architectural objects, where no technique by itself can efficiently and quickly provide a complete and detailed model. Usually the basic shapes (e.g. planar surfaces) are determined by image-based methods and fine details (e.g. reliefs) by range sensors [Flack et al., 2001; Sequeira et al., 2001; Bernardini et al., 2002; Borg and Cannataci, 2002; El-Hakim et al., 2004; Beraldin et al., 2005]. In the next sections, only the terrestrial image-based 3D modeling problem for close-range applications will be discussed in detail.
Figure 3.1. 3D acquisition systems for object measurements using non-contact methods based on light waves.
A
B
C
D
E
Figure 3.2. 3D models of objects from image measurements (A [Guarnieri et al., 2004], B [D’Apuzzo, 2003]), laser scanner (C [CyberwareTM]) or generated using commercial animation software (D and E [3DMaxTM]). 23
Chapter 3. 3D MODELING FROM IMAGES
3.2 Terrestrial image-based 3D modeling Recovering a complete, detailed, accurate and realistic 3D model from images is still a difficult task, in particular if uncalibrated or widely separated images are used. Firstly because the wrong recovery of the parameters could lead to inaccurate and deformed results. Secondly because a wide baseline between the images always requires the user interaction in the point measurements. Image-based modeling, by definition, obtains reliable measurements and 3D models by means of photographs. In particular, photogrammetry deals since many years with the 3D reconstruction of objects from images: even if it mostly requires precise calibration and orientation procedures, reliable commercial packages are now available. They are all based on manual or semi-automated measurements [CanomaTM, ImageModelerTM, iWitnessTM, PhotoGenesisTM, PhotoModelerTM, ShapeCaptureTM]; they allow, after an orientation and bundle adjustment phase, to obtain sensor calibration data and three-dimensional object point coordinates from multi-sensor or multi-image networks, as well as wireframe or textured 3D models. The overall image-based 3D modeling process, described in Figure 3.3, consists of a few wellknown steps: • Design (sensor and network geometry) • 3D measurements (point clouds, lines, etc.) • Structuring and modeling (geometry and texture) • Visualization and analysis Nowadays, the recovery of the sensor (and network) geometry and the measurement phase are often separated from the modeling and visualization part (Figure 3.3). But in many applications this gap has to be bridged in order to perform correct measurements and recover realistic 3D models. We should distinguish between 3D modeling from multiple images or using a single image. In the following the multi-image approach is discussed in detail, while Section 3.3 shortly shows the single image case. The research activities in terrestrial image-based modeling can be classified as: 1. Approaches that try to get automatically a 3D model of the scene from uncalibrated images (also called 'shape from video' or 'VHS to VRML' or ‘Video-To-3D’). Many efforts to completely automate the process of taking images, calibrating and orienting them, recovering the 3D coordinates of the imaged scene and modeling them have been done, but while promising, the methods are thus far not always successful. The fully automated procedure, widely reported in the computer vision community [Fitzgibbon and Zisserman, 1998; Pollefeys et al., 1999; Nister, 2004], starts with a sequence of images taken by an uncalibrated camera under very small baselines. The system automatically extracts interest points, like corners, sequentially matches them across views, then computes camera parameters and 3D coordinates of the matched points using robust techniques. The key to the success of this fully automatic procedure is that successive images cannot vary significantly, thus the images must be taken at short intervals. The first two images are generally used to initialize the sequence. This is done in a projective geometry basis and is usually followed by a bundle adjustment. A "self-calibration" (or auto-calibration) to compute the intrinsic camera parameters (usually only the focal length), is generally used in order to obtain metric reconstruction, up to a scale, from the projective one. The 3D surface model is then automatically generated by means of dense depth maps. In case of complex objects, further matching procedures are applied in order to get a complete 3D model. See [Scharstein and Szeliski, 2002] for a recent overview of dense stereo correspondences algorithms. Some approaches have been also presented for the automated extraction of image correspondences between wide-baseline images [Pritchett and
24
Section 3.2. Terrestrial image-based 3D modeling
Figure 3.3. Simplified image-based modeling and visualization pipeline: in the future the modeling steps should be all connected and not separated as nowadays.
Zisserman, 1998; Matas et al., 2002; Ferrari et al., 2003; Xiao and Shah, 2003; Lowe, 2004], but their reliability and applicability for automated image-based modeling of complex objects is still not satisfactory as they yeld mainly a sparse set of matched feature points. Dense matching reconstruction under large baselines were instead reported in [Strecha et al., 2003; Megyesi and Chetverikov, 2004]. Automated image-based methods rely on features that can be extracted from the scene and automatically matched, therefore occlusions, illumination changes, limited locations for the image acquisition and un-textured surfaces are problematic. Furthermore, it is very common that an automated process ends up with areas containing too many features that are not all required for modeling while there are areas without any or with a minimum number of features that cannot produce a complete 3D model. Automated processes required highly structured images with good texture, high frame rate and uniform camera motion, otherwise they will inevitably fail. Image configurations that lead to ambiguous projective reconstructions have been identified in [Hartley, 2000; Kahl et al., 2001] while self-calibration critical motions have been studied in [Sturm, 1997; Kahl et al., 2000]. The level of automation is also strictly related to the quality (accuracy) of the required 3D model. 'Nice-looking' 3D models, used for visualization purposes can certainly be generated with automated processes, while for documentation, high accuracy and photo-realistic requirements, user interaction is mandatory. For all these reasons, more emphasis has been always put on semi-automated or interactive procedures, combining the human ability of image understanding with the powerful capacity and speed of computers. This has led to a number of promising approaches for the modeling of architectures and other complex geometric objects. 2. Approaches that perform a semi-automated 3D reconstruction of the scene from oriented images. They interactively or automatically orient and calibrate the images and afterwards perform the semi-automated modeling relying on the human operator [Streilein, 1994; ElHakim, 2000; Gibson et al., 2002; El-Hakim, 2002; Guarnieri et al., 2004]. Semi-automated approaches are much more common, in particular in case of complex geometric objects, where the interactive work consists in the topology definition, editing and 3D data post-processing. The output model, based only on the measured points, usually consists of surface boundaries that are irregular, overlapping and need some assumptions in order to generate a correct surface model. The degree of modeling automation increases when certain assumptions about the object, such as perpendicularity or parallel surfaces, can be introduced. [Debevec et al., 1996] developed a hybrid easy to use system to create 3D models of architectures from a small number of photographs. It is the well-known Façade program, afterwards included in the commercial software CanomaTM. The basic geometric shape of a structure is first recovered using models of polyhedral elements. In this interactive step, the actual size of the elements and camera pose are captured assuming that the camera intrinsic parameters are known. The second step is an automated matching procedure, constrained by the now known basic model to add geometric details. The approach proved to be effective in creating geometrically accurate and realistic 3D models. The drawback is the high level of interaction. Since the assumed shapes determine the camera poses and all 3D points, the results are as accurate 25
Chapter 3. 3D MODELING FROM IMAGES
as the assumption that the structure elements match those shapes. [Liebowitz et al., 1999] presented a method for creating 3D graphical models of scenes from a limited numbers of images, in particular in situations where no scene coordinate measurements are available (due to occlusions). After manual point measurements, the method employs constraints available from geometric relationships that are common in architectural scenes, such as parallelism and orthogonality, together with constraints available from the camera. [Van den Heuvel, 1999a] uses a line-photogrammetric mathematical model and geometric constraints to recover the 3D shapes of polyhedral objects. Using lines, occluded object points can also be reconstructed and part of occluded objects can be modeled due to the introduction of coplanarity constraints. [El-Hakim, 2002] developed a semi-automatic technique (partially implemented in ShapeCaptureTM) able to recover a 3D model of simple as well as complex objects. The images are calibrated and oriented without any assumption of the object shapes but using a photogrammetric bundle adjustment, with or without self-calibration, depending on the given configuration. This achieves higher geometric accuracy independent from the shape of the object. The modeling of complex objects parts, such as groin vault ceiling or columns, is achieved by manually measuring in multiple images a number of seed points and fitting a quadratic or cylindrical surface. Using the recovered parameters of the fitted surface and the known camera internal and external parameters for a given image, any number of 3D points can be added automatically within the boundary of the section. [Lee and Nevatia, 2003] developed a semi-automatic technique to model architectures where the camera is calibrated using the known shapes of the buildings being modeled. The models are created in a hierarchical manner by dividing the structure into basic shapes, facade textures and detailed geometry such as columns and windows. The detailed geometry modeling is an interactive procedure that requires the user to provide shape information such as width, height and radius and then the shape is completed automatically. 3. Approaches that perform a fully automated 3D reconstruction of the scene from oriented images. The orientation and calibration is performed separately, interactively or automatically, while the 3D object reconstruction, based on object constraints, is fully automated. Most of the approaches, demonstrated with very simple objects, explicitly makes use of strong geometric constraints such as perpendicularity and verticality, which are likely to be found in architecture [Dick et al., 2000]. [Dick et al., 2001] employ model-based recognition technique to extract high-level models in a single image and then use their projection onto other images for verification. The method requires parameterized building blocks with a priori distribution defined by the building style. The scene is modeled as a set of base planes corresponding to walls or roofs, each of which may contain offset 3D shapes that model common architecture elements such as windows and columns. Again, the full automation necessitates feature detection and a projective geometry approach, however the technique used here also employs constraints, such as perpendicularity between planes, to improve the matching process. In [Grün et al., 2001], after a semi-automated image orientation step, a multi-photo geometrically constrained automated matching process is used to recover a dense point cloud of a complex object. The surface is measured fully automatically using multiple images and deriving simultaneously the 3D object coordinates. [Werner and Zisserman, 2002] proposed a fully automated Façade-like approach: instead of the basic shapes, the principal planes of the scene are created automatically to assemble a coarse model. A similar approach was presented in [Schindler and Bauer, 2003; Wilczkowiak et al., 2003]. The latter method searches three dominating directions that are assumed to be perpendicular to each other: the coarse model guides a more refined polyhedral model of details such as windows, doors, and wedge blocks. Since this is a fully automated approach, it requires feature detection and closely spaced images for the automatic matching and camera pose estimation using projective geometry. [D’Apuzzo,
26
Section 3.2. Terrestrial image-based 3D modeling
2003] developed an automated surface measurement procedure that starts from few seeds points measured in multiple images and then matches the homologous points within the Voronoi regions defined by the seed points.
3.2.1 Design and recovery of the network geometry Different studies in close-range photogrammetry [see Fraser, 1996; Clarke et al., 1998; Grün and Beyer, 2001; El-Hakim et al., 2003] have confirmed that: • the accuracy of a network increases with the increase of the base-to-depth (B/D) ratio and using convergent images rather than images with parallel optical axes; • the accuracy improves significantly with the number of images where a point appears. But measuring the point in more than four images gives less significant improvement; • the accuracy increases with the number of measured points per image. However the increase is not significant if the geometric configuration is strong and the measured points are well defined (like targets) and well distributed in the image; • the image resolution (number of pixel) influences the accuracy of the computed object coordinates: on natural features, the accuracy improves significantly with the image resolution, while the improvement is less significant on well-defined large resolved targets. Factors concerning the camera calibration are: • self-calibration (with or without known control points) is reliable only when the geometric configuration is favourable, mainly highly convergent images of a large number of (3D) targets spatially well-distributed; • a flat (2D) testfield could be employed for camera calibration if the images are acquired at many different distances, to allow the recovery of the correct focal length; • at least 2-3 images should be rotated of 90 degrees to allow the recovery of the principal point, i.e. to break any projective coupling between the principal point offset and the camera station coordinates, and to provide a different variation of scale within the image; • a complete camera calibration should be performed, in particular for the lens distortions. In most cases, particularly in modern digital cameras and for unedited images, the camera focal length can be found, albeit with less accuracy, in the header of the digital images. This can be used on uncalibrated cameras if self-calibration is not possible or unreliable. Considering this, in order to optimize the measurement operations in terms of accuracy and reliability, particular attention must be given to the design of the network. Designing a network includes deciding on suitable sensor and image measurements scheme, how many cameras or stations are necessary, their locations to have a good imaging geometry and many other considerations. The network configuration determines the quality of the calibration and defines the imaging geometry. Unfortunately, in many applications, the network design phase is not considered, or impossible to apply in the actual object setting, or the images are obtained from existing videos, leading to poor imaging geometry. The network geometry is generally recovered with a bundle-adjustment (with or without self-calibration, depending on the given network configuration) [Brown, 1976; Triggs et al., 2000] while the required image correspondences can be measured manually or automatically.
3.2.2 Surface measurements Once the images are oriented, the surface measurement step can be performed with manual, semi- or automated procedures. Automated photogrammetric matching algorithms [e.g. Grün et al., 2001; D’Apuzzo, 2003; Grün et al., 2004a], usually rely on the least squares matching algorithm [Grün, 1985a] which can be used on stereo or multiple images, exploiting the multi-photo
27
Chapter 3. 3D MODELING FROM IMAGES
geometrical constraint [Baltsavias, 1991]. These methods can produce very dense point clouds but usually do not take into consideration the geometrical conditions of the surface's object and maybe generate smoothing results [Grün et al., 2004a; Section 3.4.1]: therefore it is often quite difficult to correctly turn randomly generated point clouds into polygonal structures of high quality and without losing important information. The smoothing effects of automated matching algorithms are mainly caused by the following reasons: • the image patches of the matching algorithm are assumed to correspond to planar object surface patches: along small objects or corners, this assumption is not valid anymore, therefore these features are smoothed out (Figure 3.4); • smaller image patches could theoretically avoid or reduce the smoothing effects, but may be not suitable for the correct determination of the matching reshaping parameters, because a small patch may not include enough image signal content. Nevertheless, the use of high-resolution images (say 10 megapixel) in combination with advanced matching strategies based on features- and area-based techniques [see for example Zhang, 2005] would be able to recover also the fine details of an object and avoid smoothing effects. After the image measurements, the matched 2D coordinates are transformed in 3D object coordinates using the previously recovered camera parameters (forward intersection). In case of multiphoto geometrically constrained matching [Baltsavias, 1991], the 3D object coordinates are simultaneously derived together with the image points.
Figure 3.4. Patch definition in template least squares matching measurement procedure (left). Patches are assumed to correspond to planar object surface patches where the assumption is not valid (right).
In the vision community, mainly two-frames stereo correspondence algorithms are used [Dhond and Aggarwal, 1989; Brown, 1992; Scharstein and Szeliski, 2002], producing a dense disparity map, i.e. a parallax estimate at each pixel. Often the second image is resampled according to the epipolar line, to have parallax value in only one direction. A large number of algorithms have been developed and the dense output is generally used for view synthesis, image-based rendering or modeling of complete regions. Theoretically automated measurements should produce more accurate results compared to manual procedures, but mismatches, irrelevant points and missing parts (due to lack of texture) could be present in the results, requiring a post-processing check of the data. On the other hand, if the measurements are performed in manual (mono- or stereoscopically) or semi-automatic mode, there is a higher reliability of the measures but a smaller number of points that describe the object. Moreover, in case of manual stereo-measurements, it is very important for the operator to understand the functional behavior of the following 3D modeling software to perform correct measurements. In fact, as the number of measurements is smaller compared to
28
Section 3.2. Terrestrial image-based 3D modeling
automated procedures, the points should identify and describe the salient features of the object. In this context, an on-line modeler able to project onto the stereo-model the generated mesh to control the agreement between measurements and structure of the generated object surface would be very useful. After the image measurements, surface modeling and 3D model visualization can be performed, as described in the next sections.
3.2.3 From 3D point clouds to surfaces For some modeling applications, like building reconstruction, where the object is mainly described with planar patches, few points are required and the structuring and surface generation is often achieved with few triangular patches or fitting particular surfaces to the data (Section 3.4.2). For other applications, like statues, human body or complex objects and in case of denser point clouds, the surface generation from the measured points is much more difficult and requires smart algorithms to triangulate all the measured points, in particular in case of uneven and sparse point clouds. The goal of surface reconstruction can be stated as follows: given a set of sample points Pi assumed to lie on or near an unknown surface S, create a surface model S' approximating S. A surface reconstruction procedure (also called surface triangulation) cannot exactly guarantee the recovery of S, since we have information about S only through a finite set of sample points Pi. Sometimes additional information of the surface (e.g. breaklines) can be available and generally, as the sampling density increases, the output result S' is more likely topologically correct and converges to the original surface S. A good sample should be dense in detailed area and sparse in featureless parts. But usually the measured points are unorganized and often noisy; moreover the surface can be arbitrary, with unknown topological type and with sharp features. Therefore the reconstruction method must infer the correct geometry, topology and features just from a finite set of sample points. Usually if the input data does not satisfy certain properties required by the triangulation algorithm (like good point distribution and density, little noise, etc.), the program will produce incorrect or maybe impossible results. It is very complicated to classify all the surface generation methods. The universe of algorithms is quite large but in the following they are reported according to some categories, like ’used approach’, ’type of data’ or ’surface representation’. Some algorithms could belong to different groups, thus they are listed only once. A first and very general classification is done according to the quality (type) of the input data: • Unorganized point clouds. Algorithms working on unorganized data have no other information on the input data except their spatial position. They do not use any assumption on the object geometry and therefore, before generating a polygonal surface, they usually structure the points according to their coherence. They need a good distribution of the input data and if the points are not uniformly distributed they easily fail. • Structured point clouds. Algorithms based on structured data can take into account additional information of the points (e.g. breaklines, coplanarity. etc.). A further distinction can be done according to the point spatial subdivision: • Surface oriented algorithms do not distinguish between open and closed surfaces. Most of the available algorithms belong to this group [Hoppe et al., 1992; Mencl, 2001]. • Volume oriented approaches work in particular with closed surfaces and generally are based on the Delaunay tetrahedrization of the given set of sample points [Boissonnat, 1984; Curles and Levoy, 1996; Isselhard, 1997]. Another classification is based on the type of representation of the surface: • Parametric representation. These methods represent the surface as a number of parametric sur-
29
Chapter 3. 3D MODELING FROM IMAGES
face patches, described by parametric equations. Multiple patches may then be pieced together to form a continuous surface. Examples of parametric representations include B-splines, Bezier curves and Coons patches [Terzopoulos, 1988]. • Implicit representation. These methods try to find a smooth function that passes through all positions where the implicit function evaluates to some specified value (usually zero) [Gotsman and Keren, 1998]. • Simplicial representation. In this representation the surface is a collection of simple entities including points, edges and triangles. This group includes Alpha shapes [Edelsbrunner and Mucke, 1994] and the Crusts algorithm [Amenta et al., 1998]. • Approximated surfaces. They do not always contain all the original points, but points as near as possible to them. They can use a distance function (shortest distance of a point in space from the generated surface) to estimate the correct mesh [Hoppe et al., 1992]. In this group we can also insert the warping-based surface reconstruction (they deform an initial surface so that it gives a good approximation of the given set of points) [Muraki, 1991] and the implicit surface fitting algorithms (they fit e.g. piece-wise polynomial functions to the given set of points) [Moore and Warren, 1990]. • Interpolated surfaces. These algorithms are used when precise models are requested: all the input data are used and a correct connection of them is necessary [Dey and Giesen, 2001]. Finally, the reconstruction methods can be divided according to their assumptions: • Algorithms assuming fixed topological type. They usually assume that the topological type of the surface is known a priori (e.g. plane, cylinder or sphere) [Brinkley, 1985; Hastie and Stuetzle, 1989] • Algorithms exploiting structure or orientation information. Many surface reconstruction algorithms exploit the structure of the data for the surface reconstruction. For example, in case of multiple scans, they can use the adjacency relationship of the data within each range image [Merrian, 1992]. Other reconstruction methods instead use knowledge of the orientation of the surface that is supplied with the data. For example, if the points are obtained from volumetric data, the gradient of these data can provide orientation information useful for the reconstruction [Miller et al., 1991]. The conversion of the measured data into a consistent polygonal surface is generally based on four steps: 1. Pre-processing. In this phase erroneous data is eliminated, points are sampled to reduce the computation time (in case of range data) and gaps in the measured point cloud are closed; 2. Determination of the global topology of the object's surface, deriving the neighborhood relations between adjacent parts of the surface. This operation typically needs some global sorting step and the consideration of possible 'constraints' (e.g. breaklines), mainly to preserve special features (e.g. edges); 3. Generation of the polygonal surface (Section 3.2.3.1). Triangular (or tetrahedral) meshes are created satisfying certain quality requirements, e.g. limit on the meshes element size, no intersection of breaklines, etc.; 4. Post-processing. After the surface generation, editing operations (edge corrections, triangles insertion, polygons editing, holes filling) are commonly applied to refine and correct the generated polygonal surface. ‘Reverse engineering software' [e.g. CycloneTM, GeomagicTM, PolyworksTM, RapidFormTM] are commercial packages that perform all the previously described operations. Polygons are usually the ideal way to accurately represent the results of 3D measurements, providing an optimal surface description. Therefore, with the improvement of 3D measurement techniques, tools producing polygonal surfaces from point clouds are becoming more and more necessary for realistic
30
Section 3.2. Terrestrial image-based 3D modeling
representations of organized or unorganized 3D data. Unfortunately most of this software produce realistic and correct results only if dense point clouds are used, while the mesh generation from uneven and sparse point clouds is still problematic. 3.2.3.1 Triangulation or mesh generation It is the core part of almost all reconstruction programs. See [Edelsbrunner, 2001] for a good introduction to the topic. A triangulation converts a given set of points into a consistent polygonal model (mesh). This operation partitions the input data into simplices and usually generates vertices, edges and faces (representing the analyzed surface) that meet only at shared edges. Finite element methods are used to discretize the measured domain by dividing it into many small 'elements', typically triangles or quadrilaterals in two dimensions and tetrahedra in three dimensions. An optimal triangulation is defined measuring angles, edge lengths, height or area of the elements while the error of the finite element approximations is usually related to the minimum angle of the elements. The vertices of the triangulation can be exactly the input points or extra points, called Steiner points, which are inserted to create a more optimal mesh [Bern and Eppstein, 1992]. Triangulation can be performed in 2D or in 3D, according to the geometry of the input data. • 2D Triangulation. The input domain is a polygonal region of the plane and, as result, triangles that intersect only at shared edges and vertices are generated. A well known construction method is the Delaunay Triangulation (DT) that simultaneously optimizes several quality measures, like the edge lengths or the area of the elements. The Delaunay criterion ensures that no vertex lies within the interior of any of the circumcircles of the triangles in the network. DT of a given set of points is the dual of the Voronoi diagram (also called the Thiessen or Dirichlet tessellation). In the Voronoi diagram, each region consists of the part of the plane nearest to that node: connecting the nodes of the Voronoi cells that have common boundaries forms the Delaunay triangles. • 2.5D Triangulation. The input data is a set of points P in a plane along with a real and unique elevation function f(x,y) at each point (x,y) ∈ P . A 2.5D triangulation creates a linear function F interpolating P and defined on the region bounded by the convex hull of P. For each point p in P, F(p) is the weighted average of the elevation of the vertices of the triangle that contains p. According to the data structure, regularly or almost randomly distributed, the generated surface is called elevation grid or TIN (Triangulated Irregular Network) model. • Surfaces for 3D models. The input data is always a set of points P in R3, but no more restricted on a plane; therefore the elevation function f(x,y) is no more unique. This kind of point cloud is the most complex input data for a correct mesh generation. • 3D Triangulation. The triangulation in 3D is called tetrahedralization or tetrahedrization. A tetrahedralization is a partition of the input domain into a collection of tetrahedra that meet only at shared faces (vertices, edges or triangles). Tetrahedralization results are much more complicated than a 2D triangulation. The types of input domains could be simple polyhedron (sphere), non-simple polyhedron (torus) or generic point clouds.
3.2.4 Texturing and visualization In many applications like particle tracking, fog, clouds or water visualization and with large amount of points, the data can be visualized by just drawing all the samples. However, for some objects (and not very dense point clouds) this technique does not give good results and does not provide realistic visualization. Moreover the visualization of a 3D model is often the only product of interest for the external world and remains the only possible contact with the model. Therefore a realistic and accurate visualization is often required.
31
Chapter 3. 3D MODELING FROM IMAGES
Generally, after the creation of a polygonal mesh, the results are visualized, according to the used package and the requirements, in wireframe, shaded or textured mode. In case of digital terrain model (DTM) other common methods of representation are the contour maps, the color shaded models (hypsometric shading) or the slope maps. In the photogrammetric community, the first attempts in the visualization of 3D models were done at the beginning of the '90. Small objects (e.g. architectural models, cars, human faces) were displayed in wireframe format, or using CAD packages, while terrain models were visualized in perspective wireframe models with draping of orthophotos or orthophotomaps. Nowadays, with the increasing of the computer memories, textures are always added to obtain photorealistic 3D models. In fact, the creation of realistic 3D models (shaded or textured) helps to visualize the final result much better than a simple wireframe representation. With a wireframe, as for 3D models no hidden surface removal is generally performed, it is not always easy to distinguish e.g. from which viewpoint we are looking at the model. Instead shading and rendering can greatly enhance the realism of the model. To decide which type of 3D representation should be used, we have to consider different factors, like time, hardware and needs. If the time is limited or the hardware cannot support big files, simple shaded models might be sufficient. On the other hand, presentations or virtual flights do require textured models. A good and complete visualization package should provide the possibility to import, display and export different 3D formats as well as image-texture data. A detailed review of tools and techniques for the visualization of photogrammetric data is presented in [Patias, 2001]. With the texture mapping technique, gray-scale or color images are mapped onto the 3D geometric surface in order to achieve photo-realistic virtual models. Knowing the parameters of interior and exterior orientation of the images, to each triangular face of the 3D surface the corresponding image coordinates are calculated. Then the gray-scale or color RGB values within the projected triangle are attached to the face. Usually texture mapping is performed using a frontal image for a related part of the object. Unfortunately in close-range applications this is often not satisfactory, due to varying light conditions during image acquisition and not enough image information for fully or partially occluded object parts. To overcome these problems, different pre-processing techniques and methods of texture mapping were developed [Havaldar et al., 1996; Debevec, 1998; Pulli et al., 1998; Visnovcova et al., 2001; Rocchini et al., 2002; Beauchesne and Roy, 2003; Remondino and Niederöst, 2004] based on weighted functions related to the camera's viewing angle or combinations of optimal image patches for each triangle of the 3D model or computation of a 'ratio lighting' of the textures and deriving a common light from them or performing pixel-wise ray-tracing based on 3D model and camera parameters. There are different factors affecting the photo-realism of a textured 3D virtual model: • Image radiometric distortion. This effect comes from the use of different images acquired in different positions or with different cameras or under different light conditions. Therefore in the 3D textured model discontinuities and artifacts are present along the edges of adjacent triangles textured with different images. To avoid this, blending methods based on weighted functions can be used [Niem and Broszio, 1995; Debevec et al., 1996; Kim and Pollefeys, 2004]. • Scene geometric distortion. This kind of error is generated from an incorrect camera calibration and orientation, an imprecise image registration or errors in the mesh generation. All these sources do not preserve detailed contents like straight edges or big discontinuity changes of the surface. Accurate photogrammetric bundle adjustment, precise image registration and polygons refinement must be employed to reduce or minimize these geometric errors. Weinhaus and Devich, 1999 gave a detailed account of the geometric corrections that must be applied to remove distortions resulting from the transformation of the texture from the image plane to the triangle plane.
32
Section 3.2. Terrestrial image-based 3D modeling
• Image dynamic range. Digital images often contain a low dynamic range. Therefore bright areas are generally saturated while dark parts contain low signal to noise (S/N) ratio. To overcome these problems, a radiometric adjustment should be performed (using common image processing tools) or high dynamic range images can be generated [Debevec and Malik, 1997]. • Object occlusions. Static or moving objects, like pedestrians, cars, monuments or trees, imaged in front of the objects to be modeled are obviously undesirable and generally cause lack of quality in the texturing or unrealistic results. They should be as far as possible removed in the pre-processing step [Böhm, 2004; Ortin and Remondino, 2005]. A common problem in 3D model visualization is the presence of aliasing effects, in particular during animations and when vector layers are overlapped onto the 3D geometry. Some commercial packages have no anti-aliasing control for geometry and texture while more powerful animation software (e.g. 3DMaxTM, MayaTM) has a fully controlled anti-aliasing capability for the rendering. Recently, due to large geometry and texture information in the 3D models, new methods for realtime visualization, animation and transmission of the data have been developed. The main requirements were to speed up the transmission of big geometric models, to improve the rendering and visualization performances and reduce the cost of storage and memory without losing important information. Usually two types of information are encoded in the created meshes: (1) the geometrical information (i.e. the position of the vertices in the space and the surface normals) and (2) the topological information (i.e. the mesh connectivity and the relations between the faces). Considering these two informations and the needs listed before, many algorithms have been proposed, mainly for interactive visualization of triangular meshes, based on: • Compression of the geometry of the data. They try to improve the storage of the numerical information of the meshes (positions of the vertices, normals, colors, etc.) or they look for an efficient encoding of the mesh topology [Deering, 1995; Taubin and Rossignac, 1998; De Floriani et al., 1998]. • Control of the Level of Detail (LOD). It is done to visualize only what is visible at a certain instant. The LOD varies smoothly throughout the scene and the rendering depends on the current position of the model (hierarchical LOD). A control on the LOD allows view-dependent refinement of the meshes so that details that are not visible (occluded primitives or back faces) are not shown [Hoppe, 1998; Kumar et al., 1996; Duchaineau et al., 1997]. [Heok and Damen, 2004] review automatic model simplification and run-time LOD techniques, LOD simplification models and error evaluation. The LOD control can also be performed on the texture using image pyramids (also called MIP-mapping) or ‘impostors’ representation [Karner et al., 2001; Wimmer et al., 2001]. An effective performance enhancement method for both geometry and texture is called ‘occlusion culling’, which skips objects that are occluded by other objects or surfaces [e.g. Zhang, 1998]. One inconvenient aspect of LOD techniques is the ‘popping’ effect that occurs during the changes of resolution levels. ‘Geomorphing’ techniques (i.e. a smooth visual transition between two geometric meshes) have been introduced to reduce or hide transitional artefacts and improve the visual quality while rendering with view-dependent approaches [Hoppe, 1997; Hoppe, 1998; Lindstrom and Pascucci, 2002; Borgeat et al., 2003] • Mesh optimization, filtering and decimation. They simplify the meshes hat exceed the size of main memory removing vertices, edges and triangles. The methods can iteratively remove vertices that do not pass certain distance/angle criterion or collapse edges into a unique vertex [Hoppe, 1997]. Other approaches are based on vertex clustering [Rossignac and Borrel, 1993], wiener filtering [Alexa, 2002] and wavelets [Gross et al. 1996]. • Point-based rendering. It works by displaying a smaller number of primitives and allow for simple and efficient view-dependent computations, compact representation of the model, with high rendering rate [Rusinkiewicz and Levoy, 2000; Dachsbacher et al., 2003]. They generally
33
Chapter 3. 3D MODELING FROM IMAGES
produce more artefacts than triangle-based visualization methods, but recently [Zwicker et al., 2004] showed that high quality rendering can be obtained at the cost of complex filtering techniques. • Exploiting of GPUs capabilities. These methods take advantages of the recent and rapid expansion of graphical process units reducing the load of the CPU [Levenberg, 2002; Borgeat et al., 2003; Cignoni et al., 2004]. • Out-of-core management. These approaches try to handle data that exceed the size of the main memory [Cignoni and Scopigno, 2001; Isenburg et al., 2003]. A big difficulty at the moment is the translation and interchange of 3D data between modeling and visualization packages. Each software has always its own (binary) format. Even if they allow exporting files in other formats, the generated 3D file often cannot be correctly visualized in other packages. Often the only workable export format from a CAD package is the DXF, which has no texture, requires large storage and often produces considerable errors. Some commercial converters of 3D graphics file formats are available, but a standardization of the many 3D formats should be done to facilitate the exchanges of the models. The VRML format was the first attempt to create a standardization in the 3D format, but the results were not satisfactory. In fact, it happens quite often that different commercial packages cannot visualize the same VRML file in the same mode.
3.3 3D modeling from a single image The main requisite for 3D modeling and measurements from images is that homologous points are visible in multiple images. This is often not possible, e.g. when complex objects are observed, as there might be occluded regions or poor texture for feature extraction or in case of architectures and monuments, where restrictions limit the positions from which the images can be taken, or in case of moving characters imaged with a single camera. Therefore approaches to extract 3D information from single images are often necessary. For man-made objects (e.g. buildings), planes, right angles and parallel lines are generally contained in the image. Using these cues, geometric constraints on the object (perpendicularity or orthogonality) as well as image invariants, the ill-posed problem can be solved to generate precise 3D models [Van den Heuvel, 1998a; Liebowitz et al., 1999; El-Hakim, 2000]. In case of free form curved surfaces (e.g. persons or landscapes), the previous assumptions are no more valid. Given a set of user-specified constraints on the known local shape of the scene, a smooth 3D surface can be generated [Zhang et al., 2002; Remondino and Roditakis, 2003]. For human bodies, the relationship between the 3D object coordinates and the 2D image measurements can be expressed with a scaled orthographic projection and accurate 3D models can be recovered (Section 5.4).
Figure 3.5. Results of human and scene reconstruction from single uncalibrated images.
34
Section 3.4. Examples
3.4 Examples 3.4.1 3D Modeling of the Great Buddha of Bamiyan, Afghanistan The modeling of the cultural heritage area of Bamiyan, Afghanistan, is a complete example showing the capabilities and achievements of photogrammetric image-based modeling. The project is a combination of large site landscape modeling with highly detailed computer reconstruction of terrestrial objects (the Buddha statues) [Grün et al., 2004a, 2004b]. The Buddha statues, demolished in 2001 by the Taleban militia, could be virtually reconstructed only by using old images. The statue of the Great Buddha (53 m high) was firstly modeled applying automated measurements techniques (based on least squares matching) on different sets of images. In particular, a set of three metric images (Figure 3.6) acquired in Bamiyan in 1970 by Prof. Kostka, Technical University of Graz [Kostka, 1974], formed the basis for a very precise, reliable and detailed reconstruction of the statue.
Figure 3.6. The three metric images [Kostka, 1974], scanned at 10 micron resolution, used for the computer reconstruction of the Great Buddha of Bamiyan. On the right, a closer view on the small details of the statue.
Different automated matching algorithms were tested on the different sets of available images, as reported in [Grün et al., 2004a]. The recovered textured 3D models were all satisfactory for visualization purposes, but none of the procedures could correctly model the small details of the dress. As shown in Figure 3.7, the statue as well as the rock around it are well reconstructed, but due to the smoothness constraints of the grid-point based matching (performed with VirtuoZo), the small folds on the body of the Buddha were filtered or skipped and they are not visible in the 3D model. Therefore, for the generation of a complete and detailed 3D model, manual photogrammetric measurements were indispensable. They were performed along horizontal profiles at 20 cm interval, while the main edges were measured as breaklines (Figure 3.8). The final accuracy is around 1-2 cm in relative position, with an object resolution of about 5 cm.
Figure 3.7. Image-based reconstruction of the Great Buddha statue of Bamiyan with fully automated measurements. Even though the textured 3D model looks nice, the small details on the dress of the statue are not correctly reconstructed and modeled.
The final 3D model of the Great Buddha (Figure 3.9) was used for the special effects in the movie production (Section 3.4.1.1) and for the generation of different physical models of the statue. In particular, a 1:25 scale model of the Great Buddha statue was generated for the Swiss 35
Chapter 3. 3D MODELING FROM IMAGES
pavilion of the 2005 EXPO in Aichi, Japan.
Figure 3.8. Results of the 3D modeling of the Great Buddha with manual measurements. The measured point cloud (ca 18 700 points), the reconstructed 3D structures (in wireframe) and the original structures.
Figure 3.9. The 3D model of the Great Buddha visualized in textured, shaded and wireframe mode. In the lower left image is possible to distinguish the reconstructed mapped frescos of the east side of the niche [Remondino and Niederöst, 2004].
36
Section 3.4. Examples
A
B
C
D
E Figure 3.10. The 3D model of the Great Buddha of Bamiyan used for virtual reality applications. A frame from the original video, the Buddha model registered with the frame and the result after texture enhancement (A and B). A closer view to the upper part of the empty niche, as it looks now and with the registered virtual model of the Buddha (C). Two views of the virtual figure superimposed into the actual empty niche (D and E).
37
Chapter 3. 3D MODELING FROM IMAGES
3.4.1.1 Fusing real with virtual A potential application of recovered 3D digital models is their combination with other type of digital models or their integration in real environments for virtual reality applications. The main problems of this application are the correct registration between the computer model and the real scene, the handling of occlusions and the modeling of the real environment’s illumination to correctly render the virtual model. Giving a video sequence, in order to import a virtual object, the camera parameters must be recovered. This is usually performed tracking feature points all over the sequence and afterwards recovering the camera and object 3D information. With this information, the position and motion of a virtual camera imaging the virtual object can be accurately generated and the two image sequences combined. Hence the virtual object can be seamlessly inserted into the real sequence and rendered for special effects. The recovered 3D model of the Great Buddha statue was inserted in a video sequence of the empty niche (filmed in August 2003) to virtually restore the statue in its position before the destruction. The results (Figure 3.10) can be seen in the movie ‘The Giant Buddhas’ [http:// www.giant-buddhas.com].
3.4.2 Interactive 3D modeling of architectures As previously mentioned, semi-automatic approaches, designed to take advantage of properties common to man-made objects, such as architectures, are so far the most effective in creating realistic and accurate 3D models of complex objects. In Figure 3.11 an example of image-based modeling of a church near Padua, Italy, is presented. The image orientation phase could be achieved mainly automatically, applying the process described in Section 4.2.2. On the other hand, for the geometric reconstruction and texturing of the computer model, an interactive procedure was necessary and performed with PhotoModeler software [PhotoModelerTM]. Points and lines were manually measured to identify the planar surfaces (facades) of the church and a successive interactive segmentation allowed to recover the complete geometric model and texture it.
Figure 3.11. 3D models of an architectural object. After the orientation phase (left), interactive procedures allowed the generation of highly precise and realistic virtual models (right) [Guarnieri et al., 2004].
38
Section 3.5. Final considerations
3.5 Final considerations Compared to other actual modeling systems, the main advantage of image-based modeling is that the sensors are generally inexpensive and highly portable and that 3D information can also be recovered in case of occlusions (using geometric constraints or image invariants). Furthermore, image data can always be found, e.g. on the Internet (see Section 6.5.1) and used to model objects when other modeling systems cannot be employed. This is of great advantage, for example for the modeling of lost cultural heritage objects. Photogrammetry has all the potentiality to derive all the object fine details from images. However, incomplete or not detailed 3D models may results, due to low resolution images, lack of texture or smoothing automated measurement techniques. The described image-based modeling pipeline consists of different steps which are not yet all fully automated. According to the application requirements, a 3D model can be generated based on interactive or automated approaches. Some automated surface reconstruction methods, even if able to recover the complete 3D geometry of an object, reported errors between 3% and 5% [Pollefeys et al., 1999], limiting their use for applications requiring only nice-looking 3D models. Therefore the efforts to increase the level of automation in the data processing chain are nowadays essential in order to widen the use of the available technology. But, although the efforts are continuing, semi-automatic approaches, designed specifically to take advantage of properties and arrangements common to man-made objects, such as architectures, are still the most effective. In those approaches, parts of the process that can straightforwardly be performed by humans, such as registration, extracting seed points, topological surface segmentation and texture mapping, remain interactive while those best performed by the computer, such as feature extraction, point correspondence, image registration and modeling of segmented regions should be automated. When the network conditions allow, the steps of initial point extraction and image registration can be fully automated (Section 4.2), although this still requires closely-spaced images. So far, to achieve immediate and geometric accurate 3D results, parts of the process still necessitate human interaction. For complex and free-form objects, advanced matching algorithms (see for example Zhang, 2005), created to produce detailed and precise surface models from aerial and satellite imagery, should be also developed for close-range images. Feature-based and area-based matching strategies can be combined to fully exploit the potentialities of the image-based approach and extract detailed 3D surfaces. The existing problems of converting a measured point cloud into a realistic 3D polygonal model that can satisfy high modeling and visualization demands have not been completely solved too. Furthermore, all the existing software for the modeling and visualization of 3D objects are specific for certain data sets. Commercial 'reverse engineering' packages do not produce correct meshes without dense point clouds. Therefore, much more time is often spent in mesh generation and editing than in doing measurements. Moreover, visualization tools can do nothing to improve a badly modeled scene and the rendering can produce worse results if anti-aliasing or level of detail control are not available.
39
Chapter 3. 3D MODELING FROM IMAGES
40
4 CALIBRATION AND ORIENTATION OF IMAGE SEQUENCES
All applications that deal with the extraction of precise 3D information from imagery require accurate calibration and orientation procedures as prerequisites for reliable results. The early theories and formulations of orientation procedures were developed in the beginning of the 20th century and today a great number of techniques and algorithms are available. The terms calibration and orientation were introduced and defined in the photogrammetric community long time ago; but nowadays, in the vision community, different meanings are sometimes associated and used. Therefore, for clarification, the photogrammetric definitions are reported here. Calibration is the determination of the interior orientation parameters of a camera (or image); these are the coordinates of the principal point and the camera constant. Often the parameters to model the errors due to the lens distortion are also included. System calibration is the procedure for the determination of the interior orientation parameters and (possibly) all systematic errors of a camera (image). Orientation is usually divided in interior and exterior orientation. The exterior orientation consists of three parameters describing the position (in object space) of the camera perspective center and three rotation angles describing the direction of the optical axis. The orientation of a camera can be performed for a single image (spatial resection), for a stereo pair or multiple images (stereo or multi-frame spatial intersection or bundle adjustment). Self-calibration is the simultaneous determination of all the system parameters as well as the systematic errors (defined as the physical deviations from the used mathematical camera model, e.g. the perspective projection described with the collinearity condition) using the concept of additional parameters estimation and a bundle adjustment method. The camera calibration can be performed using known control points (and very few images) or without known 3D information, in free network mode. The latter case requires a good network geometry, with at least 2-3 rotated images, to minimize the correlation between some of the self-
41
Chapter 4. CALIBRATION AND ORIENTATION OF IMAGE SEQUENCES
calibration parameters. Generally is not always possible to apply a self-calibrating bundle-adjustment as the image network might be not appropriate for it (in particular during 3D modeling projects). Therefore, if possible, rather than simultaneously calibrate and orient a set of images, it is better first to calibrate the camera using the most appropriate network and afterwards recover the object geometry using the calibration parameters. Moreover, if existing image data are analyzed, problems arise due to (1) low image quality (e.g. interlaced video), (2) no information concerning the camera, (3) very short or absent baseline and (4) possible variations of the internal parameters. A good calibration and orientation strategy should cope with all these possible problems and it should be reliably carried out providing a statistical analysis of the unknown parameters.
4.1 Orientation approaches In photogrammetric terms, departures from collinearity can be modeled such that the basic equations of perspective projection can be applied for the calibration and orientation process. The nature of the application and the required accuracy can dictate which of two basic underlying functional models should be adopted: - Perspective camera model. Camera models based on perspective collineation have high stability, require a minimum of three corresponding points per image and a stable optics; they can easily include non-linear lens distortion function; they contain non-linear relations, requiring initial approximations of the unknowns. - Projective camera model. These approaches can handle variable focal lengths but need more parameters, a minimum of six correspondences and are quite instable (equations need normalization); they often contain linear relationships but cannot easily deal with non-linear lens distortion. In [Wrobel, 2001] a good review of many orientation approaches is presented (Table 4.1). Table 4.1.Comparison between the two orientation approaches. Geometry
Projective
Perspective
Camera model
pi’ = A . Pi
pi’ = λ . R . Pi + t
(3x1) (3x4) (4x1)
(3x1)
(3x3)(3x1) (3x1)
Parameters
11 independent in A (usually a3,4 = 1)
• 6 for the exterior orientation • 3 for the interior orientation • other for possible correction functions
Relationship
Linear
Non-linear
low stability equations need normalization at least 6 correspondences/image coplanar correspondences lead to critical configuration • variable optics accepted
• high stability • at least 3 correspondences/image • coplanar correspondences lead to stable configuration • stable optics required
Model
• • • •
The choice of the camera model is often related to the final application and the required accuracy. Photogrammetry deals with precise measurements from images and accurate sensor calibration is one of its major goals. Both camera models have been discussed and used in close-range photogrammetry but generally a sensor orientation and calibration is performed with a perspective
42
Section 4.2. Automated tie point extraction
geometrical model by means of a least squares bundle adjustment (Section 4.3). The bundle method requires image correspondences (Section 4.2), which can be extracted manually or fully automatically. Furthermore, because of its non-linearity, iterations must be performed and good approximations for the unknown camera parameters (Sections 4.4.1 and 4.4.2) are required.
4.2 Automated tie point extraction Tie points (or image correspondences) between the images are required to recover the scene’s geometry and camera motion. Tie points can be measured manually (mono or stereo-vision), semi-automatically or fully automatically using matching techniques like cross-correlation or least squares matching [Grün, 1985a]. The automated extraction of tie points between images is a very important step within the modeling pipeline (Section 3.3). Nowadays, automated markerless sensor orientation can be performed by the computer and it is still receiving great interest in close-range photogrammetry and computer vision, while systems able to automatically calibrate and orient a set of images using coded target are already available (e.g. iWitnessTM). Automated tie point extraction is useful not only to speed up the image orientation phase, but also for autonomous navigation or augmented reality applications. In case of image orientation, the correspondences are used in a photogrammetric bundle adjustment to simultaneously retrieve the 3D structure of the imaged scene and the camera parameters; in case of good image network, self-calibration could also be performed. In the literature there is a great amount of work on automated tie point extraction from images [Tomasi and Kanade, 1991; Beardsley et al., 1996; Van Gool and Zisserman, 1996; Fitzgibbon and Zisserman, 1998; Pollefeys et al., 1999; Roth and Whitehead, 2000; Nister, 2001]. Most of these feature-based systems rely on very short baselines between consecutive frames and work only based on cross-correlation matching procedures.
Figure 4.1. Two examples of ‘short range motion’ and ‘long range motion’ image sequences. Frame 1, 10, 20 and 30 of a video sequence of 200 frames digitized from the television (first row). Four shots of a cultural heritage object acquired with a still-video digital camera (second row).
In the next sections, three workflows developed to automatically extract corresponding natural features between consecutive images are presented. The images can be self-acquired with a still
43
Chapter 4. CALIBRATION AND ORIENTATION OF IMAGE SEQUENCES
video or a videocamera as well as digitized from analogue tapes while no hard restrictions on the camera motion is assumed. The algorithms are developed for ‘short range motion’ (Section 4.2.1), for ‘long range motion’ (Section 4.2.2) and for ‘wide baseline’ images (Section 4.2.3). ‘Short range motion’ sequences have a very short baseline between the images and are typically acquired with a videocamera. ‘Long range motion’ sequences contain a significant baseline compared to the distance between camera and scene. Wide baseline images can be defined as images with an intersection angle of homologous rays larger than 20-25 degrees.
4.2.1 Correspondences in ‘short range motion’ Sequences with a 'short range motion' between consecutive frames present a very small parallax (often in one unique direction) which can be exploited during the search of the correspondences. Usually these images are acquired with a videocamera and all the frames are analyzed. Due to the small camera displacement, given the location of a feature in the reference image, the position of the same feature in the consecutive frame is found with a tracking process, as long as the feature is visible and matchable. When the frame-to-frame displacement is larger than a few pixels, the tracking process must be replaced with a more robust stereo matching (Section 4.2.2). Optical flow techniques and feature tracker methods are widely used in the vision community if sufficiently high time frequency sequences are used. One of the most known feature tracker is the Shi-Tomasi-Kanade [Shi and Tomasi, 1994], based on the results of [Lucas and Kanade, 1981] and [Tomasi and Kanade, 1991]. More recent works were presented in [Nister, 2001; Nister, 2004; Pollefeys et al., 2004]. A feature tracker has been implemented, based on interest points and Least Squares Matching (LSM) (Section 4.2.1.1). The algorithm tracks interest points through the images according to the following steps: - Extraction of interest points from the first image. Different operators like [Förstner and Gülch, 1987], [Harris and Stephens, 1988], [Heitger et al., 1992] or [Smith and Brady, 1997] can be employed. - Prediction of the position in the next frame (Figure 4.2, left). Due to the very short baseline, the images are strongly related to each other and the image position of two corresponding features is very similar. Therefore, for the frame at time t+1, the predicted position of a point is the same as time t. - Research of the position with cross-correlation. Around the predicted position a search box is defined and scanned for searching the position which has the higher cross-correlation value. This position is considered an approximation of the correct point to be matched and tracked. - Establishment of the precise correspondence’s position. The approximation found with crosscorrelation is refined using LSM algorithm, which provides precise and sub-pixel location of the feature. - Replacement of the lost features with new interest points. New interest points are extracted in the areas where the matching process has failed or if a feature is no more visible in the image. At the end of the tracking process (Figure 4.2, right), the correspondences which are visible in at least 2 frames are used for the successive bundle adjustment to recover the camera parameters. Some commercial software is available to automatically solve the feature tracking problem [e.g. 3D EqualizerTM, MatchMoverTM, BoujouTM]. They work only on images acquired with a videocamera and they can reliably extract the image correspondences if there are no rapid change of the camera position. They are mainly used in the film industry (movies, advertisements) and industrial design. Once the features are extracted, the camera poses are recovered and a virtual object can be seamless inserted into the sequence and rendered for special effects (Section 3.4.1.1).
44
Section 4.2. Automated tie point extraction
search area
image t
image t+1
Figure 4.2. The cross-correlation and LSM process to track points through an image sequence with very short baseline. Around the predicted position in the next image, a search area is scanned to find the best position where LSM is applied. On the right the result of the tracking process of 10 consecutive frames.
4.2.1.1 Least Squares Matching (LSM) In photogrammetry, ‘matching’ is mainly meant has the establishment of image correspondences, but it can also be applied to maps or object models. Image matching can be performed on different primitives: windows of pixel values (area-based matching) or features extracted in the images (feature-based matching). Moreover constraints on the primitives are usually also employed, like the epipolar constraint (homologous points must lie on the respective epipolar lines) or the surface continuity constraint. In the photogrammetric community, matching algorithms have been presented in the early 80’s [Förstner, 1982; Ackermann, 1983; Grün, 1985a]. The most used method was presented in [Grün, 1985a], based on the minimization of the squared differences of the grey values between two (or more) image patches. Given two image points, the least squares matching considers the two image regions as discrete two-dimensional functions, f(x,y) and g(x,y). f(x,y) is named template, g(x,y) is the patch in the other image. The matching process establishes a correspondence if f ( x, y ) = g ( x, y )
(4.1)
Because of random effects (noise) in both images, the previous equation is not consistent. Therefore, a noise vector e(x,y) is added, resulting in f ( x, y ) – e ( x, y ) = g ( x, y )
(4.2)
The location of the function values g(x,y) must be determined in order to provide for the correct matched point. This is achieved by minimizing a goal function, which measures the distances between the gray levels in the template and in the patch. The goal function to be minimized is usually a L2-norm of the residuals of least squares estimation. The new location g(x’,y’) is generally described by shift parameters which are estimated with respect to the initial position of g(x,y) by means of an affine transformation: x' = a 0 + a 1 x + a 2 y y' = b 0 + b 1 x + b 2 y
(4.3)
In order to account for a variety of systematic image deformations and to obtain a better match, two parameters for image shaping (affine image shaping) and radiometric correction are usually also introduced beside the shift parameters (adaptive least squares matching). The function g(x,y) is linearized and the system is solved with the Gauss-Markov least squares
45
Chapter 4. CALIBRATION AND ORIENTATION OF IMAGE SEQUENCES
estimation model. The variance factor of the adjustment and of the single parameters should be considered to evaluate the quality of the matching result. The residuals of the estimation can be interpreted as the differences in gray levels between the estimated patch in the new location g(x’, y’) and the template patch f(x,y). The basic matching algorithm can also be extended to become a more powerful tool usable in different applications. If more than two images have to be matched, a Multiphoto Geometrically Constrained (MPGC) matching can be applied [Grün and Baltsavias, 1988; Baltsavias, 1991], either sequentially in image pairs or in form of a simultaneous solution. The useful constraints are: collinearity, forward intersection, epipolar and bundle constraint.
Figure 4.3. The pipeline for automated tie point extraction for a successive bundle adjustment.
4.2.2 Correspondences in ‘long range motion’ Sequences with ‘long range motion’ between consecutive frames present a significant baseline compared to the distance between the camera and the scene. Different frameworks for the automated extraction of image correspondences (often related to object reconstruction) have been proposed in the literature [Beardsley et al., 1996; Van Gool and Zisserman, 1996; Fitzgibbon and Zisserman, 1998; Pollefeys et al., 1999; Roth and Whitehead, 2000], even if they are generally developed and tested on images with very short baseline. The approaches are quite similar and rely on the epipolar geometry between the images. The problem is very complex and challenging and, at the moment, no commercial software is available. We have developed and implemented an automated process to extract image correspondences for the image orientation phase. It is based on interest point detectors, matching algorithm and epipolar geometry and presents some changes and extensions to those approaches presented in the literature: (1) different detectors can be employed; (2) it includes a precise and sub-pixel matching algorithm for feature point localization; (3) it works also with images presenting a significant baseline. The pipeline is used only to find tie points for a successive photogrammetric bundle adjustment. The 3D reconstruction of the scene is performed in a successive step. 4.2.2.1 Interest points The first step is to find a set of interest points or corners in each image of the sequence. Interest points (Appendix A) are locations in the images where the signal content changes, usually in two-dimensions; they are geometrically stable under different transformations and present high information content. Many algorithms are available and in our applications different operators can be employed [Moravec, 1979; Förstner and Gülch, 1987; Harris and Stephens, 1988; Heitger et al., 1992; Smith and Brady, 1997]. In each case, the number of corners extracted is based
46
Section 4.2. Automated tie point extraction
on the image size. A good point distribution is assured by subdividing the images in small patches and keeping only the points with the highest interest value in those patches. 4.2.2.2 First matching process A pair-to-pair image matching process is performed using the extracted interest points. The process returns the best match in the second image for each interest point in the first image. At first cross-correlation is performed between image pairs and then the results are refined using LSM (Section 4.2.1.1). The point with biggest correlation coefficient is used as approximation for the matching process. The cross-correlation process uses a small window around each point in the first image and tries to correlate it against all points that are inside a search area in the adjacent image. The search area is given considering the direction of motion of the sequence and the image parallax (‘disparity’). The final number of possible matches depends on the threshold parameters of the LSM and on the disparity between image pairs; usually it is around 40% of the extracted points. The disparity threshold between the two images is one of the most complicate parameter to select. Incorrect disparity leads to very few correspondences (parallax parameter smaller than the correct one) or very long computation (bigger parameter). Often, in sequence analysis, the strength of the candidate matches is only measured with the correlation coefficient while a least squares matching method is a stronger and widely accepted technique for subpixel accuracy. Moreover it increases the reliability of the found correspondences without increasing too much the computational time of the process. 4.2.2.3 Filtering process to remove outliers Due to the unguided matching process, the found matched pairs might contain outliers. Therefore a filtering of false correspondences must be performed. A process based on disparity gradient concept is used [Klette et al., 1998]. If pLEFT and pRIGHT as well as qLEFT and qRIGHT are corresponding points in the left and right image, the disparity gradient of two points (p, q) is the vector G defined as: D(p) – D(q) G = ---------------------------------D CS ( p, q )
(4.4)
where: D(p) = (pLEFT,X - pRIGHT,X, pLEFT,Y - pRIGHT,Y) is the parallax of p, e.g. the pixel distance of p between the two images; D(q) = (qLEFT,X - qRIGHT,X, qLEFT,Y - qRIGHT,Y) is the parallax of q, e.g. the pixel distance of q between the two images; DCS is the cyclopean separator, e.g. the distance between the two midpoints p’ and q’ of the straight segments connecting a point in the left image to the corresponding in the right one.
Figure 4.4. The disparity gradient between two correspondences (P and Q) in an image pair
If p and q are close together in both images, they should have a similar parallax (e.g. a small
47
Chapter 4. CALIBRATION AND ORIENTATION OF IMAGE SEQUENCES
numerator in Equation 4.4). Therefore, the smaller the disparity gradient G is, the more the two correspondences are in agreement. The performance of the filtering is improved if the process is performed locally and not on the whole image, because the algorithm can achieve incorrect results due to the different disparity values and in presence of translation, rotation and scale changes between the images. Therefore the image is divided in patches (usually 6 or 8, according to the image size). Then for each patch, the sum GSUM of all disparity gradients G of each matched point relative to all other neighborhood matches inside the patch is computed. Those points that have a value GSUM greater than the median of the GSUM of the patch are rejected. This simple test on the local consistency of the matched points is very useful and has a very low computational time. Other possible approaches developed to remove false correspondences are described in [Zhang and Deriche, 1994] or [Pilu, 1997].
Figure 4.5. The matched points between two images: the wrong correspondences (1084 and 1057) can be removed using a disparity gradient approach locally applied.
4.2.2.4 Relative orientation between image pairs The aim is to compute a pairwise relative orientation for outliers rejection using those matches that passed the previous filtering step. Based on the coplanarity condition (Appendix B), the process computes the projective singular correlation between two images [Niini, 1994], also called epipolar transformation (because it transforms an image point from the first image to an epipolar line in the second image) or essential matrix [Longuet-Higgins, 1981] or fundamental matrix (if the interior orientation parameters of both images are unknown) [Faugeras et al., 1992]. The relative orientation can be expressed in implicit form with the fundamental matrix F. It is defined using only image correspondence by the equation: T
p 2 F 12 p 1 = 0
(4.5)
for every pair of matching points p1, p2 (homogeneous vectors) in image 1 and 2. All the orientation information are contained in F and no camera interior parameters are requested. The epipoles of the images are defined as the right and left null-space of F12 and can be computed with the singular value decomposition of F12. A point p2 in the second image lies on the epipolar line l2 defined as l 2 = F 12 p 1
(4.6)
and must satisfy the relation p2l2=0. Similarly, T
l 1 = F 12 p 2
(4.7)
represents the epipolar line in the first image corresponding to p2 in the second image. The 3x3 singular matrix F can be computed just from image points (normalized or homogeneous
48
Section 4.2. Automated tie point extraction
coordinates) and at least 7 correspondences are required (Appendix B). Many solutions have been published to compute F, but to cope with possible blunders, a robust method of estimation is required. Usually random sampling algorithms (RANSAC) and least median estimators are very powerful in presence of outliers and they are generally employed for the computation of the relative orientation between two images. 4.2.2.5 Guided matching process The computed epipolar geometry is then used to refine the matching process, which is now performed as guided matching along the epipolar lines. The geometric constraint expressed in Equation 4.5, together with a threshold distance from the epipolar line (Equation 4.6 and Equation 4.7), restricts the searching area and allows a lower threshold for the matching process. The guided matching process does not require anymore the knowledge of the parallax between the images, as the search area is defined by the epipolar geometry. As the images are not calibrated, the non-neglectable radial distortion might lead to epipolar lines which are curved and not straight. 4.2.2.6 Relative orientation between a triplet of images While the computed epipolar geometry between image pairs can be correct, not every correspondence that supports the relative orientation is necessarily valid. This because we are considering just couple of images and a pair of correspondences can support the epipolar geometry by chance (e.g. a repeated pattern aligned with the epipolar line, as shown in Figure 4.6).
Figure 4.6. Epipolar geometry between two images: case of epipolar line aligned with a repeated pattern.
These kinds of ambiguities and possible errors due to the previous matching process can be reduced considering the epipolar geometry between three consecutive images. In fact three views increase the reliability of the matching process. This idea was already used in the photogrammetric community, knowing the camera orientation parameters [Maas, 1991]. If the camera parameters are not explicitly known, it is still possible to derive the epipolar geometry between three views using only point correspondences. A linear representation for the relative orientation of three views is represented by the trifocal tensor T [Shashua and Wolf, 1994; Hartley, 1994a; Shashua, 1997]. The tensor is represented by a set of three 3x3 matrices (i.e. a tensor) {T1, T2, T3}. Each matrix Ti has rank 2 and is computed only using image correspondences without the knowledge of the camera motion or calibration. T constraints the positions of points and lines over three images. Given the corresponding locations of a feature in two images, its location in a third image can be computed by means of T. For every triplet of views (Figure 4.7), if p1, p2 and p3 are corresponding points in the three images, then the triplet of points satisfies the relation: p 2 x [ Tp 1 ] p 3
x
= 03
(4.8)
49
Chapter 4. CALIBRATION AND ORIENTATION OF IMAGE SEQUENCES
ij
ij
ij
[ Tp ] ij = T 1 x + T 2 y + T 3
(4.9)
with [Tp] a 3x3 matrix whose ij-th element is defined as: and with [p]x a skew-symmetric matrix 0 –1 y 1 0 –x –y x 0
(4.10)
of the homogeneous vector p = (x,y,1)T. If a triplet of points p1, p2 and p3 satisfy Equation 4.8, it means that the corresponding points support the tensor T123. In general, each triplet of points provides nine constraints, four of those independent. T has 27 elements, defined up to a scale factor. Therefore only 26 (not all independent) must be estimated. Given at least seven correspondences between three images, a method based on SVD may solve for the entries of T. Considering lines, given the point p1, for every line l2 through p2 in image 2 and for every line l3 through p3 in image 3, the fundamental trifocal constraint states: T
T
l 2 [ Tp 1 ]l 3 = 0 3
(4.11)
( l 2 [ T 1, T 2, T 3 ]l 3 ) [ l 1 ] x = 0
(4.12)
T
where ( lT2 [ T 1, T 2, T 3 ]l 3 )
represent the vector (lT2 T 1 l3,lT2 T 2 l3, l T2 T 3 l 3) .
Equation 4.8 can be used to verify whether image points (or lines) are correct corresponding features between different views. Moreover, using Equation 4.8 it is possible to transfer points between the images, e.g. compute the image coordinates of a point in the third view, given the corresponding image positions in the first two images and the related T tensor: ρp 3 = [ Tp 1 ] 1∗ – x 2 [ Tp 1 ] 3∗
T
T
(4.13)
T
T
(4.14)
τp 3 = [ Tp 1 ] 2∗ – y 2 [ Tp 1 ] 3∗
with [Tp]k* denoting the k-th row of the 3x3 matrix [Tp] defined in Equation 4.9 and ρ, τ ∈ R as non-zero scale factors. In case of noise-free data, the two relations are equivalent. This transfer is very useful when in one view are not found many correspondences. The point transfer can be solved also using the fundamental matrix, but the trifocal constraint is more reliable as it can avoid ambiguities and remove blunders. The transfer with the fundamental matrix is obtain as: p 3 = F 13 p 1 × F 23 p 2
(4.15)
i.e. the intersection of two epipolar lines. Equation 4.15 is valid if p1 ≠ e13 or if p 2 ≠ e23 or if the three camera projection centers are not aligned or if the point P is not coplanar with the three projection centers. From the tensor T it is possible to derive the fundamental matrices F between two views: F 12 = [ e 2 ] x [ T 1, T 2, T 3 ]l 3
(4.16)
while a similar formula holds for F13. As l2 should not lie in the null-space of any of the Ti, F12 can be computed also as: F 12 = [ e 2 ] x [ T 1, T 2, T 3 ]e 3
where ei is the epipole of image i and [ei]x is the skew-symmetric matrix formed with ei. 50
(4.17)
Section 4.2. Automated tie point extraction
F 13 = [ e 3 ] x [ T' 1, T' 2, T' 3 ]e 2
(4.18)
For F13 holds: The epipoles e2 and e3 of the second and third image can be derived with SVD as the null-vectors of the following 3x3 matrices: T
e 2 [ u 1, u 2, u 3 ] = 0 T e 3 [ v 1,
(4.19)
v 2, v 3 ] = 0
where ui and vi are the left and right null-vectors of Ti, i.e. u Ti T i = 0 and T i v Ti = 0 .
Figure 4.7. Three views geometry: 3 images with points and lines correspondences (left). Relative orientation between triplet of images (right).
The trilinear tensor model is valid for general camera motion, but it fails in case of points distributed on planar surfaces and very small baseline. Furthermore, as T (and F) exploit the epipolar geometry properties between images, it is important that the images are not acquired at the same height, otherwise the epipolar lines do not provide useful information. In the implemented framework, the trilinear tensor is computed for each overlapping image triplet, given the correspondences extracted in two consecutive image pairs. Only the correspondences supporting the computed tensor (triplets of points) are stored and used in the next step. 4.2.2.7 Tracking the found correspondences throughout the sequence When the matching process between image pairs and triplets is concluded and the epipolar constraints are found (Figure 4.8), all the points supporting overlapping tensors (T123, T234, T345,...) are considered.
Figure 4.8. The epipolar constraints between two and three images used to check and extract the correspondences between images. Here an example with 5 images is shown.
Given two adjacent tensors Tabc and Tbcd with supporting points (pa, pb, pc) and (p'b, p'c, p'd), if (pb, pc) in the first tensor Tabc is equal to (p'b, p'c) in the successive tensor Tbcd, this means that the 51
Chapter 4. CALIBRATION AND ORIENTATION OF IMAGE SEQUENCES
point in images a, b, c and d is the same and therefore this point must have the same identifier. Each point is tracked as long as possible in the sequence (minimum 3 images) and afterwards used as tie point in the bundle adjustment (Section 4.3). Points visible in less than 3 images are generally not stored but in some application might also be considered.
4.2.3 Correspondences in wide baseline images In some applications, due to acquisition constraints or occlusions, images are acquired from substantially different viewpoints. In these cases, the baseline between the images is very large (Figure 4.9) and the intersection angle between homologous rays might be larger than 25 degrees. A standard automated tie points extraction procedure, based on corner detectors would failed. In fact, under big perspective effects generated by a large camera displacement, interest points (e.g. points simply described with their image location) cannot be correctly matched. The reasons are: - the patch in the search image cannot be anymore described with an affine transformation; - the approximate value for the matching procedure must be within some thresholds. For these reasons, different researchers tried to solve the challenging problem of automatically orient widely separated views [Pritchett and Zisserman, 1998; Matas et al., 2002; Ferrari et al., 2003; Xiao and Shah, 2003] and interest point detectors have been replaced with region detectors or region descriptors (Appendix A). In fact, while corners might be occluded, regions could still be visible and matchable. Generally local features are extracted independently from the images, then they are characterized with invariant descriptors and finally matched. These descriptors (usually a vector of information) are invariant under affine transformation and illumination changes and can help in matching homologous points in widely separated views. [Baumberg, 2000] uses a multi-scale Harris corner detector to describe regions with their location and scale while orientation and skew are provided by the second moment gradient matrix; similarly [Schaffalisky and Zisserman, 2002; Mikolajczyk and Schmid, 2004] proposed a detector based on an affine normalization around Harris and Hessian points. [Matas et al., 2002] proposed a region detector (MSER) that connect pixels which have the same brightness or darkness than pixels on the regions’s contour. [Tuytelaars and Van Gool, 2004] use small regions around corners and intensity extrema. [Lowe, 2004] derived the SIFT detector to identify distinctive image features location and scale with a DoG function in scale space and their orientation with the local image gradient orientation. [Kadir et al., 2004] described an entropy-based region detector, called salient region detector, based on the PDF of intensity values over elliptical regions. These methods can be applied for two-views or multi-views matching but require a feature-based matching procedure. Unfortunately, their location is not as precise as a corner detector, as described in Appendix A. Mikolajczyk and Schmid, 2003 showed with different experiments that Lowe detector [Lowe, 2004] is the most robust local descriptor algorithm and different applications [Roth, 2004; Läbe and Förstner, 2005; Roncella et al., 2005] have also shown its potentialities. For the automated orientation of images acquired under a very wide baseline, a strategy has been developed according to the following steps: - Interest regions identification by means of Lowe detector and SIFT descriptor [Lowe, 2004]; - Matching of corresponding points (centroid of the extracted regions) using the vector of information extracted by the descriptor (pair of points with the minimal Euclidean distance between their feature vectors); - Computation, by means of robust estimators, of the epipolar geometry (described with the Fundamental Matrix) between image pairs to remove wrong matches; - Guided matching exploiting the epipolar geometry constraint; - Retrieve the epipolar geometry between image triplets by means of the trifocal tensor (if sufficient overlap is available) for further checks on extracted the correspondences.
52
Section 4.2. Automated tie point extraction
Two detailed examples are presented in Section 6.1.3 and Section 6.2, as well as in Figure 4.9 and Figure 4.10.
Figure 4.9. Retrieved epipolar geometry between two widely separated images.
53
Chapter 4. CALIBRATION AND ORIENTATION OF IMAGE SEQUENCES
Figure 4.10. Two images of the Rideau channel in Ottawa, acquired with a wide baseline (courtesy of Sabry El-Hakim, NRC Canada). Matched points with Lowe operator (above). Closer view of two regions with the automatically extracted correspondences (central and lower images).
54
Section 4.2. Automated tie point extraction
4.2.4 Considerations on the approach for automated tie point extraction The different algorithms presented in the previous sections try to solve one of the most complicate problem in close-range photogrammetry: the automated identification of image correspondences between overlapping images. In aerial photogrammetry the problem is easier, as the image geometry is more standard (nadir view) and the relative camera rotations are almost absent. In close-range applications, each acquisition has its own image geometry, depending on the imaged scene, the baseline cannot be kept always constant and the rotations around the camera axis are sometimes significant. Therefore the algorithm must be as robust as possible. The most important thing is that the images must have a good content of information, otherwise the feature-based approach (in particular the interest point detector) fails. Often some image preprocessing (e.g. Wallis filter [Wallis, 1976]) can be applied, for radiometric equalization and especially contrast enhancement. The filter enables a strong enhancement of the local contrast by removing low-frequency information in an image, retaining edge details. Furthermore, the imaged scene should be static, even if small moving objects can be tolerated, as the correspondences are checked with robust estimators. Finally the camera motion should be within certain limits, even if wide baselines or large rotation around the camera axis can be processed with slightly modified approaches. This is achieved with point or region detectors and descriptors and by means of the LSM technique for precise localization (Appendix A). If a good approximation of the parameters is given and under the assumption of planar patches, LSM can also cope with different scales (up to 30%) and significant camera rotation (up to 20 degrees) (Figure 4.11). The use of cross-correlation alone would fail in case of big rotations around the optical axis and moreover is not as precise as LMS. The use of region detectors instead of interest point detectors can lead to more correspondences, in particular in case of wide-baseline images but, as shown in Appendix A, the accuracy of the relative orientation procedure would also get worst. Therefore region detectors could be used to get a good initial approximation of the epipolar geometry which can then be refined using a guided matching of interest points. The global process for automated tie point extraction requires always a guess of the image parallaxes for the initial search of the correspondences, in particular for long range motion and wide baseline images, to limit the area of research and avoid mismatching. The approach is automated and reliable as long as images with short baselines are used. Wide baseline image-pairs require often human interaction.
Template image
Search image
Search image Template image
Search image
Search image
Figure 4.11. Matching of corresponding points (in the two circular areas) between images with different scales and camera rotation (courtesy of Visual Geometry Group, Oxford University, UK). The least squares matching results (with the resampled patch) are presented in the second line.
55
Chapter 4. CALIBRATION AND ORIENTATION OF IMAGE SEQUENCES
4.3 Bundle adjustment A versatile and accurate perspective orientation procedure is the photogrammetric bundle adjustment [Brown, 1976; Granshaw, 1980; Triggs et al., 2000]. It is a global minimization of the reprojection error, developed in the 50's and extended in the 70's to model possible sensor’s and lens systematic errors. As adjustment’s observations point-features or lines-features can be used. The mathematical basis of the bundle adjustment is the collinearity model, e.g. a point in object space, its corresponding point in the image plane and the projective center of the camera lie on a straight line. The standard form of the collinearity equations is: r 11 ( X – X 0 ) + r 21 ( Y – Y 0 ) + r 31 ( Z – Z 0 ) - = – c ⋅ f x ( x, y ) x – x 0 = – c ⋅ --------------------------------------------------------------------------------------------r 13 ( X – X 0 ) + r 23 ( Y – Y 0 ) + r 33 ( Z – Z 0 ) r 21 ( X – X 0 ) + r 22 ( Y – Y 0 ) + r 32 ( Z – Z 0 ) - = – c ⋅ f y ( x, y ) y – y 0 = – c ⋅ --------------------------------------------------------------------------------------------r 13 ( X – X 0 ) + r 23 ( Y – Y 0 ) + r 33 ( Z – Z 0 )
(4.20)
where: x, y are the point image coordinates; x0, y0 are the image coordinates of the camera principal point; c is the camera constant; X, Y, Z are the point object coordinates; X0, Y0, Z0 are the coordinates in object space of the perspective center; rij are the elements of the orthogonal rotation matrix R between image and object coordinate systems. R is a function of the three rotation angles of the camera. The collinearity model needs to be extended in order to take into account systematic errors that may occur, leading to a self-calibrating bundle adjustment [Grün and Beyer, 2001]. Systematic errors are errors in the assumed functional or stochastical model, like non-modeled effects of the observation process. These errors are usually described by correction terms for the image coordinates, which are functions of some Additional Parameters (APs). A set of additional parameters widely used in photogrammetry [Brown, 1971; Beyer, 1992] consists of the 10 parameters modeling the interior orientation (ΔxP, ΔyP, Δc), the scale factor uncertainty in pixel spacing (sX), the non-orthogonality of the image coordinate system (shear factor A), the symmetrical radial lens distortion (k1, k2, k3), and the decentering lens distortion (p1, p2). The extended collinearity equations have the following form: 2 Δc 2 4 6 2 Δx = – Δ x o + ------ x + xs x + yA + ( k 1 r + k 2 r + k 3 r )x + p1 ( r + 2x ) + 2p 2 xy c 2 Δc 2 4 6 2 Δy = – Δ y 0 + ------ y + xA + ( k 1 r + k 2 r + k 3 r )y + 2p 1 xy + p 2 ( r + 2y ) c
where x = x – x 0 , y = y – y 0
2
and r 2 = x + y
2
(4.21)
.
with: ki: parameters of symmetrical radial lens distortion pi: parameters of decentering lens distortion leading to x – x 0 = – c ⋅ f x ( x, y ) + Δ x y – y 0 = – c ⋅ f y ( x, y ) + Δ y
(4.22)
The functions in Equation 4.21 are called ‘physical model’, as all the components (APs) can be attributed to physical error sources.
56
Section 4.3. Bundle adjustment
Solving a (self-calibrating) bundle adjustment means to estimate the additional parameters in Equation 4.21 as well as position and orientation of the camera(s) and object coordinates using point and linear correspondences in the images. Two collinearity equations can be formed for each image point. Combining all equations of all points in all the images leads to a system of equations to be solved. Equation 4.20 (or the extended Equation 4.22) are the observation equations for the estimation of the unknown parameters and can be described as: l = f(x)
(4.23)
i.e. a function that relates the image observations l to the parameters x in the right side, where: • x = [ΔX, ΔY, ΔZ, ΔX0, ΔY0, ΔZ0, Δω, Δφ, Δκ, APi] is the vector of the unknowns; • ΔX, ΔY, ΔZ are the changes to approximations of the object coordinates of a point • ΔX0 ... Δk are the changes to approximations of exterior orientation elements • APi additional parameters; For the estimation of x, the Gauss-Markov model of least squares is normally used. The formed equations are non-linear with respect to the unknowns parameters and, in order to solve them with a least squares method, they must be linearized, thus requiring approximations. After a first order Taylor expansion, collecting the coefficients of the partial derivatives in a matrix A and introducing a true error vector e, Equation 4.23 becomes: l – e = Ax
(4.24)
where: • e is the true error; • A is the n x u design matrix (n is the number of observation, u is the number of unknowns), it has rank u and containing the partial derivatives of the n Equation 4.22 with respect to the u unknowns, evaluated with the approximations; • l is the absolute vector of the observations (observed minus approximated). The estimation of the unknowns vector xˆ is usually performed iteratively as unbiased, minimum variance estimation by means of least squares, resulting in: –1 T T xˆ = ( A PA ) ( A Pl )
(4.25)
with P the weight matrix of the observations, which in most practical applications has the form σ2I where σ2 is a global measure of the variance of image coordinate measurements. In general, all unknown parameters of the bundle are treated as stochastic variables, allowing to consider and include a priori information about them. The non-linear bundle problem is therefore solved as a sequence of linear problems: in each iteration, a correction vector xˆ is estimated, the corrections are added and the process is repeated until convergence. The internal accuracy of the adjustment is given computing the residuals v of the observations ˆ and the a posteriori variance factor σ 0 as shown in Equation 4.26 and Equation 4.27: v = Axˆ – l σˆ 0 =
T
v----------Pvn–u
(4.26) (4.27)
with r the redundancy or degree of freedom (e.g. the difference between number of equations and number of unknowns). Moreover, from the Qxx matrix
57
Chapter 4. CALIBRATION AND ORIENTATION OF IMAGE SEQUENCES
T
Q xx = ( A PA )
–1
(4.28)
i.e. the inverse of the normal equation matrix (also called unscaled covariance matrix), the symmetric covariance matrix Kxx is computed: 2 K xx = σˆ 0 Q xx
(4.29)
Precision measures are computed from the covariance matrix which accommodates every changing in the network configuration and every model variation [Grün, 1978b]. Firstly, the function of the diagonal elements of Kxx: σˆ kk = σˆ 0 q kk
(4.30)
represent the standard deviation of each single unknown of the adjustment while the elements in position ij (with i ≠ j ) represent the covariances between the unknowns xi and xj. Secondly an evaluation of the precision of the estimated object point coordinates can be obtained by using the traces of the corresponding covariance matrices. The Qxx matrix (with its elements qij) provides also information concerning the correlations of the unknown parameters, through the correlation coefficient ρij: q ij ρ ij = ------------------q ii ⋅ q jj
(4.31)
Absolute values of ρij close to 1 indicate high correlations between parameter xi and xj. If highly correlated parameters are found, one of the two must be fixed or removed from the adjustment.
4.3.1 Datum definition and adjustment constraints To invert the positive semi-definite matrix ATPA in Equation 4.25, an external datum of the network is required and this is given by fixing the 7 parameters (three translations, three rotations and one scale) of a spatial similarity transformation of the network. Usually this information is introduced using some control points (7 fixed coordinates values) or fixing 7 elements of the exterior orientation of the images. In aerial photogrammetry points with known coordinates are always available, but in close-range such control information might be not available and an arbitrary reference frame must be selected. The selection of the optimum frames is also called ‘Zero Order Design’2 problem and its solution is achieved with inner, minimal or over-constraints: a datum must be defined imposing constraints that establish the origin, orientation and scale of the ground reference coordinate system. The constraints are said to be minimal if they do not introduce external information into the estimated parameters of the bundle adjustment. If the constraints are not minimal, the solution is over-constraint, the sum of the squared residuals is invariably larger and there might be distortions introduced by the adjustment into the estimated parameters. The use of minimal (and inner) constraints in photogrammetry was first mentioned in [Meissl, 1965] and later considered or reviewed in [Grün, 1976; Papo and Perelmuter, 1981; Fraser, 1982; Dermanis, 1994]. The photogrammetric minimal constraints does not involve the additional parameters but only those parameters which are variant under changes of the reference frame.
2.The problems of network design can be identified as Zero-Order Design (the datum definition problem), First-Order Design (the network configuration problem), Second-Order Design (the weight problem) and Third-Order Design (the densification problem) [Grafarend, 1974].
58
Section 4.3. Bundle adjustment
4.3.1.1 Inner constraints or free net adjustment In a free network adjustment the system of normal equations is singular because of the rank defect (no external datum). Different approaches for the solution of a free net are available [Granshaw, 1980; Cooper and Cross, 1991; Dermanis, 1994], but the solution is always chosen where the trace of the covariance matrix of the estimated parameters is a minimum. The geometric interpretation of the minimum trace is that there should not be any translation, rotation or scaling changes from the given approximative values of the unknown parameters. One of the advantage of free net adjustment is the fact that it can better identify the existence of certain unmodeled systematic error in the system, as the solution is not influenced by external factors. 4.3.1.2 Functional constraints Photogrammetric bundle adjustments are often extended with functional constraints, in particular when the adjustment parameters must conform to some relationship or restrictions derived from geometric or physical characteristic of the network. Typical functional constraints are: • group of point lying on the same plane and having the same height; • points lying on the same line; • known distance between two points; • known distance between two camera stations; • perpendicularity between two tie lines (see Section 4.5) In the functional model of the adjustment, the constraints are defined by additional equations which relate only the parameters to each others. These equations imply that the parameters are functionally dependent and there are as many dependent parameters as constraints equations.
4.3.2 Further considerations on the APs In a self-calibrating bundle adjustment, the Additional Parameters (APs) can be imported as: 1. block-invariant: one set of APs is used for all the images; it is the most common approach, in particular for camera calibration. 2. frame-invariant (or focal-invariant): a set of APs is used for each image; this approach is necessary e.g. in multi-cameras applications (robotics or machine vision inspections) or if zooming effects are present. This solution can create over-parameterization problems. 3. a combination of frame- and block-invariant: the APs are divided in (1) a group which is supposed to be block-invariant (e.g. principal point, affinity and shear factor) and (2) a group which is related to a specific focal length (e.g. lens distortion parameters). The new equations expressing the functional dependence between the APs must be incorporated in the mathematical model of the self-calibrating bundle adjustment, ‘bordering’ the normal equations with the new geometric conditions [Fraser, 1980]. Case 2 and 3 are often considered [Tecklenburg et al., 2001] as it cannot be assumed that the camera parameters remain stable over the whole acquisition period, in particular with consumer digital cameras. Gravity can affect the principal point position while a long acquisition period can heat the camera and influence the photogrammetric adjustment. Nevertheless, not all APs can necessarily be determined from a given arrangement of images. The procedure of self-calibration using APs introduces new observations and unknowns in the least squares estimation, extending the bundle model and problems concerning the quality of the model might arise. Non-determinable parameters (over-parameterization) can lead to a degradation of the results. Therefore an ‘additional parameter testing’ is always required [Grün, 1976; Grün, 1981], in particular when the network geometry is not optimal for system calibration, to check the applied statistical model. Insignificant APs do not affect the solution of the adjustment but their improper use can deteriorate the results as the parameters weaken the condition of the system of the normal equations or lead to a singular system.
59
Chapter 4. CALIBRATION AND ORIENTATION OF IMAGE SEQUENCES
Usually the APs are tested for determinability and significance with: • analysis of the correlation between the parameters (Equation 4.31): it is the most and widely used approach. The APs usually have high correlations between them or with the camera parameters. Generally correlations higher than 0.95 should be eliminated. • statistical tests: normally the Student’s test is applied, with the null-hypothesis that “the AP x is not significant” compared to the alternative hypothesis “the AP x is significant” and using a variable t: gˆi gˆi t = ----- = ---------------σˆ i σˆ 0 q ii
(4.32)
with: ˆ gˆ i = estimated value for the parameter i;
σˆ i = standard deviation of the parameter i. The values of t, for a particular significance level and with a certain DOF, may be found in statistical books. Student’s test is a one dimensional test valid only if the tested parameters are independent. In [Grün, 1981] a stepwise procedure to check the determinability and significance of the APs is presented. The procedure should be performed at the different stages of the least squares adjustment. It is based on the trace check of the covariance matrix to detect and delete those APs that are in the critical range between poorly determinable and sufficiently well determinable.
4.3.3 Blunder detection Least squares adjustments are not robust estimation techniques as wrong observations (like false correspondences) can lead to completely wrong results and might even prevent convergence of the adjustment. For these reasons the image observations should be checked for possible blunders, using a error test procedure on the estimated xˆ or v. Hence the expectations for the two vectors must be tested. Since the expectation for the solution vector xˆ is generally not known (only on control and check points is available), the residuals vector is used. The common approach to detect blunders in the observation is based on the reliability theory or data-snooping technique, developed by [Baarda, 1968]. Baarda’s data-snooping was firstly applied in photogrammetry for independent model adjustment [Förstner, 1976] and then for bundle adjustment [Grün, 1978a; Torlergård, 1981]. For each observation i, under the null-hypothesis that the observation is normally distributed, the coefficient wi –vi –v - = -------i w i = ------------------σv σ0 qv v i
(4.33)
i i
is computed, with q v v the i-th diagonal element of the Qvv matrix: i i Q vv = P ll
–1
T
–1
– A ( A P ll A ) A
T
(4.34)
The blunder detection technique has a solid theoretical formulation but it is based on some assumptions which can lead to unsuccessful results if not satisfied. The two assumptions are: • only one blunder is present in the observations or in case of multiple blunders, they do not interfere with each other 2
• the expectation of the variance factor σ 0 is available
60
Section 4.4. Approximative values for the adjustment’s unknowns
These assumptions are rarely met in photogrammetry. Therefore a more practical formulation was proposed in [Pope, 1975] with the test criterion v vi w i = ------------------- = ------i ˆσ ˆσ q vi 0 vv
(4.35)
i i
If the null-hypothesis E(v)=0 is true, wi is τ-distributed and if the redundancy of the system is large enough, the τ distribution can be replaced by the Student distribution. When a large number of observation is available, robust estimators (RANSAC, Least Median Squares, etc.) can also be employed [Förstner, 1998; see Appendix B]. In robust estimations, gross errors are defined as observations which do not fit to the stochastic model used for the parameters estimation. Robust estimators are particularly useful e.g. when the tie points are automatically extracted, as they must cope with a great number of possible outliers.
4.4 Approximative values for the adjustment’s unknowns The mathematical model employed in the bundle adjustment (collinearity equations) is non-linear with respect to the unknown parameters. To solve it with a least squares method (GaussMarkov), it is linearized, thus requiring approximations for the system unknowns. For non-photogrammetrists, this need of initial values could be an impediment to adopt the rigorous photogrammetric adjustment, as it is for the required image coordinates referenced to the principal point and for the necessity to model systematic errors. Therefore projective geometry formulations (like Equation 2.28) appeared to be a good alternative as they could be solved in a linear manner.
4.4.1 Approximations for the camera exterior parameters Considering only one image, an approximate solution can be achieved with a closed-form space resection [Zheng and Wang, 1992] or the classical non-linear spatial resection based on collinearity, given more than 4 image points (and related object coordinates). On the other hand, knowing the 3D coordinates of at least 6 points, the DLT method [Abdel-Aziz and Karara, 1971] can sequentially recover all the camera parameters. The DLT method, which can also accommodate calibration correction terms, cannot handle situations with planar or nearly planar object point array and it has a tendency to be numerically unstable. Other approaches are described in [Slama, 1980; Criminisi, 1999; Wolf and Dewitt, 2000]. In case of stereo pair, the exterior parameters can be achieved using a relative orientation approach. The photogrammetric coplanarity condition can be formulated as independent or dependent orientation, which is non-linear with respect to the unknown parameters, thus requiring iterations and initial values (see [Hådem, 1984] for a survey). A direct solution can be achieved in closed-form, as proposed in [Shih, 1990]. The coplanarity condition, described with the fundamental matrix (Appendix B), can instead be solved without camera knowledges; the baseline vector and camera rotation matrices can be afterwards extracted in closed-form [Pan, 1995, 1997]. The camera rotation angles can also be recovered using linear image features and vanishing points [Dhome et al., 1989; Petsa and Patias, 1994; Förstner, 1999b].
4.4.2 Approximations for the interior camera parameters The pixel size of a digital image can be considered as a scale factor for the camera focal length. The pixel size can be determined knowing the sensor and image dimensions or it can be recovered from a set of corresponding object and image coordinates distributed on a plane.
61
Chapter 4. CALIBRATION AND ORIENTATION OF IMAGE SEQUENCES
The focal length and principal point can be determined with different methods. The most known approaches are described in [Caprile and Torre, 1990], where the image vanishing points are used, in [Van den Heuvel, 1999b], where orthogonality conditions on line measurements are imposed and in [Förstner, 1999a] using the 3x4 projective matrix P. If a stereo pair is available, the relative orientation information (described by the fundamental matrix) can be used to recover the focal lengths of the two images: a closed-form solution has been proposed by [Pan, 1997] while other methods are described in [Hartley, 1992; Maybank and Faugeras, 1992; Lourakis and Deriche, 1999]. In the following sections, two automated approaches developed to extract the camera (image) interior parameters are presented in detail. 4.4.2.1 Automated vanishing points detection The camera interior parameters can be recovered with an approach based on vanishing point [Caprile and Torre, 1990] computed from line segments extracted in the images. Man-made objects are often present in the images, therefore features like straight lines and angles can be used to retrieve information about the used camera or the 3D structure of the captured scene. In particular, a set of parallel lines in object space is transformed by the perspective transformation of the camera into a set of lines that meet in image space in a common point: the vanishing point. Usually in the images, three main lines orientations associated with the three directions of the cartesian axis are visible. Each direction identifies a vanishing point. The orthocenter of the triangle formed from the three vanishing points vi of the three mutually orthogonal directions identifies the principal point x0 of the camera:
( v1 – x0 ) ( v2 – v3 ) = 0 ( v2 – x0 ) ( v3 – v1 ) = 0 ( v3 – x0 ) ( v1 – v2 ) = 0
(4.36)
igure 4.12.Interpretation of x0 as orthocentre of the triangle.
i.e. the cross product of the segments of the triangle and its heights. The focal length can be afterwards computed as the square root of the product of the distances from the principal point to any of the triangle’s vertices and the opposite side. Most of the vanishing point detection methods rely on line segments detected in the images [Magee and Aggarwal, 1984; Collins and Weiss, 1989; Van den Heuvel, 1998b; Rother, 2000]. The developed approach is also based on line segments clustering and works according to the following automated steps: 1. Straight line extraction with Canny operator [Canny, 1986]; 2. Aggregation of short segments taking into account the segments slope and the distance between segments: the extracted line segments are firstly sorted according to their inclination angle (slope); then they are merged together if the slope’s difference and if the distance between two end points are smaller then a threshold value. The comparison is performed only between line segments that satisfy the orientation constraint. 3. Identification of the three mutually orthogonal directions and classification of the aggregated lines according to their directions. This step is performed computing the lines slope and their orthogonal distance from the image center; these two parameters are used for the correct lines classification.
62
Section 4.4. Approximative values for the adjustment’s unknowns
Figure 4.13. The extracted segments, which fulfill the straight line equation within a certain threshold, can be aggregated in longer segments using their location and inclination.
4. Identification of the three mutually orthogonal directions and classification of the aggregated lines according to their directions. This step is performed computing the lines slope and their orthogonal distance from the image center; these two parameters are used for the correct lines classification. 5. Computation of the three vanishing points for each direction; different solutions can be used: • SVD of the 3x3 second moment symmetric matrix A: n
A =
ai ai ai bi ai ci
∑
ai bi bi bi bi ci
i=1
ai ci bi ci ci ci
(4.37)
formed with the n lines li = (ai, bi, ci). The vanishing point is the eigenvector associated with the smallest eigenvalue. • minimization of the sum of the squares of the perpendicular distances from each line li to the vanishing point vi (Figure 4.14); the minimization searches for the point vi closest to multiple lines li:
∑d
2
⊥ ( l i,
v i ) ⇒ MIN
(4.38)
i
where the minimization is over vi. If only two lines are involved, the problem is reduced to the cross product of the lines. In the general case, the solution is found setting the partial derivatives of Equation 4.38 to zero, forming the normal equations and solving for vi by means of least squares. • use robust estimators to fit the lines intersection model to the input data (in case of wrong lines classification). 6. Determination of the principal point and the focal length of the camera given the three vanishing points [Caprile and Torre, 1990].
Figure 4.14. The extracted lines might not intersect in the same point. The goal is to find the closest point to the multiple lines minimizing the sum of the squares of the perpendicular distances di.
In Figure 4.15 three examples show the automated classification of the lines. The linear features are first extracted and then automatically classified using their slopes and orthogonal distances
63
Chapter 4. CALIBRATION AND ORIENTATION OF IMAGE SEQUENCES
from the image center. Nevertheless, in same cases the automated classification is not retrieving correct results, due to the large number od lines (directions) involved. In these cases, a user interaction is required, in the definition of the 3 perpendicular directions.
(A)
(B)
(C)
Figure 4.15. Automated classification of lines according to their (orthogonal) directions. Three examples in outdoor (A) and indoor (B, C) scenes.
64
Section 4.5. Linear features bundle adjustment
4.4.2.2 Decomposition of the projective camera matrix If linear features are not available, the decomposition of the 3x4 matrix of the projective camera model can be employed to simultaneously derive the camera interior parameters. The projective matrix P can be written as (Section 2.5): p 11 p 12 p 13 p 14 x = p 21 p 22 p 23 p 24 X = PX = K [ Rt ]X
(4.39)
p 31 p 32 p 33 p 34
Therefore KR=P13=(p1 p2 p3), with pi the ith column of P. As R is an orthogonal matrix and RRT=I, a quadratic equation can be formed: (KR)(KR)T=P13(P13)T (4.40) KKT=P13(P13)T Knowing P13 (from P, derived with at least 6 object points), the Cholesky factorization can be used to recover the K matrix. But the direct factorization of the right term in Equation 4.40 will not produce the correct results as P13(P13)T should be a positive definite symmetric matrix to be uniquely decomposed as KKT (with K an upper triangular matrix with positive diagonal element). Therefore the right side of Equation 4.40 must be first inverted to recover the correct factorization results. The factorization leads to an un-normalized K matrix, which should be normalized by the element K33. The algorithm is quite easy, very fast, performs well in absence of measurements noise but relies on the accuracy of the P matrix [Remondino, 2003].
4.5 Linear features bundle adjustment Point measurements have always been the main input of photogrammetric adjustments, partly because of tradition, partly because of limitations of measuring devices. But in digital photogrammetry other features, like lines or curves can also be employed to solve an adjustment. The idea of using features instead of simple points was firtsly presented in [Lugnani, 1980; Masry, 1981] while the use of straight lines was addressed in [Mulawa and Mikhail, 1988; Tommaselli and Lugnani, 1988]. Afterwards line photogrammetry did not have a great impact on photogrammetric triangulation problems, except in few architectural photogrammetric applications [Streilein, 1994; Patias et al., 1995; Van den Heuvel, 1999a; Jung and Boldo, 2004]. See [Van den Heuvel, 2003] for a more complete overview on line photogrammetry. On the other hand, line features have been widely used for the determination of the camera parameters [Wang and Tsai, 1990; Van den Heuvel, 1999b; Förstner, 2000] or reconstruction of objects from single or multiple images [Bellutta et al., 1989; Van den Heuvel, 1998a; Stylianidis and Patias, 2002] but not yet frequently used in close-range bundle adjustment problems. Linear features, in contrast to points, contain information on the object topology and orientation information of the related object edge; moreover a line contains many pixels and can be more precisely identified in the image (at least in the perpendicular direction to it). A straight line in object space has four independent degrees of freedom, while a point has only three, requiring one image more for the computation of the line’s parameters. Adjustment based on line photogrammetry uses linear features in image or object space, by means of coplanarity or collinearity models [Schenk, 2004]. In image space, lines are used as observations and like tie points, tie lines are explicit parameters in the bundle adjustment. In object space, a straight line is described with its two endpoints and the adjustment must be re-formulated with an extended version of the collinearity model. 65
Chapter 4. CALIBRATION AND ORIENTATION OF IMAGE SEQUENCES
4.6 Calibration and orientation of stationary but freely rotating cameras This section deals with the calibration of images acquired with a stationary camera which is free to rotate and change its interior parameters (Figure 4.16). This is the case of image streams acquired with a camera mounted on a tripod or rotated on the shoulder of a camera-man or like pan-tilt (zooming) surveillance cameras or sport events videos. Recovering 3D structures of a scene and camera parameters is quite complex and usually the problem is formulated within a projective framework because of the absence of camera and object information. In the vision community many algorithms have been presented to calibrate image sequences acquired with a stationary but freely rotating camera [Hartley, 1994b; De Agapito et al., 1998; Seo and Hong, 1999]: they rely on the homography (eight parameters projective transformation) between the images and they retrieve the camera parameters with linear or iterative methods. Usually changes of the internal parameters (mainly zooming) are also allowed, but zero-skew or known pixel aspect ratio are often assumed and no statistical check on the determinability of the parameters is performed. In the photogrammetric community, camera calibration by rotation (often called ’single station calibration’) has been investigated by many authors [Wester-Ebbinghaus, 1982; Brown, 1985, reported in Fryer, 1996; Stein, 1995; Pontinen, 2002], even if the process cannot be considered robust and accurate as conventional convergent self-calibration bundle adjustment. A classical calibration approach involving a bundle solution cannot always be employed, as the camera is fixed (unless a testfield is moved in front of the camera). A photogrammetric bundle adjustment can nevertheless be employed if: • all system parameters are treated as observed and weighted value; • significance tests and analysis of determinability are performed when additional parameters are used to model the lens distortion or find the correct focal length (in case of zooming effects). In the following sections, two camera models developed for rotating cameras are presented. Images acquired with cameras rotating around an axis that does not pass through the perspective center (cocentric images) are considered. The small eccentricity can be neglected if the scene is planar or far away from the camera.
Figure 4.16.Videocamera mounted on a tripod (left) or rotated on a shoulder (center). The small eccentricity between rotation axis and image plane can, in same cases, be neglected. A typical surveillance camera, able to rotate and zoom (right).
Two detailed examples showing the calibration and orientation of rotating a camera are presented in Section 6.4.
4.6.1 The projective camera model A general projective camera maps an object point X to an image point x according to x = P X, with P a 3x4 matrix which can be decomposed as P = K [R | t]. If the camera is fix and undergoes only rotations (cocentric images or negligible eccentricity), we can eliminate the vector t and express the mapping of X onto x as [Hartley, 1994b]:
66
Section 4.6. Calibration and orientation of stationary but freely rotating cameras
Table 4.2. The contributions (shaded cells) of the work in the calibration and orientation of rotating cameras. Self-acquired sequencesa Projective camera model
Perspective camera model
Fix interior parameters
Hartley, 1994b
Varying interior parameters
De Agapito et al., 1998; Seo and Hong, 1999
Fix interior parameters
Wester-Ebbinghaus, 1982; Brown, 1985; Stein, 1995; Pontinen, 2002; Remondino and Börlin, 2004
Existing videosa
Varying interior parameters a. Cocentric images or with a small neglectable deviation from cocentricity x = KRX
(4.41)
Given 2 images, the projection of X onto them will be given by: x = Ki Ri X x = Kj Rj X
(4.42)
Therefore, eliminating X, we get: x j = H ij x i
(4.43)
with: –1
–1
H ij = K j R j R i K i
–1
= K j R ij K i
(4.44)
or, if the camera parameters are constant: H ij = KR ij K
–1
(4.45)
where Hij is the inter-image homography containing the element of the 8-parameters of a projective transformation (Section 2.3). Given n>4 image correspondences, we can recover the H matrix with a least squares solution. H can be multiplied with an arbitrary scale factor without altering the projective transformation result. Thus, constructing the homography H from image correspondences is an easy job. However, unpacking K and R from H is more elaborate. From Equation 4.44, considering only one camera, we get: H ij K = KR ij
(4.46)
and post multiplying the two sides by their transposes yields T
H ij K ( H ij K ) = KR ij ( KR ij ) H ij KK
T
T H ij
T T KR ij R ij K
=
T
(4.47)
= KK
T
where the last simplification is due to R being orthogonal. Using the substitution A = KKT, with 2
2
f x + s + x 0 sf y + x 0 y 0 x 0 A =
2
sf y + x 0 y 0
fy + y0
y0
x0
y0
1
(4.48)
67
Chapter 4. CALIBRATION AND ORIENTATION OF IMAGE SEQUENCES
Equation 4.47 becomes: T
H ij AH ij = A
(4.49)
or –T
H ij A – AH ij = 0
(4.50)
which is a linear homogeneous Sylvester equation in the entries of A [Bartels and Stewart, 1972]. A is symmetric and can only be determined up to a constant factor. To solve for its entries, n images are required (n>2) and then a system of equations Ga = 0
(4.51)
can be solved, where G is a 9n x 6 matrix and a is a vector containing the entries of A. The solution is the eigenvector corresponding to the least eigenvalue of the Sylvester matrix A. Then, the values of the calibration matrix K can be derived from A applying the Cholesky decomposition, if A it positive-definite [Remondino and Börlin, 2004]. On the other hand, if the images are acquired with a rotating camera, which is changing its interior parameters, Equation 4.49 becomes: T
H ij A i H ij = A j
(4.52)
and a solution for the A (and K) entries can be found using a non-linear least squares algorithm [De Agapito et al., 1998]. 4.6.1.1 Obtaining the rotation angle from the projective transformation Equation 4.43 relates image correspondences with a matrix H, which contains the eight independent parameters of a projective transformation (Section 2.3). It can be used if the imaged scene is planar and there is an arbitrary camera motion or if a generic 3D scene is imaged with a rotating camera or if the camera is freely moving and viewing a very far away scene. The parameters of H hide the nine coefficients of the orthogonal rotation matrix R. The eigenvalues of an orthogonal matrix (whose product gives the determinant of the matrix and whose magnitude is always 1) must satisfy one of the following conditions: 1. all eigenvalues are 1. 2. one eigenvalue is 1 and the other two are -1. 3. one eigenvalue is 1 and the other two are complex conjugates {1, eiθ, e-iθ} The rotation matrix is uniquely defined by its rotation angle θ and rotation axis a. θ can be computed from the eigenvalues of R while a is afterwards derived from θ. The matrix H has the same eigenvalue of R, up to a scale factor. Therefore, knowing H, we can estimate the rotation between two images i and j up to a sign. If we have multiple frames and the rotation is continuous in one direction, we may use the positive sign for all of them and estimate each consecutive rotation from the composite one.
4.6.2 Simplified perspective camera model If the camera undergoes a rotation, e.g. on a tripod (cocentric images, small eccentricity or camera far away from the scene), the image correspondences are related only through a rotation and the collinearity model can be approximated with: r 11 X + r 21 Y + r 31 Z x' – x 0 = – c ⋅ -------------------------------------------r 13 X + r 23 Y + r 33 Z r 12 X + r 22 Y + r 32 Z y' – y 0 = – c ⋅ -------------------------------------------r 13 X + r 23 Y + r 33 Z
(4.53)
On the other hand, a perspective projection can also be represented with x=cX/Z and y=cY/Z. Therefore the coordinates of an image point (x’,y’) that undergoes a rotation can be computed as:
68
Section 4.7. Calibration of stationary and fixed camera
r 11 x + r 21 y + r 31 c x' – x 0 = – c ⋅ ----------------------------------------r 13 x + r 23 y + r 33 c r 12 x + r 22 y + r 32 c y' – y 0 = – c ⋅ ----------------------------------------r 13 x + r 23 y + r 33 c
(4.54)
i.e. the knowledge of 3D object coordinates is not required and the position of a point in one image, after a pure rotation, can be recovered only using the camera interior parameters and its position in the previous image [Remondino and Börlin, 2004]. Of course Equation 4.54 can be seen as a projective transformation between the two images and could be extended to include some additional parameters to model the lens distortion. If the camera parameters and the rotation between two images are known, Equation 4.54 provides for the point’s position in the second image. On the other hand, given multiple images, the camera parameters can be estimated using Equation 4.54 and solving the minimization n img m pts
∑ ∑ [ ( x˜
2
ij
2
– x ij ) + ( y˜ ij – y ij ) ] ⇒ MIN
(4.55)
j=1 i=1
where ( x˜ ij, y˜ ij ) are the estimated coordinates while ( x ij, y ij ) are the measured coordinates. Equation 4.55 can be solved over (c, x0, y0 and R), differentiating and setting the partial derivatives to zero. Given n images acquired with a camera with constant interior parameters, the following functional constraints can be used: cn = c = cost x0,n = x0 = cost y0,n = y0 = cost The advantage of this approach is that the 3D coordinates of the correspondences are not required as we assumed that they only depend on the camera rotations and interior parameters. A similar mathematical model, describing the relationship between corresponding image points only through a rotation matrix has been presented in [Pontinen, 2002].
4.7 Calibration of stationary and fixed camera Many surveillance cameras or web-cams are completely fixed, mount a wide-angle lens (often fish-eye) and present great distortion effects (in particular radial distortion). Their calibration (mainly recover the camera constant and model the distortion effects) is required to perform metric and accurate measurements, e.g. for forensic applications (Section 5.3). Assuming that we cannot acquire images of a testfield moved in front of the camera, we should rely on a single image, requiring the use of point and linear features. Camera constant and principal point can be recovered with a DLT approach. If no object information is available, a vanishing point method (Section 4.4.2.1) should be employed, requiring straight lines for the determination of the camera interior parameters. If wide-angle or fish-eye lenses are mounted on the camera, great non-linear distortion effects are present in the image (see Figure 4.17). From [Brown, 1971], polynomial expressions can be used to model the distortion effects: 2
4
6
2
4
6
2
2
x und = x + x ( k 1 r + k 2 r + k 3 r ) + p 1 ( r + 2x ) + 2p 2 xy 2
2
y und = y + y ( k 1 r + k 2 r + k 3 r ) + 2p 1 xy + p 2 ( r + 2y )
(4.56)
69
Chapter 4. CALIBRATION AND ORIENTATION OF IMAGE SEQUENCES
2
where x = x dist – x 0 , y = y dist – y 0 , r 2 = x + y
2
and ki and pi are the coefficients of radial and
decentering distortion. For fish-eye lenses, higher order polynomial distortion model can be used [Basu and Licardie, 1995; Shah and Aggarwal, 1996; Kannala and Brandt, 2004]. In many cases, decentering distortion can be neglected and only the first ki coefficient is considered, leading to: 2
x und = x + x ( k 1 r )
(4.57)
2
y und = y + y ( k 1 r )
In absence of distortion effects, the central projection of a straight line is itself a straight line: the systematic deviation of the imaged lines from straightness provide a measure of the lens distortion. Therefore, a calibration method based on linear features extracted from a single image can be employed. The implemented approach, similar to [Devernay and Faugeraus, 1995], automatically removes distortion effects according to the following steps: • Edge detection [Canny, 1986]; • Fit straight segments to the edges: for each edge, a least squares fitting is performed on the distorted coordinates of the edge’s points, searching the coefficients that better describe a straight line; • Compute the undistorted coordinates and the undistorted ray; • Recover k1 solving the equation r und = r dist ( 1 + k 1 r 2dist )
in a least squares mode;
• Compute for each point of the image the undistorted coordinates and generate the new undistorted image. The method is quite sensitive to image noise, therefore if the linear features cannot be clearly identified, the distortion effects are not completely removed. In these cases, an iterative process should be started using the generated undistorted image: • detection of long edges [Canny, 1986], using a threshold on their length; • for each edge, check the ‘tolerance’ value expressing the deviation from straight line; • if the median of all the tolerances is lower than a threshold, manually change the value of k1 and recompute a new undistorted image. Two examples of distorted images are presented in Figure 4.17 and Figure 4.18. Once the strong distortion effects have been removed, the camera can be calibrated (see Table 4.3), e.g. with a vanishing point approach (Section 4.4.2.1).
70
Section 4.7. Calibration of stationary and fixed camera
A
B
C Figure 4.17. Image acquired from a webcam at ETH Zurich (A) with a large radial distortion. Extracted edges with Canny operator (B) and resampled undistorted image (C).
A
B
C Figure 4.18. Image from the [CAVIAR] data set (A), the extracted edges with Canny operator (B) and resampled undistorted image (C).
71
Chapter 4. CALIBRATION AND ORIENTATION OF IMAGE SEQUENCES
A
B
Figure 4.19. Undistorted image from the [CAVIAR] data set (the same of Figure 4.18) and the extracted lines used to compute the focal length (Table 4.3).
Table 4.3. Recovered focal length of the CAVIAR camera, after distortion effect removal. CAVIAR Data Sony Sensor
1/3”
Image size
384 x 288 pixel
Lens
YV2.2x1.4A
Nominal focal lengtha
2.2 mm
Recovered focal length
2.19 mm
a. Value available in the camera datasheet specifications
72
5 HUMAN BODY MODELING AND MOVEMENT RECONSTRUCTION
5.1 3D Modeling of human characters The realistic modeling and animation of humans is one of the most difficult tasks in the vision and graphic community. In particular, human body modeling from video sequences is a challenging problem that has been investigated a lot in the last decade. Recently the demand of 3D human models is drastically increased for applications like movies, video games, ergonomics, e-commerce, virtual environments and medicine (Figure 5.1). A complete human model consists of the 3D shape and the movements of the body. The 3D shape is generally acquired with active sensors while the movements are captured with motion capture systems. Videogrammetry is the alternative technique able to provide, at the same time, for 3D shapes and movement information. Most of the research activities in this area is focusing on the problem of tracking a moving human (human motion analysis) through an image sequence, using a single camera, multiple views or special equipment for the data acquisition. Many techniques use a probabilistic approach, trying to fit a predefined 3D model to the image data. But less attention has been directed to the deterministic problem, i.e. find a reliable camera model to recover 3D information. Because a single frame or rotating monocular sequences do not allow the generation of 3D data using common stereo approaches, some assumptions have to be done in order to infer 3D measurements from 2D observations. The issues involved in creating virtual humans are the acquisition of the body shape, the acquisition of the movements information and the animation. In the animation and graphic community, the modeling of the static human figure is often divided in layers: (1) a skeleton, consisting of rigid bones placed on top of a wireframe skeleton, (2) a muscle layer, (3) a fat layer and (4) a skin
73
Chapter 5. HUMAN BODY MODELING AND MOVEMENT RECONSTRUCTION
layer, represented by a geometric mesh, spline patches or subdivision surfaces. Different representations of virtual characters are present in the literature and the majority consists only of a skeleton and a skin layer. One of the most used articulated 3D representation for animated character is the H-Anim. It is an International Standard that defines the H-Anim as an abstract representation (in VRML97 language) for modeling 3D human figures; it describes a standard way to represent and animate humanoids and it is a simple design for 3D Internet applications. The HAnim does not define a particular shape for a virtual character but specifies how such characters should be structured for the animation. Then the animation is generally based on its skeleton and can be performed using any manual manipulation, keyframing or motion capture data.
Figure 5.1. Some examples of human body shape and movement digitization. Left: Computer games virtual players [Xbox NBA 2005]. Middle: In ergonomics, digitization of Barrichello’s head for the manufacturing of his helmet [Gom Gmbh]. Right: Styling application for virtual fashion show [Digital FashionTM].
5.1.1 Overview on static human shape capturing A standard approach to capture the static 3D shape (and color) of an entire human body uses laser scanner or structured light technology [BreuckmannTM, CyberwareTM, InspeckTM, VitronicTM, Wicks&WilsonTM]. These sensors are quite expensive but simple to use and various software is available to model the 3D body measurements. Actual technology uses laser light or stripe projections, generally based on the triangulation principle and provide for millions of points, often with related color information. They can scan a human body, or part of it, in few seconds, usually combining multiple scans. Afterwards the 3D shape can be animated articulating the model and changing its posture [Ju et al., 2000; Allen et al., 2002; Seo and Thalmann, 2003] or dressed for garment models [Cordier et al., 2003] or used for medical research and education [MagnenatThalmann and Thalmann, 1994] or deformed for virtual effects [Burshukov, 2004] (Figure 5.2). Concerning image-based approaches, mainly multi-camera approaches have been presented. The silhouette method (visual hull) deforms a known 3D human model to the extracted image contour data [Hilton et al., 2000; Lee et al., 2000; Starck and Hilton, 2003]. A multi-view geometry approach is employed to recover face 3D models [D’Apuzzo, 2003] through a camera model. Single camera approaches are very rare [Remondino, 2004; Section 5.2]. Other research activities tried to generate realistic 3D models of humans using only one image [Lee and Chen, 1985; Barron and Kakadiadris, 2001; Taylor, 2001]. They use anthropometric statistics and hypothesis on the human shape to recover pose and body measurements up to a scale parameter. Finally, computer animation software [3DStudioMaxTM, MayaTM, PoseTM], independently from measurements, can produce realistic 3D model of humans by subdividing and smoothing simple polygonal elements. These spline-based systems are mainly used for movies or video-games and the created virtual humans are then animated using similar animation packages or with motion capture data.
74
Section 5.1. 3D Modeling of human characters
Figure 5.2. Digitized 3D model of a human face deformed using commercial software. The example of the ‘Superpunch’ in the movie ‘The Matrix’ [Burshukov, 2004].
5.1.2 Overview on human movement detection and reconstruction The main problem in body motion tracking is the great number of degrees of freedom to be recovered. Two processes are involved: (1) the 3D pose estimation, i.e. the identification of how a human body or human limbs are configurated in the analyzed scene and (2) the movement reconstruction, i.e. the determination of the different poses in the different frames. Existing and reliable commercial systems for capturing human motion typically involve the tracking of human's movements using sensor-based hardware. M0tion capture (MOCAP) systems (e.g. AscensionTM, PolhemusTM, Motion AnalysisTM, ViconTM, QualisysTM) are based on optical, magnetic and mechanic measurement methods and proved an effective and successfully means to replicate human movements. They are used in computer animation, to increase the level of realism in the movements or in biomechanics, for precise measurements of the human joints movements. In particular, optical systems are mostly based on photogrammetric methods (like bundle adjustment) and the trajectories of signalized points on the body (e.g. retro-reflective markers) are measured with very high precision. Based on a multi-cameras network (also more than 20 sensors involved), they offer complete freedom of movements (compared to magnetic systems) and interactions of actors are also possible. Recently, improvements in the sensor technology have been introduced and high-speed sensors are used to acquire real-time 3D motion data. A system based on motorized video theodolite in combination with a digital video camera [Anai and Chikatsu, 1999; Anai and Chikatsu, 2000] has also been used for the analysis of human motion while nowadays most of the research in human movement analysis and reconstruction rely only on video sequences as primary input. Single- or multi-stations videogrammetry offers in fact an attractive alternative technique, requiring cheap sensors, allowing markerless tracking (see [Bray, 2000] for a detailed survey) and providing, at the same time, for 3D shapes and movements information. The analysis of existing videos can moreover allow the generation of 3D models of characters who may be long dead or unavailable for common modeling techniques. The video analysis of human dynamics can be performed in 2D or 3D. Tracking in 2D is mainly used in surveillance and forensic applications, where the goal is the monitoring, localization and identification of moving objects (Section 5.3). Concerning the analysis in 3D, two great classes of methods, both monocular or multi-camera based, can be identified: 1. Model-free: no a priori human model is used and the 3D information is usually extracted through a camera model (deterministic approach) [D’Apuzzo, 2003; Remondino and Roditakis, 2003]. 2. Model-based methods: a predefined human model or training data is used as reference to constraint and guide the interpretation of the image data or its poses are continuously updated using the extracted image observations (e.g. silhouettes). Generally a minimization over many parameters is solved to fit the data (probabilistic approach). See [Lepetit and Fua, 2005] for a
75
Chapter 5. HUMAN BODY MODELING AND MOVEMENT RECONSTRUCTION
recent survey. Nowadays, the great challenge is to use 2D monocular videos of moving human as input [Yamamoto, 1998; Sidenbladh et al., 2000; Howe et al., 2000; Rosales and Sclaroff, 2000; Seo and Hong, 1999; Gehrig et al., 2003; Remondino and Roditakis, 2003; Urtasun and Fua, 2004]. To infer the 3D movement information from the 2D video data, knowledge about human motion (like sample training data), image cues, probabilistic techniques, background segmentation or blob statistics are generally used. Most of these methods are model-based and no camera model is employed. On the other hand, multi-cameras approaches are employed to increase reliability, accuracy and avoid problems with self-occlusions [Vedula and Baker, 1999; Plaenkers, 2001; Cheung et al., 2004]. Some systems fit a predefined human model onto the silhouettes of a moving person extracted from the different images [Gavrila and Davis, 1996]; other approaches extract 3D information from the images, based on a camera model [D’Apuzzo, 2003] or the visual hull [Mündermann et al., 2005] and then track these data through the sequence of frames; other sophisticated methods fit generic human models to the extracted 3D data [Fua et al., 2000]. The recovered human poses can be represented as points, simple shapes or with articulated figures. Point representation is widely used when markers are attached to the subjects. Boundary boxes or ellipses may be used as an intermediate representation during the processing and mainly during a 2D tracking process. Stick-figures is a very popular representation for the human skeleton, while more complex and articulated figures use cylinders, super-quadratics, CAD models or ellipsoids (metaballs). The International Standard H-Anim, an abstract representation for modeling and animate 3D human figures, does not define physical shapes for such characters but does specify how such characters must be structured for animation. The quantitative analysis of the recovered human movements is generally called gait analysis. 5.1.2.1 Gait analysis The recovered three-dimensional coordinates of the human joints can be used to provide a biomechanical description of the human gait. The scientific gait analysis started with the photographic measurements of Marey and Muybridge in the 1870’s. Nowadays, precise and reliable clinical gait analyses are performed with MOCAP systems, even if the equipment is still very expensive. Markerless videogrammetry is a very useful alternative, even if the accuracy of the measurements (in particular from monocular videos) is not satisfactory for clinical analysis. A gait study is performed within gait cycles, usually defined as the interval of time between one foot contacts the ground two consecutive times. The different positions of the feet on the ground define different gait parameters: the step length (distance between the two feet during the movement), walking velocity (the walked distance in a certain time), the stride length (sum of two step lengths), the walking base (side-to-side distance between the two feet), angle of toe-out (angle between the walking direction and the midline of a foot). Other parameters are recovered using the segment and joint angles (generally measured in the sagittal plane). The kinematic analysis of the human movement is usually completed with a kinetic analysis, where videogrammetry cannot contribute: one or more force platforms are used and e.g. the ground reaction force during walking or other activities are measured.
5.2 Image-based reconstruction of static human body shape The most employed method to produce 3D models of human bodies is laser scanning. The advantages are the fast acquisition and the high accuracy. An alternative and cheaper method, based on image measurements, has been developed and presented in [Remondino, 2004]. The images (Figure 5.3) can be acquired with a still-video camera or with a camcorder. A complete
76
Section 5.2. Image-based reconstruction of static human body shape
reconstruction of the human body requires a 360 degrees azimuth coverage: in these cases the acquisition lasts ca. 45 seconds (less time is necessary if a camcorder is used) and requires no movements of the person. This could be considered a limit of the procedure, if we consider that body scanners require approximately 15 seconds for the data acquisition.
Figure 5.3. Four (out of twelve) images (1600x1200 pixel) used for the reconstruction of the human shape. On the right a 3D view of the recovered camera poses and object coordinates is shown.
Once the images are oriented (Figure 5.3, right), in order to produce a dense and robust set of corresponding image points to reconstruct the human shape, an automated matching process is used [D’Apuzzo, 2003]. It establishes correspondences between three images starting from few seed points and using the least squares matching method [Grün, 1985a]. One image is used as template and the other two as search images. Starting from few seed points automatically extracted in the three images, the matching process automatically determines a dense set of correspondences in the triplet. Due to the body’s shape, generally more than three images are not used. The central image is used as template and the other two (left and right) are used as search images. The matcher searches the corresponding points in the two search images independently and at the end of the process, the data sets are merged to become triplets of matched 2-D points. If the orientation parameters of the cameras are available, the geometric constraints between the images can also be used during the matching process (multi-photo geometrically constrained matching). The matching is applied to all consecutive triplets of images and the 2D image correspondences are afterwards transformed in 3D object coordinates via forward intersection. To evaluate the quality of the matching results, different indicators are used: a posteriori standard deviation of the least squares adjustment, standard deviation of the shift in x and y directions and displacement from the start position in x and y directions. Thresholds for these values can be defined for different cases, according to the level of texture in the images and to the type of template. The least squares matching process can have some problems if lacks of natural texture are present or low resolution images are used. Therefore the performance of the process can only be improved with some local contrast enhancement of the images (e.g. Wallis filter) or using more closely images. For each triplet of images, a 3D point cloud is computed and then all the points are joined together to create a unique point cloud of the human shape. Then, in order to reduce the noise in the 3D data and get a more uniform density of the point cloud, a spatial filter is applied. The object space is divided into boxes and the center of gravity of each box is computed; the filter is used to reduce the density of the data (the points contained in each box are replaced by its centre of gravity) and to remove outliers (points with big distances from the centre of gravity are rejected). The obtained 3D shape (ca 20 000 points) can be visualized using the radiometric information recovered from the images (each point of the cloud is back-projected onto one image, according to the direction of visualization, to get the related pixel color). The proposed method does not require any projection of pattern nor particular devices for the acquisition. It can be improved acquiring the images with a synchronized multi-camera system, reducing also the time of acquisition and keeping the hardware costs still lower than a laser scanner. The 3D data are computed with a mean accuracy in x-y (plane) of ca 2.3 mm and in z direc-
77
Chapter 5. HUMAN BODY MODELING AND MOVEMENT RECONSTRUCTION
tion (depth) of ca 3.3 mm; therefore the results can be used for animation and visualization purposes, or in biometric applications with medium accuracy requirements.
Figure 5.4. The recovered 3D point cloud of the human character visualized without and with radiometric information.
5.3 Forensic metrology Forensic science is generally related to image sequence and human movement analysis. Closed Circuit TeleVision (CCTV) and surveillance cameras are a common source of information for people monitoring, identification and recognition. Videos of crime or rubbery scenes are often investigated in forensic laboratories [Criminisi, 1999; Fryer, 2000; Bramble et al., 2001]. Moreover, the number of surveillance systems increase rapidly: some years ago they were used mainly in banks and post-office while nowadays they are commonly visible on the streets or in stores. Therefore image processing methods become more important when evaluating video sequences as a complement to the human eye. There are many research projects devoted to the identification of individuals using biometric technologies, e.g. using biological features or characteristics of an individual that can uniquely identify a person from anyone else (anthropometry and movement behavior are unique for every person). Unfortunately surveillance videos have often poor image quality (due to the low image resolution and low light conditions) and seldom small particulars, like a human face, can be clearly seen. But other information, like silhouettes, contours, clothes details or gait can be used for the identification and recognition purposes. In the following section the qualitative identification of moving subject is presented. On the other hand, quantitative height and movement measurements can be determined using e.g. the cross-ratio invariant (Equation 2.22 and Section 2.4.1), as described in Section 6.4.
5.3.1 Detection and tracking of a moving human in image space In applications like video-surveillance, identification, authentication and monitoring of human activities, the main idea is to detect and track moving objects (people, vehicles, etc.) as they move through the scene. Regions of moving objects should be separated from the static environment and the methods should cope with occlusions, changes in illuminations and different types of motions. To identify and separate the moving object, different approaches have been proposed, like background subtraction [McKenna et al., 2000; Rosales and Sclaroff, 2000], 2D active shape models [Sangi et al., 1999], combination of motion, skin color and face detection [Gavrila, 1996] or using learned spatio-temporal templates [Dimitrijevic et al., 2005]. Most of the approaches require that the data are acquired from a static camera. In case of moving camera imaging moving objects, most of the procedures are not usable as the camera movement can not be distinguished from the moving objects. If the camera is stationary, the most simple but quite efficient approach consists of subtracting two consecutive frames to detect the moving objects. The generated image has much larger val-
78
Section 5.3. Forensic metrology
ues for the moving components of the frame than the stationary components. Moreover, a moving object produces two regions, namely a front region of the object, caused by the covering of the background, and a rear region of the object, generated by the uncovering of the object from the background. Therefore, using a threshold on the grey values, it is possible to detect the rear region of the moving object. The threshold value is generally determined by experiments. The binary thresholded image usually contain some noise (mainly generated by different illumination condition between the two images) which can be easily removed with an erosion process or with a median filter (Figure 5.5).
-
=
=>
Figure 5.5. Two frames of a self-acquired video of a walking person. The moving character identification is performed with image subtraction and median filtering.
Once a moving object has been localized, its bounding boxes can be computed. For this purpose a vertical projections of the binary image can be at first performed. The different objects in the image are often already visible from this projection. The position of the objects in the horizontal axes are determined by slicing the vertical projections. If the counted number of pixel in a slice is higher than a threshold, then the slice is identified as an area of moving activities. This is done for all the slices along the horizontal axes and finally the adjacent slices with moving activities are joined together obtaining a set of areas where moving activities have been detected. The size of the slices can be adapted to the specific conditions of the acquired images. The smaller the slices are, the better will be the precision of the detected areas, but if the slices are too small, then different moving objects could be detected as a single moving object. The threshold for the identification of a slice as a moving area depends on the size of the slices and has to be determined by experiments. Afterwards the same process can be performed with the horizontal projections of the different areas identified by the horizontal axes. The horizontal projection of a person is sometimes divided in two different moving areas: indeed the middle of the body is usually not moving during the walk, therefore it is not detected. Once the moving areas are detected, the complete square bounding boxes can be obtained (Figure 5.6). In case of occlusions (e.g. two people walking one towards the other), it can be difficult to divide the vertical projections into its components. To avoid this problem, the center of gravity can be computed and the boxes are calculated with respect to this center (Figure 5.7). More robust approaches are based on background learning and subtraction [Haritaoglu et al., 1998; Stauffer and Grimson, 1999; McKenna et al., 2000; Kim et al., 2004]. The approach of [Kim et al., 2004] was used to identify moving people in video sequences. The RGB information of the images is used to distinguish between moving foreground and static background. As the fix camera is imaging the same static scene, each frame is analyzed to create a ‘model’ of the background which is afterwards used in the subtraction phase. The detected moving areas (white pixels) are used to extract the foreground and draw the bounding boxes (Figure 5.8).
79
Chapter 5. HUMAN BODY MODELING AND MOVEMENT RECONSTRUCTION
Figure 5.6. Two walking people imaged with a static video-camera. After the image subtraction, vertical and horizontal projections are performed to identify the bounding boxes of the moving people.
Figure 5.7. Results of moving people detection in case of occlusions (two central images).
Figure 5.8. Some frames from the [CAVIAR] dataset: the background has been subtracted and the moving people identified. Some noise is still visible near the human’s silhouette.
80
Section 5.4. Markerless motion capture from monocular videos
These kind of approaches always need a time consuming training phase, where the sequence is analyzed and a reference background image is created. Once a moving person is identified, biometric analysis, like features measurement and validation according to a database of known individuals, can be performed. The topic of the thesis is not really connected to visual surveillance and moving object detection, therefore no further investigations on this subject were performed.
5.4 Markerless motion capture from monocular videos In this section a deterministic determination of the 3D poses of a moving character imaged in a monocular video is presented. The method has been developed and tested using monocular sport video sequences (to avoid copyright problems). Most of the published algorithms have been tested on self-acquired videos while a great challenge is to use available movies. This is of great interest in particular if we want to reconstruct or analyze the poses and movements or characters who are not alive or available for common modeling systems. A moving human imaged with one moving camera represents the most difficult case for the deterministic reconstruction of the 3D poses. In particular, sport movies are usually acquired with a stationary but freely rotating camera and with a very short baseline between the frames. Therefore, due to the movements of the person, a standard perspective approach cannot be used, in particular for the 3D modeling of the human body. A general framework has been developed, to accommodate and process any input sequence. According to the input sequence, small modifications of the approach might be required, as the data acquisition and human motion are not unique in the existing videos. The goal of the whole process, graphically summarize in Figure 5.9, is to extract 3D information of the moving character mainly for visualization and animation purposes. As generic existing videos are used, no reference data is available and no validation of the approach will be performed. In the following sections, the pose reconstruction problem and the 3D skeleton visualization and animation will be discussed while the calibration and orientation of the images have been already presented in Section 4.3. Table 5.1. Contributions (shaded cell) to 3D shape and movement reconstruction using markerless videogrammetry.
Model-based / Probabilistic approach
Model-free / Deterministic approach
Monocular videogrammetry
Multi-station videogrammetry
Yamamoto, 1998; Seo and Hong, 1999; Sidenbladh et al., 2000; Howe et al., 2000; Rosales and Sclaroff, 2000; Urtasun and Fua, 2004; Dimitrijevic et al., 2005;
Gavrila and Davis, 1996; Vedula and Baker, 1999; Fua et al., 2000; Plaenkers, 2001;
D’Apuzzo, 2003;
81
Chapter 5. HUMAN BODY MODELING AND MOVEMENT RECONSTRUCTION
Figure 5.9. Pipeline for the markerless human motion reconstruction and animation from an existing monocular video. The gray rectangular boxes indicate automatic steps of the workflow. The point measurements and the modeling part is done manually.
5.4.1 Deterministic pose estimation A single camera imaging a moving character does not allow the classical approaches for 3D object reconstruction. For man-made objects (e.g. buildings), geometric constraints on the object (e.g. perpendicularity and orthogonality) can be used to solve the ill-posed problem of the 3D reconstruction from a monocular videos or single image [e.g. Van den Heuvel, 1998a]. In case of free-form objects (e.g. the human body), probabilistic [Sidenbladh et al., 2000] or model-based [Seo and Hong, 1999] approaches are generally employed, while deterministic methods can be employed if some assumptions are taken into account, leading to: • a simplification of the perspective collinearity camera model into a scaled orthographic projection: x = sX y = sY
(5.1)
with s a scale factor (including camera focal length and Z object coordinate) recovered from the image measurements and from known human dimensions; • a representation of the human body in a skeleton form, with a series of joints and connected segments of known relative lengths; • application of further constraints on joints depth and segment’s perpendicularity to obtain more accurate and reliable 3D models. The effect of orthographic projection is a simple scaling of the image coordinates. Other authors presented reconstruction methods based on the orthographic projection but the approaches were used for single images without perspective effects [Taylor, 2001] or could not recover the full human skeleton [Bregler and Malik, 1998]. The scaled-orthographic model amounts to parallel projection, with a scaling added to mimic the effect that the image of an object shrinks with the distance. This camera model can be used if we assume that the Z coordinate is almost constant in the image or when the range of Z values of the object (object’s depth) is small compared to the distance between the camera and the object. In those cases the scale factor c/Z will remain almost
82
Section 5.4. Markerless motion capture from monocular videos
constant and it is possible to find a value of s that best fit in Equation 5.1 for all points involved. Moreover it is not necessary to recover the absolute depth of the points with respect to the object coordinate system: this step can be done afterwards, using a 3D conformal transformation (Section 5.4.1.1). Furthermore the camera constant is not required and this makes the algorithm suitable for all applications that deal with uncalibrated images or video. But, as it is generally an illposed problem, we still have an undetermined system, as the scale factor s cannot be determined only by means of Equation 5.1 and a single frame. Therefore, supposing that the length L of a straight segment between two object points is known, it can be expressed as 2
2
2
L 12 = ( X 1 – X 2 ) + ( Y 1 – Y 2 ) + ( Z 1 – Z 2 )
2
(5.2)
By combining Equation 5.1 with Equation 5.2 we end up with an expression for the relative depth between two points: 2
2
[ ( X1 – X2 ) + ( Y1 – Y2 ) ] 2 2 ( Z 1 – Z 2 ) = L 12 – -----------------------------------------------------------2 s
(5.3)
Therefore, knowing the scale parameter s, the relative depth between two points can be computed as a function of their distance L (that should be known) and image coordinates. With this approach, the whole reconstruction problem is reduced to the problem of finding the best scale factor for a particular configuration of image points. Equation 5.3 also shows that, for a given scale parameter s, there are two possible solutions for the relative depth of the endpoints of each segment (because of the square root). This is caused by the fact that even if we select point 1 or point 2 to have the smaller Z coordinate, their (orthographic) projection on the image plane will have exactly the same coordinate. In order to have a real solution, we have to impose that: 2
2
[ ( X1 – X2 ) + ( Y1 – Y2 ) ] s ≥ ---------------------------------------------------------------2 L 12
(5.4)
By applying Equation 5.4 to each segment with known length one can find the scale parameter that can be used in Equation 5.3 to calculate the relative depth between any two segments endpoints. Because of the assumed orthographic projection, we have to decide an arbitrary depth for the first point and then compute the second point depth relative to the first one. For the next point we use a previous calculated depth and Equation 5.3 to compute its Z coordinate and so on in a segment-by-segment way. Due to the difference in the left side of Equation 5.3, for each segment, the closer to the camera must be identified and imposed. Then, knowing the scale factor, Equation 5.1 can be used to calculate the X and Y coordinates of the image points. In [Taylor, 2001], where this method was firstly presented, it is mentioned that the approach cannot always model images that present strong perspective effects, as an orthographic approach is used. In fact, in some results, because of measurement or wrong assumption, a segment can get foreshortened or warped along one axis (Figure 5.10). But often a human limb or joint can be assumed to lie on a plane (e.g. the two joints representing the shoulders lie on the same plane of the hip or the waist), therefore its two end points can be treated as being at the same depth. Moreover, the angle between two consecutive limbs must respect the human nature posture. Therefore, imposing additional constraints, such as requiring that two joints have the same depth or the perpendicularity of two segments or limiting the angle between two limbs, some reconstruction mistakes produced by a simple orthographic projection can be avoided and the resulting 3D human model is more accurate and realistic. Furthermore measurements occlusions are handled selecting the most adequate point in the image and computing its 3D coordinate using a depth. The whole reconstruction process is shown in Figure 5.11.
83
Chapter 5. HUMAN BODY MODELING AND MOVEMENT RECONSTRUCTION
Figure 5.10. An example of human reconstruction from single image using an orthographic projection. Foreshortened or warped segments might result (central image) if no additional constraints on the skeleton are assumed. Constraints on limbs and joints help to obtain a more realistic 3D model (right image).
Figure 5.11. The data flow of the algorithm for the 3D reconstruction of a human figure from a single image with an orthographic projection (left). The skeleton with 13 joints plus the head used for the reconstruction (center) and the human body represented as an average of eight heads high (right) [Human Figure Drawing Proportion; Visual Body Proportion].
The human skeleton system is treated as a series of jointed links (segments), which can be modeled as a rigid body. For the specific problem of recovering the poses of a human figure, the body is simply described as a stick model consisting of a set of thirteen joints (shoulders, elbows, knees, etc.), plus the head, connected by thirteen segments (we consider the shoulder girdle as unique segment), as shown in Figure 5.11, center. The algorithm needs the knowledge of the relative lengths of the segments as opposed to absolute measurements (since the absolute scale of the figure is absorbed by the scale factor s). The lengths of the segments can be obtained from anthropometric data, like motion capture databases or from the literature. The latter one is more general and follows the studies performed by Leonardo Da Vinci and Michelangelo on the human figure [Human Figure Drawing Proportion; Visual Body Proportion]. It represents the human figure as an average of eight heads high (Figure 5.11, right). A coefficient i is added to these lengths to model the variation of the human size from the average (i=1). Therefore the height is 8i, the torso is 2i, the upper legs are 2i, etc. Once the program has computed the 3D coordinates of the human joints, they are given to a procedure that uses VRML language to visualize the recovered 3D model. All the joints are represented with spheres which are joined together with cylinders or tapered ellipsoids. The reconstruction algorithm can be applied to a single image (Figure 5.12) or a sequence of images (Section 5.4.1.1 and Section 6.4), given the image coordinates of some human joints (head, shoulders, elbows, knees, etc.) and the relative lengths of the skeleton segments.
84
Section 5.4. Markerless motion capture from monocular videos
Figure 5.12. Some examples of human character reconstruction from single image using an orthographic projection with additional constraints on joint positions and angles. The first and last column shows how the recovered 3D joints can be connected with cylinders or tapered ellipsoids.
5.4.1.1 Application to video sequences When a monocular image sequence is used, generally the image points of the joints cannot be automatically tracked, due to limb occlusion problems or low image resolution; therefore the points must be measured manually or semi-automatically between the frames. Between the available frames of a sequence, some key-frames, identifying the main poses of the movement are selected. In each frame a 3D human model is generated as previously described. Due to the orthographic projection, all the recovered 3D characters are not in the same reference system. Therefore a 3D conformal transformation is applied between the model (orthographic) coordinate system and the object coordinate system. At least 3 common points are required; if more than three points are available, a least squares solution is applied. The required object coordinates (e.g. feet and head, as shown in Figure 5.13) are recovered with a 2D projective invariance between two planes that undergo a perspective projection (Section 2.4, Equation 2.20). The relationship between the object and the image planes is specified if the coordinates of at least 4 corresponding points in each of the two projectively related planes are given. The invariance property and the 3D conformal transformation are applied to each ’orthographic’ model of the sequence. At the end of the process, all the previously orthographic 3D models are in the same reference system.
85
Chapter 5. HUMAN BODY MODELING AND MOVEMENT RECONSTRUCTION
Figure 5.13. Simplified scheme for the generation of a 3D character from an image, using orthographic projection and then converting it into the absolute reference system with a conformal transformation. The common points are for example the feet and the head. The position of the head is generally known, the position of the feet is recovered with a projective invariance.
Another possibility to recover the absolute coordinate of the 3D skeleton, is to assume that the character is moving on a plane; therefore, knowing the plane equation, the 3D coordinates of the skeleton joints can be easily determined. Two detailed examples are presented in Section 6.4.
5.4.2 Human modeling and animation The recovered character’s poses are firstly used to reconstruct a 3D model of the human in a skeleton form (Figure 5.12). Afterwards, to improve the visual quality and realism of the model, a pre-defined polygonal model can be fitted to the recovered 3D skeleton (Section 5.4.2.1). Two kinds of polygonal model (later called ‘skin’) have been used: a laser scanning measurements of a real person [CyberwareTM] and a virtual VRML character, that follows the [H-Anim] standards. A detailed description of the fitting procedure and a comparison between the results follow in the next sections. The fitting and animation processes for both cases are performed with the animation features of MayaTM software. Other approaches where a whole body scanner data is deformed to generate ‘animatable’ human bodies are described in [Allen et al., 2002; Ju et al., 2000; Seo and Thalmann, 2003]. Once the fitting has been achieved, the animation of the moving character is performed by means of keyframes, using the frame poses previously recovered and interpolating between them. 5.4.2.1 Polygonal model fitting In computer graphics two main types of methods about fitting a surface on a given set of points can de distinguished: explicit and implicit methods, depending on the final mathematical representation of the surface. Triangular meshes, volume grids [Curles and Levoy, 1996] and parametric piece-wise functions (NURBS) [Krishnamurthy and M. Levoy, 1996] are explicit descriptions of the surface, while soft or blobby objects, also known as metaballs (e.g. [D’Apuzzo et al., 1999; Dobashi et al., 2000]) describe the surface as the isosurface of a distance function. On one hand the explicit functions appear to be a popular representation in modeling software and are hardware supported, achieving rendering performances of millions of texture mapped polygons per second. Fitting such surfaces on a set of measurements presents, though, the difficulty of finding the faces that are closest to a 3D point and the disadvantage of non-differentiability of the distance function. On the other hand, implicit surfaces are more suitable for modeling soft objects as they have been used in modeling clouds or soft tissue objects [Ilic and Fua, 2003], but present
86
Section 5.4. Markerless motion capture from monocular videos
difficulties in deformations and rendering. Therefore body models composed of polygonal elements are selected as the skin that follows the recovered movements. The pipeline of the semi-automated fitting process, implemented in MayaTM, starts with the generation of a new native skeleton, whose joints are running through the thirteen joints of the recovered skeleton. This new skeleton will be the structure on which the skin fitting and animation will be based. The skeleton has a hierarchical structure with a root joint controlling the general position and orientation while the children joints adjust the rotation and translation of the body members to achieve a pose. For the movement of the skeleton there are two solutions available in Maya, called Forward and Inverse Kinematics. The first method requires the rotation and translation of all the joints, starting from the parent and ending to the last child joint, to achieve the final pose. The latter method requires that only the position and rotation of the desired pose, or target locator, is given from the user, and then the position of the intermediate joints is calculated automatically. In this case, the use of joint rotation constrains is essential in order to achieve a correct solution. In our work, inverse kinematics have been used, because of the simplicity and automation of the procedure. The last step is binding the polygonal model with the skeleton. The software uses the joint location and skeleton hierarchy to decide which parts of the model skin are affected. During the procedure, the influence of the joints along the border between two different segments is feathered with the neighboring ones to simulate the behavior of soft skin tissue in deformations. The basic idea behind skeleton and body binding is that the skeleton controls the body movements and deformations. Thus the body takes the poses of the skeleton limbs. Maya animation platform, as most of the animation software on the market, supplies two solutions for simulating the interaction of a skeleton with its skin: (1) soft bind, that allows two or more skeleton joints to influence their surrounding geometry and works very well in soft object simulation; (2) rigid bind, that allows the influence of only one joint per body segment and performs better in solid body modeling. A different binding procedure is used according to which polygonal model is fitted onto the 3D photogrammetric data. Polygonal model fitting: a model from real world data A polygonal model, generated using laser scanner measurement [CyberwareTM] and containing approximately 300 000 polygons is used (Figure 5.14). In this case the great difficulty is to define the zones of influence of every joint. In fact the polygonal body model is constructed as a unique mesh and a joint cannot be prevented to influence the neighboring parts of the body. Any animation platform offers automated calculation of the influence areas for every joint and it uses the skeleton hierarchy to assign the influence values. As any possible human pose should be represented, all the deformations that occur when the body parts are moving must be taken into consideration. During the humans movements, while some body parts remain solid, there are soft body deformations in areas such as the arms and knees, which makes the application of any of the above methods unrealistic. Therefore, for this fitting application, a combination of rigid body modeling with 3D deformation lattices is required (Figure 5.15). Lattices are applied on the sensitive areas and they are one of the best approximations of the physical body behavior. Deformation lattices are placed in the body’s areas subjected to strong deformations during the movements, e.g. shoulders and feet ankles of the polygonal human model. The basic idea is that the skeleton should deform the lattice, which consequently influences the position of the affected points of the polygonal model. In this way the deformations follow the skeleton movements. The number of grid cells constituting the lattices depends on the average number of points that every cell should contain, so it depends on the spatial resolution of the polygonal body. According to the gained experience, lattices with dimensions larger than 10 in all three axes are proven to be computationally expensive, while dimensions smaller than 3 are too coarse to offer sufficient
87
Chapter 5. HUMAN BODY MODELING AND MOVEMENT RECONSTRUCTION
Figure 5.14. The polygonal model obtained with laser scanner measurement [CyberwareTM], containing approximately 300 000 polygons (left). Two close views to the wireframe model in an areas which are usually subjected to strong deformations during the movements (centre). The human model with the native skeleton used for the animation (right).
control. For joints like elbows and knees, an additional and faster deformation procedure can be used. The flexor deformers are specially designed deformers for human body animation that have automated the task of smooth skin simulation in such areas. Because of the simplicity of their geometry, they are used in areas that are not stressed too much by the movement deformations. A complete example of human character reconstruction and modeling with polygonal data is shown in Figure 5.17.
Figure 5.15. The lattices used for areas of the polygonal model subordinated to strong deformations during the movements.
Polygonal model fitting: a H-Anim VRML model The used H-Anim body model consists of approximately 10 000 polygons and it contains every human body part as separate object. The rigid binding of every part of the skin with the corresponding skeleton segments is faster compared to the laser polygonal model. Furthermore, in the areas of intersections, the polygonal objects have been extended and rounded inwards to intersect with the neighboring parts. This allows the body parts to rotate around the joints without revealing gaps and to preserve the continuity of the skin surface. Due to this functionality, no deformation control is necessary and the skeleton with the attached skin can be easily generated (Figure 5.16).
88
Section 5.4. Markerless motion capture from monocular videos
Figure 5.16. The H-Anim VRML model (left), composed of ca 10 000 polygons and the native skeleton used in the fitting process (centre). Two close views of the wireframe H-Anim showing the less detailed model compared to a polygonal laser scanner model (Figure 5.14).
5.4.2.2 Comparison between real-world and H-Anim models Real world polygonal models Laser scanners are able to generate realistic and detailed 3D models of real persons and they are used in particular for video-game and movie applications. Usually the generated polygonal models have very high geometrical resolution and this is significant when high-end and realistic visualization is required. On the other hand the models produced by laser scanning generally describe the whole human body in one geometric piece which can generate some difficulties in the animation phase. At first the part of the body, controlled by each limb of the skeleton, must be defined, requiring some manual editing and corrections. Then a control of the deformation’s areas where limbs are rotating around the joints must be added. This is necessary since the polygon edges around the joints are stressed with larger deformations in case of rotations. As a result the body poses and shape become unnatural and this becomes more apparent when realistic shadows are applied. Moreover intersections between polygons produce shadowed discontinuities around the joints. Eventually deformation control can be achieved by two approaches: (1) smooth skinning or (2) rigid/solid skinning with local grid deformers on sensitive areas. The application of both approaches requires considerable time and increases the computation time for rendering each frame. H-Anim VRML models The important advantage of this type of polygonal geometry is that the model describes every human body part separately. Therefore the task of binding the photogrammetric skeleton to each body model part is easier and faster, as it requires no editing after binding. In the joint areas, the body parts are extended and rounded under the surface of the neighboring part, avoiding discontinuities in joint rotations. Moreover deformers are no more required to control the skin behavior in such areas. In addition, the polygon count is much lower, reducing significantly the rendering times. A typical H-Anim model can hold approximately 30-40 times less polygons than a laser scanning polygonal model. Such virtual characters on the other hand do not describe in details real existing persons and they cannot be accurately applied to any case of human motion. HAnim human models are less realistic than laser scanning polygonal model and describe with very low geometry the human shape. Finally the low number of polygons is not sufficient to describe small details of the body and renderings from close distance can reveal an unnaturally smoothed skin.
89
Chapter 5. HUMAN BODY MODELING AND MOVEMENT RECONSTRUCTION
Figure 5.17. Original image, reconstructed 3D human skeleton and fitted polygonal model. The native skeleton used for the fitting process is also shown.
Figure 5.18. 3D human character reconstructed as skeleton figure (upper right) and modeled with a laser polygonal model (lower left) and the H-Anim VRML model (lower right) fitted onto the recovered 3D skeleton.
Figure 5.19. Original frame of a video (left), reconstructed 3D human skeleton (center) and fitted polygonal model (right), seen from a slightly different point of view.
90
6 EXPERIMENTS
6.1 Automated markerless tie point extraction The aim of the next three examples is to demonstrate the capability of the investigated automated tie point extraction pipeline for image orientation purpose (Section 4.2). The goal is not the complete object reconstruction, which is generally performed better interactively, as reported in Section 3.2 and shown Section 6.2. Two long range motion sequences and one wide baseline example are analyzed and presented. The bundle adjustments were performed importing the image correspondences in different available packages: SGAP (IGP-ETHZ), iWitnessTM and PhotoModelerTM.
6.1.1 The house sequence 6.1.1.1 Problem and goal A set of nine images (Figure 6.1), available in the Visual Geometry Group website of the Oxford University, UK [http://www.robots.ox.ac.uk/], is analyzed to automatically extract the image correspondences and retrieve the camera parameters within a bundle solution. No information about camera and scene is available. Therefore, a pixel size of 0.008 mm is assumed while the house is supposed to be 30 cm wide. The image resolution is 768x576 pixels. 6.1.1.2 Methodology and results A first approximation for the camera focal length is recovered using an interactive approach based on the vanishing points (Section 4.4.2.1). The automated approach could not correctly classify all the extracted line, therefore the three main perpendicular directions were identified
91
Chapter 6. EXPERIMENTS
Figure 6.1. First, middle and last frame showing the house sequence (9 images with a resolution of 768x576 pixel).
manually (Figure 6.2). The recovered focal length is 7.58 mm. Afterwards the image correspondences are extracted using interest points obtained with the [Heitger et al., 1992] operator (Figure 6.3). 636 tie points are imported in the successive bundle adjustment (performed with iWitnessTM program) the retrieve the camera exterior parameters. Due to the non-favorable image network and low image quality, no self-calibration is performed. The recovered camera poses and 3D object coordinates are shown in Figure 6.4. The final average standard deviation of the object point coordinates was σx=2.5 mm, σy=2.9 mm (depth direction), σz = 1.9 mm. Finally the topology of the object can be defined, identifying manually the main edges and planar surfaces from the extracted points.
Figure 6.2. Automatically extracted edges (left) and manually identified lines for the focal length computation.
Figure 6.3. Extracted tie points in one image triplet and recovered epipolar geometry. On the right, two closer views showing the epipolar line for the selected point in the central view.
92
Section 6.1. Automated markerless tie point extraction
6.1.1.3 Considerations The sequence represents a challenging test for the automated orientation procedure, due to the low image resolution and unknown camera and scene information. The final relative accuracy of the automated orientation is approximately 1:100 (in depth direction), which can be considered acceptable given these kind of image data and the unfavorable network for a photogrammetric self-calibration.
Figure 6.4. Recovered camera poses and 3D object coordinates automatically extracted from the sequence (left). Few linear features were manually drawn.
6.1.2 The dinosaur sequence 6.1.2.1 Problem and goal A closed sequence (Figure 6.5), composed of 36 frames and available on the Internet, is acquired with a turntable around a small object. The object is located in the middle of the frames, providing not an optimal point distribution for the image orientation. Furthermore no information concerning scene and object is available and no lines can be used to recover an approximation for the camera focal length. Therefore the interior parameters are assumed and kept fixed while the orientation is done up to a scale factor.
Figure 6.5. Some frames (768x576 pixel) of the sequence acquired around the small object.
6.1.2.2 Methodology and results The tie points are extracted automatically from the images, using the [Harris and Stephens, 1988] operator. The successive bundle adjustment, performed with 2485 tie points, recovered the closed configuration of the camera poses as well as the 3D object points (Figure 6.6). In Figure 6.7 the retrieved point cloud of the imaged object is shown. 6.1.2.3 Considerations The images could be successfully oriented by means of the bundle method (final RMSE of the image residuals resulted 0.57 pixels). Despite of the higher number of object points, the modeling of the dinosaur is still problematic, as the recovered points are not enough for a complete and detailed surface reconstruction. Dense matching algorithms should be applied to retrieve precisely the object surface.
93
Chapter 6. EXPERIMENTS
Figure 6.6. Camera positions and 3D object coordinates recovered after the bundle adjustment.
Figure 6.7. Automatically recovered 3D points cloud of the small object.
6.1.3 A Buddha tower of Bayon, Angkor, Cambodia 6.1.3.1 Problem and goal To evaluate the performances of the wide baseline orientation strategy, three images (Figure 6.8), acquired with a Minolta Dynax 500si SRL camera and afterwards digitized, are used. The camera interior parameters are known. The images belong to a sequence of 16 photos acquired around a very complex tower of the famous Bayon temple in the ancient city of Angkor Thom, Cambodia [Visnovcova et al., 2001; Grün et al., 2001]. The images are first pre-processed with Wallis filter [Wallis, 1976] for radiometric equalization and especially contrast enhancement. The filter enables a strong enhancement of the local contrast by removing low-frequency information in an image, retaining edge details. 6.1.3.2 Methodology and results The [Lowe, 2004] detector is applied to extract interest regions from the images. In fact, a first test performed with interest points was not successful. The extracted regions are matched using the information provided by the operator and based on the Euclidean distance of their feature vectors. Based on these putative correspondences, the epipolar geometry is computed, with robust estimators and used to perform a new guided matching. To join the two image pairs, threefold correspondences are used as described in Section 4.2.2.6 (Figure 6.10). Finally all the points (Table 6.1) are imported in a bundle adjustment (iWitnessTM) to retrieve the camera exterior
94
Section 6.1. Automated markerless tie point extraction
B
A
C
Figure 6.8. An original image of the smiling face of Bayon (left) and the three analyzed images, after Wallis filter enhancement.
parameters (Figure 6.9). First a relative orientation between the first two images is performed and then the third image is added to the adjustment. The final RMSE of the image residuals resulted 0.71 pixels.
~37o
~31o
Figure 6.9. Recovered camera poses of the 3 widely separated images. Table 6.1. Results of the tie points extraction in the 3 widely separated images
Extracted regions matched A-B
A
B
C
18122
16778
17715
197
matched B-C new matched points A-B
902 16
new matched points B-C Points in 3 images (matched A-B-C) Total numb. 3D points
7 10 1047
6.1.3.3 Considerations The 3 wide baseline images could be oriented using a region detector and descriptor, as single corners were not matchable. The achieved RMSE of the image residuals reflects the fact that regions are not so precise as points (Appendix A). The recovered camera parameters can afterwards be used for an automated matching procedure for the reconstruction and modeling of the object [Grün et al., 2001].
95
Chapter 6. EXPERIMENTS
Figure 6.10. Recovered epipolar geometry between three images with very wide baseline and scale changes. A region detector is used to find the first correspondences and estimate the relative orientation. Afterwards it is refined with a guided LSM matching.
96
Section 6.2. 3D modeling of an architectural object
6.2 3D modeling of an architectural object 6.2.1 Problem and goal The object has been imaged from two widely separated views (courtesy of Sabry El-Hakim, NRC Canada, for the image data and interior camera parameters). The goal is to recover automatically the camera poses and model the building. Due to the large baseline (base-to-distance ratio ca 1:0.7), corners cannot be automatically matched and regions should be employed.
Figure 6.11. The two widely separated images of the building in Dublin, Ireland.
6.2.2 Methodology and results The image orientation is achieved by means of a region detector followed by a bundle adjustment (iWitnessTM). The correspondences are automatically extracted with [Lowe, 2004] operator and then their location improved by means of LSM (Appendix A - Section 5). Furthermore outliers are rejected by means of RANSAC robust estimator (Figure 6.12).
Figure 6.12. Correspondences automatically extracted from the images with a region detector and a robust estimator to eliminate wrong correspondences.
55 tie points are used for the relative orientation of the images (Figure 6.13) and the final mean image residual of the computed object coordinates is 0.17 pixels. For the object reconstruction, ShapeCaptureTM software is used. The main corners are identified interactively and afterwards associated to the relative surfaces for the polygonal model generation. The final textured 3D model of the building is shown in Figure 6.14.
6.2.3 Considerations The points automatically extracted with the region detector and descriptor algorithm are well distributed and sufficient for the image orientation phase. On the other hand they are not sufficient for the object reconstruction as they are not located on the main edges, useful for the complete
97
Chapter 6. EXPERIMENTS
3D modeling of the building. Therefore, even if automation can be inserted in the orientation step of the image-based modeling pipeline, manual interaction is still required to correctly reconstruct all the details of this kind of architectural objects, in particular if the images are acquired under a wide baseline. Linear features might be used in the modeling procedure to reduce the user interaction.
Figure 6.13. The recovered camera poses of the two widely separated views.
Figure 6.14. Two views of the final textured 3D model of the building.
98
Section 6.3. Human body shape modeling from images
6.3 Human body shape modeling from images 6.3.1 Reconstruction of static human shape from an image sequence 6.3.1.1 Problem and goal Full human body modeling is generally performed with laser scanner systems, due to the fast, detailed and accurate acquisition. Image-based approaches are generally employed because of the cheaper technology. Common multi-image approaches are based on silhouette extraction (visual hull) while a challenge is the complete reconstruction of a human body using images acquired with a single camera (Section 5.2), moved around a static person. 6.3.1.2 Methodology and results Six images are acquired in front of a static human character with a Sony Cybershot still digital camera, with a resolution of 1600x1200 pixels and a pixel size of 4.5 micron. The images (Figure 6.15) span approximately 180 degrees azimuth coverage, with an average angle between two consecutive frames of 20 degrees. For the image orientation, tie points are automatically extracted as described in Section 4.2.
Figure 6.15. The 6 images used for the 3D reconstruction of the static character.
A total of 148 correspondences are found in the images and then imported in a bundle adjustment (SGAP). Three control points are imported for the absolute orientation of the images. The parameters for the correction of the camera constant and the first term of the radial lens distortion turned out to be statistically significant. The theoretical precision of the tie points was σX = 4.5 mm, σY = 4.8 mm, σZ = 6.2 mm while the standard deviation of unit weight a posteriori was 1.8 micron. The computed camera poses and 3D coordinates of the tie points are shown in Figure 6.16.
Figure 6.16. The recovered camera poses and object coordinates of the images. In the rear part of the 3D data the structure of the bars can be distinguished.
Afterwards, a matching algorithm on triplets of images is used, to get a dense 3D point cloud of the human body (Section 5.2). The 3D coordinates of each matched triplet are computed by forward intersection using the results of the orientation process. At the end, all the points are joined together to create a unique point cloud. After a filtering process, a uniform 3D point cloud is 99
Chapter 6. EXPERIMENTS
Figure 6.17. The recovered 3D point cloud before (left) and after the filtering process, also visualized with pixel color intensity (right).
obtained, as shown in Figure 6.17. The generation of a surface model from the recovered unorganized point cloud requires non standard procedures and commercial packages could not turn the data into a correct mesh. Therefore, for realistic visualization of the results, each point of the recovered point cloud is re-projected onto an image of the sequence (according to the viewpoint) to get the related pixel color. 6.3.1.3 Considerations The presented method for complete reconstruction of the human body requires a 360 degrees azimuth coverage. The data acquisition lasts ca. 45 seconds (less time is necessary if a camcorder is used) and requires no movements of the person. This could be considered a limit of the procedure, if we consider that full body laser scanners require approximately 15 seconds for the data acquisition. Nevertheless the recovered 3D data are computed with a mean accuracy which is required for animation and visualization purposes, or in biometric applications with medium accuracy requirements. The naked skin of the person is certainly a limit for the surface matching procedure. For this reason the performance of the surface measurement process was improved with a local contrast enhancement of the images (Wallis filter). Further improvements of the measurement approach can be achieved using more closely separated images.
6.3.2 Face modeling from existing videos 6.3.2.1 Problem and goal Nowadays it is very common to find image streams acquired with a fix camera, like in forensic surveillance, movies and sport events. Due to the complicate shape of the human body, a fix camera imaging a moving character cannot correctly model the whole shape, unless we consider small part of the body (e.g. head, arm or torso). In particular, face modeling has been investigated since 20 years in the graphic community. Due to the symmetric form and geometric properties of the human head, the modeling requires very precise measurements. A part from laser scanner, most of the single-camera approaches are model-based (requiring fitting and minimization problems) [Fua, 1999; Shan et al., 2001] while few methods recover the 3D shape through a camera model [D’Apuzzo, 1998]. In the movies, we can often see a static camera filming a rotating head. Therefore we can try to model the head considering the camera as moving around it and assuming that the head is not deforming during the movement. An image sequence (Figure 6.18), found on the Internet and with a resolution of 256x256 pixels, is analyzed with the goal of reconstructing a 3D model of a face.
100
Section 6.3. Human body shape modeling from images
Figure 6.18. Few frames (out of 16) of a sequence (256x256 pixel) showing a rotating head.
6.3.2.2 Methodology and results The image sequence (Figure 6.18) show a person who rotates his head. No camera and scene information is available and, for the processing, we consider the images as acquired by a moving camera around a fix head. Due to the small region of interest (the head) and the very short baseline, the corresponding points for the image orientation are selected manually in the first frame and then tracked automatically in all the other images (Section 4.2.1). For the datum definition and the initial space resection, four points extracted from a face laser scanner data set are used (eyes, nose and mouth). Afterwards, the camera parameters are recovered with a bundle-adjustment without self-calibration. The recovered epipolar geometry is displayed in Figure 6.19. Finally, a matching process is applied on image triplets to get the 3D point cloud of the head. The results, with related pixel intensity, are shown in Figure 6.20.
Figure 6.19. Recovered epipolar geometry in two triplets of images.
Figure 6.20. Recovered 3D model of the moving head, displayed with pixel intensity.
6.3.2.3 Considerations It has been shown that the use of existing image data allow to re-create virtual actors who might be dead or unavailable for common digitization techniques. Despite of the low image resolution (256x256 pixel), the surface measurement algorithm performed quite well and the recovered 3D data could now be used for animation purposes.
101
Chapter 6. EXPERIMENTS
6.4 Photogrammetric analysis of monocular videos The aim of the next two examples is to recover the camera parameters and to extract metric information and 3D models from existing monocular videos of sport games. Sport videos are usually filmed with a rotating camera mounted on a tripod or carried on the shoulder of a camera-man. In our case, no camera information is available, while the dimensions of the basketball court are known. The goal is not to recover highly precise measurements but to demonstrate the potentiality of the photogrammetric processing and to obtain 3D virtual characters for animation and visualization purposes.
6.4.1 The dunking sequence The sequence presented in Figure 6.21 was digitized from an existing videotape (CBS/FOX Video Sport, 1989) with a Matrox DigiSuite frame grabber. A rotation and a zooming of the camera are occurring during the video acquisition. The camera is far away from the scene and most probably set on a rotating tripod. Twenty-one frames are considered; the interlaced images have a size of 720x576 pixels and due to the low image quality and small scale, the image measurements are performed manually. A right-hand coordinate system with the origin in the left corner of the court is defined (vertical Y axis and X axis parallel to the shortest side of the court) and some control points are set knowing the dimensions of the basketball field. Y Z X
Figure 6.21. Few frames (out of 21) of the dunking sequence (720x576 pixel) digitized from a VHS tape. Interlace, blur effects and the low image resolution are visible. The camera is clearly rotating and zooming.
6.4.1.1 Calibration and orientation The calibration and orientation process is performed with a self-calibrating bundle adjustment. Because of the zooming effect, a frame-invariant AP set is used. All the system observations and unknowns are treated as stochastic variables. The diagram of the recovered focal length (Figure 6.22, upper right) shows the visible zoomingin effect of the camera, except for the last 3 frames (not displayed in Figure 6.21). The pixel scale factor (sx) resulted 1.11. Because of the low precision of the image measurements (σ0,priori = 2 pixels) and the network geometry, the principal point and the lens distortion terms could not be
102
Section 6.4. Photogrammetric analysis of monocular videos
Figure 6.22. An image of the analyzed sequence with the used tie points (upper left). The recovered focal length (upper right) and the B/H ratio (lower left). The distance of the camera perspective center from the origin of the reference system (lower right).
computed reliably. The final standard deviation of unit weight a posteriori resulted 1.4 pixels while the RMSEs of image coordinates residuals are 38.45 μm in x and 29.08 μm in y (1 pixel = 25 μm). The recovered B/D ratio (Figure 6.22 lower left) presents oscillations due to the fact that not all consecutive frames have been analyzed. 6.4.1.2 Metric measurements of the dunk movement Once the images are oriented, the 3D coordinates of the tie points can be used to derive measurements of static objects in the scene. In this example, to retrieve the measurements of the human movement, the results of Section 2.4.1 are used. Unfortunately, due to the camera and human movements, the scenario changes and it is not always possible to determine the required reference distance (Equation 2.2) or the entire movement of the person. Therefore a mosaic of the action should be created (Figure 6.23), to be able to see in the same image the reference plane (e.g. the floor) and the distance of interest (e.g. the height of the jump). To generate a mosaic with a projective transformation (Section 2.3) we have to assume that the scene is considerably far away from the rotating camera. This can be easily assumed, as the computed mean B/D (baseto-distance) ratio between the analyzed frames is 0.002 (Figure 6.22). The mosaic is realized measuring the corresponding points manually and computing the transformation parameters with a least squares adjustment. Then the transformed images are merged together automatically, as described in Section 2.3.1.
103
Chapter 6. EXPERIMENTS
=>
Figure 6.23. The three images used to create the mosaic of the player’s movement and the resulted mosaic.
Using the created mosaic, the length of the jump and its height can be derived. At first the vanishing points of the mosaic image are recovered. Due to the low image quality, a line detector did not produce accurate results; therefore with manual measurements, the end points of the segments representing the convergent lines are identified in each direction and then Equation 4.38 is applied. Afterwards some reference distances (Figure 6.24), required to recover the movement lengths, are measured in the image: - the height of the basket (Hr=3.05 m): the base point b is identified as the intersection between (1) the line through the top point t on the basket and the vertical vanishing point v3 and (2) the line through the vanishing point v1 and the point i (middle point of the upper area); - the distance between the baseline and the free-throw line (H’r=5.8 m); - the width of the ‘3 second’ area (H’’r=4.9 m).
Figure 6.24. Distances between parallel planes with respect to a reference plane. The reference distances on the basketball field (above) and the distances measured to recover the length and height of the jump (below) are shown.
104
Section 6.4. Photogrammetric analysis of monocular videos
Then this knowledge and Equation 2.22 are used to recover the lengths of the jumping movement reported in Table 6.2. To compute the length of the jump, we suppose that the player is moving on a vertical plane, perpendicular to the basketball court and defined by his starting and ending positions. To check the metrology technique, its reliability and repeatability, each measure is repeated three times: the reported measures are an average of the results while in the last column of Table 6.2 the standard deviations of the measures are shown. The correct height of the (standing) jumping player is 1.98 m while the height of the second player is 2.01 m [www.nba.com]. Table 6.2. Recovered measurements of the dunking action of Figure 6.21 and relative standard deviations. Measurements
length [m]
standard dev [cm]
height of the player at the beginning of the jump
1.71
2.7
height of the player at the end of the jump
1.52
2.3
length of the jump (b1b3)
4.94
3.7
height of the jump (ball)
3.28
3.0
height of the jump (waist)
2.02
2.8
height of the second player
1.97
2.8
6.4.1.3 3D modeling of the moving character The 3D reconstruction of the moving character is performed as described in Section 5.4. The human joints are measured manually in the selected keyframes. In fact, due to the interlaced video and very low image quality, no automated measurement or tracking process could be performed. Once the 3D skeletons are recovered (Figure 6.25), to improve the visual quality and the realism of the reconstructed 3D data, a laser scanner human body model [CyberwareTM] is fitted onto the photogrammetric data (Figure 6.26). The reconstructed 3D models are afterwards imported in MayaTM for further visualization, animation and generation of new viewpoints of the analyzed scene. The inverse kinematics method and a skinning process are respectively used to animate the model and bind the polygonal mesh with the photogrammetric skeleton (Section 5.4.2.1). As shown in the results, the semi-automatic fitting process produced satisfactory results. The camera viewpoint is also changed to render new virtual views of the dunking scene. Figure 6.27 presents a close view of areas of the polygonal model subordinated to strong deformations during the movements. Despite of the complex movements and strong deformations, the use of the lattices helped to realistically render critical areas like feet and shoulders.
105
Chapter 6. EXPERIMENTS
Figure 6.25. 3D models of the moving character visualized in skeleton form from different viewpoints.
Figure 6.26. The polygonal model fitted onto the recovered 3D skeletons. The model can also be textured with the real face of the player (right image).
Figure 6.27. The feet and the shoulders of the character have been constraint using the deformation lattices, which help to correctly model areas subordinated to strong deformation.
106
Section 6.4. Photogrammetric analysis of monocular videos
6.4.2 The walking sequence The video sequence presented in Figure 6.28 consists of 9 frames digitized from a videotape (CBS/FOX Video Sport, 1989) with a Matrox DigiSuite frame grabber. The image size is 720x576 pixels; the camera is rotating (on the shoulder of a camera-man) and no zooming effects are present. The reference system has the origin in the left corner of the basketball field, with vertical Y axis and X axis parallel to the shortest side of the field (see Figure 6.21).
Figure 6.28. Few frames of the walking sequence digitized from a VHS tape (PAL resolution).
6.4.2.1 Calibration and orientation Due to the low quality of the images (interlaced video and blur effects), the image measurements are performed manually and afterwards imported as weighted observations in a bundle adjustment (SGAP). Weights are also used for all the system unknown parameters. At first, for each single frame, DLT and space resection are used to get an approximation of the camera parameters. Then a bundle adjustment is applied to recover all the unknown parameters (σ0,priori = 1.5 pixel) with 2 different computational versions: 1. Bundle with frame-invariant AP sets (Table 6.3): this version (9 sets of APs) recovered a constant value for the scale factor and a mean focal length value of 22.4 mm, even if the oscillations reported in Figure 6.29 suggested to use a block-invariant AP configuration. Moreover the other APs were not significant in all the images. Therefore, to avoid an over-parameterization of the system, they were not computed. The behavior of the recovered EO parameters is nevertheless consistent with the images, as shown in Figure 6.29. X0 and Y0 are increasing while Z0 is slowly decreasing. 2. Bundle with block-invariant AP set (Table 6.3): this version recovered very similar results compared to the frame-invariant version (Figure 6.30). Moreover, the k1 parameter for the radial lens distortion could also be determined. The non-unity of the pixel scale factor can come from the old videocamera or because of the used frame grabber. Table 6.3. Results of the adjustments with frame- and block-invariant APs (in parenthesis the standard deviations of some parameters). Frame-invariant APs
Block-invariant APs
Mean focal length
22.4 mm (0.26 mm)
Focal length
22.71 mm (0.14 mm)
Mean scale factor
1.1105 (1.61e-3)
Scale factor
1.1192 (7.82e-3)
RMSE_x
24.8 μm
RMSE_x
29.7 μm
RMSE_y
18.6 μm
RMSE_y
22.1 μm
k1
-
k1
-4.36e-4 (3.94e-5)
σ0,post
1.24 pixel
σ0,post
1.29 pixel
107
Chapter 6. EXPERIMENTS
Figure 6.29. The measured tie points in one image of the sequence (upper left). The behavior of the recovered focal length (upper right). The motion of the camera in terms of position and rotation angles (bottom).
Figure 6.30. The motion of the camera recovered with a block-invariant AP set (left: positions, center: angles). The influence of the APs on the image grid, 3 times amplified (right). The visible large effect of the scale factor can come from the old videocamera or because of the used frame grabber.
108
Section 6.4. Photogrammetric analysis of monocular videos
6.4.2.2 3D modeling of the moving character The 3D coordinates of the human joints are recovered as described in Section 5.4 (Figure 6.31). First the skeleton of each single frame are reconstructed and then they are transformed into the global reference system.
Figure 6.31. Recovered 3D scene, camera poses and reconstructed moving character displayed in skeleton form with and without artificial background.
The 3D skeletons are afterwards used in a fitting process to animate the virtual character. An HAnim character and a polygonal human model obtained with laser scanner measurements [CyberwareTM] are fitted onto the recovered skeletons and afterwards animated by keyframing using the animation tools of MayaTM (Figure 6.32).
Figure 6.32. Fitted H-Anim and laser scanner model onto the recovered skeletons. The fitting and rendering are performed using the animation tools of MayaTM.
109
Chapter 6. EXPERIMENTS
6.5 Cultural Heritage object modeling In the last years the documentation, virtual reconstruction and digital preservation of Cultural Heritage (CH) objects received great attention. In the next two sections, the image-based modeling of two heritages is presented. Image data is often the unique source of documentation and the use of photogrammetric techniques allow to recover accurate and detailed 3D models.
6.5.1 3D modeling of the Great Buddha of Bamiyan, Afghanistan The 3D modeling of the Great Buddha of Bamiyan, Afghanistan, was performed using three different types of imagery in parallel [Grün et al., 2004a]. In this section the results achieved using Internet images are reported. Out of the 15 images found on the Internet, four were selected for the processing (Figure 6.33). Two in front of the statue, one from the left side and one from the right side of the object. All others were not so suitable for photogrammetric processing because of very low image quality, occlusions or small image scale.
Figure 6.33. The four images found on the Internet used for the 3D modeling of the Great Buddha statue.
The main problems with these images are their differences in size and scale, the unknown pixel size and camera constant and, most of all, the different times of acquisition; therefore some parts visible in one image are missing in others (Figure 6.34). Also the illumination conditions (shadows) are very different and this can create problems with automatic matching procedures.
Figure 6.34. Changed details between the images (circles) and different illumination conditions (right).
For every image found on the Internet, the pixel size and a focal length are assumed, as well as the principal point, fixed in the centre of the images. With this last assumption, we consider the size of the found images as the original dimension of the photo, while in reality they could be just a part of an originally larger image. The assumed pixel sizes are between 0.03 mm and 0.05 mm. As no other information is available, we first performed an interactive determination of the camera positions, varying also the value of the focal length and using some control points derived
110
Section 6.5. Cultural Heritage object modeling
Figure 6.35. Recovered camera poses of the four Internet images (left and central image). The MPGC matching algorithm applied for the surface measurement with the resampled patches (right).
from a contours plot. Then we refined these approximations with a single photo spatial resection solution. The final orientation parameters were then recovered with a bundle adjustment. The image correspondences were measured semi-automatically with LSM. The final average standard deviations of the computed object point coordinates located on the Buddha itself and on its immediate vicinity are σx,y = 0.13 m and σz = 0.30 m. The recovered camera poses as well as the used tie and control points are shown in Figure 6.35. For the surface reconstruction, taking into consideration the scale and rotation differences among the images, a matching algorithm based on Multi-photo Geometrically Constrained (MPGC) least squares matching is applied [Grün et al., 2004a]. A point cloud of ca 6000 points is obtained (Figure 6.36, left). Some gaps are present in the cloud, because of surface changes due to the different time of image acquisition (Figure 6.34) and because of the low texture in some areas. For the conversion of the point cloud to a triangular surface mesh, a 2.5D Delaunay triangulation is applied and afterwards a textured model is generated (Figure 6.36, right).
Figure 6.36. Recovered point cloud of the statue, generated mesh and textured 3D model.
6.5.2 3D modeling of the empty niche of the Great Buddha of Bamiyan The niche of the Great Buddha of Bamiyan, Afghanistan (Figure 6.37), is nowadays a national monument protected by UNESCO. The modeling of the niche, approximately 60 m high and 20 m wide, is based on five images, acquired during a field campaign with a pre-calibrated Sony Cybershot F707. For the image orientation, the tie points were firstly measured semi-automati-
111
Chapter 6. EXPERIMENTS
Figure 6.37. Three (out of five) images (1920x2560 pixel) of the empty niche of the Great Buddha of Bamiyan, Afghanistan, as seen in August 2003.
cally by means of least squares matching and then imported in a bundle adjustment (SGAP) to recover the camera parameters and object coordinates. Then, the results were compared (Table 6.4) with those achieved extracting the tie points automatically (Section 4.2.2), using the [Förstner and Gülch, 1987] operator. The automated procedure could extract a great number of correspondences (388 points) which were then used for the image orientation (Figure 6.39). After the adjustment, the estimated accuracy of the 3D object coordinates resulted in the same order of the manual measurements (Table 6.4). This was expected, given the good texture and resolution of the images. Table 6.4. Comparing results between manual and automated tie points measurements. Number of extracted points and achieved theoretical precisions (STD) are reported. manual
automated
# images
5
5
# tie points
24
388
-
253
24
135
STD X [m]
0.014
0.012
STD Y [m]
0.017
0.019
STD Z [m]
0.021
0.021
points in 2 images points in 3 or more images
After the image orientation, as automated surface measurements approaches could not completely recover the detailed geometry of the object, manual measurements were performed on three stereo-models for the accurate 3D reconstruction of the niche. Points were measured along horizontal profiles, while the main edges as breaklines. Thus a point cloud of ca 12 000 points was generated and afterwards triangulated in a commercial reverse engineering software [GeomagicTM]. The final 3D model of the empty niche is shown in Figure 6.40.
112
Section 6.5. Cultural Heritage object modeling
Figure 6.38. The epipolar geometry between two images, automatically recovered by means of interest points and robust estimators (above). Two close views to show the accurate location of the epipolar line (bottom).
Y X Z Figure 6.39. The recovered camera poses using the automatically extracted tie points.
113
Chapter 6. EXPERIMENTS
Figure 6.40. 3D model of the empty niche of the Great Buddha of Bamiyan, Afghanistan, reconstructed with manual measurements to recover all the small details required in CH documentation projects. A textured, shaded and wireframe 3D model are presented.
114
7 CONCLUSIONS
7.1 Summary of the achievements The presented dissertation has investigated different problems of the image-based modeling technique for object and human character 3D reconstruction. Both automated image orientation and interactive approaches for object reconstruction have been discussed and presented. The work developed a consistent and reliable approach for automated markerless orientation of image sequences. It was demonstrated with different practical examples, using self-acquired images and existing stills or videos. Moreover we showed how photogrammetry can be used to analyze existing monocular videos, maybe acquired with a rotating camera, to recover camera and scene information. 3D models of moving human characters have been also reconstructed, primarily for visualization and animation purposes. For the automated tie point extraction phase, programs for the features extraction and the relative orientation between image pairs and triplets were implemented, together with a graphical tool to display the recovered correspondences and epipolar geometry. For the performed bundle adjustments, existing program were used. Concerning the human reconstruction from monocular videos, programs were developed to recover 3D models from single images and to combine them under the same reference system in case of image sequence analysis.
7.2 Automated markerless image orientation The possibility to automatically orient an image sequence heavily depends on the type of images, acquisition and scene. Compared to other research works, the developed method for the automated tie point extraction and image orientation relies on accurate feature locations achieved
115
Chapter 7. CONCLUSIONS
using least squares matching and a statistical analysis of the matched and adjustment results. The tie point extraction phase has certain limitations: (1) the images should have good content of information, otherwise no features can be automatically detected; (2) the images should not be very apart, otherwise the correspondences cannot be reliably and fully automatically extracted. Nevertheless it has been shown that interest regions can be employed for the registration of widely separated views (Section 4.2.3; Section 6.1.3; Section 6.2). Given a certain sequence of frames, it is not always possible to perform a photogrammetric selfcalibration. In fact, most of the existing sequences have only a one-direction movement and most of the acquisitions which are optimal for scene reconstruction are very different from those that allow a complete camera calibration process. Therefore, in practical cases, rather than simultaneously calibrate and reconstruct, it may often be better first to calibrate the camera using the most appropriate network (with or without control points) and afterwards recover the object geometry using the calibration parameters. Self-calibration, if performed, should not recover only the camera focal length, as this value can be read in the header of the digital images. A complete calibration should be performed, if possible, in particular for the compensation of the systematic errors. In case of architectural object modeling, the tie points automatically extracted do not always help in the 3D reconstruction phase, as shown in Section 6.2. In fact, due to the large image baseline, corners useful in the surface modeling cannot be matched automatically and other points, located on the main edges, must be measured interactively by the operator for the complete object modeling. With the experiments of Section 6, performed on middle and wide baseline images, we showed that under certain conditions, automated markerless image orientation is really feasible. Therefore the approach could also be used for other applications, like autonomous navigation [Roncella et al., 2005].
7.3 3D models from images Creating geometrically correct, detailed and complete 3D models of complex objects remains a difficult problem and still a great topic of investigation, in particular if automated procedure are employed. If the goal is the creation of accurate and complete 3D models of medium and large scale objects under practical situations using only information contained in the images, then full automation is still in the future. We have shown that we can photogrammetrically reconstruct even fairly complex structures e.g. from Internet images (Section 6.5.1), without any pre-knowledge about those images. However, in such automatically reconstructed 3D model we might miss essential small features and some important edges. Therefore for the generation of a complete and detailed model and in architectural applications, semi-automated or manual photogrammetric measurements are still indispensable. Thus automated measurements are theoretically more precise than manual ones, it depends how they are performed. On single points (e.g. targets), they can get an accuracy better than 1/25 of a pixel (with least squares template matching) but within an automated process they can miss important features and smooth out the results (Section 3.4.1). Advanced matching strategies (for example Zhang, 2005), able to combine point and linear features, could lead to very detailed 3D models also in close-range photogrammetry. So far, to recover complete and detailed 3D models, parts of the process that can straightforwardly be performed by humans, such as modeling of occluded regions, extracting seed points, topological surface segmentation and texture mapping, remain interactive; those parts of the modeling best performed by the computer, such as features extraction, point correspondences, image registration and modeling of segmented regions should be automated.
116
Section 7.4. Human character reconstruction
7.4 Human character reconstruction An image-based method to recover the 3D shape of a human body was developed (Section 5.2). It produces 3D point clouds of human bodies which can be used for visualization or animation purposes or in biometric applications with medium accuracy requirements. On the other hand, the presented analysis of existing videos (Section 5.4) showed that it is possible to reconstruct virtual human characters which may be dead or unavailable for other modeling techniques (like motion capture or laser scanning). Unfortunately, existing videos have no stereo information, therefore the modeling process has to face the ill-posed problem of recovering 3D data from a monocular stream of images. This problem has been solved using constraints and assumptions on the imaged scene as well as on the human’s shape and movement together with a deterministic approach. All the other approaches (Table 5.1) are model-based, e.g. a predefined human model is fitted onto the image data, to avoid ill-posed problems and occlusions, but requiring expensive minimizations to recover all the system parameters. Our approach first retrieves the camera parameters and then the 3D shape of the character in a skeleton form. Then, for visualization purposes, virtual human characters (derived with laser scanner or defined in the H-ANIM standard) are fitted onto the recovered human skeleton, providing more realistic results. With the recovered 3D data, new scene viewpoints can be generated while the character movements can be analyzed and visualize through the recovered 3D poses (keyframing). The procedure requires manual interaction for the measurements of the human joints, as the low image quality, small scale and interlace video do not allow automated tracking procedures. As mainly existing videos were analyzed, where usually no reference information is available, no validation of the developed approach was carried out. In fact, the goal was to develop a generic method suitable for any image sequence and where small modifications might be required, to accommodate any kind of image acquisition and human motion.
7.5 Future work At the moment, there is no ideal 3D acquisition and modeling system, as all depend on the illumination conditions, object size and location, occlusions and project requirements. The existing commercial software for image-based 3D modeling can accommodate and process different kind of images, almost without restrictions, as long as the processing is done manually. Therefore the development of a process able to automatically generate complete and precise 3D models from any set of close-range images should take into consideration all the above mentioned factors. However, automation should not be the main goal, as in many applications, accuracy and completeness are the main requirements. But less interaction in the image-based modeling technique should be enforced. Automated markerless orientation is feasible and it has been demonstrated but the topological surface segmentation (for architectural objects) and the texture mapping phase (for complex objects) are the areas where the human interaction is still more required and where further investigations are necessary. The interactive topological surface segmentation allows to recover correct mesh models, without wrong triangles, in particular in case of complex architectures and sparse point clouds. The texture mapping phase still requires the user interaction for the selection of the best image to be mapped. Automation in these phases would increase and enforce the image-based modeling approach, in particular in those fields where digital archiving and documentation are more and more required. But the increasing and broader use of range sensors is leading to the integration of both approaches. So far, it seems to be an effective modeling solution for complex objects: the fine details (e.g. a relief) can be better modeled with range sensors while a large structure (e.g. a facade) can be recorded using image data. Photogrammetry alone would be much more cheaper
117
Chapter 7. CONCLUSIONS
and also potentially able to reproduce the fine details without smoothing effects, but it can be time consuming and impractical if performed entirely manually by an operator. Therefore advanced surface reconstruction algorithm, able to produce dense and detailed results should be developed, maybe integrating area-based and featured-based matching strategies. One actual great limitation is the mesh generation starting from sparse, uneven and unorganized point clouds. Commercial reverse engineering software can correctly triangulate only dense point clouds (e.g. from laser scanner measurements), but cannot generate complete surface models from sparse point clouds. Smart triangulation algorithms should be developed to cope with these cases. One possibility would be the development of an ‘online meshing’ process during the point measurement phase. In fact, when the measurements are done in manual or semi-automated mode, it is crucial for the operator to understand the functional behavior of the subsequent mesh generation program. Therefore an online modeler would be very beneficial as during the point measurement phase the result of the mesh generation could be directly plotted onto the stereomodel and the operator could immediately control the agreement between the measurements and the online 3D model. A last important area for future research is the generation of virtual human characters from existing monocular videos, using a deterministic approach. In our work, single frames have been analyzed, generating simple human skeleton. A possibility would be to consider, at the same time, multiple frames of the same person and apply a surface matching to recover also the surface information and not only the poses of the main human joints.
118
Appendix A Detectors and descriptors
A.1 Operators for photogrammetric applications Many photogrammetric and computer vision tasks rely on features extraction as primary input for further processing and analysis. Features are mainly used for images registration, 3D reconstruction, motion tracking, robot navigation, recognition, etc. Markerless automated procedures based on image features assume the camera (images) to be in any possible orientation: therefore the features should be invariant under different transformations to be re-detectable and useful in the procedure automation. We should distinguish between detectors and descriptors. Detectors are operators which search 2D locations in the images (i.e. a point or a region) geometrically stable under different transformations and containing high information content. The results are generally called interest points or corners or affine regions or invariant regions. Descriptors instead analyze the image providing, for certain positions (e.g. an interest point), a 2D vector of pixel information. This information can be used to classify the extracted points or in a matching process. Photogrammetry usually deals with detectors (mainly of interest points), for 3D reconstruction and image orientation. Vision algorithms use also regions, due to detection, recognition and navigation applications.
A.2 Point and region detectors A.2.1 Point detectors Many interest point detectors exist in the literature and they are generally divided in contour based methods, signal based methods and methods based on template fitting. Contour based detectors search for maximal curvature or inflexion points along the contour chains. Signal based detectors analyze the image signal and derive a measure which indicates the presence of an interest point. Methods based on template fitting try to fit the image signal to a parametric model of a specific type of interest point (e.g. a corner). The main properties of a point detector are: (1) accuracy, i.e. the ability to detect a pattern at its correct pixel location; (2) stability, i.e. the ability
119
Appendix A. Detectors and descriptors
to detect the same feature after that the image undergoes some geometrical transformation (e.g. rotation or scale), or illumination changes; (3) sensitivity, i.e. the ability to detect feature points in low contrast conditions; (4) controllability and speed, i.e. the number of parameters controlling the operator and the time required to identify features. Among the different interest point detectors presented in the literature, the most used operators are afterwards shortly described: • Moravec detector [Moravec, 1979]: it computes an un-normalized local autocorrelation function of the image in four directions and takes the lowest result as the measure of interest. Therefore it detects point where there are large intensity variations in every direction. Moravec was the first one to introduce the idea of point of interest. • Hessian detector [Beaudet, 1978]: it calculates the corner strength as the determinant of the Hessian matrix (IxxIyy-I2xy). The local maxima of the corner strength denotes the corners in the image. The determinant is related to the Gaussian curvature of the signal and this measure is invariant to rotation. An extended version, called Hessian-Laplace [Mikolajczyk and Schmid, 2004] detects points which are invariant to rotation and scale (local maxima of the Laplacianof-Gaussian). • Haralik operator [Haralik, 1985]: it first extracts windows of interest from the image and then computes the precise position of the point of interest inside the selected windows. The windows of interest are computed with a gradient operator and the normal matrix. The point of interest is determined as the weighted centre of gravity of all points inside the window. • Harris detector [Harris and Stephens, 1988] (or Plessey feature point detector): similar to Moravec operator, it computes a matrix related to the auto-correlation function of the image. The squared first derivatives of the image signal are averaged over a window and the eigenvalues of the resulting matrix are the principal curvatures of the auto-correlation function. An interest point is detected if the found two curvatures are high. Harris points are invariant to rotation. An extended version, called Harris-Laplace [Mikolajczyk and Schmid, 2001] detects points which are invariant to scale and rotation. • Förstner detector [Förstner and Gülch, 1987]: it uses also the auto-correlation function to classify the pixels into categories (interest points, edges or regions). The detection and localization stages are separated, into the selection of windows, in which features are known to reside and feature location within the selected windows. Further statistics performed locally allow estimating automatically the thresholds for the classification. The algorithm requires a complicate implementation and is generally slower compared to other detectors. • Heitger detector [Heitger et al., 1992]: derived from biological visual system experiments, it uses Gabor filters to derive 1D directional characteristics in different directions. Afterwards the first and second derivatives are computed and combined to get 2D interest locations (called keypoints). It requires a lot of image and CPU processing. • Susan detector [Smith and Brady, 1997]: it analyzes different regions separately, using direct local measurements and finding places where individual region boundaries have high curvature. The brightness of each pixel in a circular mask is compared to the central pixel to define an area that has a similar brightness to the centre. Computing the size, centroid and second moment of this area, 2D interest features are detected.
A.2.2 Region detectors The detection of image regions, invariant under certain transformations, has received great interest, in particular in the vision community. The main requirements are that the detected regions should have a shape which is a function of the image transformation and automatically adapted to cover always the same object surface. Under a generic camera movement (e.g. translation), the most common transformation is an affinity, but also scale-invariant detectors have been devel-
120
Section A.3. Descriptors
oped. Generally an interest point detector is used to localize the points and afterwards an elliptical invariant region is extracted around each point. Methods for detecting scale-invariant regions were presented in [Lindeberg, 1998; Kadir and Brady, 2001; Jurie and Schmid, 2004; Lowe, 2004]. Generally these techniques assume that the scale change is constant in every direction and search for local extrema in the 3D scale-space representation of an image (x, y and scale). In particular, the DoG (Difference of Gaussian) detector [Lowe, 2004] showed high repeatability under different tests: it selects blob-like structures by searching for scale-space maxima of a DoG. On the other hand, affine-invariant region detectors can be seen as a generalization of the scaleinvariant detectors, because with an affinity, the scale can be different in each direction. Therefore shapes are adaptively deformed with respect to affinities, assuming that the object surface is locally planar and that perspective effects are neglected. A comparison of the state of the art of affine region detectors is presented in [Mikolajczyk et al., 2004]. The most common affine region detectors are: • Harris-affine detector [Mikolajczyk and Schmid, 2002]: the Harris-Laplace detector is used to determine localization and scale while the second moment matrix determine the affine neighbourhood. • Hessian-affine detector [Mikolajczyk and Schmid, 2002]: the Harris-Laplace detector detects the points while the elliptical regions are estimated with the eigenvalues of the second moment matrix. • MSER (Maximally Stable Extremal Region) detector [Matas et al., 2002]: it extracts regions closed under continuous transformation of the image coordinates and under monotonic transformation of the image intensities. • Salient Regions detector [Kadir et al., 2004]: regions are detected measuring the entropy of pixel intensity histograms. • EBR (Edge-Based Region) detector [Tuytelaars and Van Gool, 2004]: regions are extracted combining interest points (detected with the Harris operator) and image edges (extracted with a Canny operator). • IBR (Intensity extrema-Based Region) detector [Tuytelaars and Van Gool, 2004]: it extracts affine-invariant regions studying the image intensity function and its local extremum.
A.3 Descriptors Once image regions invariant to a class of transformations have been extracted, (invariant) descriptors are computed to characterize the regions. The region descriptors have proved to successfully allow (or simplify) complex operations like wide baseline matching, object recognition, robot localization, etc. Between the proposed descriptors, the most used are: • SIFT descriptors [Lowe, 2004]: the regions extracted with DoG detector [Lowe, 2004] are described with a vector of dimension 128 and the descriptor vector is divided by the square root of the sum of the squared components to get illumination invariance. The descriptor is a 3D histogram of gradient location and orientation. It was demonstrated with different measures and tests that the SIFT descriptors are superior to others [Mikolajczyk and Schmid, 2003]. An extended SIFT approach was presented in [Mikolajczyk and Schmid, 2005]: it is based on a gradient location and orientation histogram (GLOH) and the size of the descriptor is reduced using PCA (Principal Component Analysis). • Generalized moment invariant descriptors [Van Gool et al., 1996]: given a region, the central moments Mapq (with order p+q and degree a) are computed and combined to get invariant descriptors. The moments are independent, but for high order and degree, they are sensitive to geometric and photometric distortion. These descriptors are suitable for color images.
121
Appendix A. Detectors and descriptors
• Complex filters descriptors [Schaffalisky and Zisserman, 2002]: regions are firstly detected with Harris-affine or MSER detector. Then descriptors are computed using a bank of linear filters (similar to derivatives of a Gaussian) and deriving the invariant from the filter responses. A similar approach was presented in [Baumberg, 2000]. Matching procedures can be afterwards applied between couple of images, exploiting the information provided by the descriptors. A typical strategy is the computation of the Euclidean or Mahalanobis distance between the descriptor elements. If the distance is below a predefined threshold, the match is potentially correct. Afterwards cross-correlation or Least Square Matching (LSM) [Grün, 1985a] can be applied while robust estimators can be employed to remove outliers in the estimation of the epipolar geometry.
A.4 Experimental setup and results Five interest point detectors and two region descriptors are analyzed and used for a comparison evaluation: Hessian, Förstner, Harris, Heitger, Susan operator and Lowe and Harris-affine detector/descriptor. The first five interest point detectors have been compared with different tests, as described in Section A.4.1 and Section A.4.2, while in Section A.4.3 the region detectors are also included. Other authors used different measures and criterion to do a performance evaluation of interest points or regions detectors [Brand and Mohr, 1994; Schmid et al., 2000; Mikolajczyk and Schmid, 2003]: given a ground-truth, the geometrical stability of the detected interest points is compared between different images of a given (planar) scene taken under varying viewing conditions. A comparison based on the detection speed is difficult to achieve, since the efficiency of a given feature detector depends on its implementation. In our work, the evaluation is performed calculating the number of correct corners detected (Section A.4.1), their correct localization (Section A.4.2) and analyzing the relative orientation results between stereo-pairs (Section A.4.3). In all the experiments, the results are checked by visual inspection. The operators used in the comparison have been implemented at the Institute of Geodesy and Photogrammetry (ETH Zurich), except Harris-affine [Mikolajczyk and Schmid, 2002] and Lowe [Lowe, 2004] operators which were available on the Internet.
A.4.1 Interest point detection under different image transformations A synthetic image containing 160 corners is created and afterwards rotated, distorted and blurred (Figure 8.1). Corners are detected with the described operators and compared with the groundtruth (160). In Table 8.1 the numbers of detected corners are presented. Förstner and Heitger performed always better than the other detectors in all the analyzed images.
A.4.2 Localization accuracy The localization accuracy is a widely used criterion to evaluate interest points. It measures whether an interest point is accurately located at a specific location (ground truth). The evaluation requires the knowledge of precise camera and 3D information or simply requires the precise 2D localization of the feature in image space. This criterion is very important in many photogrammetric applications like camera calibration or 3D object reconstruction. In our experiment, performed on Figure 8.2, the correct feature localization was achieved with manual measurements. The corners locations obtained from the different operators were afterwards compared with the manual measurements and the differences plotted, as shown in Figure 8.3. Heitger detector presents only 2 shifts of one pixel while Harris and Hessian detector have always a constant shift of one pixel.
122
Section A.4. Experimental setup and results
A
C
B
F
E
D
Figure 8.1. Synthetic images with 160 corners used to evaluate the performances of the corners detectors.
Table 8.1. Results of the detectors on the synthetic images. The number of correct detected corners is reported. In all the cases, the total number of corners is 160. IMAGE A
IMAGE B
IMAGE C
IMAGE D
IMAGE E
IMAGE F (blur)
Förstner
160/160
159/160
154/160
149/160
145/160
152/160
Heitger
160/160
157/160
158/160
148/160
145/160
148/160
Susan
150/160
139/160
118/160
90/160
121/160
141/160
Harris
140/160
139/160
136/160
140/160
121/160
144/160
Hessian
150/160
144/160
142/160
149/160
145/160
140/160
Figure 8.2. Synthetic image to evaluate the localization accuracy.
123
Appendix A. Detectors and descriptors
Figure 8.3. Results of the localization analysis. The differences between the manual measurements (reference) and the location obtained with the different detectors are plotted.
A.4.3 Quantitative analysis based on the relative orientation Interest points and regions detectors are also used to automatically compute the relative orientation between image pairs. Firstly points (regions) are detected, then matched and finally the coplanarity condition is applied. The correspondences are double-checked, by means of visual inspection and blunder detection (Baarda test), therefore no outliers are present in the data. The extracted points are also well distributed in the images, providing a good input for a relative orientation problem. For each image pair the same interior orientation is used and the number of extracted points is almost the same. In Table 8.2 the results of the experiments performed on two different stereo-pairs (Figure 8.4) are reported. To notice the fact that with region detectors (in this case with Lowe operator [Lowe, 2004]), the number of matched correspondences is in both cases higher but the accuracy of the relative orientation is almost two time worse than with an interest points detector.
124
Section A.5. Location accuracy improvement for detectors and descriptors
Table 8.2. Results of the automated relative orientation between the two stereo-pairs. Church A
Church B
Förstner
matched
245
sigma0
0.0183
Heitger
matched
133
sigma0
0.0217
Susan
matched
127
sigma0
0.0174
Harris
matched
184
sigma0
0.0256
Hessian
matched
93
sigma0
0.0259
Lowe
matched
269
sigma0
0.0341
Harris-affine
matched
129
sigma0
0.0321
Hotel A
Hotel B
Förstner
matched
89
sigma0
0.0201
Heitger
matched
106
sigma0
0.0207
Susan
matched
122
sigma0
0.0217
Harris
matched
85
sigma0
0.0425
Hessian
matched
91
sigma0
0.0290
Lowe
matched
135
sigma0
0.0471
Harris-affine
matched
84
sigma0
0.0402
A.5 Location accuracy improvement for detectors and descriptors As shown previously, region detectors and descriptors provide less accuracy compared to corners in orientation procedures. The reason might be explained like this (Figure 8.5): regions, localized with their centroid, are correctly matched using the extracted descriptors. But, due to perspective effects between the images, the centre of the regions might be slightly shifted, leading to lower accuracy in the relative orientation process. Affine invariant regions are generally drawn as ellipses, using the parameters derived from the eigenvalues of the second moment matrix of the intensity gradient [Lindeberg, 1998; Mikolajczyk and Schmid, 2002]. The location accuracy of the regions can be improved using a LSM algorithm [Grün, 1985a]. The use of cross-correlation would fail in case of big rotations around the optical axis. The ellipse parameters of the regions (major and minor axis and inclination) can be used to derive the approximations for the affine parameter transformation of the LSM. LSM can cope with different image scale (up to 30%) and significant camera rotation (up to 20 degrees), but good and weighted approximations should be used to constraint the estimation in the least squares adjustment. Results are shown in Figure 8.6: given a detected affine region and its ellipse parameters in the template and search image, LSM is computed in the search image without and with initial approximations for the reshaping parameters, leading to wrong convergence and correct matching results.
125
Appendix A. Detectors and descriptors
Figure 8.4. Two stereo-pairs used for the evaluation of the interest operators. Up: Church. Down: Hotel.
Figure 8.5. Affine regions detected in two images with Harris detector [Mikolajczyk and Schmid, 2002]. Due to perspective effects, the centre of the regions might be slightly shifted.
126
Section A.6. Conclusions
Figure 8.6. Detected affine region in the template image (left). Wrong LSM results in the search image with strongly deformed image patch (centre), initialized with the centroid of the region detector and without transformation parameter approximations. Correct LSM result (right) using the approximations provided by the descriptor.
A.6 Conclusions A short comparison and evaluation of feature detectors has been presented. From all the results, [Heitger et al., 1992] and [Förstner and Gülch, 1987] operators gave better results than the others examined algorithms. Region detectors and descriptors, as they extract areas and not only a single point, reported worst accuracy in the relative orientation problem. In fact they might detect the same region, but the centroid of the region (i.e. the point used to solve for the image orientation) might be shifted due to perspective effects. Nevertheless they generally provide for affinity invariant parameters, which can be used as approximations for a successive matching measurement algorithm (which would not converge without good approximations due to the large camera rotation or scale change).
127
Appendix A. Detectors and descriptors
128
Appendix B Alternative form of the coplanarity condition
B.1 Relative orientation between two images The relative geometry between two images evaluates the exterior orientation elements of one camera relative to an another one. The problem goes back to the 30’s and was first formulated in analytical photogrammetry and then applied to the aerial triangulation block adjustment. The traditional photogrammetric solution of the relative orientation between an image pair requires the solution of a system of non-linear equations, providing the image correspondences and the interior orientation elements. Disregarding the specific mathematical method to solve the system, iterations are required, therefore good approximations for the unknowns should be provided (unless a closed-form is performed). The geometric parameters involved in the calculation are the corresponding image points p1= (x1-x0, y1-y0, -c) = (x1’, y1’, -c) and p2 = (x2-x0, y2-y0, -c) = (x2’, y2’, -c) representing the same object point P = (X, Y, Z) and the baseline vector b=(bx,by,bz) between the two images. As already known, the three vectors p1, p2 and b must lie on the epipolar plane of P and the two perspective center C1 and C2. The equation that enforces the relationship between the three vectors is called coplanarity condition and can be described as the triplet scalar product of the three vector equal to zero: b ⋅ ( p1 × p2 ) = 0
(8.1)
or in analytical form: bx by bz x1 y1 –c = 0
(8.2)
x2 y2 –c
129
Appendix B. Alternative form of the coplanarity condition
The relative orientation based on the coplanarity condition is solved fixing 7 parameters among the twelve exterior orientation parameters of the two images and solving for the remaining five. Therefore, at least 5 correspondences are required; with more correspondences an iterative least squares estimation can be performed. A closed-form solution, usually called relative linear transform was formulated by [Thompson, 1959] (by introducing a skew-symmetric matrix for the image coordinates of one of the two images instead of the classical vector) and afterwards by [Stefanovic, 1973] and [Shih, 1990]. Using a skew-matrix B to represent the baseline vector b and expressing the image points in homogeneous coordinates, with some manipulation an implicit form of the coplanarity condition can be obtained: T
(8.3)
p 1 Ap 2 = 0
which is explicit only with respect to the purely measured coordinates of image points. A is a 3x3 matrix and contains the information related to the camera interior parameters and the rotation Ri between the two images. Equation 8.3 is a generalization of [Thompson, 1959] and was firstly introduced by [Longuet-Higgins, 1981] who assumed the interior parameters of both camera known and called it essential matrix E: T
(8.4)
E = R 1 BR 2
leading to: T
[ x 1 – x 0 ,y 1 – y 0 , – c] E [ x 1 – x 0 ,y 1 – y 0 , – c] = 0
(8.5)
In [Faugeras et al., 1992], the general case of unknown camera interior parameters was considered and the A matrix was called fundamental matrix F: T
F = K 1 EK 2
(8.6)
with Ki the calibration matrix containing the interior parameters of image i: T
p 1 Fp 2 = 0
(8.7)
Equation 8.7 is also called epipolar constraint, as the point p1 should lie on the epipolar line l1: T
l1 = F p2
(8.8)
and it should also be valid that: T
p1 l1 = 0
(8.9)
i.e. p1 lies on l1 (the same is valid for p2). The elements of E and F can be computed only up to a scale factor since Equation 8.3 (with the E or F matrix) is a quadratic forms equal to zero and is not affected if multiplied by a scalar. The two matrices E and F, as the determinant of B is zero, have rank 2. The essential matrix E has 5 degrees of freedom and it is defined by 5 relative orientation parameters. The fundamental matrix F has 7 degrees of freedom and 7 independent parameters (5 of the relative orientation and 2 of the interior elements) are recoverable from a stereo pair, with at least 7 correspondences. If the rank-2 propriety is not satisfied (e.g. the matrix is not singular), then the computed epipolar lines (Equation 8.8) are not consistent. The epipoles (in homogeneous coordinates) e1 and e2 of the two images can be recovered from the F matrix, as its left and right null-space:
130
Section B.2. Estimating the Fundamental matrix
(8.10)
Fe 1 = 0 T
e2 F = 0
If the two projective camera matrices P1 and P2 of two images are known, the fundamental matrix F can be derived from the row vectors of Pi: [ b 1, c 1, b 2, c 2 ] [ b 1, c 1, b 2, a 2 ] [ b 1, c 1, a 2, b 2 ] F = [ c 1, a 1, b 2, c 2 ] [ c 1, a 1, c 2, a 2 ] [ c 1, a 1, a 2, b 2 ] [ a 1, b 1, b 2, c 2 ] [ a 1, b 1, c 2, a 2 ] [ a 1, b 1, a 2, b 2 ]
(8.11)
with ai, bi, ci the row 4-vectors of the Pi matrices. The F matrix regulates the epipolar geometry between the image pairs. Even though more points than the 5 traditional photogrammetric points (or the 6 "Von Grüber" points) are required, this approach presents the advantage that it needs only image correspondences and does not require any approximations for the relative orientation parameters (interior and exterior).
B.2 Estimating the Fundamental matrix Different methods have been proposed for the estimation of the matrix F from a sufficiently large set of point correspondences.
B.2.1 Least squares and iterative techniques Equation 8.7 can be written as a linear and homogeneous equation in the 9 unknown coefficients of F: x 2 x 1 f 11 + x 2 y 1 f 12 + x 2 f 13 + y 2 x 1 f 21 + y 2 y 1 f 22 + y 2 f 23 + x 1 f 23 + y 1 f 32 + f 33 = 0
(8.12)
Given n corresponding points, collecting the F coefficients in a 9-vector f and the image coordinates in a matrix U, a set of linear equations is obtained: Uf= 0
(8.13)
which is an homogeneous set of equations where f can only be recovered up to a scale factor. The U matrix should have at most rank 8, i.e. eight corresponding points are required and, in this case, a unique (up to a scale factor) solution ca be found linearly e.g. as the right null-space of U. As F has 7 degrees of freedom, the minimum number of correspondences to find a solution for the epipolar geometry is 7. In [Hartley, 1994c] a linear method based on 7 matches is presented. As Equation 8.7 is an homogeneous set of equations, the solution is a set of matrices of the form F=αF1+(1-α)F1. This is solved forcing the rank-2 condition. This method can only be applied when exactly 7 correct correspondences are available and it cannot be applied in case of redundancy or outliers. Other approaches, requiring more than 7 correspondences, are based on least squares methods and minimize particular functions, like: min F
∑
T
( p i Fp i )
2
(8.14)
i
which can be achieved minimizing the norm ||Uf|| with the constraint ||f|| = 1. min F
∑d
2
2
( p i, p i ) + d ( p i, p i )
(8.15)
i
131
Appendix B. Alternative form of the coplanarity condition
where pi are the measured correspondences while pi are the estimated correspondences that satisfy Equation 8.7. Equation 8.15, which minimizes the geometric distance (i.e. the reprojection error) between the correspondences, is usually called Gold Standard method. Least squares methods assume that the noise in the data has zero mean, i.e. we perform an unbiased parameters estimation. Moreover, they assume that the entire input dataset can be interpreted as only one parameter vector of a given model. The violation of these implicit assumptions can strongly perturb the final estimation.
B.2.2 Robust estimators As automated procedures for the matches estimation can lead to a certain number of outliers, the estimation of the fundamental matrix F should be performed with robust methods. A review of different robust estimators is presented in [Rousseeuw and Leroy, 1987; Zhang, 1995; Förstner, 1998] while in the following sections, RANSAC and LMedS are shortly described as employed in the workflow for the automated tie point extraction (Section 4.2). B.2.2.1 RANSAC RANSAC (RANdom SAmpling Consensus) [Fischler and Bolles, 1981] is a paradigm algorithm widely used in the vision community for robust estimations. The idea is to find, through a random sampling of a minimal subset of data, the parameter set which is consistent with a subset of data as large as possible. Assuming that a large proportion of the data is not correct (wrong correspondences), “the approach is the opposite of conventional smoothing techniques. RANSAC, rather than using as much data as possible to obtain an initial solution and then attempting to identify outliers, it uses a small subset of data as feasible to estimate the parameters and then enlarge this successful set (if possible)”. This process is repeated enough times on different subsets to ensure that there is a very high probability that one of the subsets will contain only good data points. The best solution is that one which maximizes the number of points whose residual is below a given error threshold. Once outliers are removed, those sets identified as non-outliers can be combined to give a final estimation of the parameters. The threshold reflects the a priori knowledge of the precision of the expected estimation and it is not automatically computed as in LMedS algorithm (Section B.2.2.2). The threshold is usually related to a distance t such that a point of a subset is an inlier with a probability α. This calculation requires to know the probability distribution function for the distance of an inlier of the subset from the model (or the variance of the data), therefore the distance threshold is usually set empirically. The number of random samples N must be set to ensure with a certain probability p (e.g. 99%) that at least one sample does not contains outliers. Defining e as the fraction of outliers (to be guessed), s the number of data in each sample, the minimum number N of trials necessary to find a sample without outliers can be computed as: log ( 1 – p ) N = ---------------------------------------s log ( 1 – ( 1 – e ) )
(8.16)
In Table 8.3 are reported the value of trials N corresponding to different fractions of outliers in the case of fundamental matrix estimation (number of points=7-8, P=95%). Used for the fundamental matrix estimation, RANSAC calculates the number of inliers in each subset defining a F matrix. The computed F is the one which maximize the number of inliers. RANSAC can handle cases where the number of outlier is higher than 50%, if a sufficient number of samples is selected. Unfortunately RANSAC requires the a priori knowledge of the variance of the data, which is usually unknown.
132
Section B.2. Estimating the Fundamental matrix
Table 8.3. Number of trials (random samples) to be performed in a RANSAC estimation of the fundamental matrix (using 7 and 8 correspondences) to ensure with 95% of probability that at least one sample has no outliers. Fraction of outliers Sample Size
5%
10%
20%
30%
40%
50%
7 points (MIN)
2
5
13
35
105
382
8 points
3
6
17
51
177
766
B.2.2.2 Least Median Squares (LMedS) The LMedS [Rousseeuw and Leroy, 1987] is a robust estimator method that seek the model’s parameters by solving the nonlinear minimization problem: 2
median ( d i ) = min
(8.17)
i.e. the estimator must yield the smallest value for the median of the squared residuals computed for the entire dataset. As in RANSAC, the samples are selected randomly while the number N of samples can be obtained using a MonteCarlo type technique [Deriche et al., 1994]. In case of the fundamental matrix computation, LMedS calculates the median of the distances between the points and the related epipolar lines for each F and the correct matrix must minimize such a median. The method is robust against false matches but LMedS cannot deal with cases where the number of outliers is higher than 50% as the median distance will be an outlier too. This can be solved using an appropriate value instead of the mean distance, e.g. 40%. B.2.2.3 Consideration on robust estimators A comparison among different robust estimators for the estimation of the relative orientation between two images is reported in [Torr and Murray, 1997]. Robust methods are really necessary when the correspondences are extracted automatically, as a number of outliers can be present in the data, in particular in case of wide baseline. The idea to have robustness in the estimation is to have safeguards against deviations from the assumptions. This is in contrast with diagnostics, whose purpose is to find and identify deviations from the model assumptions [Huber, 1991]. Within robust estimators, gross errors are defined as observations which do not fit to the stochastic model of the estimated parameters. Their efficiency depends on different factors but mainly the number (percentage) of outliers and their size characterize the performance of an algorithm. Concerning RANSAC and LMedS, the latter is more restrictive than RANSAC as it eliminates more points; moreover it can fail in case of small number of outliers (in this case ML-estimators are more suitable). On the other hand the advantage of LMedS method is that it requires no setting of a threshold or a priori knowledge of the variance of the data. However, the main constraint of both estimators is their lack of repetitivity because of their aleatory way of selecting the points (random sampling). Compared to the data snooping technique (i.e. a statistical test of the normalized residuals), robust estimators like LMedS or RANSAC do not provide a measure or a judgment about the quality of the found (or rejected) outliers.
133
Chapter 8. Alternative form of the coplanarity condition
134
BIBLIOGRAPHY
The references are listed in alphabetic order. The following abbreviations are used: ASPRS: American Society of Photogrammetry and Remote Sensing BMVC: British Machine Vision Conference CVGIP: Computer Vision, Graphics, and Image Processing CVPR: Computer Vision and Pattern Recognition ECCV: European Conference on Computer Vision IAPRS: International Archives of Photogrammetry and Remote Sensing ICCV: International Conference on Computer Vision IJCV: International Journal of Computer Vision ISPRS: International Society of Photogrammetry and Remote Sensing PAMI: Pattern Analysis and Machine Intelligence PE&RS: Photogrammetric Engineering and Remote Sensing
3D MAX 3D Studio Max: http://www.discreet.com [April 2006] 3D Equilizer 3D Equilizer: http://www.3dequilizer.com [April 2006] Abdel-Aziz and Karara, 1971 Abdel-Aziz, Y., Karara, H., 1971: Direct linear transformation from comparator coordinates into object-space coordinates. Close range Photogrammetry, pp. 1-18, ASPRS, Falls Church, Virginia Ackermann, 1983 Ackermann, F., 1983: High precision digital image correlation. 39th Photogrammetrische Woche Alexa, 2002 Alexa, M., 2002: Wiener filtering of meshes. Proceedings of Shape Modeling International, pp. 51-57 Allen et al., 2002
135
BIBLIOGRAPHY
Allen, B., Curless, B. and Popovic, Z., 2002: Articulated body deformation from range scan data. ACM Proceedings of SIGGRAPH ‘02, pp.612-619 Amenta et al., 1998 Amenta, N., Bern, M. and Kamvysselis, M., 1998: New Voronoi based surface reconstruction algorithm. Proceedings of the 25th Annual Conference on Computer Graphics and Interactive Techniques, pp. 415-421 Anai and Chikatsu, 1999 Anai, T. and Chikatsu, H., 1999: Development of human motion analysis and visualization system. IAPRS, 32(5-3W12), pp. 141-144 Anai and Chikatsu, 2000 Anai, T. and Chikatsu, H., 2000: Dynamic analysis of human motion using hybrid video theodolite. IAPRS, 33(B5), pp. 25-29 Armstrong et al., 1994 Armstrong, M., Zisserman, A. and Beardsley P., 1994: Euclidean structure from uncalibrated images. Proceedings of BMVC Armstrong et al., 1996 Artmstrong, M., Zisserman, A. and Hartley, R., 1996: Euclidean reconstruction from image triplets. Proceedings of ECCV, Lecture Notes in Computer Science, Springer Verlag, Vol. 1064, pp. 3-16 Ascension: http://www.ascension.com [April 2006] Australis: http://www.photometrix.com.au [April 2006] Baarda, 1968 Baarda, W., 1968: A testing procedure for use in geodetic networks. Ntherlands Geodetic Commission, Publication on Geodesy, 2(5) Baltsavias, 1991 Baltsavias, E.P., 1991: Multiphoto geometrically constrained matching. PhD Thesis, Mitteilungen Nr. 49, Institute of Geodesy and Photogrammetry, ETH Zurich, Switzerland Barron and Kakadiadris, 2001 Barron, C., Kakadiaris, A., 2001: Estimating Anthropometry and Pose from a single uncalibrated image. Computer Vision and Image Understanding, Vol. 81 Bartels and Stewart, 1972 Bartels R. and Stewart, G.W., 1972: Solution of the equation AX+XB=C. Communications of the ACM, Vol.15, pp. 820-856 Basu and Licardie, 1995 Basu, A. and Licardie, S., 1995: Alternative models for sish-eye lenses. Patter Recognition Letters, Vol. 16, pp. 433-441 Baumberg, 2000 Baumberg, A., 2000: Reliable feature matching across widely separated views. IEEE Proceedings of ICCV, pp. 774-781 Beardsley et al., 1996 Beardsley, P, Toor, P. and Zisserman, A., 1996: 3D model acquisition from extended image sequences. Proceedings of ECCV’96, Lecture Notes in Computer Sciences, Vol, 1065, pp. 683-695 Beauchesne and Roy, 2003 Beauchesne, E. and Roy, S., 2003: Automatic relighting of overlapping textures of a 3D model. IEEE Proceedings of CVPR, pp. 166-173 Beaudet, 1978
136
BIBLIOGRAPHY
Beaudet, P., 1978: Rotationally invariant image operators. Proceddings of 4th Internationa Joint Conference on Pattern Recognition, pp. 579-583 Bellutta et al., 1989 Bellutta, P., Collini, G., Verri, A. and Torre, V., 1989: 3D visual information from vanishing points. IEEE Proceedings of Workshop on Interpretation of 3D Scenes, Austin, pp. 41-49 Beraldin et al., 2000 Beraldin, J.A, Blais, F, Cournoyer, L., Godin, G. and Rioux, M., 2000: Active 3D sensing. Modelli E Metodi per lo studio e la conservazione dell’architettura storica, University: Scuola Normale Superiore, Pisa. pp. 22-46 Beraldin et al., 2002 Beraldin, J.-A., Picard, M., El-Hakim, S., Godin, G., Latouche, C., Valzano, V. and Bandiera, A., 2002: Exploring a Byzantine crypt through a high-resolution texture mapped 3D model: combining range data and photogrammetry. Proceedings of ISPRS/CIPA Int. Workshop Scanning for Cultural Heritage Recording. Corfu, Greece, pp. 65-72 Beraldin et al., 2005 Beraldin, J.A., Picard, M., El-Hakim, S., Godin, G., Valzano, V. and Bandiera, A., 2005: Combining 3D technologies for cultural heritage interpretation and entertainment. In Videometrics VIII, Beraldin/El-Hakim/Grün/Walton (Eds), SPIE Vol. 5665, pp. 108-118 Bern and Eppstein, 1992 Bern, M. and Eppstein D., 1992: Mesh generation and optimal triangulation. In ‘Computing in Euclidean Geometry’, Du/Wang (Eds), World Scientific, Lecture Notes Series on Computing, Vol. 1, pp. 23-90 Bernardini et al., 2002 Bernardini, F., Rushmeier, H., Martin, I.M., Mittleman, J. and Taubin, G., 2002: Building a digital model of Michelangelo's Florentine Pieta. IEEE Computer Graphics and Applications, 22(1), pp.59-67 Besl, 1988 Besl, P.J., 1988. Active, optical range imaging sensors. Machine Vision and Applications, 1(2), pp. 127-152 Beyer, 1992 Beyer, H., 1992: Geometric and radiometric analysis of CCD camera based on photogrammetric close-range system. PhD Thesis, Mitteilungen Nr. 51, Institute of Geodesy and Photogrammetry, ETH Zurich, Switzerland Blais, 2004 Blais, F., 2004: A review of 20 years of range sensor development. Journal of Electronic Imaging, 13(1), pp. 231-240 Böhm, 2004 Böhm, J., 2004: Multi-image fusion for occlusion-free facade texturing. IAPRS, 35(5), pp. 867872 Boissonnat, 1984 Boissonnat, J.D., 1984: Geometric structures for three-dimensional shape representation. ACM Transactions on Graphics, 3(4), pp.266-286 Borg and Cannataci, 2002 Borg, C.E. and Cannataci, J.A., 2002: Thealasermetry: a hybrid approach to documentation of sites and artefacts. CIPA-ISPRS Workshop on Scanning for Cultural Heritage Recording, Sept., Corfu, Greece, pp. 93-104 Borgeat et al., 2003 Borgeat, L., Fortin, P.-A. and Godin, G., 2003: A fast hybrid geomorphing LOD scheme. ACM Proceedings of SIGGRAPH ‘03, Sketches and Applications
137
BIBLIOGRAPHY
BOUJOU Boujou: http://www.2d3.com [April 2006] Bramble et al., 2001 Bramble, S., Compton, D. and Klasen, L, 2001: Forensic Image Analysis. 13th Interpol Forensic Science Symposium, Lyon, France, 16-19 October Brand and Mohr, 1994 Brand, P. and Mohr, R., 1994: Accuracy in image measure. In El-Hakim (Ed), Videometrics III, SPIE Vol 2350, pp. 218-228 Bray, 2000 Bray, J., 2000: Markerless Motion Capture - a Literature Survey. VR and Vision Dept., University of Brunel, UK. Report for VISICAST Project Bregler and Malik, 1998 Bregler, C. and Malik, J., 1998: Tracking People with Twists and Exponential Maps. IEEE Proceedings of CVPR, 1998 Breuckmann: http://www.breuckmann.com [April 2006] Brinkley, 1985 Brinkley, J.F., 1985: Knowledge-driven ultrasonic three-dimensional organ modeling. IEEE Transaction on PAMI, 7(4), pp.431-441 Brown, 1971 Brown, D., 1971: Close-range camera calibration. Photogrammetric Engineering, Vol. 37(8), pp.855-866 Brown, 1976 Brown, D., 1976: The bundle-adjustment - progress and prospects. Int. Archives of Photogrammetry, 21(3) Brown, 1992 Brown, L.G., 1992: A survey of image registration techniques. Computing survey, 24(4), pp. 325-376 Brown et al., 2005 Brown, M., Szeliski, R. and Winder, S., 2005: Multi-image matching using multi-scale oriented patches. IEEE Conference on Computer Vision and Pattern Recognition (CVPR'2005), Vol.I, pp. 510-517, San Diego, CA Burshukov, 2004 Burshukov, G., 2004: Making the Superpunch. ACM Proceedings of SIGGRAPH04 Caprile and Torre, 1990 Caprile, B. and Torre, V., 1990: Using vanishing point for camera calibration. IJCV, Vol. 42(2), pp.127-139 Canny, 1986 Canny, J.F., 1986: A computational approach for edge detection. IEEE Transaction on PAMI, 8(6), pp. 679-698 Canoma: http://www.metacreations.com/products/canoma [April 2006] CAVIAR CAVIAR Project: homepages.inf.ed.ac.uk/rbf/CAVIARDATA1/ [April 2006] Chen et al., 2000 Chen, F., Brown G.M. and Song M., 2000: Overview of three-dimensional shape measurement using optical methods. Optic. Eng., Vol. 39, pp. 10-22 Cheung et al., 2004 Cheung, K.M, Baker, S., Hodgins, J.K. and Kanade, T., 2004: Markerless human motion transfer.
138
BIBLIOGRAPHY
Proceedings of the 2nd International Symposium on 3D Data Processing, Visualization and Transmission Cignoni and Scopigno, 2001 Cignoni P. and Scopigno, R., 2001: A system for out-of-core simplification of huge meshes. ERCIM news, No, 44 Cignoni et al., 2004 Cignoni, P., Ganovelli, F., Gobbetti, E., Marton, F., Ponchio, F. and Scopigno, R., 2004: Adaptive tetrapuzzles: efficient out-of-core construction and visualization of gigantic multiresolution polygonal models. ACM Transaction on Graphics, 23(3), pp. 796-803 Clarke et al., 1998 Clarke, T.A., Fryer, J.G. and Wang, X., 1998: The principal point and CCD cameras. The Photogrammetric Record, 16(92), pp. 293-312 Collins and Weiss, 1989 Collins, R.T. and Weiss, R.S., 1989: An efficient and accurate method for computing vanishing points. Topical Meeting on Image Understanding amd Machine Vision, Optical Society of America, Vol.14, pp. 92-94 Cooper and Cross, 1991 Cooper, M.A.R. and Cross, P.A., 1991: Statistical concepts and their application in photogrammetry and surveying. Photogrammetric Record, Vol. 13(77), pp. 645-678 Cordier et al., 2003 Cordier, F., Seo, H. and Magnenat-Thalmann, N., 2003. Made-to-Measure technologies for online clothing store. IEEE CG&A special issue on 'Web Graphics', pp.38-48 Criminisi, 1999 Criminisi, A, 1999: Accurate Visual Metrology from Single and Multiple Uncalibrated Images. Ph.D. Diss., Oxford University Curles and Levoy, 1996 Curless, B. and Levoy, M., 1996: A volumetric method for building complex models from range images, Proceedings of 23rd Annual Conference on Computer Graphics and Interactive Techniques, ACM Press, pp. 302-312 Cyberware: http://www.cyberware.com [April 2006] Cyclone: http://www.cyra.com [April 2006] Cyrax: http://hds.leica-geosystems.com [April 2006] D’Apuzzo et al., 1999 D’Apuzzo, N., Plänkers, R., Fua, P., Grün, A. and Thalmann, D., 1999: Modeling human bodies from video sequences. In Videometric VI, El-Hakim/Grün (Eds.), SPIE, Vol. 3461, pp. 36-47 D’Apuzzo, 1998 D’Apuzzo, N., 1998: Automated photogrammetric measurement of human faces. IAPRS, Vol 32(B5), pp. 402-407 D’Apuzzo, 2003 D'Apuzzo, N., 2003: Surface Measurement and Tracking of Human Body Parts from Multi Station Video Sequences. Ph.D. Thesis, Nr. 15271, Institute of Geodesy and Photogrammetry, ETH Zurich, Switzerland Dachsbacher et al., 2003 Dachsbacher, C., Vogelgsand, C. and Stamminger, M., 2003: Sequential point trees. ACM Transaction of Graphics, 22(3), pp. 657-662 De Agapito et al., 1998
139
BIBLIOGRAPHY
De Agapito, L., Hayman, E., Reid, I., 1998: Slef-calibration of a rotating camera with varying intrinsic parameters. Proceedings of 9th BMVC, pp. 105-114 Debevec et al., 1996 Debevec, P., Taylor, C. and Malik, J., 1996: Modelling and rendering architecture from photographs: a hybrid geometry and image-based appraoch. ACM Proceedings of SIGGRAPH ’96, pp. 11-20 Debevec and Malik, 1997 Debevec, P. and Malik, J., 1997: Recovering high dynamic range radiance maps from photographs. ACM Proceedings of SIGGRAPH 97, pp. 369-378 Debevec, 1998 Debevec, P, 1998: Rendering synthetic objects into real scenes: Bridging traditional and imagebased graphics with global illumination and high dynamic range photography. ACM Proceedings of SIGGRAPH 98 Deering, 1995 Deering, M, 1995: Geometry Compression. ACM Proceedings of SIGGRAPH ‘95, pp. 13-20 De Floriani et al., 1998 De Floriani, Magillo, P., Puppo, E., 1998: Efficient implementation of multi-triangulations. Proceedings IEEE Visualization, pp. 43-50 Dermanis, 1994 Dermanis, A., 1994: The photogrammetric inner constraints. ISPRS Journal of Photogrammetry and Remote Sensing, 49(1), pp. 25-39 Deriche et al., 1994 Deriche, R., Zhang, Z., Luong, Q.-T. and Faugeras, O., 1994: Robust recovery of the epipolar geometry for an uncalibrated stereo rig. Proceedings of 3rd ECCV, Vol. 800-801, Lecture Notes in Computer Sciences, Springer Verlag, Vol. 1, pp. 567-576 Devernay and Faugeraus, 1995 Devernay, F. and Faugeras, O., 1995: Automatic calibration and removal of distortion from scenes of structured environments. Conference on Investigative and Trial Image Processing, SPIE Vol. 2567 Dey and Giesen, 2001 Dey T.K. and Giesen, J., 2001: Detecting undersampling in surface reconstruction. Proceedings of 17th Symposium of Computational Geometry, pp.257-263 Dhome et al., 1989 Dhome, M., Richetin, M., Lapreste, J.T. and Rives, G., 1989: Determining the attitude of 3D objects from a single perspective view. IEEE Trans. on PAMI, 11(12), pp. 1265-1278 Dhond and Aggarwal, 1989 Dhond, U. and Aggarwal, J.K., 1989: Structure from stereo - a review. IEEE Transaction on System, Man and Cybern., 19(6), pp. 1489-1510 Dick et al., 2000 Dick, A.R., Torr, P.H. and Cipolla, R., 2000: Automatic 3D modelling of architecture. Proceedings of BMVC Dick et al., 2001 Dick, A.R., Torr, P.H., Ruffle, S.J. and Cipolla, R., 2001: Combining single view recognition and multiple view stereo for architectural scenes. IEEE Proceedings of 8th ICCV, pp. 268-274 Dimitrijevic et al., 2005 Dimitrijevic, M., Lepetit, V. and Fua, P., 2005: Human body pose recognition using spatio-temporal templates. ICCV workshop on Modeling People and Human Interaction, Beijing, China Dobashi et al., 2000 Dobashi, Y., Kaneda, K., Yamashita, H., Okita, T. and Nishita, T., 2000: A simple, efficient
140
BIBLIOGRAPHY
method for realistic animation of clouds. Proceedings of 27th Annual Conference on Computer Graphics and Interactive Techniques, ACM Press DPA DPA-Pro: http://www.aicon.de [April 2006] Duchaineau et al., 1997 Duchaineau, M, Wolinsky, M., Sigeti, D., Mille, M., Aldrich, C. and Mineev-Weinstein, M., 1997: ROAMing terrain: real-time optimally adapting meshes. Proceedings IEEE Visualization’97, pp. 81-88 Edelsbrunner and Mucke, 1994 Edelsbrunner H. and Mucke, E., 1994: Three dimensional alpha shapes. ACM Transactions on Graphics, 13(1) Edelsbrunner, 2001 Edelsbrunner, H., 2001: Geometry and topology for mesh generation. Cambridge Monographs on Applied and Computational Mathematics, Vol. 6, Cambridge University Press, UK El-Hakim and Beraldin, 1994 El-Hakim, S. and Beraldin, J.A., 1994: On the integration of range and intensity data to improve vision-based threedimensional measurements. In Videometric III, El-Hakim (Ed), SPIE Vol. 2350, pp. 306-321 El-Hakim and Beraldin, 1995 El-Hakim, S. and Beraldin, J.A., 1995: Configuration design for sensor integration. In Videometrics IV, El-Hakim (Ed), SPIE Vol. 2598, pp. 274-285 El-Hakim, 2000 El-Hakim, 2000: A practical approach to creating precise and detailed 3D models from single and multiple views. IAPRS, 33(B5A), pp 122-129 El-Hakim, 2001 El-Hakim, S., 2001: Three-dimensional modeling of complex environments. Videometrics and Optical Methods for three-dimensional Shape Measurement, SPIE Vol. 4309, pp. 162-173 El-Hakim, 2002 El-Hakim, S., 2002: Semi-automated 3D reconstruction of occluded and unmarked surfaces from widely separated views. IAPRS, 34(5), pp. 143-148, Corfu, Greece El-Hakim et al., 2003 El-Hakim, S.F., Beraldin, J.-A., and Blais, F., 2003: Critical factors and configurations for practical 3D image-based modeling. 6th Conference on 3D Measurement Techniques. Zurich, Switzerland. Vol. II, pp. 159-167 El-Hakim et al., 2004 El-Hakim, S., Beraldin, J.A., Picard, M. and Godin, G., 2004: Detailed 3D reconstruction of large-scale heritage sites with integrated techniques. IEEE Computer Graphics and Application, 24(3), pp. 21-29 Faugeras et al., 1992 Faugeras, O.D., Luong, Q.-T. and Maybank, S.J., 1992: Camera Self-Calibration: Theory and Experiments. Proceedings of ECCV, pp. 321-334 Faugeras, 1993 Faugeras, O., 1993: Three-dimensional computer vision. MIT Press Faugeras and Luong, 2001 Faugeras, O. and Luong, Q.T., 2001: The geometry of multiple images. MIT Press Ferrari et al., 2003 Ferrari, V., Tuytelaars, T. and Van Gool, L. 2003. Wide-baseline muliple-view correspondences. IEEE Proceeding of CVPR Fischler and Bolles, 1981
141
BIBLIOGRAPHY
Fischler, M. and Bolles, R., 1981: Random sample consensus: a paradigm for model fitting with application to image analysis and automated cartography. Communications of ACM, Vol. 24, pp. 381-385 Fitzgibbon and Zisserman, 1998 Fitzgibbon, A and Zisserman, A., 1998: Automatic 3D model acquisition and generation of new images from video sequence. Proceedings of European Signal Processing Conference, pp. 1261-1269 Fitzgibbon, 2001 Fitzgibbon, A., 2001: Simultaneous linear estimation of multiple view geometry and lens distortion. IEEE Proceeding of CVPR Flack et al., 2001 Flack, P., Willmott, J., Browne, S., Arnold, D. and Day, A., 2001: Scene assembly for large scale urban reconstructions, Proceedings of VAST 2001, pp. 227-234 Fraser, 1980 Fraser, C., 1980: Multiple focal settings self-calibration of close-range metric cameras. PE&RS, 46(9), pp. 1161-1171 Fraser, 1982 Fraser, C., 1982: Optimization of precision in close-range photogrammetry. PE&RS, 48(4) Fraser, 1996 Fraser, C., 1996: Network design. In Close Range Photogrammetry and Machine Vision (K.B.Atkinson Ed.), Cap.9, Whittles Publishing, Caithness, Scotland, U.K., pp. 256-282 Förstner, 1976 Förstner, W., 1976: Statistical test methods for blunder detection in planimetry block triangulation. XIII ISP Congress, Commission III, Helsinki Förstner, 1982 Förstner, W., 1982: On the geometric precision of digital correlation. International Archives of Photogrammetry, Vol. 24(3), pp. 176-189 Förstner and Gülch, 1987 Förstner, W. and Gülch, E., 1987: A fast operator for detection and precise location of disting points, corners and center of circular features. Proceedings of ISPRS Conference on Fast Processing of Photogrammetric Data, Interlaken, Switzerland, pp.281-305 Förstner, 1998 Förstner, W., 1998: Robust estimation procedures in computer vision. In “Third Course in Digital Photogrammetry”, February 1998, IPB-Bonn, Germany Förstner, 1999a Förstner, W., 1999: Determining the interior and the exterior orientation of a single image. Notes, IPB, Bonn University, 1999 Förstner, 1999b Förstner, W., 1999: On estimating rotation. Festschrift für Prof. Dr.-Ing. Heinrich Ebner zum 60. Geburtstag, Herausg., Heipke/Mayer (Eds), Lehrstuhl für Photogrammetrie und Fernerkundung, TU München, 1999 Förstner, 2000 Förstner, W., 2000: New orientation procedures. IAPRS, Vol. 33(3), pp. 297-304 Fua, 1999 Fua, P, 1999: Using model-driven bundle-adjustment to model heads from raw video sequences. IEEE Proceedings of 7th ICCV, pp. 46–53 Fua et al., 2000 Fua, P., Herda, L, Plaenkers, R. and Boulic, R., 2000: Human shape and motion recovery using animation models. IAPRS, 33(B5), pp. 253-268
142
BIBLIOGRAPHY
Fryer, 1996 Fryer, J.G., 1996: Single station self-calibration techniques. IAPRS, 31(5), pp. 178-181 Fryer, 2000 Fryer, J., 2000: An object space technique independent of lens distortion for forensic videogrammetry. IAPRS, Vol. 35(B5), pp. 246-252 Gartner et al., 1995 Gartner, H., Lehle, P. and Tiziani, H.J., 1995: New, high efficient, binary codes for structured light methods. Proceedings of SPIE Vol. 2599, pp. 4-13 Gavrila, 1996 Gavrila D.M., 1996: Vision-based 3D tracking of human in action. PhD thesis, Department of computer science, University of Maryland, USA Gavrila and Davis, 1996 Gavrila, D.M. and Davis, L., 1996: 3D model-based tracking of humans in action: a multi-view approach. IEEE Proceedings of CVPR, pp. 73-80 Gehrig et al., 2003 Gehrig, N., Lepetit, V. and Fua, P., 2003: Golf club visual tracking for enhanced swing analysis tools. Proceedings of BMVC Geomagic: http://www.geomagic.com [April 2006] Gerth et al., 2005 Gerth, B., Berndt, R., Havemann, S. and Fellner, D.W., 2005: 3D modeling for non-expert users with the castle construction Kit v0.5t. 6th International Symposium on Virtual Reality, Archaeology and Cultural Heritage - VAST (2005), Mudge/Ryan/Scopigno (Eds), pp. 1-9 Gibson et al., 2002 Gibson, S., Cook, J. and Hubbold, R., 2002: ICARUS: Interactive reconstruction from uncalibrated image sequence. ACM Proceedings of SIGGRAPH’02, Sketches & Applications Gotsman and Keren, 1998 Gotsman, C. and Keren, D., 1998: Tight fitting of convex polyhedral shapes. Int. Journal of Shape Modeling, 4(3-4), pp.111-126 Granshaw, 1980 Granshaw, S.I., 1980: Bundle adjustment methods in engeneering photogrammetry. Photogrammetric Record, 10(56), pp.181-207 Grafarend, 1974 Grafarend, E.W., 1974: Optimization of geodetic network. Bolelttino di Geodesia e Scienze Affini, 33(4), pp. 351-406 Gross et al. 1996 Gross, M., Staadt, O. and Gatti, R., 1996: Efficient triangular surface approximations using wavelets and quadtree structures. IEEE Transaction on Visual and Computer Graphics, 2(2), pp. 130-144 Grün, 1976 Grün, A., 1976: Die Theorie der inneren Genauigkeiten in Ihren Anwendung auf die photogrammetrische Bündelmethode. Deutsche Geodätische Kommission, Series B, 216, pp. 55-76 Grün, 1978a Grün, A., 1978a: Progress in photogrammetric point determination by compensation of systematic errors and detection of gross errors. Nachrichten aus dem Karten- und Vermessungswesen, Series 11(36), pp. 113-140 Grün, 1978b Grün, A., 1978b: Accuracy, reliability and statistics in close-range photogrammetry. ISP Commission V Symposium, Stockholm
143
BIBLIOGRAPHY
Grün, 1981 Grün, A., 1981: Precision and reliability aspects in close-range photogrammetry. The Photogrammetric journal of Finland, 8(2), pp. 117-132 Grün, 1985a Grün, A., 1985a: Adaptive least squares correlation: a powerfull image matching technique. South African Journal of Photogrammetry, Remote Sensing and Cartography, 14(3), pp. 175187 Grün, 1985b Grün, A., 1985b: Data processing methods for amateur photographs. Photogrammetric Record, Vol. 11(65), pp. 576-579 Grün and Baltsavias, 1988 Grün A. and Baltsavias E. P., 1988: Geometrically constrained multiphoto matching. PE&RS, Vol. 54(5) pp. 633-641 Grün, 2000 Grün, A., 2000: Semi-automated approaches to site recording and modeling. IAPRS, 33(5/1), 2000, pp. 309-318, Amsterdam, The Netherlands Grün and Beyer, 2001 Grün, A. and Beyer, H., 2001: System calibration through self-calibration. In Grün/Huang (Eds.), Calibration and Orientation of cameras in computer vision, Springer, Vol. 34, pp. 163-193 Grün et al., 2001 Grün, A., Zhang, L. and Visnovcova, J., 2001: Automatic reconstruction and visualization of a complex Buddha Tower of Bayon, Angkor, Cambodia. Proceedings 21.WissenschaftlichTechnische Jahrestagung der DGPF, pp. 289-301 Grün et al., 2004a Grün, A., Remondino, F. and Zhang, L., 2004a: Photogrammetric Reconstruction of the Great Buddha of Bamiyan, Afghanistan. The Photogrammetric Record, 19(107), pp. 177-199 Grün et al., 2004b Grün, A., Remondino, F. and Zhang, L., 2004b: 3D modeling and visualization of large cultural heritage sites at very high resolution: the Bamiyan valley and its standing Buddhas. IAPRS, 35(5), Istanbul, Turkey Guarnieri et al., 2004 Guarnieri, A., Remondino, F. and Vettore, A., 2004: Photogrammetry and Ground-based Laser Scanning: Assessment of Metric Accuracy of the 3D Model of Pozzoveggiani Church. FIG Working Week 2004. TS on "Positioning and Measurement Technologies and Practices II Laser Scanning and Photogrammetry" Guidi et al., 2003 Guidi, G., Beraldin, J-A., Ciofi, S. and Atzeni, C., 2003: Fusion of range camera and photogrammetry: a systematic procedure for improving 3D models metric accuracy. IEEE Trans. on System, Man and Cybernetics, 33(4), pp.667-676 H-Anim human model: http://www.h-anim.org [April 2006] Hådem, 1984 Hådem, I., 1984: Generalized relative orientation in close-range photogrammetry - A survey of methods. IAPRS, 25(5), pp. 372-381 Haralik, 1985 Haralik, R.M., 1985: Second directional derivative zero-crossing detector using the cubic facet model. Proceedings of 4th Scandinavian Conference on Image Analysis, pp. 17-30 Haritaoglu et al., 1998 Haritaoglu, I., Harwood, D. and Davis, L., 1998: W4: who, when, where, what. A real-time sys-
144
BIBLIOGRAPHY
tem for detecting and tracking people. IEEE Int. Conf. on Automatic Face and Gesture Recognition, pp. 222-227 Hartley, 1992 Hartley, R., 1992: Estimation of relative camera positions for uncalibrated cameras. Proceedings of ECCV ‘92 Hartley, 1994a Hartley, R., 1994a: Lineas and points in three views: a unifed approach. Proceedings of ARPA Image Understanding Workshop, pp. 1009-1016 Hartley, 1994b Hartley, R., 1994b: Self-calibration from multiple views with a rotating camera. Proceedings of 3rd ECCV, Vol. 1, pp. 471-478 Hartley, 1994c Hartley, R., 1994c: Projective reconstruction and invariants from multiple views. IEEE Transaction on PAMI, Vol. 16, pp. 1036-1041 Hartley, 1994d Hartley, R., 1994d: Euclidean reconstruction from uncalibrated views. In Mundy/Zisserman/Forsyth (Eds), Application of Invariance in Computer Science, Lecture Notes in Computer Science, Springer Verlag, Vol. 825, pp. 237-256 Hartley, 2000 Hartley, R., 2000: Ambiguous configurations for 3-view projective reconstruction. Proceedings of ECCV, pp. 922-935, Dublin, Ireland Hartley and Zisserman, 2000 Hartley, R. and Zisserman, A., 2000: Multiple view geometry. Cambridge University Press Harris and Stephens, 1988 Harris, C. and Stephens, M., 1988: A combined edge and corner detector. Proceedings of Alvey Vision Conference Hastie and Stuetzle, 1989 Hastie, T. and Stuetzle W., 1989: Principal curves. JASA, Vol. 84, pp. 502-516 Havaldar et al., 1996 Havaldar, P., Lee, M.S. and Medioni, G., 1996: View synthesis from unregistered 2-D images. Proceedings of Graphics Interface '96, pp. 61-69 Healey and Binford, 1987 Healey, G. and Binford, T.O., 1987: Local Shape from Specularity. IEEE Proceedings of ICCV, London Heikkilä, 1991 Heikkilä, J., 1991: Use of linear features in digital photogrammetry. Photogrammetric Journal of Finland, 12(2), pp. 40-56 Heitger et al., 1992 Heitger, F., Rosenthaler, L., von der Heydt, R., Peterhans, E. and Kübler, O., 1992: Simulation of neural contour mechanism: from simple to end-stopped cells. In Vision Research, 32(5), pp. 963-981 Heok and Damen, 2004 Heok, T.K. and Damen, D. 2004: A review of level of detail. IEEE Int. Conf. Computer Graphics, Imaging and Visualization (CGIV'04) Heyden and Aström, 1997 Heyden, A and Aström, K., 1997: Euclidean reconstruction from image sequence with varying and unknown focal length and principal point. IEEE Proceedings of CVPR, pp. 438-443 Hilton et al., 2000 Hilton, A., Beresfors, D., Gentils, T., Smith, R., Sun, W. and Illingworth, J., 2000: Whole-body
145
BIBLIOGRAPHY
modeling of people from multiview images to populate virtual worlds. The Visual Computer, Vol. 16, pp. 411-436 Hoppe et al., 1992 Hoppe, H., DeRose, T., Duchamp, T., McDonald, J. and Stuetzle, W., 1992: Surface reconstruction from unorganized points. ACM Proceedings of SIGGRAPH '92, pp.71-78 Hoppe, 1997 Hoppe, H., 1997: View-dependent refinement of progressive meshes. ACM Proceedings of SIGGRAPH ‘97, pp.189-198 Hoppe, 1998 Hoppe, H., 1998: Smooth view-dependent level of detail control and its application to terrain rendering. IEEE Proceedings on Visualization, pp.25-42 Horn and Brooks, 1989 Horn, B.K.P. and Brooks, M.J., 1989: Shape from Shading. MIT Cambridge Press Howe et al., 2000 Howe, N., Leventon, M. and Freeman, W., 2000: Bayesian reconstruction of 3D human motion from single-camera video. Advances in Neural Information Processing System, Vol. 12, pp. 820-826, MIT Press Huber, 1991 Huber, P.J., 1991: Between robustness and diagnostics. In Stahel/Weisberg (Eds), Directions in Robust Statistics and Diagnostics, pp. 121-130, Springer Verlag Human Figure Drawing Proportion: http://www.mauigateway.com/~donjusko/human.htm Ju et al., 2000 Ju, X., Werghi N. and Siebert, J.P., 2000: Automatic segmentation of 3D human body scans. International Conference on Computer Graphics and Imaging (CGIM 2000), pp 239-244 Jung and Boldo, 2004 Jund, F. and Boldo, D., 2004: Bundle adjustment and incidence of linear features on the accuracy of external calibration parameters. IAPRS, 35(B3), Istanbul, Turkey Jurie and Schmid, 2004 Jurie, F. and Schmid, C., 2004: Scale-Invariant shape features for recognition of object categories. Proc. of CVPR, vol. 02, pp. 90-96 Kadir and Brady, 2001 Kadir, T. and Brady, M., 2001. Scale, saliency and image description. International Journal of Computer Vision, Vol. 45(2), pp. 83-105 Kadir et al., 2004 Kadir, T., Zisserman, A. and Brady, M., 2004: An affine invariant salient region detector. Proceedings of 8th ECCV, pp. 404-416 Kahl et al., 2000 Kahl, F., Triggs, B. and Aström, K., 2000: Critical motions for auto-calibration when intrinsic parameters can vary. Journal of Mathematical Imaging and Vision, 13, pp. 131-146 Kahl et al., 2001 Kahl, F., Hartley, R. and Aström, K., 2001: Critical configurations for N-views projective reconstruction. IEEE Proceedings of CVPR01, Vol. 2, pp. 158-163 Kang, 1999 Kang, S.B., 1999: A survey of image-based rendering techniques. In Videometrics VI, El-Hakim/ Grün (Eds), SPIE Vol. 3641, pp. 2-16 Kannala and Brandt, 2004 Kannala, J. and Brandt S., 2004 : A generic camera calibration method for fish-eye lenses. Proceedings of Int. Conference on Patter Recognition
146
BIBLIOGRAPHY
Karner et al., 2001 Karner, K., Bauer J., Klaus A., Leberl F. and Grabner M., 2001: Virtual habitat: models of the urban outdoors. In Grün/Baltsavias/Van Gool (Eds): Workshop on 'Automated Extraction of Man-Made Objects from Aerial and Space Images' (III), Balkema Publishers, pp 393-402, Ascona, Switzerland Kender, 1978 Kender, J.R., 1978: Shape from texture. Proceedings of DARPA I.U. Workshop Khalil and Grussenmeyer, 2002 Khalil, O.A. and Grussenmeyer, P., 2002: Single image and topology approaches for modeling buildings. IAPRS, V34(5), pp. 131-136 Kim et al., 2004 Kim, K., Chalidabhongse, T.H., Harwood, D. and Davis, L.: Background modeling and subtraction by codebook construction. IEEE Int. Conf. on Image Processing (ICIP) Kim and Pollefeys, 2004 Kim S.J. and M. Pollefeys, 2004: Radiometric self-alignment of image sequences. IEEE Proceedings of CVPR, pp. 645-651 Klette et al., 1998 Klette R., Schlüns, K. and Koschan, A.: Computer Vision: Three-dimensional data from images. Springer Press, 1998 Kostka, 1974 Kostka, R., 1974: Die Stereophotogrammetrische Aufnahme des Grossen Buddha in Bamiyan. Afghanistan Journal, 3(1), pp. 65-74. Krishnamurthy and M. Levoy, 1996 Krishnamurthy, V. and Levoy, M, 1996: Fitting smooth surfaces to dense polygon meshes. Proceedings of 23rd Annual Conference on Computer Graphics and Interactive Techniques, ACM Press, pp. 313-324 Kruppa, 1913 Kruppa, E., 1913: Zur ermittlung eines Objektes aus zwei perspektiven mit inner orientierung. Sitz.-Ber. Akad. Wiss., Math. Naturw. Abt. IIa, Vol. 122, pp. 1939-1948 Kumar et al., 1996 Kumar, S., Manocha, D., Garrett, W. and Lin, M., 1996: Hierarchical back-face computation. Proceedings of Eurographics Rendering Workshop, pp.231-240 Ilic and Fua, 2003 Ilic, S. and Fua, P., 2003: From explicit to implicit surfaces for visualization, animation and modeling, Proceedings of the international workshop on visualization and animation of reality based 3D models, IAPRS, 34(5W10) on CD-Rom ImageModeler: http://www.realviz.com [April 2006] Inspeck: http://www.inspeck.com [April 2006] Isenburg et al., 2003 Isenburg, M., Lindstrom, P., Gumhold, S. and Snoeyink, J., 2003: Large mesh simplification using processing sequences. IEEE Proceedings on Visualization, pp. 465-472 Isselhard, 1997 Isselhard, F., 1997: Polyhedral reconstruction of 3D objects by tetrahedra removal. Technical report No. 288/97, Fachbereich Informatik, University of Kaiserslautern, Germany iWitness: http://www.photometrix.com.au [April 2006] Läbe and Förstner, 2005
147
BIBLIOGRAPHY
Läbe, T. and Förstner, W., 2005: Erfahrungen mit einem neuen vollautomatischen Verfahren zur Orientierung digitaler Bilder. Proceedings of DGPF Conference, Rostock, Germany Lee and Chen, 1985 Lee, H.J. and Chen, Z., 1985: Determination of human body posture from a single view. Computer Vision, Graphics, Image Process, Vol. 30, pp. 148-168 Lee et al., 2000 Lee, W., Gu J. and Magnenat-Thalmann, N., 2000: Generating animatable 3D virtual humans from photographs. Eurographics, 19(3) Lee and Nevatia, 2003 Lee, S.C. and Nevatia, R., 2003: Interactive 3D building modeling using a hierarchical representation. IEEE Workshop on Higher-Level Knowledge in 3D Modeling and Motion (HLK), part of ICCV 2003, Nice, pp. 58-65 Lepetit and Fua, 2005 Lepetit,V. and Fua, P., 2005: Monocular model-based 3D tracking of rigid objects: a survey. Foundations and Trends in Computer Graphics and Vision, 1(1), pp. 1-89 Levenberg, 2002 Levenberg, J., 2002: Fast view-dependent level-of-detail rendering using cached memory. IEEE Proceedings on Visualization (VIS 02), pp. 259-265 Liebowitz et al., 1999 Liebowitz, D., Criminisi, A. and Zisserman, A., 1999: Creating architectural models from images. Proceedings of Eurographics’99, 18(3) Liebowitz, 2001 Liebowitz, D., 2001: Camera calibration and reconstruction of geometry from images. PhD Thesis, Robotics Research Group, Dept. of Eng. Science, University of Oxford, UK Lightwave: http://www.newtek.com [April 2006] Lindeberg, 1998 Lindeberg, T., 1998: Feature detection with automatic scale selection. International Journal of Computer Vision, Vol. 30(2), pp. 79-116 Lindstrom and Pascucci, 2002 Lindstrom, P. and Pascucci, V., 2002: Terrain simplification simplified: a general framework for view-dependent out-of-core visualization. IEEE Transaction on Visualization and Computer Graphics, 8(3), pp. 239-254 Longuet-Higgins, 1981 Longuet-Higgins, H.C., 1981: A Computer algorithm for reconstructing a scene from two projections. Nature, pp. 133-135 Lourakis and Deriche, 1999 Lourakis, M. and Deriche, R., 1999: Camera self-calibration using the singular value decomposition of the fundamental matrix: from point correspondences to 3D measurements. INRIA Tech.Rep. N.3748 Lowe, 2004 Lowe, D., 2004: Distinctive image features from scale invariant keypoints. IJCV, 2(60), pp. 91110 Lucas and Kanade, 1981 Lucas, B.D. and Kanade, T., 1981: An iterative image registration technique with an applicatiuon to stereo vision. Proceedings of 7th International Joint Conference on Artificial Intelligence Lugnani, 1980 Lugnani, J.B., 1980: Using digital entities as control. PhD Thesis, Dept. of Surveyng Eng., University of New Brunswick, Fredericton, Canada
148
BIBLIOGRAPHY
Maas, 1991 Maas, H.-G., 1991: Digital photogrammetry for determination of tracer particle coordinates in turbulent flow research. PE&RS, Vol. 57(12), pp. 1593-1597 Maas, 1992 Maas, H.G., 1992: Robust automatic surface reconstruction with structured light. IAPRS, 24(B5), pp. 102-107 Magee and Aggarwal, 1984 Magee, M.J. and Aggarwal, J.K., 1984: Determining vanishing points from perspective images. CVGIP, Vol. 26, pp. 256-267 Magnenat-Thalmann and Thalmann, 1994 Magnenat-Thalmann, N. and Thalmann, D., 1994: Towards virtual humans in medicine: a prospective view. Computerized Medical Imaging and Graphics, v. 18(2), pp. 97-106 Masry, 1981 Masry, 1981: Digital mapping using entities: a new concept. PE&RS, Vol. 48(11), pp. 1561-1565 Matas et al., 2002 Matas, J., Chum, O., Urban, M. and Pajdla, T., 2002: Robust wide baseline stereo from maximally stable extremal regions. Proceedings of BMVC, pp. 384-393 Matchmover MatchMover: http://www.realviz.com [April 2006] Maya: http:// www.aliaswavefront.com [April 2006] Maybank and Faugeras, 1992 Maybank, S. J. and Faugeras, O.D., 1992: A theory of self-calibration of a moving camera. IJCV, 8(2), pp. 123-152 Mayer, 2003 Mayer, H., 2003: Robust orientation, calibration, and disparity estimation of image triplets. 25th DAGM Pattern Recognition Symposium (DAGM03), Number 2781, series LNCS, Michaelis/ Krell (Eds.), Magdeburg, Germany McKenna et al., 2000 McKenna, S., Jabri, S., Duric, Z., Rosenfeld, A. and Wechsler, H., 2000: Tracking groups of people. CVIU Journal, Vol. 80, pp. 42-56 Megyesi and Chetverikov, 2004 Megyesi, Z. and Chetverikov, D., 2004: Affine propagation for surface reconstruction in wide baseline stereo. Proceedings of the 17th International Conference on Pattern Recognition, ICPR 2004, 23-26 August, Cambridge, UK. Vol.4, pp. 76-79 Meissl, 1965 Meissl, P., 1965: Uber die innere Genauigkeit dreidimensionaler Punkthaufen. Zeitschrift für Vermessungswesen, Vol. 90(4), pp. 109-118 Mencl, 2001 Mencl, R., 2001: Reconstruction of surfaces from unorganized 3D points clouds. PhD Thesis, Dortmund University, Germany Merrian, 1992 Merriam, M., 1992: Experience with the cyberware 3D digitizer. Proceedings NCGA, pp. 125133 Mikolajczyk and Schmid, 2001 Mikolajczyk, K. and Schmid, C., 2001: Indexing based on scale invariant interest points. IEEE Proceedings of 8th ICCV, pp. 525-531 Mikolajczyk and Schmid, 2002 Mikolajczyk, K. and Schmid, C., 2002: An affine invariant interest point detector. Proceedings of
149
BIBLIOGRAPHY
7th ECCV, pp. 128-142 Mikolajczyk and Schmid, 2003 Mikolajczyk, K. and Schmid, C., 2003: A performance evaluation of local descriptors. IEEE Proceedings of CVPR Mikolajczyk and Schmid, 2004 Mikolajczyk, K. and Schmid, C., 2004: Scale and affine invariant interest point detectors. IJCV, 1(60), pp. 63-86 Mikolajczyk et al., 2004 Mikolajczyk, K., Tuytelaars, T., Schmid, C., Zissermann, A., Matas, J., Schaffalitzky, F., Kadir, T. and Van Gool, L., 2004: A Comparison of affine region detectors. IJCV, 2004 Mikolajczyk and Schmid, 2005 Mikolajczyk, K. and Schmid, C., 2005: A performance evaluation of local descriptors. Accepted for PAMI Miller et al., 1991 Miller, J.V., Breen, D., Lorensen, W., O'Bara, R. and Wozny, M, 1991: Geometrically deformed models: A method for extracting closed geometric models from volume data. ACM Proceedings of SIGGRAPH ‘91, 25(4), pp. 217-226 Minoru and Nakamura, 1993 Minoru, A. and Nakamura T., 1993: Cylindrical shape from contour and shading without knowledge of lighting conditions or surface albedo. IPSJ Journal, 34(5) Moore and Warren, 1990 Moore D. and Warren, J., 1990: Approximation of dense scattered data using algebraic surfaces. TR Nr. 90-135, Rice University, USA Moravec, 1979 Moravec, H.P., 1979: Visual mapping by robot rover. Proceedings of 6th International Joint Conference on Artificial Intelligence, pp. 598-600 Motion Analysis: http://www.motionanalysis.com [April 2006] Mulawa and Mikhail, 1988 Mulawa, D.C. and Mikhail, E.M., 1988: Photogrammetric treatment of linear features. IAPRS, 27(B10), pp. 383-393 Mündermann et al., 2005 Mündermann, L., Mündermann, A., Chaudhari, A.M., Andriacchi, T., 2005: Conditions that influence the accuracy of anthropometric parameter estimation for human body segments using shape-from-silhouette. In Videometrics VIII, Beraldin/El-Hakim/Grün/Walton (Eds), SPIE Vol.5665, pp. 268-287 Muraki, 1991 Muraki, S, 1991: Volumetric shape description of range data using "blobby model". ACM Proceedings of SIGGRAPH ‘91, pp. 217-226 Niini, 1994 Niini, I., 1994: Relative orientation of multiple images using projective singular correlation. Spatial Information from Digital Photogrammetry and Computer Vision, SPIE Vol. 2357, Ebner/ Heipke/Eder (Eds), pp. 615-621 Niem and Broszio, 1995 Niem, W. and H. Broszio, H., 1995: Mapping texture from multiple camera views onto 3D-object models for computer animation. Proceedings of the International Workshop on Stereoscopic and Three Dimensional Imaging Nister, 2001 Nister, D., 2001: Automatic dense reconstruction from uncalibrated video sequences. PhD The-
150
BIBLIOGRAPHY
sis, Computational Vision and Active Perception Lab, NADA-KHT, Stockholm, 226 pages Nister, 2004 Nister, D., 2004: Automatic Passive Recovery of 3D from Images and Video. IEEE Proceedings of the 2nd Intl Symp 3D Data Processing, Visualization, and Transmission (3DPVT 2004) Ortin and Remondino, 2005 Ortin, D., Remondino, F., 2005: Generation of occlusion-free images for texture mapping purposes. IAPRS, 36(5/W17), on CD-Rom Pan, 1995 Pan H.P., Huynh, D.Q. and Hamlyn G.K., 1995: Two-image resituation: practical algorithm. In Videometric IV, El-Hakim (Ed), SPIE Vol. 2598, pp. 174-190 Pan, 1997 Pan, H., 1997: The kernel of a direct closed-form solution to general relative orientation. Proceedings of Intern. Workshop Series on Image Analysis and Information Fusion, Adelaide, Australia Panoguide Panoguide: http://www.panoguide.com [April 2006] Papo and Perelmuter, 1981 Papo, H.B. and Perelmuter, A., 1981: Datum definition in free net adjustment. Bulletin Geodesique, Vol. 55(3) Patias et al., 1995 Patias, P., Petsa, E. and Streilein, A., 1995: Digital line photogrammetry - Concepts, Formulation, Degeneracies, Simulations, Algorithms, Practical examples. IGP Bericht Nr. 252, ETH Zurich, Switzerland, 54 pp. Patias, 2001 Patias, P., 2001: Photogrammetry and Visualization. Technical Report, Institute of Geodesy and Photogrammetry, ETH Zurich, Switzerland. Available at http://www.photogrammetry.ethz.ch/ research/guest.html [April 2006] Perelmuter, 1979 Perelmuter, A., 1979: Adjustment of free networks. Bulletin Geodesique, 53(4) Petsa and Patias, 1994 Petsa, E. and Patias, P., 1994: Formulation and assesment of straight line based algorithms for digital photogrammetry. IAPRS, 30(5), pp. 310-317 Photogenesis PhotoGenesis: http://www.plenoptics.com [April 2006] Pilu, 1997 Pilu, M.: Uncalibrated stereo correspondences by singular value decomposition. TR HPL-97-96, HP Bristol, 1997 Plaenkers, 2001 Plaenkers, R., 2001: Human body modeling from video sequences. Ph.D. Thesis, EPF Lausanne, Switzerland Polhemus: http://www.polhemus.com [April 2006] Pollefeys et al., 1996 Pollefeys, M, Van Gool, L. and Oosterlinck, A., 1996: The modulus constraint: a new constraint for self-calibration. IEEE Proceedings of CVPR, pp. 349-353 Pollefeys and Van Gool, 1997 Pollefeys, M. and Van Gool, L., 1997: A stratified approach to metric self-calibration. IEEE Proceedings of CVPR, pp. 407-412 Pollefeys et al., 1999
151
BIBLIOGRAPHY
Pollefeys, M., Koch, R. and Van Gool, L., 1999: Self-calibration and metric reconstruction in spite of varying and unknown internal camera parameters. IJCV, 32(1), pp. 7-25 Pollefeys et al., 2004 Pollefeys, M., Van Gool, L., Vergauwen, M., Verbiest, F., Cornelis, K., Tops, J. and Koch, R., 2004: Visual modeling with a hand-held camera. IJCV, 59(3), 207-232 Pontinen, 2002 Pontinen, P., 2002: Camera calibration by rotation. IAPRS, 34(5), pp. 585-589 Pope, 1975 Pope, A.J., 1975: The statistics of residuals and the detection of outliers. XVI General Assembly of IAG, Grenoble PhotoModeler: http://www.photomodeler.com [April 2006] PolyWorks: http://www.innovmetric.com [April 2006] Pritchett and Zisserman, 1998 Pritchett, P. and Zisserman, A. 1998: Matching and reconstruction from widely separated views. 3D Structure from Multiple Images of Large-Scale Environments, LNCS 1506 Pulli et al., 1998 Pulli, K., Abi-Rached, H., Duchamp, T. Shapiro, L.G. and Stuetzle, W., 1998: Acquisition and visualization of colored 3-D objects. Proceedings of Int. Conference on Pattern Recognition, pp. 99-108 Qualisys: http://www.qualisys.com [April 2006] RapidForm: http://www.rapidform.com [April 2006] Remondino, 2003 Remondino, F., 2003: Recovering metric information from old monocular video sequences. 6th Optical 3D Measurement Technique Conference, Grün/Kahmen (Eds), Vol. 2, pp. 214-222 Remondino and Roditakis, 2003 Remondino, F. and Roditakis, A., 2003: Human Figure Reconstruction and Modeling from Single Images or Monocular Video Sequences. 4th International Conference on "3-D Digital Imaging and Modeling" (3DIM), pp. 116-123 Remondino, 2004 Remondino, F., 2004: 3-D Reconstruction of static human body shape from image sequence. Journal of Computer Vision and Image Understanding, 93(1), pp. 65-85 Remondino and Börlin, 2004 Remondino, F. and Börlin, N., 2004: Photogrammetric calibration of image sequences acquired with a rotating camera. IAPRS, Vol. 34(5/W6), on CD-ROM Remondino and Niederöst, 2004 Remondino, F. and Niederöst, J., 2004: Generation of high-resolution mosaic for photo-realistic texture-mapping of cultural heritage 3D models. Proceedings of the 5th International Symposium on Virtual Reality, Archaeology and Cultural Heritage (VAST) - Cain/Chrysanthou/ Niccolucci/Silberman (Eds), pp. 85-92 Remondino et al., 2005 Remondino, F., Guarnieri, A. and Vettore, 2005: 3D Modeling of close-range objects: photogrammetry or laser scanning? In Videometrics VIII, Beraldin/El-Hakim/Grün/Walton (Eds), SPIE Vol.5665, pp. 216-225 Riegl: http://www.riegl.com [April 2006]
152
BIBLIOGRAPHY
Rioux et al., 1987 Rioux, M., Bechthold, G., Taylor, D. and Duggan, M., 1987: Design of a large depth of view three-dimensional camera for robot vision. Optical Engineering, 26(12), pp. 1245-1250. Rocchini et al., 2002 Rocchini, C., Cignoni, P., Montani, C. and Scopigno, R, 2002: Acquiring, stiching and blending diffuse appearance attributes on 3D models. The Visual Computer, 18, pp. 186-204 Roncella et al., 2005 Roncella, R., Remondino, F. and Forlani, G., 2005: Photogrammetric bridging of GPS outages in mobile mapping. In Videometrics VIII, Beraldin/El-Hakim/Grün/Walton (Eds), SPIE Electronic Imaging, Vol.5665, pp. 308-319 Rosales and Sclaroff, 2000 Rosales, R. and Sclaroff, S., 2000: Inferring body pose without tracking body parts. IEEE Proceedings of CVPR, Vol.2, pp. 721-727 Rossignac and Borrel, 1993 Rossignac, J. and Borrel, P., 1993: Multi-resolution 3D approximation for rendering complex scenes. In Geometric Modeling in Computer Graphics. Falcidieno/Kunii, (Eds) Springer Verlag, pp. 455-465 Roth and Whitehead, 2000 Roth, G. and Whitehead, A., 2000: Using projective vision to find camera positions in an image sequence. Proceedings of 13th Vision Interface Conference Roth, 2004 Roth, G., 2004: Automatic correspondences for photogrammetric model building. IAPRS, Vol. 35(B5), pp. 713-718 Rother, 2000 Rother, C., 2000: A new approach for vanishing point detection in architectural environments. Proceedings of 11th BMVC, pp 382-291 Rousseeuw and Leroy, 1987 Rousseeuw, P. and Leroy, A., 1987: Robust regression and outlier detection. John Wiley & Sons, New York Rusinkiewicz and Levoy, 2000 Rusinkiewicz, S. and Levoy, M., 2000: QSplat: a multi-resolution point rendering system for large meshes. ACM Proceedings of SIGGRAPH 2000, pp.343-352 Sablatnig and Menard, 1997 Sablatnig, R. and Menard, C., 1997: 3D Reconstruction of archaeological pottery using profile primitives. Sarris/Strintzis (Eds), Proceedings of International Workshop on Synthetic-Natural Hybrid Coding and Three-Dimensional Imaging, pp. 93-96 Sangi et al., 1999 Sangi P., Heikkilä J. and Silven O., 1999: Experiments with shape-based deformable object tracking. Proceedings 11th Scandinavian Conference on Image Analysis Schaffalisky and Zisserman, 2002 Schaffalisky, F. and Zisserman, A., 2002: Multiview matching for unordered image sets. Proceedings of ECCV Scharstein and Szeliski, 2002 Scharstein, D. and Szeliski, R., 2002: A taxonomy and evaluation of dense two-frame stereo correspondence algorithms. IJCV, 47(1/2/3), pp. 7-42 Schenk, 2004 Schenk, T., 2004: From point-based to feature-based aerial triangulation. ISPRS Journal of Photogrammetry and Remote Sensing, 58(5-6), pp. 315-329 Schindler and Bauer, 2003
153
BIBLIOGRAPHY
Schindler, K. and Bauer, J., 2003: A model-based method for building reconstruction. IEEE Proceedings ICCV Workshop on Higher-Level Knowledge in 3D Modeling and Motion (HLK'03) Schmid et al., 2000 Schmid, C., Mohr, R. and Bauckhage, C., 2000: Evaluation of interest point detectors. IJCV, Vol. 37 (2), pp. 151-172 Seo and Hong, 1999 Seo, Y. and Hong, K.S., 1999: About the self-calibration of a rotating and zooming camera: theory and practise. IEEE Proceedings of 7th ICCV, pp. 183-189 Seo and Thalmann, 2003 Seo, H. and Magnenat-Thalmann, N., 2003: An automatic modeling of human bodies from sizing parameters. ACM Proceedings of SIGGRAPH Symposium on Interactive 3D Graphics, pp. 19-26 Semple and Kneebone, 1954 Semple, J.G. and Kneebone, G.T., 1954: Algebraic Projective Geometry. Oxford Press Sequeira et al., 1999 Sequeira V., Ng K., Wolfart E. and Goncalves J.G.M., 1999: Automated reconstruction of 3D models from real environments. ISPRS Journal for Photogrammetry and Remote Sensing, 54(1), pp. 1-22 Sequeira et al., 2001 Sequeira, V., Wolfart, E., Bovisio, E., Biotti, E., Goncalves, J.G., 2001: Hybrid 3D reconstruction and image-based rendering techniques for reality modeling. In Videometrics and Optical Methods for 3D Shape Measurement, El-Hakim/Grün (Eds), SPIE Vol. 4309 , pp. 126-136 Shah and Aggarwal, 1996 Shah, S. and Aggarwal, J., 1996: Intrinsic paramater calibration procedure for (high-distortion) fish-eye lens camera with distortion model and accuracy estimation. Patter Recognition, Vol. 29(11), pp. 1175-1188 ShapeCapture: http://www.shapecapture.com [April 2006] ShapeGrabber: http://www.shapegrabber.com [April 2006] Shan et al., 2001 Shan, Y., Liu, Z. and Zhang, Z., 2001: Model-based bundle adjustment with application to face modeling. IEEE Proceedings of ICCV, pp. 644-651 Shashua and Wolf, 1994 Shashua, A. and Wolf, L., 1994: Trilinearity in visual recognition by alignment. Proceedings of 3rd ECCV, pp. 479-484 Shashua, 1997 Shashua, A., 1997: Trilinear tensor: the fundamental construct of multiple-view geometry and its applications. Proceedings of the Int. Workshop on Algebraic Frames for the Perception Action Cycle Shi and Tomasi, 1994 Shi, J. and Tomasi, C., 1994: Good features to track. IEEE Proceedings of CVPR, pp. 593-600 Shih, 1990 Shih, T.-Y., 1990: On the duality of relative orientation. PE&RS, 56(9), pp. 1281-1283 Shum and Kang, 2000 Shum, H-Y. and Kang, S.B., 2000: A review of image-based rendering techniques. IEEE/SPIE Visual Communications and Image Processing (VCIP) 2000, pp. 2-13 Slama, 1980
154
Section BIBLIOGRAPHY
Slama, C., 1980: Manual of Photogrammetry. ASPRS, Falls Church, Virginia Sidenbladh et al., 2000 Sidenbladh, H., Black, M. and Fleet, D., 2000: Stochastic tracking of 3D human figures using 2D image motion. Proceedings of ECCV, Vernon (Ed.), Springer Verlag, LNCS 1843, Dublin, Ireland, pp. 702-718 Sminchisescu, 2002 Sminchisescu, C, 2002: Three dimensional human modeling and motion reconstruction in monocular video sequences. Ph.D. Dissertation, INRIA Grenoble, France Smith and Brady, 1997 Smith, S.M. and Brady, J.M., 1997: SUSAN - a new approach to low level image processing. Int. Journal of Computer Vision, Vol. 23(1), pp. 45-78 Starck and Hilton, 2003 Starck, J. and Hilton, A., 2003: Model-based multiple view reconstruction of people. IEEE Proceedings of ICCV’03, pp. 915-922 Stauffer and Grimson, 1999 Stauffer, C. and Grimson, W.E.L., 1998: Adaptive bacground misture models for real-time tracking. IEEE Proceedinsg of CVPR, pp. 246-252 Stefanovic, 1973 Stefanovic, P., 1973: Relative orientation - a new approach. ITC Journal, 1973, pp. 417-448 Stein, 1995 Stein, G.P., 1995: Accurate camera calibration using rotation with analysis of source error. IEEE Proceedings of 5th ICCV, pp.230-236 Strecha et al., 2003 Strecha, C., Tuytelaars, T. and Van Gool, L., 2003: Dense matching of multiple wide-baseline views. Proceedings of 9th IEEE International Conference on Computer Vision, 13-16 October 2003, Nice, France. Vol.2, pp. 1194-1201 Stylianidis and Patias, 2002 Stylianidis, E. and Patias, P., 2002: 3D object reconstruction in close range photogrammetry. IAPRS, 34(5), pp. 216-220 Streilein, 1994 Streilein, A., 1994: Towards automation in architectural photogrammetry: CAD-based 3D-feature extraction. ISPRS Journal of Photogrammetry & Remote Sensing, 49(5), pp. 4-15 Sturm, 1997 Sturm, P., 1997: Critical motion sequences for monocular self-calibration and uncalibrated euclidean reconstruction. IEEE Proceedings of CVPR, pp. 1100-1105 Taubin and Rossignac, 1998 Taubin, G. and Rossignac, J., 1998: Geometric compression through topological surgery. ACM Trans. on Graphics, 17(2) Taylor, 2001 Taylor, C.T., 2001: Reconstruction of articulated objects from point correspondences in a single uncalibrated image. Computer Vision and Image Understanding. Vol. 80, pp. 349-363 Tecklenburg et al., 2001 Tecklenburg, W., Luhmann, T. and Hastedt, H., 2001: Camera modeling with image-variant parameters and finite elements. In Optical 3D Measurement Techniques V, Grün/Kahmen (Eds), Vienna, pp. 328-335 Terzopoulos, 1988 Terzopoulos, D., 1988: The computation of visible surface representation. IEEE Transactions on PAMI, 10(4) Thompson, 1959
155
BIBLIOGRAPHY
Thompson, E.H., 1959: A rational algebraic formulation of the problem of relative orientation. Photogrammetric Record, 3(14), pp. 152-159 Tomasi and Kanade, 1991 Tomasi, C. and Kanade, T., 1991: Shape and motion from image streams: a factorizaton method part 3 on ‘Detection and Tracking of Point Features’. Technical Report CMU-CS-91-132, Carnegie Mellon University, Pittsburgh, PA, USA Tommaselli and Lugnani, 1988 Tommaselli, A. and Lugnani, J., 1988: An alternative mathematical model to collinearity equations using straight features. IAPRS, 27(B3), pp. 765-774 Torr and Murray, 1997 Torr, P. and Murray, D., 1997: The development and comparison of robust methods for estimating the fundamental matrix. IJCV, 24(3), pp. 271-300 Torlergård, 1981 Torlergård, K., 1981: Accuracy improvment in close range photogrammetry. Schriftenreihe Wissenschaftlichen Studiengang Vermessungswesen, Hochschule der Bundeswehr München, Vol. 5, 68 pp Triggs, 1997 Triggs, B., 1997: The absolute quadratic. IEEE Proceedings of CVPR, pp. 609-614 Triggs et al., 2000 Triggs, B., McLauchlan, P.F., Hartley, R. and Fitzgibbon, A., 2000: Bundle adjustment - A modern synthesis. In Vision Algorithm ‘99, Triggs/Zisserman/Szeliski (Eds), LNCS 1883, pp. 298-372 Tuytelaars and Van Gool, 2004 Tuytelaars, T. and Van Gool, L., 2004: Matching widely separated views based on affine invariant regions. IJCV, 1(59), pp. 61-85 Ulipinar and Nevatia, 1995 Ulupinar F. and Nevatia R., 1995: Shape from contour: straight homogeneous generalized cylinders and constant cross section generalized cylinders. IEEE Transaction PAMI, 17(2) Urtasun and Fua, 2004 Urtasun, R. and Fua, P., 2004: 3-D Human body tracking using deterministic temporal motion models. Proceedings of ECCV04, Prague, Czech Republic Van den Heuvel, 1998a Van den Heuvel, F.A, 1998: 3D reconstruction from a single image using geometric constraint. ISPRS Journal of Photogrammetry and Remote Sensing, 53(6), pp. 354-368 Van den Heuvel, 1998b Van den Heuvel, F.A., 1998: Vanishing point detection for architectural photogrammetry. IAPRS, 32(5), pp. 652-659 Van den Heuvel, 1999a Van den Heuvel, F.A., 1999a: A line-photogrammetric mathematical model for the reconstruction of polyhedral objects. In Videometrics VI, El-Hakim/Grün (Eds), SPIE Vol. 3641, pp. 6071 Van den Heuvel, 1999b Van den Heuvel, F.A., 1999b: Estimation of interior parameters from constraints on line measurements in a single image. IAPRS, 32(5), pp. 81-88 Van den Heuvel, 2003 Van den Heuvel, F., 2003: Automation in architectural photogrammetry. PhD Thesis, Publication on Geodesy 54, Netherlands Geodetic Commission Van Gool and Zisserman, 1996 Van Gool, L. and Zisserman, A., 1996: Automatic 3D model building from video sequences. Pro-
156
Section BIBLIOGRAPHY
ceedings of European Conference on Multimedia Applications, Services and Techniques, pp. 563-582 Van Gool et al., 1996 Van Gool, L., Moons, T. and Ungureanu, D., 1996: Affine / photometric invariants for planar intensity pattern. Proc. of 4th ECCV, pp. 642-651 Vedula and Baker, 1999 Vedula, S. and Baker, S., 1999: Three dimensional scene flow. IEEE Proceedings of ICCV, Vol. 2, pp. 722-729 Vicon: http://www.vicon.com [April 2006] Visnovcova et al., 2001 Visnovcova (Niederoest), J., Zhang, L. and Grün, A., 2001: Generating a 3D model of a Bayon tower using non-metric imagery. IAPRS, 34(5/W1), pp. 30-39 Visual Body Proportion: http:// www2.evans-ville.edu/drawinglab/body.html [April 2006] Vitronics: http://www.vitus.de [April 2006] V V-STARS: http://www.geodetic.com [April 2006] Xiao and Shah, 2003 Xiao, J. and Shah, M. 2003: Two-frame wide baseline matching. IEEE Proceeding of 9th ICCV, Vol. 1, pp. 603-610 Yamamoto, 1998 Yamamoto, M., Sato, A., Kawada, S., Kondo, T. and Osaki, Y., 1998: Incremental Tracking of Human Actions from Multiple Views. IEEE Proceedings of CVPR Wahl, 1984 Wahl, F.M., 1984: A Coded light approach for 3-Dimensional vision. IBM Research Report, RZ 1452 Wallis, 1976 Wallis, R., 1976: An approach to the space variant restoration and enhancement of images. Proc. of Symposium on Current Mathematical Problems in Image Science, Naval Postgraduate School, Monterey, CA Wang and Tsai, 1990 Wang, L. and Tsai, W.H., 1990: Computing camera parameters using vanishing-line information from a rectangular parallelepiped. Machine Vision and Application, Vol. 3, pp. 129-141 Weinhaus and Devich, 1999 Weinhaus, F.M. and Devich, R.N., 1999: Photogrammetric texture mapping onto planar polygons. Graphical Models and Image Processing, 61(1): 61-83 Wester-Ebbinghaus, 1982 Wester-Ebbinghaus, W., 1982: Single station self-calibration: mathematical formulation and first experiences. IAPRS, 24(5/2), pp. 533-550 Werner and Zisserman, 2002 Werner, T. and Zisserman, A., 2002: New technique for automated architectural reconstruction from photographs. Proceedings 7th ECCV, Vol.2, pp. 541-555 Wicks&Wilson: http://www.wwl.co.uk/ [April 2006] Wilczkowiak et al., 2003 Wilczkowiak, M., Trombettoni, G., Jermann, C., Sturm, P. and Boyer, E., 2003: Scene modeling based on constraint system decomposition techniques. IEEE Proceedings 9th ICCV, pp. 1004-
157
BIBLIOGRAPHY
1010 Wimmer et al., 2001 Wimmer, M., Wonka, P. and Sillionet, F., 2001: Point-based impostors for real-time visualization. Proceedings of Eurographics Workshop on Rendering. Berlin: Springer Winkelback and Wahl, 2001 Winkelbach, S. and Wahl, F.M., 2001: Shape from 2D edge gradient. DAGM Pattern Recognition, Lecture Notes in Computer Science 2191, Springer Verlag Wolf and Dewitt, 2000 Wolf, P. and Dewitt, B., 2000: Elements of Photogrammetry. McGraw Hill, New York World-Heritage-Tour: http://www.world-heritage-tour.org [April 2006] Wrobel, 2001 Wrobel, B., 2001: Minimum solutions for orientation. In Grün/Huang (Eds), Calibration and Orientation of cameras in computer vision, Springer, Vol. 34, pp. 7-56 Zhang and Deriche, 1994 Zhang, Z. and Deriche, R.: A robust technique for matching two uncalibrated images through the recovery of the unknown epipolar geometry. TR 2273, INRIA, 1994 Zhang, 1995 Zhang, Z., 1995: Parameters estimation techniques: a tutorial with application to conic fitting. INRIA Research Report, No. 2676 Zhang, 1998 Zhang, H. 1998: Effective occlusion culling for the interactive display of arbitrary models. Ph.D. Thesis, Department of Computer Science, UNC-Chapel Hill Zhang, 2005 Zhang, L., 2005: Automatic Digital Surface Model (DSM) generation from linear array images. PhD Thesis, Nr. 16078, Institute of Geodesy and Photogrammetry, ETH Zurich, Switzerland Zheng and Wang, 1992 Zheng, Z. and Wang, X, 1992: A general solution of a closed-form space resection. PE&RS, 58(3), pp. 327-38 Zhang et al., 2002 Zhang, L., Dugas-Phocion, G., Samson, J.-S. and Seitz., S. M., 2002: Single view modeling of free-form scenes. Journal of Visualization and Computer Animation, 13(4), pp. 225-235 Zwicker et al., 2004 Zwicker, M., Rasanen, J., Botsch, M., Dachsbacher, C. and Pauly, M., 2004: Perspective accurate splatting. Proceedings of Graphics Interface Conference (GI ‘04), pp. 247-254
158
ACKNOWLEDMENTS
First of all I would like to thank Prof. Dr. Armin Gruen for giving me the opportunity to work at the Institute of Geodesy and Photogrammetry (IGP) on the interesting topics discussed in this work, for supervising my thesis and, last but not least, for supporting all the costs related to it. Special thanks are also due for all the fruitful discussions and the useful and critical remarks he provided. I would also like to thank Prof. Dr. Petros Patias, for being my co-referent, for the useful corrections he made and the help supplied, Dr. Sabry El-Hakim for his great support and his hints on image-based modeling and Prof.Clive Fraser for the fruitful discussions on camera calibration. A great acknowledgment goes to my actual and former collegues at ETH, who were very important for the success of my work, not only for their scientific cooperation, but also for their friendship and support. Beat Rüedin, our computer administrator, provided constant and useful help on the hardware and software side. The help and care of Liliane Steinbrückner and Susanne Sebestyen, our group secretaries, have also been greatly appreciated. My final acknowledgments go to my parents and Daniela.
159
160