Ujjain (M.P.) India. ABSTRACT. Image processing modifies pictures to improve, extract information and change their structure (composition, image editing, and ...
www.ijcait.com
International Journal of Computer Applications & Information Technology Vol. I, Issue II, September 2012 (ISSN: 2278-7720)
Digital Image Compression Comparisons using DPCM and DPCM with LMS Algorithm Ranbeer Tyagi
D. K. Sharma
Assistant Professor Department of Electronics &Telecommunication engg., PCRT (PU), Bhopal (M.P.) India
Assistant Professor Department of Electronics & Communication engg., Ujjain Engineering College, Ujjain (M.P.) India
ABSTRACT
1.2 What is an Image
Image processing modifies pictures to improve, extract information and change their structure (composition, image editing, and image compression etc.). Images can be processed by optical, photographic and electronic means, but image processing using digital computers are the most common method because digital methods are fast, flexible and precise. Compression - reducing the redundancy in the image data to optimize transmission / storage. The DPCM and LMS may be used to remove the unused bit in the image for image compression. In this paper we compare the compressed image results for 1 and 3 bits DPCM Quantzation and DPCM with LMS Algorithm and also compare the histogram, prediction mean square using DPCM Quantzation and DPCM with LMS Algorithm for approximately same distortion levels. The LMS may provide almost 2 bits per pixel reduction in transmitted bit rate compared to DPCM when distortion levels are approximately the same distortion for both methods. The LMS Algorithm may be used to adapt the coefficients of an adaptive prediction filter for image source coding. In the method used in this paper we decrease the compressed Image size, distortion and also the estimation error.
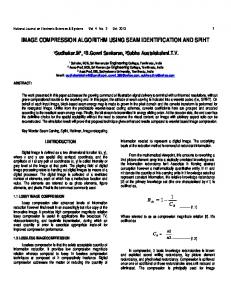
An image is an array, or a matrix, of square pixels (picture elements) arranged in columns and rows.
50
100
150
200
Key words DPCM, LMS Algorithm, Quantization, Histogram, Prediction mean square error,GUI.
1. INTRODUCTION 1.1 The basic idea of Image Compression process
250 50
100
150
200
250
Fig 1: An image — an array or a matrix of pixels arranged in columns and rows.
In general the reduction of image data is achieved by the removal of redundant [1] data. In mathematics, compression may be defined as transforming the two-dimensional pixel array into a statistically uncorrelated data set. Usually image compression is applied prior to the storage or transmission of the image data. Later the compressed image is decompressed to get the original image or close to original image.
In a (8-bit) grey scale image each picture element has an assigned intensity that ranges from 0 to 255. A grey scale image is what people normally call a black and white image, but the name emphasizes that such an image will also include many shades of grey. A normal grayscale image has 8 bit colour depth = 256 grayscales.
Compressing an image is significantly different than compressing raw binary data. Of course, general purpose compression programs can be used to compress images, but the result is less than optimal. This is because images have certain statistical properties which can be exploited by encoders specifically designed for them. Also, some of the finer details in the image can be sacrificed for the sake of saving a little more bandwidth or storage space. This also means that lossy compression techniques can be used in this area. Lossless compression involves with compressing data which, when decompressed, will be an exact replica of the original data. This is the case when binary data such as executables, documents etc. are compressed. They need to be exactly reproduced when decompressed. On the other hand, images (and music too) need not be reproduced 'exactly'. An approximation of the original image is enough for most purposes, as long as the error between the original and the compressed image is tolerable.
In a communication environment, the difference between adjacent time samples for image is small, coding techniques have envolved based on transmitting sample-to-sample differences rather than actual sample value. Successive differences are in fact a special case of a class of non-instantaneous converters called N-tap linear predictive coders. These coders, sometimes called predictorcorrector coders, predict the next input sample value based on the previous input sample values. This structure is shown in fig 2. In this type of converter, the encoder forms the prediction error (or the residue) as the difference between the next measured sample value and the predicted sample value. The equation for the prediction error [1] is
P a g e | 65
1.3 The Principle of Image Compression
e(n)
sample,
x(n) y(n)
(1)
x(n) is the nth input In figure 1, Where Q=Quantizer, y(n) is the predicted value, and e(n) is the associated
www.ijcait.com
International Journal of Computer Applications & Information Technology Vol. I, Issue II, September 2012 (ISSN: 2278-7720)
prediction error. This is performed in the predict-and-compare loop, the loop shown in fig 2. It’s prediction by forming the sum of its prediction and the prediction error
eq (n)
quant[e(n)]
(2)
Where quant (.) represents the quantization operation,
eq (n)
is
x s (n)
the quantization [2] version of the prediction error, and is the corrected and quantized version of the input sample. This is performed in the predict-and-correct loop.
x(n) +
∑
e(n)
Q
eq (n)
Predictor
x s (n)
+
however, one difficulty associated with this scheme. At the receiver, instead of the past samples x(n 1), x(n 2),... as
e(n) we x s (n 1), x s (n 2),..
well
as
have
their
quantized
version
this will increase the error in
y(n) the
estimate of x s (n ) (instead of x(n) ), at the transmitter also from
x s (n 1), x s (n 2),... …………… difference e(n) x(n) y(n) is now transmitted via PCM. At the receiver, we can generate y(n) , and from the received e(n) , we can reconstruct x s (n ) .Figure 1 shown a DPCM predictor. We the quantized samples
∑ Σ
Predict and correct loop
+
Fig. 2 Basic Block diagram of DPCM with LMS Algorithm image compression system The communication task is that of transmitting the difference (the error signal) between the prediction and the actual data sample. For this reason, this class of coder is often called a differential pulse code modulator (DPCM) [3]. If the prediction model forms predictions that are close to the actual sample values, the residues variance (relative to the original signal).
2. IMAGE COMPRESSION USING DPCM 2.1 Basic idea of DPCM Method Many different ideas have been proposed to improve the encoding efficiency of A/D conversion. In general, these ideas exploit the characteristics of the source signals. In analog messages we can make a good guess about a sample value from knowledge of past sample values. In other words, the sample values are not independent, and generally there is a great deal of redundancy in the Nyquist samples. Proper exploitation of this redundancy leads to encoding a signal with fewer bits. Considering a simple scheme; instead of transmitting the sample values, we transmit the difference between the successive sample values. Thus, if x(n) is the nth sample, instead of transmitting x(n), we transmit the difference e(n) = x(n) – x(n-1). At the receiver, knowing e(n) and several previous sample value x(n-1), we can reconstruct x(n). Thus, from knowledge of the difference e(n), we can reconstruct x(n) iteratively at the receiver. Now, the difference between successive samples is generally much smaller than the sample values Thus, we reconstruct the samples at the receiver iteratively. If our prediction is worth its salt, the predicted (estimated) value y(n) will be close to x(n), and their difference (prediction error) e(n) will be even smaller than the difference between the successive samples. Consequently, this scheme, known as the differential pulse code modulation (DPCM) [10][11], which is a special case of DPCM, where the estimate of a sample value is taken as the previous sample value, that is, y(n) =x(n-1).
P a g e | 66
e(n) (the difference between x(n) and its predicted value y(n) ). At the receiver, we generate y(n) from the past sample value to which the received x(n) is added to generate x(n) . There is, In DPCM we transmit not the present sample x(n) , but
reconstruction. In such a case, a better strategy is to determine
Predict and compare loop
y(n)
2.2 Analysis of DPCM
shall soon show that the predictor input is x s (n ) . Naturally, its output is
y(n)
x s (n) .The difference of prediction image data, y(n) , is
the predicted value of
original image data, x(n) and
e(n) .So x(n) y(n)
called estimation residual,
e(n)
(3)
is quantized to yield
eq (n) Where
e(n) q(n)
is the quantization error, eq (n) quantized signal.
q(n)
And
q(n)
eq (n) e(n)
y(n) is
The prediction output predictor input
x s (n)
xs (n)
(4)
fed back to its input so that the
is
y(n) eq (n)
x(n) e(n) eq (n) (5) x(n) q(n) This show x s (n ) is quantized version of x(n) . The prediction input is indeed x s (n ) , as assumed. The quantized signal eq (n) is now transmitted over the channel. Flowchart of DPCM system is shown below fig 3.
www.ijcait.com
International Journal of Computer Applications & Information Technology Vol. I, Issue II, September 2012 (ISSN: 2278-7720) square residual characteristics of the predictor. The LMS algorithm is an approximation to the gradient search method for iteratively computing the N optimal w(n) coefficients which minimize the mean square prediction residual. It is known by [6][12] that the error between the original image and the reconstructed image at the receiver is simply the quantization error Thus, the distortion between the original discrete image x(n) and the reconstructed
Initialization of the fixed tap-weight vector w(n)
Get the value of
and
value
Filter
according to (n)
y(n) at the receiver is given by d (n) y(n) x(n) eq (n) e(n)
(11)
(Assuming the no channel-induced errors) Therefore, if the goal of the system is an accurate reconstruction of the image, then an algorithm is desired which will form an accurate y(n) , so that e(n) will have smaller variance and the quantizer levels may be adjusted to give a smaller quantization error.
Compute the error
Quantization
Initialization of the n-tap-weight vector w(n)
Get the value of
Quantization signal
Filter
Fig 3: Flowchart of DPCM system
and
according to
3. IMAGE COMPRESSION USING DPCM WITH LMS ALGORITHM
+
A block diagram of the LMS adaptive image compression system is shown in fig. 1 [4]. It is seen that the image prediction y(n) is formed in a linear manner at the output of the LMS filter:
Compute the error
M 1
y ( n)
wk (n) x s (n k )
(6)
k 0
y ( n)
w0 x s (n) w1 x s (n 1) ...wM 1 x s (n M
1)
(7) wT (n) xs (n) In equation (6), the wk (n) are N adaptive predictor coefficients, the x s (n ) are the reconstructed image data, and k is 1, 2……….N
y(n)
integer values which select the previous image pixel on which base the current prediction. At each scanned pixel a prediction residual (error), e(n) is computed
e(n)
Quantization
Quantization signal
Updating the coefficient
x(n) y(n)
(8) This quantized residual is send to the receiver. The quantization residual is determine
eq (n)
e(n) q(n)
(9)
This residual is then quantized to form
eq (n)
and the quantized
residual is also used to update the predictor coefficient for the next iteration by the well known least mean squares (LMS) algorithm [5].
w(n 1)
eq (n) xs (n)
Hence, a lower reconstruction error, or distortion, will be present at the receiver. The quantizer levels themselves may be fixed or may vary as some function of the residual sequence
(10)
eq (n) .Although, in general, the position of the quantizer levels
The parameter µ is known as the step size parameter and is a small positive constant, which control steady-state and convergent mean-
could be adaptive, for simplicity, and in this correspondence we only examine the case of a quantizer with fixed levels.
P a g e | 67
w(n)
Fig 4: Flow chart of image compression using DPCM with LMS Algorithm
www.ijcait.com
International Journal of Computer Applications & Information Technology Vol. I, Issue II, September 2012 (ISSN: 2278-7720)
Alternatively, if the goal of the system is to reduce the bit rate over the channel subject to some distortion criteria, then we may reduce the number of quantizer levels which span the residual signal range and, hence, produce shorter code words per level. In this situation the LMS adaptive predictor reduces the average number of bits per image while maintaining an acceptable visual appearance at the receiver. The flowchart of the least mean square adaptive algorithm using differential pulse code modulation quantization system is shown in fig 4.
4. SIMULATION ENVIRONMENT In this paper has used the fixed weight coefficient DPCM and adaptive tap weight coefficient LMS parameter. This parameter has been shown in bellow table. These parameters are the resulted parameter of our simulation for DPCM and LMS algorithm. TABLE-1parametervalue/ Configuration of DPCM Parameter value Image Matrix size 256×256 Original Image size 96.5 kB (98,915 bytes) DPCM 1bit/pixel reconstructed Image 83.0 kB (85,075 bytes) size DPCM 3bit/pixel reconstructed Image 88.1 kB (90,243 bytes) size DPCM 1bit/pixel distortion level -21.75 DPCM 3bit/pixel distortion level -22.25 DPCM fixed Tap’s 2 DPCM weight coefficient value W=[.495, .456] No of Bit’s 1, 2, 3 bit’s Quantization level 2, 4, 8 level TABLE-2 parameter value /Configuration of using DPCM with LMS Algorithm Parameter value Image Matrix size 256×256 Original Image size 96.5 kB (98,915 bytes) LMS 1bit/pixel reconstructed Image 73.2 kB (74,960 bytes) size LMS 3bit/pixel reconstructed Image 85.5 kB (87,618 bytes) size LMS 1bit/pixel distortion level -22.4 LMS 3bit/pixel distortion level -23.3 No of Filter Tap’s 420 LMS adaptive weight coefficient W=[ones(1,tap’s)] No of Bit’s 1, 2, 3 bit’s Quantization level 2, 4, 8 level LMS Parameter µ=.0005
The distortion [12] between the original discrete image x(n) and the reconstructed value y(n) at the receiver is given by (Assuming the no channel-induced errors)
6. SIMULATION RESULT S AND DISCUSSION 6.1 Simulation Results and Discussion of Original image results Simulations involving real image input signal consisted of 256×256 rows and columns’ image matrix displayed in fig 5. The histogram of original image is shown in fig 6. This histogram shows the gray levels are concentrated towards the dark end of the gray scale range. Assume that the gray levels in this image after normalization range from 0 to 1. Fig 7 shows the histogram plot between gray level and sample. In this image samples range are from 0 to 255 but gray level changes according to sample value. Original Image
50
100
150
200
250 50
100
150
200
250
Fig 5: Original image with 256×256 matrix dimension Original Image histogram 800
oimg
700 600 500
5. SIMULATION ANALYSIS PARAMETER
400 300
In this paper, the following parameters are used to analysis the image compression [14], [15], [16] using DPCM and using DPCM with LMS. 5.1 Histogram: A plot between the probability associated with each gray level versus gray level in the image is called histogram. Assume that the gray levels in this thesis image after normalization range from 0 to 1. 5.2 Prediction Error: The difference of original
200 100 0 0
0.1
0.2
0.3
0.4
0.5
0.6
0.7
0.8
0.9
1
Fig 6: Original Lena image Or Dark image histogram histogram plot 800 Oimg 700 600 500
gray level
image data, and prediction image data is called estimation residual or prediction error. At each scanned pixel a prediction residual, is computed
400 300 200 100 0
5.3 Distortion: P a g e | 68
0
50
100
150 sample number
200
250
Fig 7: Histogram plot Original Lena image
300
www.ijcait.com
International Journal of Computer Applications & Information Technology Vol. I, Issue II, September 2012 (ISSN: 2278-7720)
6.2 Simulation results Discussion of image Compression for 1, 3bit DPCM and DPCM with LMS Algorithm
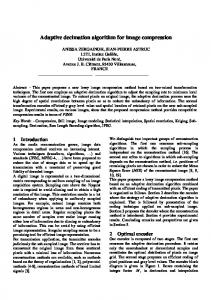
How ever, as the bit rate is decreased to 1 bit/pixel, there is significance difference between the LMS processing and that using DPCM. Figure 17(c) displays the reconstruction using LMS, which provides a significantly sharper image than that shown in figure 17(d) which results of using 1 bit/pixel DPCM.
The LMS algorithm was simulated using Matlab 7.5 with respected to the application of image compression comparison using DPCM with LMS algorithm [7] [12] depicted in figure 1. LMS algorithm is easy to implement and computationally inexpensive. This feature makes the LMS algorithm attractive for image compression. Simulation involving real image input signal consisted of 256 sample points. Filter length was taken to be 420 taps. The parameter of LMS algorithm µ was set to be 0.0005. The 256×256 original image with matrix dimension is shown in fig 5. This image size is 96.5 kB (98,915bytes). This original image passed with the residual quantizer (Q in fig 2) consisting of b=1, 2 and 3 bits (2, 4 and 8 quantization levels, respectively) using DPCM with LMS algorithm adaptive coefficient w. The characteristics of the quantizer follow the Laplacian density model [8, 9]. The coefficients of the fixed DPCM predictor were chosen in accordance with the globally optimum model [10] and fixed coefficient value taken by w=[0.495 0.456]. The dynamic range of the data was eight bits from grey level 0 to 255. The simulation result shown in bellow figures.
histogram using DPCM with LMS 800 3bit/pixel 700 600 500 400 300 200 100 0 0
0.1
0.2
0.3
0.4
0.5
0.6
0.7
0.8
0.9
1
Fig 8: Histogram 3 bit/pixel using DPCM with LMS compressed or Dark Lena image histogram using DPCM 3 bit/pixel
800 700 600 500 400 300 200 100
Figure 8 shows the histogram 3bit/pixel using DPCM with LMS algorithm compressed or dark Lena image. Assume that the gray levels in this image after normalization range from 0 to 1. Fig 9 shows the histogram 3bit/pixel DPCM compressed or dark Lena image. Assume that the gray levels in this image after normalization range from 0 to 1. Fig 10 shows the histogram 1bit/pixel using DPCM with LMS algorithm compressed or bright Lena image. Assume that the gray levels in this image after normalization range from 0 to 1. Fig 11 shows the histogram 1bit/pixel DPCM compressed or bright Lena image. Assume that the gray levels in this image after normalization range from 0 to 1. Fig 12 shows the PMSE 3bit/pixel using DPCM with LMS algorithm compressed Lena image [13]. This shows the PMSE [dB] versus sample points from 0 to 255. Fig 13 shows the PMSE 3bit/pixel DPCM compressed Lena image. This shows the PMSE [dB] versus sample from 0 to 255.Fig 14 shows the PMSE 1bit/pixel using DPCM with LMS algorithm compressed Lena image. This shows the PMSE [dB] versus sample points from 0 to 255. Fig 15 shows the PMSE 1bit/pixel DPCM compressed Lena image. This shows the PMSE [dB] versus sample from 0 to 255.
0 0
0.1
0.2
0.3
0.4
0.5
0.6
0.7
0.8
0.9
1
Fig 9: Histogram3bit/pixel DPCM compressed or Dark Lena image histogram using DPCM with LMS 1bit/pixel
1600 1400 1200 1000 800 600 400 200 0 0
0.1
0.2
0.3
0.4
0.5
0.6
0.7
0.8
0.9
1
Fig 10: Histogram 1 bit/pixel using DPCM with LMS compressed or Bright Lena image histogram using DPCM 1400
1 bit/pixel
1200 1000
P a g e | 69
800 600 400 200 0 0
0.1
0.2
0.3
0.4
0.5
0.6
0.7
0.8
0.9
1
Fig 11: Histogram1bit/pixel DPCM compressed or bright Lena image PMSE using DPCM with LMS Algorithm -30 3bit/pixel -40 -50 -60
PMSE [dB]
Fig 16 plots the average square distortion versus transmitted bit rate for the Lenna image. All values of average squared error in dB referenced to the performanced of the 1bit/pixel fixed coefficient predictor. The bit rate is in bits/ pixel and is controlled by the number of levels in the quantizer. The top graph is for the fixed DPCM predictor and the lower is for LMS with µ=0.0005-value. The LMS filter was initialized at the beginning of the picture reception. In fact, the DPCM at 3bit/pixel has approximately the same distortion than LMS 1 bit/pixel. The lenna image more compress 1bit/pixel LMS compare to 3bit/pixel DPCM with approximately same distortion level. The difference of 1bit/pixel LMS to 3bit/pixel DPCM is 14.9kB (15,283bytes) more in 1bit/pixel LMS. Lastly, the visual characteristics of LMS distortion are presented in fig 17, displaying the results for 3 bits/pixel and 1 bit/pixel transmission. At 3 bit/pixel, comparing the LMS predictor figure 17(a) and the DPCM prediction figure 17(b) shows there is no significant visual different between either method or original leena image.
-70 -80 -90 -100 -110
0
50
100
150 sample number
200
250
300
Fig 12: PMSE 3 bit/pixel using DPCM with LMS compressed Lena image
www.ijcait.com
International Journal of Computer Applications & Information Technology Vol. I, Issue II, September 2012 (ISSN: 2278-7720) PMSE using DPCM
-30 3bit/pixel
Compressed image
-35 -40
PMSE [dB]
-45 -50 -55 -60 -65 -70 -75
0
50
100
150 sample number
200
250
300
Fig 13: PMSE 3bit/pixel DPCM compressed Lena image PMSE using DPCM with LMS Algorithm -25 1bit/pixel -30
PMSE [dB]
-35
-40
-45
-50
-55
0
50
100
150 sample number
200
250
300
Fig 14: PMSE 1 bit/pixel using DPCM with LMS compressed Lena image
(b) 3 bit/pixel DPCM Compressed image
PMSE using DPCM -25 1bit/pixel -30 -35
PMSE [dB]
-40 -45 -50 -55 -60 -65 -70 -75
0
50
100
150 sample number
200
250
300
Fig 15: PMSE1bit/pixel DPCM compressed Lena image Average square distortion versus transmitted bit rate -21.4 DPCM LMS
-21.6
(c) 1 bit/pixel LMS
Average Square Distortion[dB]
-21.8 -22 -22.2
Compressed image
-22.4 -22.6 -22.8 -23 -23.2 -23.4
1
1.2
1.4
1.6
1.8
2 bit/pixel
2.2
2.4
2.6
2.8
3
Fig 16: Average Square distortion versus transmission bit rate. Compressed image
(d) 1 bit/pixel DPCM Fig 17: Visual results for processing Leena image with LMS and DPCM
6.3 GUI block diagrams for image compression using DPCM and LMS Algorithm (a)
P a g e | 70
3 bit/pixel LMS
The basic block diagram of guide is shown below figures. It has been made by the help of buttons. Each button represents the relative output of the bits. When we click the button and we receive the output of related bit.
www.ijcait.com
International Journal of Computer Applications & Information Technology Vol. I, Issue II, September 2012 (ISSN: 2278-7720) [2] J. E. Modestino, and D. G. Daut, “Source-channel coding of images,” IEEE Trans. Commun., vol. COM-27, pp. 1644-1659, Nov. 1979. [3] A. Habbi, “Comparison of Nth-order DPCM encoder with linear transformation and block quantization techniques,” IEEE Trans. Commun., vol. COM-19, pp. 948-956, Dec. 1971. [4] S.Haykin and T.Kailath “Adaptive Filter Theory” Fourth Edition. Prentice Hall, Pearson Eduaction 2002.
Fig 18: Guide basic block diagram
[5] J. R. Zeidler et al., “Adaptive enhancement of mulyiple sinusoids in uncorrelated noise,” IEEE Trans. Acoust., Speech, Signal Processing, vol. ASSP-26, pp. 240-254, June 1978. [6] J. G. Prokis, Digital Communications. New York: McGraw-Hill, 1983. [7] S. T. Alexander and S. A. Rajala, “Analysis and simulation of an adaptive image coding system using the LMS algorithm,” in Proc. 1982 IEEE Int. Conf. Acoust., Speech Signal Processing, Paris, France, May 1982. [8] J. E. Modestino, and D. G. Daut, “Source-channel coding of image,” IEEE Trans. Commun., vol. COM-27, pp. 1644-1659, Nov1979.
Fig 19: original image GUI diagram click original button
[9] M.D. Paez, and T. H. Glisson, “Minimum mean-square error quantization in speech PCM and DPCM systems,” IEEE Trans. Commun. Vol. COM-20, pp.225-230, Apr. 1972. [10] W. K. Pratt, Digital Image Processing. New York: Wiley, 1978. [11] Prema Karthikeyan, Narayanan Sreekumar, “A Study on Image Compression with Neural Networks Using Modified Levenberg Maruar d t Method” Global Journal of Computer Science and TechnologyVolume 11 Issue Version 1.0 March 2011. Online ISSN: 0975-4172 & Print ISSN: 0975-4350 [12] Chun-Chieh Tseng, and Jer-Guang Hsieh, “Study on Huber Fractal Image Compression” De-partment of Computer Science, IEEE TRANSACTIONS ON IMAGE PROCESSING, VOL. 18, NO. 5, MAY 2009.
Fig 20: ASD LMS & DPCM 1-3 bit GUI diagram click on ASD LMS & DPCM button
7. Conclusion This paper has used fixed weight coefficient DPCM and the LMS uses the adaptive coefficient for image compression with same distortion level. A comparison on using DPCM and using DPCM with LMS algorithm with respect to image compression has been carried out based on their coefficient and the number of bits. Results are presented which show LMS may provide more reduction in transmitted bit rate compared to DPCM when distortion levels are approximately the same for both methods. The results show that the LMS algorithm has the least computational complexity but more reduction in compressed image compare to DPCM with same distortion. The LMS can be used in fixed bit rate environments to decrease the reconstructed Image size and distortion.
8. REFERENCES [1] B. P. Lathi and Zhi ding “Modern Digital and Analog Communication Systems” International Fourth Edition. New York Oxford University Press-2010, pp.292.
P a g e | 71
[13] R. Distasi, M. Nappi, and D. Riccio, “A range/domain approximation error-based approach for fractal image compression,” IEEE Trans. Image Process., vol. 15, no. 1, pp. 89–97, Jan. 2006. [14] Xiao-Yan xu, Philip Chen, Juan dai, “Hybrid encoding analysis of fractal image compression method based on wavelet transform” Proceedings of the Seventh International Conference on Machine Learning and Cybernetics, Kunming, 12-15 July 2008. [15] Pusit Borwonwatanadelok, Boonchana Purahong, Somkait Udomhunsakul, “Selection of Wavelet Filters for Panoramic Dental X-Ray Image Compression” Authorized licensed use limited to: University of Allahabad on November 15, 2009 IEEE Xplore. Restrictions apply. [16] Mohammad Kabir Hossain1, Shams MImam, Khondker Shajadul Hasan , William Perrizo, “A Lossless Image Compression Technique Using Generic Peano Pattern Mask Tree” Proceedings of th International Conference on Computer and Information Technology (ICCIT 2008) 25-27 December, 2008, Khulna, Bangladesh.