Hindawi Publishing Corporation Advances in Multimedia Volume 2016, Article ID 6714164, 10 pages http://dx.doi.org/10.1155/2016/6714164
Research Article Image Encryption Performance Evaluation Based on Poker Test Shanshan Li and Weiyang Sun School of Information Engineering, Chang’an University, Middle Section of Nan’er Huan Road, Xi’an 710064, China Correspondence should be addressed to Shanshan Li;
[email protected] Received 26 March 2016; Revised 24 May 2016; Accepted 5 June 2016 Academic Editor: Deepu Rajan Copyright © 2016 S. Li and W. Sun. This is an open access article distributed under the Creative Commons Attribution License, which permits unrestricted use, distribution, and reproduction in any medium, provided the original work is properly cited. The fast development of image encryption requires performance evaluation metrics. Traditional metrics like entropy do not consider the correlation between local pixel and its neighborhood. These metrics cannot estimate encryption based on image pixel coordinate permutation. A novel effectiveness evaluation metric is proposed in this paper to address the issue. The cipher text image is transformed to bit stream. Then, Poker Test is implemented. The proposed metric considers the neighbor correlations of image by neighborhood selection and clip scan. The randomness of the cipher text image is tested by calculating the chi-square test value. Experiment results verify the efficiency of the proposed metrics.
1. Introduction The accelerating growth of personal smart devices and Internet makes it easy to distribute, share, and exchange digital image data via various sorts of open networks. It is simple to access these image data when they are transmitted via open networks. In this case, image data security has become a crucial issue because some of the image content needs to be kept confidential. Image encryption is an effective solution to guarantee image data security. The encryption process converts the original image into another incomprehensible image. The ideal cipher text image is not intelligible. Such a cipher text image could be stored or transmitted across insecure networks without content leaking to anyone except the intended recipient. Since images have certain characteristics such as bulk data size and high intercorrelation, image encryption schemes focus on destroying the correlation between neighbor pixels. This requires that cipher text image should appear as meaningless noises. Since image encryption has attracted extensive attention, various encryption schemes have been proposed in recent years. As a result, efficient image encryption performance evaluation is desired. To evaluate the encryption performance helps optimizing parameter setting as well as improving encryption scheme [1]. Subjective preference test provides several cipher text images and asks the observers to find
out the one that they consider to be best performed. The subjective test is intuitive and straightforward. However, it is inconvenient, time-consuming, and expensive. Hence, it has led to a rising demand for objective evaluations. Image encryption destroys the correlation between neighbor pixels. Cipher text image should be nonrelative to the original plain text image and appear like meaningless noise. As a result, there are two kinds of objective evaluation metrics. The first kind tries to estimate the relation between cipher text image and plain text image. Correlation coefficient is a metric of this kind, which calculates the correlation coefficient between pixels in the same location in the plain text and cipher text images [2]. Another widely used metric is the deviation from identity, which measures the deviation of the histogram of the encrypted image from the histogram of the ideally encrypted image [3]. This kind of objective metrics requires the knowledge of reference image. The other kind focuses on randomness test of cipher text image. This kind of objective metrics does not need the plain text image as reference [4]. The nonreference objective encryption performance evaluation is more practical because the reference image is not always available. Several statistical tests for randomness could be employed to evaluate image encryption performance, such as approximate entropy and block frequency [5]. These evaluations usually require transformation of image to bit stream.
2
Advances in Multimedia
This paper proposes a nonreference objective metric to evaluate the image encryption performance. The novel metric is based on Poker Test with consideration of pixel neighborhood relationships. First traditional objective criterions are discussed. Then, Poker Test is introduced. The novel metric is described. Finally, performance of the metric is evaluated to check the effectiveness in Section 5.
2. Traditional Metrics When an image encryption scheme is proposed, several performance analyses will be implemented to estimate the effectiveness of novel encryption scheme. The most widely used evaluation criterions include encryption quality and Shannon entropy. 2.1. Encryption Quality. The encryption quality is designed to measure the change rate of pixel values when encryption is applied to an image [6]. Higher change in pixel value indicates the image encryption and the encryption quality to be more effective. The encryption quality is expressed in terms of total changes in pixels values between the plain text image and the cipher text image. Let 𝑃 and 𝐶 denote the plain text image and cipher text image, respectively. Assume 𝐻𝑙 (𝑃) and 𝐻𝑙 (𝐶) are the numbers of occurrences for each gray level 𝑙 in the plain text image and cipher text image; the total gray level is 𝐿. Encryption quality is defined as follows: EQ =
∑𝐿−1 𝑙=0 𝐻𝑙 (𝑃) − 𝐻𝑙 (𝐶) . 𝐿
(1)
The encryption quality could not estimate encryption based on image pixel coordinate permutation. The pixel positions shuffle without values changing makes no difference between 𝐻𝑙 (𝑃) and 𝐻𝑙 (𝐶). In this case, encryption quality could not evaluate the performance of encryption. Moreover, encryption quality requires the knowledge of plain text image 𝑃, which is not always available. 2.2. Shannon Entropy. Shannon entropy or information entropy is a measurement of uncertainty. The greater value of entropy indicates the system is more random. When a random variable’s probability distributes equally, the Shannon entropy will be the biggest. If the Shannon entropy of a cipher text image approaches the theoretical peak value, the encryption will be considered as effective [7]. Assume the probability of pixel value 𝑙 is ℎ(𝑙) and the total gray level is 𝐿; Shannon entropy of the image is calculated by 𝐿−1
SE = 6 − ∑ ℎ (𝑙) log2 (ℎ (𝑙)) .
(2)
𝑙=0
Shannon entropy requires no reference image. However, it cannot evaluate the encryption based on pixel position shuffle either. The neighbor correlations of pixels are not considered. 2.3. Autocorrelation. Autocorrelation is the cross-correlation of a signal with itself at different points in time [8]. Pixels in
meaningful image are correlative in horizontal, vertical, and diagonal directions. Effective image encryption destroys the correlation among adjacent pixels. Thus, two-dimensional autocorrelation values could be adopted to evaluate the performance of image encryption. As the correlation between adjacent pixels is the focus, normalized autocorrelation values of one pixel shifted on these three directions are employed as the measurement of image encryption quality. That means the center of the mask image is shifted from the center of original image with one pixel. The normalized 2D autocorrelation of image 𝐼 is defined as ∑𝑟,𝑐 (𝐼 (𝑟, 𝑐) − 𝐼) (𝐼 (𝑟 − 𝑖, 𝑐 − 𝑖) − 𝐼)
NA (𝑖, 𝑗) =
2
2
√ ∑𝑟,𝑐 (𝐼 (𝑟, 𝑐) − 𝐼) (𝐼 (𝑟 − 𝑖, 𝑐 − 𝑖) − 𝐼)
(3)
in which 𝐼(𝑟, 𝑐) is the pixel value in image 𝐼 at position (𝑟, 𝑐). 𝐼 is the mean value of the image. If the size of the image is 𝑅 ∗ 𝐶, NA will be a matrix with size of (2𝑅 − 1) ∗ (2𝐶 − 1). The normalized autocorrelation value with one-pixel shift is the value in matrix NA at position of (𝑅, 𝐶 + 1), (𝑅 + 1, 𝐶), and (𝑅 + 1, 𝐶 + 1). 2.4. Gap Test. The gap test is used for testing randomness of a sequence. It is concerned with the number of gaps in any particular class of digits [9]. The elements of the sequence are classified into two categories: the elements with values between zero and upper bound, marked as 0, and the elements with other values, marked as 1. The continuous zeros are defined as “gap.” The length of zero gaps is counted. Then the chi-square statistic is calculated by 𝐺=∑ 𝑗
(𝑛𝑗 − 𝑛𝑝𝑗 ) 𝑛𝑝𝑗
2
(4)
in which 𝑛𝑗 is the number of zero gaps of length 𝑗 and 𝑝𝑗 is the probability of the length of zero gaps equal to 𝑗. 𝑝𝑗 is calculated by 𝑝𝑗 = 𝑝𝑗 (1 − 𝑝)2 , where 𝑝 is the probability that the element belongs to category 0.
3. Poker Test Poker Test is a randomness test. It treats numbers grouped together as a poker’s hand. The hands obtained are compared to what is expected. The classical Poker Test consists of using all possible categories obtained from poker that uses hands of five numbers. In practice, Poker Test can be applied without being restricted to hands of five numbers. For cryptography application, four numbers are more convenient to deal with bit streams [10]. National Institute of Standards and Technology designed randomness test FIP 140-2 with Poker Test as the second test [11]. The Poker Test in FIP 140-2 is defined as follows: a single bit stream of 20,000 consecutive bits shall be divided into 5,000 nonoverlapping parts. These parts are called nibbles [12]. One nibble consists of 4 bits. The numbers of occurrences of each of the 24 = 16 possible values are counted
Advances in Multimedia
3
Cipher text image
Pixel value binarization
Binarized image
Neighborhood selection
Nonoverlap cells with the same size Clip scan
Numerical evaluation result
Poker Test
Bit stream
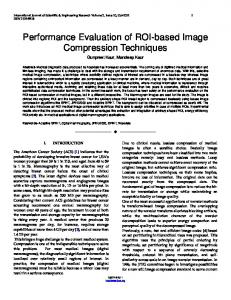
Figure 1: Flowchart of encryption performance evaluation of proposed metric.
and stored. The Poker Test determines whether these nibbles appear approximately in the same frequency. The chi-square test is employed to evaluate the randomness by formula 𝑋=
16 15 2 ∑ (𝑓 (𝑖)) − 5000 5000 𝑖=0
(5)
in which 𝑓(𝑖) is the number of the 𝑖th possible values. It is obvious that Poker Test deals with bit stream and the number of the streams is constrained. A cipher image is a twodimensional matrix with unknown size and integer values of elements. These issues require being addressed if we try to evaluate the randomness of cipher text image by the Poker Test.
4. Novel Metric Image encryption destroys the correlation between neighbor pixels. Cipher text image should appear like meaningless noise as much as possible. Effective image encryption should generate randomness like cipher text image. The novel encryption performance evaluation metric is based on randomness test of cipher text image and pixel neighborhood correlations. Figure 1 provides the flowchart of encryption performance evaluation by proposed novel metric. 4.1. Pixel Value Binarization. The cipher text image consists of pixels with integer decimal values. The values need to be binarized for Poker Test because there are too many possible combinations for pixel values. The cipher text image can be converted into a binary image by tossing coin formula [13] {1, 𝑝 (𝑖, 𝑗) ≥ 𝑝 𝑏 (𝑖, 𝑗) = { 0, else {
(6)
in which 𝑝(𝑖, 𝑗) is the pixel value at position (𝑖, 𝑗) and 𝑝 denotes the average value of all pixels in the cipher text image. After the binarization, an image with binary pixel values is obtained. 4.2. Neighborhood Selection. The binarized cipher text image is divided into small cells that have the same size. One cell covers a local neighborhood. The size of cell is flexible, which is related to the neighborhood selection. Generally using 8neighborhood of current pixel corresponds to a 3 ∗ 3 size cell.
A 2∗2 size cell considers the adjacent pixels in the horizontal, vertical, and diagonal direction. It is another neighborhood selection. Besides these two kinds of size, one-dimensional sizes like 1∗3 or 3∗1 are also workable. If the cipher text image size cannot be divided with no remainder by the cell size, the remainder of last rows and columns will be abandoned in the succeeding procedures. The reason is that cell size is small. Thus, the remainders are also not big. The small sizes of remainders have little influence on the randomness property of the whole image. The size of neighborhood selection affects the bit segment of bit stream. Different size generates different length of bit segment. The possible combination numbers of the bit segments are also different. This will lead to the difference of chi-square value because the number of possible occurrences influences the value. In this case, the evaluation procedure should be kept consistent with neighborhood selection when estimating encryption schemes. Otherwise, the results make no sense. 4.3. Bit Stream Production. After neighborhood selection, small cells with the same size are acquired. The cell is twodimensional in most cases. Thus, it is required to convert these cells into bit stream for Poker Test. The cells are clip scanned to produce bit segments. Figure 2 shows the schematic of clip scan. This kind of scan makes adjacent pixels in a cell still adjacent in the output bit segment. The procedure keeps neighborhood correlations of binarized cipher text image as much as possible. The segments construct a bit stream, which is going to be used in Poker Test. 4.4. Poker Test. The bit stream consists of bit segments. These bit segments have the same length of 𝑀 ∗ 𝑁, in which 𝑀 and 𝑁 are the numbers of cell rows and columns. There will be 2𝑀∗𝑁 possible values of these segments. For each possible value, the number of occurrences is counted. This processing produces a histogram of 2𝑀∗𝑁 bins. If the original pixel value is used to run the Poker Test, there will be 256𝑀∗𝑁 bins for an 8-bit grey image. The computational cost is vast if the binarization step is skipped. Image has bulk data size. Thus the number of these occurrences is big enough, which is suitable for further statistic test. Chi-square test is employed to evaluate the similarity of observed and expected data. The expected data distributes evenly according to the hypothesis: “the occurrence of every possible value is the same.” The random distributed bit stream supports the hypothesis.
4
Advances in Multimedia
Figure 2: Clip scan.
The observed occurrence of possible value 𝑖 is assumed as 𝑂(𝑖); the expected occurrence of every possible value is
𝐸 (𝑖) =
1 2𝑀∗𝑁
2𝑀∗𝑁 −1
∑ 𝑂 (𝑖) .
(7)
𝑖=0
Then the chi-square value is calculated by 2𝑀∗𝑁 −1
𝜒2 = ∑ 𝑖=0
(𝑂 (𝑖) − 𝐸 (𝑖))2 . 𝐸 (𝑖)
(8)
The computed value approximately follows the chi-square distribution with 2𝑀∗𝑁 − 1 degree of freedom. When the neighborhood is selected, the numbers of 𝑀 and 𝑁 are fixed and the degree of freedom is fixed. The more random distributed bit stream has smaller result value from (6), which means the cipher text image is more random-like. In this case, the encryption scheme that produces the cipher text image performs better.
5. Experiment 5.1. Evaluation of Pixel Position Encryption. Arnold’s cat map is a chaotic map. It could be employed to encrypt image by transforming pixel positions [14]. The encrypted image randomizes the original one with enough iteration. There are quite a number of image encryption algorithms based on Arnold’s cat map [15, 16]. Usually pixel value scrambling is combined with the position transformation to improve the security. In this section, the classical Arnold’s cat map image encryption algorithm is adopted to verify the proposed performance evaluation metric. The pixel in position (𝑖, 𝑗) of
the original image is transformed to position (𝑥, 𝑦) in the cipher text image by 𝑖+𝑗 𝑥 ] [ ]=[ 𝑖 + 2𝑗 𝑦
mod 𝑛
(9)
in which 𝑛 is the number of rows or columns of the image. The transformation could be iterated to gain more randomlike results. However, if the iteration goes beyond necessary, the original image will be recovered. Figure 3 shows Arnold’s cat map encryption result of 124 ∗ 124 image Lena with different iterations. The pixels rapidly degenerate into a chaos by iteration number five. Then the appearance of ciphered image is less random-like by iterations seven and eight. After that, the pixels again show chaos like at iterations nine and ten. When (9) is iterated more than 12 times, the cipher text images show some pattern. At iteration 15, the cipher text image is the same as the original plain text image. Because there is no pixel value confusion processing in this encryption, the histogram of any ciphered image in Figure 3 is kept the same as the histogram of the original. Thus, the encryption quality calculated by (1) will be zero for every ciphered image. And the Shannon entropy calculated by (2) will be the same for every image in Figure 3. The proposed metric is affected by the neighborhood selection as mentioned in former section. Table 1 lists the evaluation results of Figure 3 by the proposed novel metric with different neighborhood selections. Figure 4 presents the curve of evaluation value with respect to iteration number. It could be observed that the evaluation result curves are shaped like W. This is consistent with the impression of cipher image randomness in Figure 3. The middle bounce in the curve is not clear as neighborhood size is growing. This phenomenon appears because of the evaluation value growing at the first and last iteration. However, the evaluation results in Table 1 indicate the changing trends are the same in every column: decreasing, a little bounce off the bottom, decreasing again, and then increasing.
Advances in Multimedia
5
(a) Original
(b) Iteration 1
(c) Iteration 2
(d) Iteration 3
(e) Iteration 4
(f) Iteration 5
(g) Iteration 6
(h) Iteration 7
(i) Iteration 8
(j) Iteration 9
(k) Iteration 10
(l) Iteration 11
(m) Iteration 12
(n) Iteration 13
(o) Iteration 14
(p) Iteration 15
Figure 3: Encryption results with Arnold’s cat map.
The novel metric ranks these cipher images performance by evaluation results’ descending order as in Table 2. The poorest performance is considered to be cipher text image at iterations 1 and 14. This is consistent with the impression in Figure 3. The best performance of cipher image varies as the neighborhood selection changes. That is because the W shaped curve has two valleys. The ranking results
demonstrate that the novel metric is efficient to evaluate the encryption performance. Moreover, the evaluation result is little affected by the neighborhood selection. As the selection of neighborhood varies, the processing time for evaluation changes. Table 3 provides the time cost of novel metric with different neighborhood selection. It is clear that the time cost decreased as neighborhood area increased.
6
Advances in Multimedia Table 1: The evaluation results of Figure 3 with different neighborhood selections.
Iteration 1 2 3 4 5 6 7 8 9 10 11 12 13 14
1×3 1.385719 0.734746 0.120514 0.0273 0.047465 0.027789 0.027089 0.043775 0.025219 0.055899 0.027194 0.033834 0.301445 1.023181
3×1 1.196775 0.360651 0.027534 0.043753 0.035306 0.028205 0.264011 0.057244 0.038816 0.032103 0.027806 0.121355 0.672199 1.591066
2×2 3.347191 1.543533 0.304063 0.039836 0.048886 0.0344 0.283531 0.203925 0.055798 0.061117 0.045033 0.291464 1.310661 3.282402
2×3 11.99883 4.922365 1.000514 0.191264 0.216916 0.105016 0.470944 0.426553 0.137621 0.228405 0.141306 0.564086 3.284809 10.75702
3×2 11.63813 3.755407 0.659406 0.15016 0.163809 0.221175 0.695101 0.518664 0.208002 0.148219 0.161313 0.934649 4.448776 12.68549
3×3 75.55482 19.79392 3.073698 0.906664 1.072634 0.975154 1.582503 1.632874 0.896879 1.015378 0.879123 2.592457 17.09745 72.00784
3×4 480.2665 92.41148 14.45406 5.316007 5.757189 5.873823 5.62027 7.273436 8.510775 5.736905 5.336291 9.190297 61.50843 391.0057
4×3 413.79 79.89103 9.230866 5.184159 5.579702 6.071595 7.268365 7.253152 5.037098 5.255154 5.564489 10.09295 80.58577 462.9641
4×4 5323.014 793.5749 117.1537 79.54323 80.82056 77.55626 87.91688 96.00669 79.82708 80.82056 82.38175 96.43247 577.9887 4649.005
4×5 65296.32 8690.154 1612.963 1487.938 1540.979 1703.891 1707.679 1919.844 1616.752 1525.824 1575.077 1798.607 4556.741 54479.73
5×4 58423.71 6602.61 2851.851 1525.824 1597.809 1828.916 1696.313 2014.56 2294.92 1514.458 1442.474 1559.922 5522.846 61140.17
Table 2: Performance ranking of cipher text image by descending order in Figure 3 with different neighborhood selections. Ranking number 1 2 3 4 5 6 7 8 9 10 11 12 13 14
1×3 9 7 11 4 6 12 8 5 10 3 13 2 14 1
3×1 3 11 6 10 5 9 4 8 12 7 2 13 1 14
2×2 6 4 11 5 9 10 8 7 12 3 13 2 14 1
2×3 6 9 11 4 5 10 8 7 12 3 13 2 14 1
3×2 10 4 11 5 9 6 8 3 7 12 2 13 1 14
3×3 11 9 4 6 10 5 7 8 12 3 13 2 14 1
3×4 4 11 7 10 5 6 8 9 12 3 13 2 14 1
4×3 9 4 10 11 5 6 8 7 3 12 2 13 1 14
4×4 6 4 9 10 5 11 7 8 12 3 13 2 14 1
4×5 4 10 5 11 3 9 6 7 12 8 13 2 14 1
5×4 11 10 4 12 5 7 6 8 9 3 13 2 1 14
4×5 0.2598
5×4 0.2486
Table 3: Time cost of 124 ∗ 124 image with different neighborhood selections. Time cost (s)
1×3 0.7323
3×1 0.708
2×2 0.597
2×3 0.4365
3×2 0.4407
It is because small neighborhood fragments the image area, which increases clip scan processing times. Since the evaluation result is affected little by the neighborhood selection, bigger area neighborhood is recommended. However, as the neighborhood area is growing, the numbers of possible combinations of the bit segment will grow exponentially. That causes high burden on computer memory. In this case, the area neighborhood should not be too big. Thus, the recommended neighborhood is 4 × 4, 4 × 5, and 5 × 4. Normalized autocorrelation values with one-pixel shift on different directions are employed to measure the encryption performance in Figure 3 as a comparison. The center of the mask image is shifted from the center of original image one
3×3 0.3298
3×4 0.2946
4×3 0.2897
4×4 0.2613
pixel in horizontal, vertical, and diagonal directions. Tables 4 and 5 present the evaluation results and performance ranking of autocorrelation. Because minus one value of autocorrelation indicates strong minus correlative, the absolute value in Table 4 is used to produce the ranking result in Table 5. The last several rows of vertical direction in Table 5 show there is a problem when evaluating the poorest performed cipher images. It is clear in Figure 3 that cipher images of iterations 1 and 14 are the poorest performed with iterations 2 and 13 after them. However, the vertical directional normalized autocorrelation ranks cipher image 13 in a high position. It is even higher than cipher image with iterations 3 and 8. This is not consistent with the visual impression in Figure 3.
Advances in Multimedia
7
14
3.5
12
3
10
2.5
8
2
6
1.5
4
1
2
0.5
0
0
2
4
6
8
10
12
14
0
0
2
4
6
80
1.4
70
1.2
60
1
50
0.8
40
0.6
30
0.4
20
0.2
10 2
12
14
8
10
12
14
(b) 2 × 2
(a) 2 × 3 and 3 × 2
1.6
0
10
2×2
2×3 3×2
0
8
4
6
8
10
12
14
0
0
2
1×3 3×1
4
6
3×3
(d) 3 × 3
(c) 1 × 3 and 3 × 1
500
6000
450 5000
400 350
4000
300 250
3000
200 2000
150 100
1000
50 0
0
2
4
6
8
10
12
14
0
0
3×4 4×3
2
4
6
4×4
(f) 4 × 4
(e) 3 × 4 and 4 × 3
Figure 4: Continued.
8
10
12
14
8
Advances in Multimedia ×104 7
6 5 4 3 2 1 0
0
2
4
6
8
10
12
14
4×5 5×4
(g) 4 × 5 and 5 × 4
Figure 4: Evaluation result value curve with different neighborhood selection.
(a) Original
(b) Pixel position shuffle
(c) Pixel value scrambling
(d) Both
Figure 5: Encryption results with pixel value scrambling and position shuffle.
Another comparison is presented by the gap test. The cipher text images are stretched to a vector column by column to perform the gap test. As the cipher text images in Figure 3 are with 8-bit grey levels, the upper bound is set to be 51, 128, and 179 for the elements classification. The three values are 20%, 50%, and 70% of the maximum grey level. Then the chi-square is calculated by (4) as the evaluation. Tables 6 and 7 present the evaluation results and performance ranking. The gap tests have some problems when evaluating the four poorest performed cipher text images. When the upper bound value is set to be 20% of the maximum value, cipher text image of iteration 2 is ranked in a high position compared to iteration 7. When the upper bound value is set to be 70% of the maximum value, cipher text images of iterations 1, 2, and 13 are ranked even higher than cipher images with iterations 10 and 5. This is not consistent with the visual impression. 5.2. Evaluation of More Sophisticated Encryption. In this section, image encryptions with pixel value scrambling and
position shuffle are used to verify the novel evaluation metric. The plain text image is first encrypted by Vigenere cipher to scramble its pixel grey level, and then the pixel positions are shuffled. Coupled logistic map is employed to produce the pseudorandom sequences for the encryption [17]. The plain text image and cipher text images are shown in Figure 5. Figure 5(b) is the cipher text image with only position shuffle. Figure 5(c) is the cipher text image with only pixel value scrambling processing; Figure 5(d) is the cipher text image with both processing. The keys are the same. The complex processing brings higher security. Thus, Figure 5(d) should be evaluated as the best performed. The evaluation results for Figures 5(b), 5(c), and 5(d) by the proposed metric and other metrics are provided in Table 8. It is clear that the proposed metric with different neighborhood selection gives Figure 5(d) the lowest value. That means the cipher text image encrypted both by pixel scrambling and by position shuffle is considered as the best encrypted. All of the proposed metrics also score Figure 5(b)
Advances in Multimedia
9
Table 4: The evaluation results of Figure 3 by normalized autocorrelation on different directions.
Table 6: The evaluation results of Figure 3 by gap test with different upper bound value.
Iteration 1 2 3 4 5 6 7 8 9 10 11 12 13 14
Iteration 1 2 3 4 5 6 7 8 9 10 11 12 13 14
Horizontal 0.77962 0.57696 0.214836 0.026138 −0.04489 −0.03496 0.01608 0.101325 0.024626 −0.04724 −0.01579 0.080648 0.419839 0.672049
Vertical 0.729447 0.423958 0.064253 −0.06878 −0.00844 0.026926 0.364424 0.091398 −0.06663 −0.00661 0.018661 0.25252 0.577335 0.819787
Diagonal 0.865807 0.706407 0.415315 0.062199 −0.06562 −0.00918 0.025746 0.349932 0.094174 −0.06211 −0.00866 0.01943 0.243791 0.55581
Table 5: Performance ranking of cipher text image by descending order in Figure 3 with normalized autocorrelation in different directions. Ranking number 1 2 3 4 5 6 7 8 9 10 11 12 13 14
Horizontal 10 5 11 6 3 9 4 8 12 7 2 13 1 14
Vertical 11 6 12 7 10 4 5 9 13 8 3 14 2 1
Diagonal 11 7 9 4 6 5 10 12 8 3 13 2 14 1
as the poorest performed. This is consistent with the performance analysis. Normalized autocorrelation assigns Figure 5(c) the smallest absolute value except vertical direction. The gap test also has some problems when evaluating Figures 5(c) and 5(d). In the last column, Figure 5(b) has the same entropy as the original plain text image while Figures 5(c) and 5(d) have the same entropy. This is because their grey level histograms distribute the same.
20% 52503.25 47752.74 43252.68 41304.9 44715.45 43627.67 48866.78 43643.1 41271.27 44687.99 43458.54 46925.5 50898.11 54496.37
50% 7808.829 4465.835 1820.068 1747.163 1527.501 1364.194 3543.446 2268.268 1787.271 1501.879 1339.975 2605.323 5734.178 8954.634
70% 367.5231 209.8415 259.5888 451.1019 468.2339 362.027 162.4724 249.9645 459.0743 476.4293 367.6016 217.2968 265.2439 479.1238
Table 7: Performance ranking of cipher text image by descending order in Figure 3 with different upper bound value gap test. Ranking number 1 2 3 4 5 6 7 8 9 10 11 12 13 14
20% 9 4 3 11 6 8 10 5 12 2 7 13 1 14
50% 11 6 10 5 4 9 3 8 12 7 2 13 1 14
70% 7 2 12 8 3 13 6 1 11 4 9 5 10 14
pixel coordinate permutation. The experiment recommends several neighborhood selections.
Competing Interests The authors declare that there is no conflict of interests regarding the publication of this paper.
Acknowledgments 6. Conclusion This paper proposes a nonreference objective metric to evaluate the image encryption performance. The novel metric considers pixel neighborhood relationships. Poker Test is employed to test the randomness of the cipher text image. The metric can efficiently estimate encryption based on image
The project is supported by National Natural Science Foundation of China (Grant nos. 61402051 and 51278058), the 111 Project (no. B14043), Natural Science Basic Research Plan in Shaanxi Province of China (Program no. 2016JM6076), and the Young Scientists Fund of Natural Science Foundation of Shaanxi Province (Program no. 2015JQ6239).
10
Advances in Multimedia Table 8: Evaluation results of the cipher text image in Figure 5.
Figure 5(b) Figure 5(c) Figure 5(d)
The proposed metric 3×3 4×5 5×4 0.337 325.96 322.42 0.071 320.85 321.63 0.066 320.45 320.25
Normalized autocorrelation Horizontal Vertical Diagonal 0.0627 −0.075 −0.061 0.0009 −0.006 0.0023 −0.003 0.0028 0.0081
References [1] L. Tong, F. Dai, Y. Zhang, and J. Li, “Visual security evaluation for video encryption,” in Proceedings of the 18th ACM International Conference on Multimedia (MM ’10), pp. 835–838, ACM, October 2010. [2] J. Ahmad and F. Ahmed, “Efficiency analysis and security evaluation of image encryption schemes,” Computing, vol. 23, p. 25, 2010. [3] C. Chattopadhyay, B. Sarkar, and D. Mukherjee, “Encoding by DNA relations and randomization through chaotic sequences for image encryption,” http://arxiv.org/pdf/1505.01795.pdf. [4] X.-F. Zhang and J.-L. Fan, “Two new digital image encryption effect evaluation criterions,” Computer Science, vol. 37, no. 2, pp. 264–268, 2010. [5] L. Wang, W. Meilin, D. Kui, and Z. Xuecheng, “Scalable truly random number generator,” in Proceedings of the World Congress on Engineering, vol. 1, London, UK, July 2015. [6] A. H. M. Ragab, O. S. Farag Allah, A. Y. Noaman, and K. W. Magld, “Encryption quality evaluation of robust chaotic block cipher for digital imaging,” International Journal of Recent Technology and Engineering, vol. 2, no. 6, pp. 4–9, 2014. [7] S. Chapaneri, R. Chapaneri, and T. Sarode, “Evaluation of chaotic map lattice systems for image encryption,” in Proceedings of the International Conference on Circuits, Systems, Communication and Information Technology Applications (CSCITA ’14), pp. 59–64, IEEE, Mumbai, India, April 2014. [8] C. Yuganya, “2D cross correlation multi-modal image recognition,” Journal of Global Research in Computer Science, vol. 4, no. 4, pp. 13–17, 2013. [9] E. Bofinger and V. J. Bofinger, “The gap test for random sequences,” The Annals of Mathematical Statistics, vol. 32, pp. 524–534, 1961. [10] W. M. F. Abdel-Rehim, I. A. Ismail, and E. Morsy, “Testing randomness: the original poker approach acceleration using parallel MATLAB with OpenMP,” Computer Science and Engineering, vol. 5, no. 2, pp. 25–29, 2015. [11] Federal Information Processing Standard (FIPS), “Security requirements for cryptographic modules,” PUB 140-2, 2001. [12] S.-J. Xu, X.-B. Chen, R. Zhang, Y.-X. Yang, and Y.-C. Guo, “An improved chaotic cryptosystem based on circular bit shift and XOR operations,” Physics Letters A, vol. 376, no. 10-11, pp. 1003– 1010, 2012. [13] R. Kadir and M. A. Maarof, “Randomness analysis of pseudorandom bit sequences,” in Proceedings of the International Conference on Computer Engineering and Applications (IPCSIT ’11), vol. 2, Singapore, 2011. [14] G. Peterson, “Arnold’s cat map,” Math 45-Linear algebra, 1997, http://pages.physics.cornell.edu/∼sethna/teaching/562 S03/HW/ pset02 dir/catmap.pdf. [15] Z.-G. Ma and S.-S. Qiu, “An image cryptosystem based on general cat map,” Journal of China Institute of Communications, vol. 24, no. 2, pp. 51–57, 2003.
20% 172290 91872 94411
Gap test 50% 2504.5 2666.9 2823.1
70% 2221.7 17.1381 14.51
Entropy 7.4442 7.9967 7.9967
[16] A. Kanso and M. Ghebleh, “A novel image encryption algorithm based on a 3D chaotic map,” Communications in Nonlinear Science and Numerical Simulation, vol. 17, no. 7, pp. 2943–2959, 2012. [17] S. Li, Y. Zhao, B. Qu, and J. Wang, “Image scrambling based on chaotic sequences and Vegin`ere cipher,” Multimedia Tools and Applications, vol. 66, no. 3, pp. 573–588, 2013.
International Journal of
Rotating Machinery
Engineering Journal of
Hindawi Publishing Corporation http://www.hindawi.com
Volume 2014
The Scientific World Journal Hindawi Publishing Corporation http://www.hindawi.com
Volume 2014
International Journal of
Distributed Sensor Networks
Journal of
Sensors Hindawi Publishing Corporation http://www.hindawi.com
Volume 2014
Hindawi Publishing Corporation http://www.hindawi.com
Volume 2014
Hindawi Publishing Corporation http://www.hindawi.com
Volume 2014
Journal of
Control Science and Engineering
Advances in
Civil Engineering Hindawi Publishing Corporation http://www.hindawi.com
Hindawi Publishing Corporation http://www.hindawi.com
Volume 2014
Volume 2014
Submit your manuscripts at http://www.hindawi.com Journal of
Journal of
Electrical and Computer Engineering
Robotics Hindawi Publishing Corporation http://www.hindawi.com
Hindawi Publishing Corporation http://www.hindawi.com
Volume 2014
Volume 2014
VLSI Design Advances in OptoElectronics
International Journal of
Navigation and Observation Hindawi Publishing Corporation http://www.hindawi.com
Volume 2014
Hindawi Publishing Corporation http://www.hindawi.com
Hindawi Publishing Corporation http://www.hindawi.com
Chemical Engineering Hindawi Publishing Corporation http://www.hindawi.com
Volume 2014
Volume 2014
Active and Passive Electronic Components
Antennas and Propagation Hindawi Publishing Corporation http://www.hindawi.com
Aerospace Engineering
Hindawi Publishing Corporation http://www.hindawi.com
Volume 2014
Hindawi Publishing Corporation http://www.hindawi.com
Volume 2014
Volume 2014
International Journal of
International Journal of
International Journal of
Modelling & Simulation in Engineering
Volume 2014
Hindawi Publishing Corporation http://www.hindawi.com
Volume 2014
Shock and Vibration Hindawi Publishing Corporation http://www.hindawi.com
Volume 2014
Advances in
Acoustics and Vibration Hindawi Publishing Corporation http://www.hindawi.com
Volume 2014