SS symmetry Article
Image Region Duplication Forgery Detection Based on Angular Radial Partitioning and Harris Key-Points Diaa M. Uliyan, Hamid A. Jalab *, Ainuddin W. Abdul Wahab and Somayeh Sadeghi Faculty of Computer Science and Information Technology, University of Malaya, 50603 Kuala Lumpur, Malaysia;
[email protected] (D.M.U.);
[email protected] (A.W.A.W.);
[email protected] (S.S.) * Correspondence:
[email protected]; Tel.: +6-03-7967-2503 Academic Editors: Young-Sik Jeong, Laurence T. Yang and Stefanos Gritzalis Received: 30 April 2016; Accepted: 6 July 2016; Published: 13 July 2016
Abstract: Region duplication forgery where a part of the image itself is copied and pasted onto a different part of the same image grid is becoming more popular in image manipulation. The forgers often apply geometric transformations such as rotation and scaling operations to make the forgery imperceptible. In this study, an image region duplication forgery detection algorithm is proposed based on the angular radial partitioning and Harris key-points. Two standard databases have been used: image data manipulation and MICC-F220 (Media Integration and Communication Center– of the University of Florence) for experimentation. Experiment results demonstrate that the proposed technique can detect rotated regions in multiples of 30 degrees and can detect region duplication with different scaling factors from 0.8, to 1.2. More experimental results are presented to confirm the effectiveness of detecting region duplication that has undergone other changes, such as Gaussian noise, and JPEG compression. Keywords: copy-move detection; duplicated region; Harris interest points; angular radial partitioning
1. Introduction Digital images play an important role in our daily life. However, due to the powerful image editing software, images can be easily tampered with. Therefore, we need to think about the authenticity of the images. This can be done by digital image forensic techniques. Two main types of authentication methods in digital image forensics have been explored in the literature: active methods and passive methods. In active methods, mainly watermarking and steganography techniques are used to embed the digital authentication information into the original image. The authentication information may be used as a verification for forensic investigation when the image has been falsified, and even point out if the image has been tampered with or not. These techniques are restricted because authentication information could be embedded either at the time of recording, or later by an authorized person. The limitation of this technique is that it needs special cameras or subsequent processing of the digital image. Furthermore, some watermarks may distort the quality of the original image. Due to these restrictions, the researchers tend to develop passive techniques for digital image forensics. Passive image forensics techniques inspect the images without embedding authentication information, such as signatures or watermarks. Passive image forensics approaches have been classified into five categories: 1.
2.
Pixel based techniques are based on detecting the statistical irregularity or pixel level correlations, introduced at the pixel level during the forgery process [1]. Pixel-based approaches are the most popular in image forgery. Format based techniques are based on detecting the transformation of image forgery via analysis of JPEG compression artifacts [2].
Symmetry 2016, 8, 62; doi:10.3390/sym8070062
www.mdpi.com/journal/symmetry
Symmetry 2016, 8, 62
3. 4. 5.
2 of 19
Camera based techniques concentrate on detecting the clues of image forgery by exploiting the artifacts introduced by different stages of the image capturing process [3]. Physics-based techniques are based on estimating the lighting directions and differences in lighting between image regions in the image as a telltale sign of image tampering [4]. Geometric based techniques are based on estimating principal point of image regions across the image, and the inconsistency between principal points, can be used as evidence of image forgery [5].
In pixel-based techniques, the key idea is exposing image tampering by analyzing pixel level correlations. Based on the operation used to create a tampered image, pixel based image forgery techniques can be categorized into three groups: image splicing, image retouching and copy-move forgery. 1. 2. 3.
Image splicing adds a part of an image into another image in order to hide or change the content of the second image [6–9]. Image retouching manipulates an image by enhancing or reducing certain features of the image without making significant changes on image content [10]. Copy–move forgery is copying a region of an image and pasting it in another location of the same image. The forgers perform duplicate regions with different geometric and post-processing operations to hide traces and make consistency with surrounding area [11–13].
Copy–move forgery is becoming one of the most popular image operations in image tampering especially with many easy to use photo editing software. The key characteristic of the duplicated regions is that they have the same noise components, textures, color patterns, homogeneity conditions and internal structures. For copy–move forgery detection (CMFD), many methods have been proposed that use algorithms that are either block based or key-point based algorithms. 1.1. Block Based Algorithm First, an image is divided into overlapping sub-blocks. Then, some features are extracted from each block, and compared with other blocks to find the most similar blocks. Various techniques have been developed by several researchers to deal with copy–move forgery using block based methods. The first block based method for detecting copy–move forgery was introduced by Fridrich et al. [14]. Discrete cosine transformation (DCT) based features have been used. The main drawback of their proposed algorithm is the high computational complexity and inefficiency against some post-processing operations such as rotation, scaling and blurring. In [15], the ridgelet transform of divided blocks was applied to extract features and compute Hu moments for these features to produce feature vectors. Euclidean distance of feature vectors is computed for similarity measure. However, in [16], a copy–move forgery algorithm based on discrete wavelet transform (DWT) was proposed to extract features from input image to yield a reduction in feature dimensional size. Common limitations of block-based methods include direct uses of quantized or frequency based features from divided blocks for matching, which makes the size of feature vectors quite high, and makes the dimension reduction step mandatory. To overcome these issues, an alternative approach used for the copy–move tampering detection is the key-point based method, as discussed in the next subsection. 1.2. Key Point Based Algorithm The key-point based methods depend on the extraction of local interest points (key-points) from local interest regions with high entropy without any image sub-blocking. Good key-points should be efficient for computing, be capable of identifying distinct locations in the image regions, and be robust in detection of geometric transformations, illumination changes, noise and other distortions.
Symmetry 2016, 8, 62
3 of 19
The main advantage of key-point based methods is that they have high detection rates in duplicated regions, which exhibit a rich structure such as image regions, but still struggle to reduce the false matches in the flat regions like sky and ocean, etc. Huang et al. [17], proposed a Scale-invariant feature transform (SIFT) based detection method to identify duplicate regions with scale and rotation, then used the best bin first search (BBF) method to find the nearest neighbors with high probability that return the matched key points (inliers) as a possible duplicate region. To increase the accuracy of detection methods, a nearest neighbor distance ratio (NNDR) is applied for matched key-points. Amerini et al. [18] have proposed detecting multiple duplicated regions based on SIFT features, and then employed generalized nearest neighbor (G2NN) to improve the similarity match between key-points. The agglomerative hierarchical linkage (AHL) clustering method has been employed to group the similar key-points into the same cluster and merge closest pair of clusters into single cluster to represent the cloned regions. The estimation of affine transformation parameters is computed between duplicated regions. Battiato et al. [19] proposed a framework for detection of duplicated region based on SIFT. The hashing method is applied to the feature vectors, and then saved into a hash table, which is used for comparing the hash code of corresponding feature vectors after image alignment. The alignment process of the hash is used to estimate the geometric transformation parameters. All above techniques have the use of the SIFT key-points in common, which are invariant to changes in rotation, illumination, and scaling. Hence, they commonly inherit the limitations of a lack of key-points in flat or smooth areas in images, where little structures are exhibited. This motivated researchers to utilize other key-points descriptors to overcome these limitations, such as Harris corners, Hessian and Laplacian of Gaussian (LOG) detectors. Liu et al. [20] have applied Harris detectors to localize key-points, and then adaptive non maximal suppression (ANMS) is employed to identify more key-points in the flat regions in images, which is the main drawback of the SIFT algorithm. The daisy descriptor has been implemented based on an orientation gradient map of image regions around the key-point to perform image matching in a dense way. Ling et al. [21] proposed a near duplicate image detection framework based on Hessian affine and polar mapping. At the final stage of detection, a nearest neighbor distance ratio (NNDR) here is used for matching between feature vectors. Kakar et al. [22] proposed an algorithm where local interest points are detected by a modified scale Laplacian of Gaussian and Harris corner detector, which make features invariant to geometric transformations. In addition, the feature descriptor was built based on MPEG-7 signature tools. It is very obvious from the literature that the CMFD approaches discussed have their pros and cons regarding the geometrical changes in the copied regions. Therefore, an efficient CMFD should be robust to some geometrical changes, such as rotation and scaling. These issues have been under extensive study during the past few years. Rotation is considered the most difficult geometric transformation to deal with in CMFD. Three key approaches were introduced to achieve a rotation invariant CMFD: polar mapping, circle blocking and image moments such as Zernike moments. In [23], polar mapping based on log-polar transformation of divided blocks in images was employed. Then, Fast Fourier transformation is applied to build descriptors under different orientations range from 0˝ –180˝ . These feature descriptors are then saved into matrices and lexicographical sorting is applied to them. To improve the detection decision, the counting bloom filter has been used to detect descriptors that have the same hashing values. Shao et al. [24] proposed a duplicated region detection based on circular window expansion and phase correlation. The algorithm starts with calculating the Fourier transform of the polar expansion on overlapping circular windows pairs, and then an adaptive process is applied to obtain a correlation matrix. Then, estimating the rotation angle of the forged region, a searching procedure is implemented to display the duplicated regions. The algorithm was robust to rotation, illumination changes, blurring, and JPEG compression.
Symmetry 2016, 8, 62
4 of 19
In [25], the Zernike moments are extracted from overlapping blocks and their magnitudes are used as feature representation. Locality sensitive hashing (LSH) is employed for block matching, and falsely matched block pairs are removed by inspecting phase differences of corresponding Zernike moments. In this research, we propose developing an efficient copy–move forgery detection algorithm that is able to detect and locate different duplicated regions under various geometric transformations and post processing operations. The main advantage of key-point based CMFD methods is invariance under rotation, scaling operations, but still struggle to reduce the false matches in flat regions. In order to improve the efficiency and capability of region duplication detection, we propose a rotation robust method for detecting duplicated regions using Harris corner points and angular radial partitioning (ARP). The proposed method depends on statistical region merging segmentation techniques (SRM) of images as a preprocessing step to detect smooth and patterned regions. However, to improve the time complexity of detection algorithm, a linkage clustering, based on Tamura texture features of detected image regions, is employed in the next step. Then, Harris corner points are detected in angular radial partitions (ARPs) of a circle region for each detected image region in order to obtain a scale and rotation invariant feature points. The matching procedure includes two main steps: (1) matching between chain codes to find similar regions based on internal structure; (2) matching the feature point’s patches based on Hölder estimation regularity based descriptor (HGP-2) to find similar regions based on texture. Finally, the matched keypoints between similar regions are linked and the duplicated regions are localized in a blue color to show forgery. The organization of this paper is presented as follows. In Section 2, the proposed algorithm is explained. Section 3 presents the experiment results. Comparisons and discussions are described in Section 4. Finally, conclusions are drawn in Section 5. 2. Proposed Method The whole proposed detection method generally can be described as follows: (1) (2) (3) (4) (5) (6) (7) (8) (9) (10) (11) (12) (13) (14)
Input the suspicious color image. Segment the input image of size M ˆ N pixels into image regions using Statistical Region Merging Segmentation (SRM). Locate centroids of each image region. Crop each segmented image region to 11 ˆ 11 pixel square image blocks around the centroids of detected regions. Apply Tamura texture on each square image block. Cluster similar image regions by texture. Apply angular radial partitioning (ARP) on each image region indexed by its centroid coordinates in the same cluster. Convert input image into grayscale and extract key points with Harris detectors. Calculate the total number of Harris corners in each sector of a circle image region in the same cluster. Represent the total number of Harris corners by a chain code, and search for closely one-to-one matching between two images regions in the same cluster. Extract regularity-based features the centroid and around each Harris corners of the image regions that have the same chain code by using an HGP-2 descriptor. Compute median absolute deviation (MAD) for all HGP-2s of the two matched image regions, and save it in feature vector fv . Find the Euclidean distance between two corresponding final feature vectors fv and fv’. Detect and localize the tampered regions.
Symmetry 2016, 8, 62
5 of 19
2.1. Statistical Region Merging Segmentation (SRM) Symmetry 2016, 8, 62
5 of 19
The duplicated region is copied and moved to another location in the same image. This makes the duplicated regions in forged images have a similar homogenous texture and internal structure. Symmetry 2016, 8, 62 5 of 19 Segmentation ofMerging the inputSegmentation image is carried out using the SRM algorithm [26]. The SRM algorithm 2.1. Statistical Region (SRM) has excellent performance with capturing the main structural image features using effective statistical The duplicated region is copied and moved 2.1. Statistical Region Merging Segmentation (SRM) to another location in the same image. This makes image analysis. The SRM depends on two steps: the merging predicate and the testing order to test the duplicated regions in forged images have a similar homogenous texture and internal structure. Theof duplicated region is copied and moved to another location in the same image. This makes the merging regions in the image. Segmentation of the input image is carried using the SRM algorithm [26]. The structure. SRM algorithm the duplicated regions in forged images haveisaout similar homogenous texture and internal The advantage to using the SRM method the ability to detect the smooth and patterned regions has excellent performance capturing the main structural image features using effective statistical Segmentation of thewith input image is carried out using the SRM algorithm [26]. The SRM algorithm like edges and corners. image analysis. SRM depends on two steps: thestructural merging image predicate andusing the testing order to test the has excellentThe performance with capturing the main features effective statistical As a result of the SRM algorithm, the input image is segmented into image regions of similar merging of regions in the image. image analysis. The SRM depends on two steps: the merging predicate and the testing order to test intensity or color, saved into mapped images, then the mapped is and scanned horizontally the merging of and regions in the image. The advantage to using the SRM method is the ability to detect theimage smooth patterned regions and vertically to find the least frequently occurring values in the mapped image plane. These values like edgesThe andadvantage corners. to using the SRM method is the ability to detect the smooth and patterned regions are retained to detect regions that will provide a more accurate detection of the tampered regions. likeaedges and As result of corners. the SRM algorithm, the input image is segmented into image regions of similar As a result of saved thethe SRM algorithm, the inputthen image segmented into image of similar Finally, the centroids of detected segmented image regions are located in regions the input images,and as intensity or color, and into mapped images, theis mapped image is scanned horizontally intensity or color, and saved into mapped images, then the mapped image is scanned horizontally shown in Figure 1. vertically to find the least frequently occurring values in the mapped image plane. These values are and vertically to find the least frequently occurring values in the mapped image plane. These values
retained to detect regions that will provide a more accurate detection of the tampered regions. Finally, are retained to detect regions that will provide a more accurate detection of the tampered regions. the centroids of the detected segmented image regions are located in the input images, as shown in Finally, the centroids of the detected segmented image regions are located in the input images, as Figure 1. in Figure 1. shown
(a)
(b)
(c)
Figure 1. Results of Statistical Region Merging Segmentation (SRM). (a) the initial image; (b) detected image regions; (c) centroids of image regions. (a) (b) (c) Figure 1. Results of Statistical Region Merging Segmentation (SRM). (a) the initial image; (b) detected
To evaluate the of performance of the SRM algorithm, we(SRM). use two standard datasets, MICC-F220 Figure 1. Results Statistical Region Merging Segmentation (a) the initial image; (b) detected image regions; (c) centroids of image regions. image regions; (c) centroids of image regions. dataset [18], and image manipulation datasets [27]. We further compare the results of SRM image segmentation withstandard the benchmark segmentation To evaluate the performance of the algorithm, we use two datasets, MICC-F220 techniques, such as Normalized cuts (NCUT) [28], and K-means [29], as shown in Figure 2. The SRM dataset [18], and image manipulation datasets [27]. To evaluate the performance of the SRM algorithm, we use two standard datasets, MICC-F220 We and further compare the pixel-wise results of image withbethe benchmark segmentation segmentation thatimage yields the best mean accuracy would chosen. dataset [18], manipulation datasets [27].segmentation techniques, such as Normalized cuts (NCUT) [28], and K-means [29], as shown in Figure 2. The SRM segmentation pixel-wise would [29] be chosen. SRM algorithm [26] Images that yields the best NCUT [28] mean accuracy K-means Images
NCUT [28]
K-means [29]
Figure 2. Cont.
SRM algorithm [26]
Symmetry 2016, 8, 62 Symmetry 2016, 8, 62
6 of 19 6 of 19
Figure 2. 2. Image Image segmentation segmentation results results between between different different techniques. techniques. Figure
2.2. Linkage Clustering of Image Regions Based on Tamura We further compare the results of image segmentation with the benchmark segmentation In ordersuch to improve the computational complexity ofK-means detection[29], algorithm, the image regions are techniques, as Normalized cuts (NCUT) [28], and as shown in Figure 2. The grouped into clusters. A straightforward linkage image block clustering algorithm has been applied SRM segmentation that yields the best pixel-wise mean accuracy would be chosen. to divide all image blocks into clusters according to their texture features [30]. 2.2. Linkage Clustering of Image Regions Based Tamura as the new criteria for finding similar image Improved Tamura texture features areondefined regions in block-clustering Improvedcomplexity Tamura features consider only coarseness contrast In order to improve thesteps. computational of detection algorithm, the imageand regions are as features to clusters. create a two-dimensional vector In this study,algorithm the Ward’shas linkage clustering grouped into A straightforwardfeature linkage image[31]. block clustering been applied to method can be described as follows: divide all image blocks into clusters according to their texture features [30].
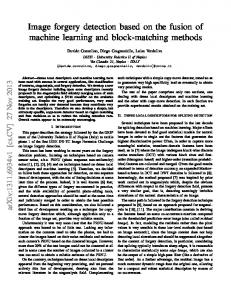
Improved are defined the new criteria for finding similar image regions 1—LocateTamura centroidtexture of eachfeatures segmented image as region. in block-clustering steps. Improved Tamura features consider only coarseness and contrast as features 2—Crop each segmented image region to 11 × 11 pixels around its centroid. to create a two-dimensional feature vector [31].image In this study, the Ward’s linkage clustering method 3—Apply Tamura texture on each square block. can be described as follows: 4—Cluster similar image regions by texture. 1—Locate centroid ofassumed each segmented By default, it is that theimage block region. size of 11 × 11 pixels is smaller than segmented image regions. However, if the block size 11to×11 11ˆpixels is larger than size of forged region, the block 2—Crop each segmented imageofregion 11 pixels around itsthe centroid. will cover Tamura more neighborhood pixels outside theblock. forged region. As a result, the clustering process for 3—Apply texture on each square image blocks becomes futile. 4—Cluster similar image regions by texture. For every stage in the clustering process, there are N numbers of clusters. The pairs of clusters By default, is assumed that pair the block size of ˆ 11 pixels is smaller thanthe segmented image are formed usingitN(N−1)/2. Every of clusters is 11 merged together if they form least increment regions. However, if the size 11 11 pixels is larger than the of forged region, the block to the sum of squares forblock errors.ofOnce allˆ pairs clusters are merged, thesize process is considered finished will cover more neighborhood pixels outside the forged region. As a result, the clustering process for [32]. It is noteworthy that Ward’s linkage clustering method has no threshold. blocks becomes futile. For every stagePartitioning in the clustering 2.3. Angular Radial (ARP)process, there are N numbers of clusters. The pairs of clusters are formed using N(N´1)/2. Every pair of clusters is merged together if they form the least increment to For efficient CMFD systems with rotation and scale invariance, a rotation robust region the sum of squares for errors. Once all pairs clusters are merged, the process is considered finished [32]. description method is employed using ARP [33]. The ARP was originally developed as an edge based It is noteworthy that Ward’s linkage clustering method has no threshold. descriptor. We proposed a simple modification of the original ARP by selecting corner points in the image regions as features. 2.3. Angular Radial Partitioning (ARP) The algorithm applies ARP of a circular region that is invariant to rotation and scale For efficient CMFD systems with rotation and scale invariance, a rotation robust region description transformations on each image region indexed by its centroid coordinates in the same cluster. method is employed using ARP [33]. The ARP was originally developed as an edge based descriptor. The image regions are divided into circular sectors of the surrounding circle. The algorithm We proposed a simple modification of the original ARP by selecting corner points in the image regions defines N as the number of angular divisions equal to 12, and θ = 2π/N is the angle between adjacent as features. sectors as shown in Figure 3. The radial partitions are labeled as S1, S2,…, S12. All 12 sectors are saved The algorithm applies ARP of a circular region that is invariant to rotation and scale to find Harris corner points in the next subsection. In our method, we experimentally set the radius transformations on each image region indexed by its centroid coordinates in the same cluster. of circle region r = 8. The image regions are divided into circular sectors of the surrounding circle. The algorithm defines N as the number of angular divisions equal to 12, and θ = 2π/N is the angle between adjacent sectors as shown in Figure 3. The radial partitions are labeled as S1 , S2 , . . . , S12 . All 12 sectors are saved to find Harris corner points in the next subsection. In our method, we experimentally set the radius of circle region r = 8.
Figure 3. Angular radial partitioning of an image region with angular sectors.
transformations on each image region indexed by its centroid coordinates in the same cluster. The image regions are divided into circular sectors of the surrounding circle. The algorithm defines N as the number of angular divisions equal to 12, and θ = 2π/N is the angle between adjacent sectors as shown in Figure 3. The radial partitions are labeled as S1, S2,…, S12. All 12 sectors are saved to find Harris corner points in the next subsection. In our method, we experimentally set the radius Symmetry 2016, 8, 62 7 of 19 of circle region r = 8.
Symmetry 2016, 8, 62
7 of 19
2.4. Harris Corner Detection Figure 3. Angular radial partitioning of an image region with angular sectors.
Figure 3. Angularemploys radial partitioning of an image with angular sectors. The proposed algorithm Harris corners as aregion key-points based method for region duplication forgery detection after converting colored images into grayscale. 2.4. Harris Corner Detection A Harris corner detector renders features invariant to geometric transformations. It is used as a key-points method to representemploys the internal structure of the image regions. The proposed algorithm Harris corners as matched a key-points based method for region The Harris corner detector is an invariant to rotation technique that identifies corners of an duplication forgery detection after converting colored images into grayscale. image [34]. Harris corner detection is based on the second moment auto correlation A Harris corner detector renders features invariant to geometric transformations. Itmatrix. is usedThis as a matrix describes the Gradient distribution of input images at point x, weighted by Gaussian G(x,σ) key-points method to represent the internal structure of the matched image regions. as theThe following: Harris corner detector is an invariant to rotation technique that identifies corners of an
image [34]. Harris corner detection is basedon the second moment auto correlation matrix. This I 2 ( x, σ ) I x I y ( x, σ ) x images x, weighted by Gaussian G(x,σ) as matrix describes the Gradient distribution of input at point M G ( x , σ ) (1) the following: « I I ( x, σ) I 2 ( x, σ) ff x y y 2 I px, σq Ix Iy px,σq M “ Gpx, σq x , (1) , Ix Iy px, σq Iy2 px, σq 2
2
where I2 x , 2I y , I x I y are square derivatives of input image I. where Ix , Iy , Ix Iy are square derivatives of input image I. Figure Figure 44 shows shows detection detection of of centroids centroids of of the the image image region, region, and and the the detection detection of of Harris Harris corner corner points around these centroids. points around these centroids.
(a)
(b)
Figure and Harris Harris corners cornersof ofimage imageregions. regions.(a) (a)Centroids Centroidsofofimage image regions represented Figure 4. 4. Centroids Centroids and regions represented in in red; (b) Harris corner points around centroids represented in green. red; (b) Harris corner points around centroids represented in green.
2.5. 2.5. Region Region Descriptor Descriptor Based Based on on Chain Chain Code Code In the proposed algorithm, the clustering In the proposed algorithm, the clustering of of image image regions regions based based on on Tamura Tamura texture texture is is followed followed by matching procedures. However, the matching procedure is divided into two main steps: by matching procedures. However, the matching procedure is divided into two main steps: In In the the first first step, step, initial initial matching matching is is done done based based on on the the internal internal structure structure of of the the image image region region by by using the chain codes. While in the second step, the feature based on the HGP-2 descriptor is using the chain codes. While in the second step, the feature based on the HGP-2 descriptor is used used as as texture-based matching. The second matching step will be used only if the first matching is found, texture-based matching. The second matching step will be used only if the first matching is found, otherwise is repeated repeated between between two two other other image image regions regions in in the the same same cluster. cluster. otherwise the the matching matching procedure procedure is To achieve good performance with rotation attacks in the first step matching, we developed a rotation invariant method that can detect duplicate regions with rotation by encoding the number of circular shifts expressed in multiples of 30 degrees (counter clockwise) between two chain codes of image regions. Chain codes are saved into feature vectors to represent the sequence of the total number of Harris
Symmetry 2016, 8, 62
8 of 19
To achieve good performance with rotation attacks in the first step matching, we developed a rotation invariant method that can detect duplicate regions with rotation by encoding the number of circular shifts expressed in multiples of 30 degrees (counter clockwise) between two chain codes of image regions. Chain codes are saved into feature vectors to represent the sequence of the total number of Harris Symmetry 2016, 8, 62 8 of 19 corner points in each sector around the centroid of the image region. The significance of using chain codes is to provide a rotation invariant method that can detect duplicate regions with rotation. 𝑐ℎ𝑎𝑖𝑛𝑆𝑒𝑔 region = [𝑠𝑢𝑚(𝐻, 𝑆𝑖 ), 𝑠𝑢𝑚(𝐻, 𝑆𝑖+1 ), … , 𝑠𝑢𝑚(𝐻, 𝑆𝑖=12 )] The chain code of detected is defined as follows: where sum calculateschain the total“number of SHarris corners in each sector. rsum pH, Seg i q , sum pH, Si`1 q , . . . , sum pH, Si“12 qs The chain code and its circularly shifted version are looking for closely one-to-one matching between two image regions in number the sameofcluster. where sum calculates the total Harris corners in each sector. The chain code and its circularly version looking for closely one-to-one matching rotation duplication forgery,shifted as well as thearecorresponding detection performance, is between two image regions in the same cluster. illustrated in Table 1. For example, the chain code C2 of the duplicated image region with an angle The rotation forgery, asshifted well asanticlockwise the corresponding performance, is illustrated of rotation of 90°duplication should be circularly threedetection times to be matched with C1. As a in Table 1. For example, the chain code C2 of the duplicated image region with an angle of rotation result, the proposed algorithm estimates the rotation angle according to the total number of circular of 90˝ should be circularly shifted anticlockwise three times to be matched with C1. As a result, the shifts of the chain codes of the forged image. Each one time of circular shift is equal to 30°. proposed algorithm estimates the rotation angle according to the total number of circular shifts of the chain codes of the forged image. Each one time of circular shift is equal to 30˝ . Table 1. Threshold value analysis for our method.
Table 1. Threshold value (C2) analysis Chain Code (C1) for Chain Code forfor our method. Estimated Rotation Angle Region 1 Region 2 Chain Code (C1) for Region 1 Chain Code (C2) for Region 2 Estimated Rotation Angle [2 2 1 2 1 1 2 2 2 2 2 2] [2 1 2 1 1 2 2 2 2 2 2 2] 30° ˝ [2 [1 2 1122111 12 12 1 2 21 21 2] 2 1 1] [2 1[21 112111112 22 12 12 21 21]2] 60° 30˝ [1 1 2 1 1 1 1 1 1 2 1 1] [2 1 1 1 1 1 1 2 1 1 1 1] 60 [1 1 0 0 1 1 1 1 0 0 1 1] [0 1 1 1 1 0 0 1 1 1 1 0] 90° ˝ [1 1 0 0 1 1 1 1 0 0 1 1]
[0 1 1 1 1 0 0 1 1 1 1 0]
90
2.6. Regularity Based Descriptor 2.6. Regularity Based Descriptor For each each cluster clusterofofimage imageregions, regions, first step of the matching process to the findsimilar the similar For thethe first step of the matching process is to is find chain chain codes that represent the internal structure of the matched However, this matching codes that represent the internal structure of the matched regions.regions. However, this matching process process alone struggles detect a non-uniform duplicated regions. Thus,to inreduce order to reduce the false alone struggles to detectto a non-uniform duplicated regions. Thus, in order the false positives positives detection, we employed a local descriptor using HGP-2 to measure the amount of detection, we employed a local descriptor using HGP-2 to measure the amount of irregularities around the centroid and around each Harris the image that theregions same chain codethe as irregularities around the centroid andcorner aroundofeach Harris regions corner of thehave image that have shown in Figure HGP-2 be employed only ifbe theemployed first matching found. same chain code 5. as The shown in Figure 5. The HGP-2 only ifisthe first matching is found.
5. Hölder Hӧlder estimation regularity based descriptor (HGP-2) for image image region. region. (1) Represents Represents Figure 5. (2–4) represent represent HGP-2 HGP-2 descriptors descriptors for for Harris Harris points. points. HGP-2 descriptor for centroid; (2–4)
The HGP-2 HGP-2 descriptor descriptor is based on The symbolic symbolic expression expression The is based on formal formal concept concept of of image image regularity. regularity. The estimator is is defined definedby byaaGaussian Gaussiansmooth smoothfilter, filter,which whichgives givesa adescription description texture and for HGP-2 estimator ofof texture and is described as as follows [35]: is described follows [35]: HGP ´ − 22 “ =G 𝐺1 × |log |𝐺 × (𝑘 × (𝑅 − 𝐺 × 𝑅))| | HGP 1 ˆ |log |G11 ˆ pk ˆ pR ´ G11 ˆ Rqq| |
(2) (2)
where R is selected as a 9 × 9 pixel block, G1 is a Gaussian kernel at scale 1; k is the optimal operator where R is selected as a 9 ˆ 9 pixel block, G1 is a Gaussian kernel at scale 1; k is the optimal operator experimentally fixed as equal to 11 to perform a good representation of local image patterns. experimentally fixed as equal to 11 to perform a good representation of local image patterns. 2.7. Region Duplication Localization The common assumption is that the forged duplicate regions have been subjected to geometric transformation such as rotation. Therefore, we need to represent the image region by robust features that are insensitive to rotation.
Symmetry 2016, 8, 62
9 of 19
2.7. Region Duplication Localization The common assumption is that the forged duplicate regions have been subjected to geometric transformation such as rotation. Therefore, we need to represent the image region by robust features that are insensitive to rotation. To achieve this goal, a median absolute deviation (MAD) has been used as a similarity measure for second matching step between HGP-2 descriptors of centroids and HGP-2 descriptors of all Harris corners of the image regions in the same clusters [36]. MAD as a measure of similarity for the second matching step between HGP-2 sets is proposed to remedy the problem of texture-based matching. MAD is computed separately for (HGP-2)c , and for (HGP-2)H1 , (HGP-2)H2 ,.., (HGP-2)Hn , where n is the number of Harris corners that surround the centroid as shown in Figure 5. As a result, the final Mc and MH are denoted as follows: Mc “ MADpHGP ´ 2c q; MH “ MADpHGP ´ 2Hi , HGP ´ 2H2 , . . . , HGP ´ 2Hn)
(3)
MH is created as an array of MAD for each Harris corner that surrounds the centroid. However, the size of Mc = 1, while the size of MH = n. Both Mc and MH are defined as a measure of similarity for detecting duplicated regions and are saved into feature vector fv . This vector is used to detect duplicated image regions. The final feature vector fv for two image regions in the same cluster is given by: fv “ rMc , MH s; fv 1 “ rMc 1 , M1 H s
(4)
The dimension of both fv , and fv ’ will be n + 1. Both fv and fv ’ should have similar feature dimension because both image regions have the same number of HGP-2 descriptors. The final set of matched key points be obtained by using Euclidean distance between two regions R1 , R2 that share the chain code with corresponding feature vectors fv and fv ’: D pR1 , R2 q “
b `
1
fv ´ fv
˘2
(5)
The two regions R1 , R2 are considered as matched, only if D satisfies the following condition: DpR1 , R2 q ď θ
(6)
where θ is the threshold value. We have experimentally chosen the value of θ as 0.18. Finally, lines will connect the Harris corner points and centroids of the two matched regions in order to locate the tampered areas in the image. Finally, matched keypoints between similar regions are linked and the duplicated regions are localized in blue to show forgery. 2.8. Threshold Selection Value The proposed algorithm is analysed to determine the threshold value for achieving the highest true positive rate (TPR) and lowest false positive rate (FPR) scores. Different threshold values are tested to measure their influences on the detection of the forged and original image regions. Table 2 illustrates how decision thresholds affect the true positive rate (TPR) and false positive rate (FPR). The best threshold (θ) value is empirically found to be 0.18 which identified the best TPR and FPR. Table 2. Threshold value analysis for our method. Threshold Value (θ)
True Positive Rate (TPR)
False Positive Rate (FPR)
0.14 0.16 0.18 0.20 0.22 0.25
0.92% 0.94% 0.96% 0.96% 0.96% 0.96%
3% 6% 2.8% 7% 8% 12%
Symmetry 2016, 8, 62
10 of 19
2.9. The Algorithmic Complexity The goal of computational complexity is to assess the proposed algorithm according to its performances. The main problem in image region duplication forgery detection is the computational complexity related to block matching. The technical viewpoint of this study is based on three components: SRM segmentation, linkage clustering and Harris corner points. If we consider the input image having (M ˆ N) pixels, then the SRM segmentation time will be defined as [26]: T1 “ O pM ˆ Nq ˆ logQ (7) where Q is independent random variable taking positive values ranging from 1 to 256 as defined in [26]. The Ward’s linkage time used for clustering the image regions can be represented as: ´ ¯ T2 “ O L2
(8)
where L is the total number of detected image regions to obtain clustered regions based on their texture features. The time used to find Harris corner points for each image region in the same cluster followed by the searching algorithm with sliding search window of size (b ˆ b) would be equal to: ´ ¯ T3 “ O K ˆ b2
(9)
where (b ˆ b)