G.A. Ruza,b and P.A. Estéveza a Department of Electrical Engineering, University of Chile, Casilla 412-3, Santiago, Chile b SONDA S.A., Teatinos 500, Santiago ...
Intelligent Production Machines and Systems D.T. Pham, E.E. Eldukhri and A.J. Soroka (Eds.) (C) 2005 Elsevier Ltd. All rights reserved
Image segmentation using fuzzy min-max neural networks for wood defect detection G.A. Ruza,b and P.A. Estéveza a
Department of Electrical Engineering, University of Chile, Casilla 412-3, Santiago, Chile b SONDA S.A., Teatinos 500, Santiago, Chile
Abstract In this work a colour image segmentation method for wood surface defect detection is presented. In an automated visual inspection system for wood boards, the image segmentation task aims to obtain a high defect detection rate with a low false positive rate, i.e., clear wood areas identified as defect regions. The proposed method is called FMMIS (Fuzzy Min-Max neural network for Image Segmentation). The FMMIS method grows boxes from a set of seed pixels, yielding the minimum bounded rectangle (MBR) for each defect present in the wood board image. The FMMIS method was applied to a set of 900 colour images of radiata pine boards, which included 10 defect categories. The FMMIS achieved a defect detection rate of 95 percent on the test set, with only 6 percent of false positives. The area recognition rate (ARR) criterion was computed, to measure the segmentation quality, using as a reference the manually placed MBR for each defect. The ARR achieved 94.4 percent on the test set. The results show significant improvements compared with previous work and that the computational load of FMMIS is suitable for real-time segmentation tasks.
1. Introduction Automated visual inspection (AVI) systems are an automated form of quality control normally achieved using a camera connected to a computer. The AVI framework includes five processing stages: image acquisition, image enhancement, image segmentation, feature extraction and classification [1]. A review of AVI research applied to the inspection of wood boards, concluded that segmentation is often the most timeconsuming part of the process, and that usually does not locate all defects properly [2]. Colour image segmentation algorithms can be classified into one or more of the following techniques [3]: histogram thresholding, feature space clustering, region-based approaches, edge detection, fuzzy approaches, neural networks, physics-based approaches
and hybrid techniques. The selection of a colour space is application dependent. Brunner et al. [4] found that, for wood images there is no advantage in transforming the red, green and blue (RGB) colour space into other colour spaces. The flexibility of fuzzy sets and the computational efficiency of neural networks have caused a great amount of interest in the combination of both techniques. Among the neurofuzzy approaches, Simpson [5] introduced the fuzzy min-max (FMM) clustering neural network, where clusters are represented as hyperboxes in the n-dimensional pattern space. In [6], the FMM was extended and improved. In this work , an image segmentation method based on the FMM neural networks is proposed. The new method is called fuzzy min-max neural network for image segmentation (FMMIS). The performance of this
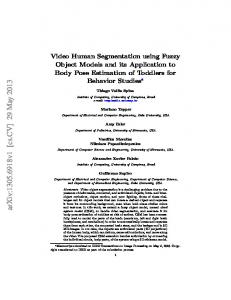
Fig.1. Different stages of the proposed image segmentation method. (a) seed selection process, (b) input patterns, (c) Fuzzy Min-Max neural network for Image Segmentation and (d) minimum bounding rectangles enclosing the defects, which correspond to the FMMIS output.
method is evaluated on the segmentation of wood (radiata pine) board images, which include 10 defect categories. The FMMIS method has been successfully applied to wood defect detection in [7] and to face detection in [8]. This paper is complementary to [7], where the FMMIS learning algorithm was not described in full, as is done here. 2. Image segmentation method The proposed image segmentation method for wood defect detection consists of 4 stages, shown in Fig. 1. Each stage is described in the following subsections.
To speed up the image segmentation process, the FMMIS does not use all the pixels from the image analysed. Instead, it only uses a few input pixels called seeds, to grow the hyperboxes. The seeds are automatically determined (located) by an ad-hoc procedure which is described in what follows. Considering the great variability of colour of the wood boards, the seed selection is based on adaptive thresholding. For each board image, the mean colour intensity per channel, µt, and the minimum colour intensity per channel, κt, where t = R, G, B, are measured. A cumulative histogram per channel, Ht, is defined as: n
∑ h (i ) t
i =κ t
θ t = αH (µ t )
(2)
where α is a user-defined parameter, typically α ≤ 0.01 . To detect defects that are brighter than those detected by using θ t , an additional colour intensity is considered, and calculated as:
ρt =
θ t + µt 2
.
(3)
For each wood board image, the seeds are the pixels belonging to the following intensity range:
2.1. Seed selection process
H t (n ) =
where n is the colour intensity level (n ≤ 255) and ht is the histogram of the wood board image for channel t. In addition, a colour intensity level is selected, per channel, based on the cumulative histogram as follows:
(1)
[κ It = t [κt
θt ] ∧ ρt θt ]
if θt < λt if θt ≥ λt
(4)
where λt is a user-defined threshold for each channel, that allows to avoid false positives when all the defects on the wood board image are not too dark. In Fig. 1a. the seeds are represented as white circles. 2.2. Input patterns
The input patterns are the spatial coordinates of the seeds, determined in subsection 2.1. with each dimension normalized in the range [0,1]. Let X be a S × 2 input matrix (see Fig. 1b.), where S is the number of seeds selected. The position of the hth seed in the
image is represented by the vector X h = ( xh1 , xh2 ) ∈ I 2 , where the first coordinate indicates the column and the second coordinate the row of the image.
2.3. Fuzzy min-max neural network for image segmentation The FMMIS is built using hyperbox fuzzy sets. A hyperbox defines a region in the n-dimensional geometric space by pairs of min-max points for each spatial coordinate of the image (rectangular boxes in the case of 2-dimensional images). Each hyperbox fuzzy set has associated a membership function which describes the degree of membership (spatial proximity) of a given pixel to a hyperbox in the [0,1] interval. Let each hyperbox fuzzy set, Bj, be defined by the ordered set
{
(
B j = X h ,V j , W j , b j X h ,V j , W j V j = (υ j1 , υ j 2 )
where
is
the
)}
(5)
min-point
and
W j = (ω j1 , ω j2 ) is the max-point. The membership
(
)
function for the jth hyperbox is 0 ≤ b j X h ,V j ,W j ≤ 1 . Seeds contained within a hyperbox have full membership value equal to 1. The more distant the seeds are from the min-max bounds of the hyperbox the lower are their membership values. The membership function defined in [6] is used here:
(
)
( ([ ] (6) [1 − f (υ ji − xhi , γ ]))
b j X h ,V j , W j = min min 1 − f ( xhi − ω ji , γ , i =1,2
where f is the ramp function defined as,
1 f ( g,γ ) = gγ 0
gγ > 1 0 ≤ gγ ≤ 1 gγ < 0
(7)
and γ is the sensitivity parameter, that controls how fast the membership value decreases when the seed is farther from the min-max bounds of the hyperbox. Fig. 2 shows the two-dimensional membership function of (6), with min-point V = [0.4 0.4] and max-point W = [0.7 0.7], and γ =1. The membership values ranging from 0 to 1 are represented by the gray-scale ranging
Fig.2. Example of the two-dimensional membership function associated to each hyperbox used by the FMMIS.
from black to white, respectively.
2.3.1. FMMIS learning algorithm 1. Initialisation: Vj and Wj points are initially set to 0. When a hyperbox is adjusted for the first time using the input pattern X h = ( xh1 , xh2 ) , the min and the max points of the hyperbox are made identically to this pattern, Vj = Wj = Xh.
(8)
2. Hyperbox Expansion: When an input pattern (new seed pixel) is presented, the hyperbox with the highest degree of membership is found and expanded to enclose the input pattern. The hyperbox expansion is accepted only if the region contained by the expanded hyperbox is similar in colour to the region enclosed by the hyperbox before the expansion. A fuzzy colour homogeneity criterion based on the standard Z-function of the Euclidean distance between the mean colour intensities of the two hyperboxes is defined. In this way, the colour similarity, in the RGB space, between the hyperboxes before and after the expansion are compared. A user-defined parameter τ ∈ [0,1] is introduced to control the required degree of colour homogeneity for expanding hyperboxes. Formally, the following constraint must be satisfied to expand a hyperbox.,
Z(x,a,b,c) ≥ τ , where Z is a fuzzy membership function defined as
(9)
1 2 x −a 1 − 2 c−a Z(x, a, b, c) = 2 2 x − c c−a 0
0≤x≤a a≤x≤b (10) b≤x≤c c≤x≤L
and x is the Euclidean distance between the mean colour intensities in the image region covered by the two hyperboxes (before and after expansion), measured in the RGB space. The parameters of (10) are set to: a L = 0, b = , c = L, and L = 255 3 . If the expansion 2 criterion for including the current seed is not satisfied, a new hyperbox is created starting with that seed as done in (8). 3. Hyperbox Overlap Test: Let us assume that the hyperbox Bj was expanded in the previous step. To test for overlapping, a dimension-by-dimension comparison is performed between Bj and all the rest Bk with k ≠ j. Overlap exists between Bj and Bk, if one of the following four cases are met for dimensions i= 1,2: Case 1: υ ji < υki < ω ji < ωki Case 2: υki < υ ji < ωki < ω ji
4. Hyperbox Contraction: If overlap exists between Bj and Bk, both hyperboxes begin to contract until the overlap is eliminated. The hyperbox contraction rules, that depend on the four cases previously described, are as follows: Case 1: υ ji < υki < ω ji < ωki ,
=
w new ji
=
2 Case 2: υki < υ ji < ωki < ω ji , new υ new ji = wki =
old υ old ji + ωki
2 Case 3: υ ji < υki ≤ ωki < ω ji ,
)
new j2
}
new = ω old (15) j 2 + 1, update h max jt with ω j 2
(
)
new j1
(
)
Case 3: while max h min jt (r ) ≤ u t r
{υ
new j2
new = υ old j 2 − 1, update h min jt with υ j 2
(
)
Case 4: while max v min jt (r ) ≤ u t r
{υ
new j1
}
new = ω old (16) j1 + 1, update v max jt with ω j1
}
(17)
}
new = υ old j1 − 1, update v min jt with υ j1 . (18)
(11)
(12)
If ωki − υ ji < ω ji − υki then old υ new ji = ωki
(13)
otherwise, old ω new ji = υki
(14)
Case 4: υki < υ ji ≤ ω ji < ωki , by symmetry the same assignments as in Case 3.
{ω
{ω
Case 4: υki < υ ji ≤ ω ji < ωki .
υkinew
(
Case 1: while max h max jt (r ) ≤ ut r
Case 2: while max v max jt (r ) ≤ u t r
Case 3: υ ji < υki ≤ ωki < ω ji
υkiold + ω old ji
5. Fine-tuning Hyperbox Expansion: After a single pass through all the seeds, there is a fine-tuning hyperbox expansion process, which allows the hyperbox to grow, if necessary, until the defect is completely enclosed. For 2D images, the hyperboxes are rectangles defined by four line segments. A horizontal line segment, hmin, and a vertical line segment, vmin, pass through the min-point of the hyperbox. Likewise, a horizontal line segment hmax, and a vertical line segment, vmax, pass through the max-point of the hyperbox. For the hyperbox Bj, and the colour channel t, the following notation is introduced: hmaxjt(r), vmaxjt(r), hminjt(r) and vminjt(r) are the colour intensities of the rth pixel belonging to the line segments hmax, vmax, hmin and vmin respectively. Let ut be a colour intensity threshold defined for channels t = R,G,B. A line segment (any of the four) would be expanded if it contains pixels darker than ut. The following conditions for the while cycles should be satisfied for each t = R,G,B.
6. Hyperbox Merging: After finishing the finetuning hyperbox expansion process (if necessary), a final step is added in order to merge hyperboxes belonging to the same defect. The number of hyperboxes constructed per defect depends on the value of τ in (9). Let c be the number of hyperboxes after the fine-tuning hyperbox expansion process. The centroid, CBj (cbj1,cbj2), of the hyperbox Bj is computed as:
cb ji =
υ ji + ω ji 2
(19)
for i = 1,2 and j = 1,…, c. Let Ij be the image region contained within the limits of the hyperbox Bj. Let dE(Ij,Ik) be the Euclidean distance in the colour space between the mean intensities of the image regions Ij and Ik. The fuzzy membership function ∆c, which measures the proximity in colour and space between two hyperboxes, is defined as: ∆c = min (Z(dE(Ij,Ik),a,b,c), bj(CBj))
(20)
where Z is the Z-function defined in (10), and bj is the membership function defined in (6). The merging criterion is to merge hyperboxes whose proximity defined by (20) is greater than a given threshold. The FMMIS representation as a neural network (see Fig. 1c. ) makes possible to explore the parallelism of the algorithm. Although the learning algorithm is not necessarily neural (there is no biological principal underlying the expansion-contraction process), the execution of the network, once trained, fits in a neural scheme. For this case, a three-layered neural network was chosen to implement the FMMIS, as shown in Fig. 1c. The input layer, FX, consists of two processing elements (PE), one for each dimension of the input pattern (seed) X h = ( xh1 , xh2 ) . The second layer, FB, consists of m PE (ideally one per each defect in the wood board image). Finally, the third layer , FC, does the merging of the nodes of the second layer belonging to the same defect. There are two connections between each node of FX and each node of FB (see Fig. 1. c. ). Each node of FB in the three-layered neural network represents a hyperbox fuzzy set, where the connections from FX to FB are the min- and max- points. The transference function of FB is the membership function defined in (6). The connections are adjusted using the learning algorithm described in this subsection. The connections between the nodes of FB and FC have binary values and they are stored in the U matrix, with value 1 if bj follows the merging criterion giving origin to ck , and with value 0 otherwise. 2.4. Output of the FMMIS The last stage is to draw the rectangle (minimum bounding rectangle) on each defect using the min- and max-points of each hyperbox formed by the FMMIS algorithm, as shown in Fig. 1d.
3. Methods
A sample of 900 colour images (320 × 240 pixels) of wood boards was drawn from the University of Chile database [9]. Each image was manually labelled according to its largest defect, into one of the following 10 defect categories (see Ruz et al. [7] for details): birdseye & freckle, bark & pitch pockets, wane, split, stain, blue stain, pith, dead knot, live knot and hole. The data set, which corresponded to 90 images per category, was partitioned into two sets: 600 images for the training set and 300 images for the test set. The parameters of FMMIS using the training were set to, γ =1 (sensitivity parameter), τ = 0.99 (degree of colour homogeneity used in hyperbox expansion), u R =195 (fine-tuning hyperbox expansion parameter), and D = 0.95 (hyperbox merging parameter). The performance of the FMMIS algorithm was measured on the test set using the following criteria: number of true positives TP (the number of defects contained by hyperboxes and correctly detected), number of false positives FP (the number of grain lines contained by hyperboxes, i.e., detected as defects), and the average processing time. The area recognition rate (ARR) criterion allows to compare the area of the hyperbox built automatically by FMMIS with the area of the manually placed minimum bounding rectangle. The ARR is defined as,
ukp unp ARR = 1 − − tp tp
(21)
where tp is the total number of pixels in the MBR; ukp is the number of unrecognized defect pixels, i.e., the absolute difference between the defect pixels contained within the MBR and the defect pixels contained within the hyperbox determined by the FMMIS method; and unp is the number of unrecognized non-defective pixels, i.e., the absolute difference between the clear wood pixels contained within the MBR and the clear wood pixels contained within the hyperbox determined by the FMMIS method. The FMMIS algorithm was implemented in MATLAB 6.5 on a PC Pentium IV, 2.4 GHz, 512 MB RAM. The average processing time was measured for each image, from the seed selection process to the output of the FMMIS.
4. Experimental results
The FMMIS global performance on the test set, and its per-category disaggregation are shown in Table 1. The global TP rate achieved 95 percent of the total defects present in the test set, while the FP rate was 6 percent of the total grain lines (clear wood) present in the test set. The global area recognition rate achieved was 94.4 percent. In contrast, the global performance of the segmentation module of our previous AVI system [9], which used histogram-based multiple thresholding, obtained a TP rate of 94 percent with an FP rate of 32 percent on the same test set. None of the categories achieved an FP rate lower than 10 percent. On average, the number of selected seeds per image was about 100, i.e., 0.1 percent of the total number of pixels of an image. This fact makes the FMMIS algorithm very fast. The last column of Table 1 shows the average processing time for FMMIS, including the seed selection process, which reached 0.11 ± 0.04 seconds per image. In comparison, the Seed Region Growing (SRG) algorithm of Adams and Bischof [8] obtained an average processing time per image of 3.03 ± 1.30 seconds (programmed in MATLAB and run on the same PC than the FMMIS algorithm) on the same test set, i.e., the FMMIS was 27 times faster than SRG. Moreover, the SRG algorithm obtained poor segmentation on the birdseye and freckle, stain, blue stain, and split categories (TP < 50 %). 5. Conclusions
The proposed colour image segmentation method achieved a high defect detection rate (95%) with a low false positive rate (6%) on images of wood boards. The FMMIS method is based on the original FMM, but with a new learning algorithm specially adapted for image segmentation tasks. The FMMIS method combines clustering with region-based techniques to obtain a substantially different method than the original Simpson’s FMM. The results show that significant improvements have been obtained in comparison to previous work. Acknowledgements
This work was supported in part by Conicyt-Chile, under grant Fondecyt 1050751.
Table 1 Performance of the FMMIS for wood defect detection, measured on the test set Defect Category Birdseye and freckle
TP % FP% ARR % Time (sec) 91.6 10.8
90.3
0.12
2.6
95.3
0.07
Wane
100.0 10.2
100.0
0.15
Splits
100.0 11.8
Bark and pitch pockets 100.0
90.6
0.11
Stain
88.9
8.0
84.9
0.21
Blue stain
90.2
7.1
88.2
0.13
Pith
100.0
4.2
99.8
0.13
Dead knots
97.4
1.7
99.3
0.08
Live knots
100.0
4.1
97.1
0.08
Holes
100.0
0.0
98.3
0.06
95
6
Global (10 categories)
94.4 0.11± 0.04
References [1]
Pham DT and Alcock RJ. Smart Inspection Systems. Academic Press, London, 2003, 218 pp. [2] Pham DT and Alcock RJ. Automated grading and defect detection: A review. Forest Prod. J. 48(4) (1998) 34-42. [3] Cheng HD, Jiang XH, Sun Y, and Wang J. Color image segmentation: Advances and prospects. Pattern Recognition. 34 (2001) 2259-2281. [4] Brunner CC, Maristany AG, Butler DA, VanLeeuwen D, and Funck JW. An evaluation of color spaces for detecting defects in Douglas-fir veneer. Industrial Metrology. 2 (1992) 169-184. [5] Simpson PK. Fuzzy min-max neural networks. Part 2. Clustering. IEEE Trans. Fuzzy Sets. 1 (1993) 32-45. [6] Gabris B and Bargiela A. General fuzzy min-max neural networks for clustering and classification. IEEE Trans. on Neural Networks. 11 (3) (2000) 769-783. [7] Ruz GA, Estévez PA, Perez CA. A neurofuzzy color image segmentation method for wood surface defect detection. Forest Prod. J. 55 (4) (2005) 52-58. [8] Estévez PA, Flores RJ, Perez CA. Color image segmentation using fuzzy min-max neural networks. Proceedings of the International Joint Conference on Neural Networks, 2005, Montreal, Canada. [9] Estévez PA, Perez CA, Goles E. Genetic input selection to a neural classifier for defect classification of radiata pine boards. Forest Prod. J. 53 (7/8) (2003) 87-94. [10] Adams R and Bischof L. Seeded region growing. IEEE Trans. Pattern Anal. Machine Intell. 16 (6) (1994) 641646.