Email: {dsjen, parente, robbins, weigle, taylorr}@cs.unc.edu. â . Email: .... Blast, have been built by companies not affiliated with micro- scope developers.
ImageSurfer: A Tool for Visualizing Correlations between Two Volume Scalar Fields Dennis Jen*
Peter Parente*
Jonathan Robbins*
Department of Computer Science University of North Carolina, Chapel Hill
Department of Computer Science University of North Carolina, Chapel Hill
Department of Computer Science University of North Carolina, Chapel Hill
Christopher Weigle*
Russell M. Taylor II*
Department of Computer Science University of North Carolina, Chapel Hill
Department of Computer Science University of North Carolina, Chapel Hill
Alain Burette†
Richard Weinberg†
Department of Cell and Developmental Biology University of North Carolina, Chapel Hill
Department of Cell and Developmental Biology Neuroscience Center University of North Carolina, Chapel Hill
ABSTRACT ImageSurfer is a tool designed to explore correlations between two 3D scalar fields. Our scientific goal was to determine where a protein is located, and how much its concentration varies along the membrane of a neuronal dendrite. The 3D scalar field data sets fall into two categories: dendritic plasma membranes (defining the structure) and immunofluorescent staining (defining protein concentration along the structure). ImageSurfer enables scientists to analyze relationships between multiple data sets obtained with confocal microscopy by providing 3D surface view, height field, and graphing tools. Each tool reduces the complexity of the problem by extracting a restricted subset of data: finding a region of interest in 3D; getting a sense of relative concentrations in 2D, and getting exact concentration values in 1D. The current design is presented, along with the rationale for each design decision. The tool is already proving useful for data exploration, analysis, and presentation. CR Categories: I.3.7 [Computer Graphics]: Three-Dimensional Graphics and Realism; I.3.8 [Computer Graphics]: Applications; J.3 [Computer Applications]: Biology and Genetics
* †
Email: {dsjen, parente, robbins, weigle, taylorr}@cs.unc.edu Email: {alain_burette, rjw}@med.unc.edu
Keywords: scientific visualization, volume visualization, data exploration, biology, confocal microscopy, immunofluorescence 1 INTRODUCTION Confocal microscopy, a widely-used tool in biomedical research, can provide high-resolution 3D images of biological structures. These microscopes are designed to take advantage of widely used techniques that label biological structures with fluorophores (chemicals that fluoresce at specific wavelengths). For instance, if a specimen is labeled with two fluophores, the microscope can capture data from the same locus on the specimen twice, each time illuminating the specimen with a different wavelength of light. Because of the way the data sets are acquired, they are precisely aligned in space and can be easily fused for analysis. Although the microscope is designed to provide volume data, analysis of the data sets from confocal microscopes is in practice almost exclusively performed in only two dimensions. This reflects biomedical researchers’ unfamiliarity with 3D display tools, and the need for new software tailored to their research. Development of ImageSurfer, a program which displays the correlation between two 3D scalar fields, was driven by an experimental study of the distribution of calcium pumps within dendritic spines of neurons. Section 2 describes the problem domain. Section 3 describes the scientific goals. Section 4 provides a description of data collection and characteristics of the data relevant to its visualization. Section 5 describes existing systems capable of visualizing confocal data sets. Section 6 describes ImageSurfer. Section 7 documents feedback from the scientists. Finally Section 8 describes how ImageSurfer is being used for studies of cystic fibrosis and outlines planned future improvements.
2 BIOLOGICAL BACKGROUND The scientific question that motivated the development of ImageSurfer involved a study of proteins embedded in the plasma membrane of neurons (nerve cells). Besides the standard machinery used by all cells, each neuron also has a specialized receiver (composed of dendrites) and a long (100 µm-10 cm) thin (0.4-20 µm) transmission line (the axon), which branches and contacts dendrites of other neurons (Figure 1a). These contacts (synapses) are the sites of communication between neurons. To give a sense of its complexity, the human brain contains ~1010 neurons, making a total of ~1014 synaptic connections. Electrical depolarization of a neuron triggers an electrochemical spike (the “action potential”) which rapidly propagates down the axon to its presynaptic terminal, triggering release of a neurotransmitter chemical. The transmitter diffuses across the synaptic cleft (~20 nm wide) and binds to receptor proteins embedded in the postsynaptic dendritic membrane. This binding leads to depolarization, which can trigger an action potential in the target cell, if enough synapses are active simultaneously [1]. Most synaptic contacts are made through specialized structures called dendritic spines. The spine is a tiny bulbous projection, with a neck typically ~1-2 µm long and ~0.2 µm thick, ending in a spine “head,” typically ~0.5 µm in diameter (Figure 1b). Synaptic efficacy can vary. It is believed that changes in synaptic efficacy, especially in one brain region (the hippocampus), represent an important component of memory. Synaptic efficacy is highly regulated, especially by the local concentration of calcium ions, which activate a variety of complex enzyme systems within the neuron. The local concentration of calcium is in constant flux, reflecting the interplay between calcium entry through specialized ionic channels, and calcium extrusion, especially via the plasma membrane calcium ATPase (PMCA) [2]. While the biological function of spines remains controversial, recent work indicates that one major function is to compartmentalize calcium signals. To gain a better understanding of this compartmentalization, it is important to understand the distribution of PMCA pumps along the dendritic plasma membrane, and in different subregions of the dendritic spine.
sections were then stained with DiO (dioctadecyloxacarbocyanine perchlorate), a dye that fluoresces at a different wavelength. DiO is freely soluble in the lipids of the plasma membrane of a neuron, thus defining the shape of dendrites and dendritic spines in the region of interest. Tissue sections were then mounted on a microscope slide and covered with a thin coverslip for examination.
3 SCIENTIFIC GOALS To gain a better understanding of calcium signaling in forebrain neurons, we want to achieve the following: Goal 1: Define the distribution of PMCA along dendrites in the rat hippocampus. How is the PMCA distributed along a dendrite? Goal 2: Understand PMCA concentration along the length of the spine, from its parent dendritic shaft all the way to its tip (the usual site of synaptic contact). How does concentration vary along a given spine? Where is the highest concentration of PMCA? Where is the lowest concentration?
(a)
4.2 Image Capture Images of the specimen were acquired using a Leica SP2 confocal microscope [4]. The specimen was illuminated with a rasterscanned laser beam at a wavelength that causes the PMCAantibody complex to fluoresce. The specimen was then
4 DATA This section describes how data is collected from brain tissue, and then describes the characteristics of the data collected. 4.1 Specimen Preparation 50 µm-thick sections of formaldehyde-fixed tissue from the brain of Sprague-Dawley rats were immunostained for confocal microscopy. To identify the PMCA protein, we incubated sections with an antibody raised against PMCA, followed by incubation with a second antibody (raised against the first antibody) that has been chemically coupled to a fluorescent dye. To image neurons, the
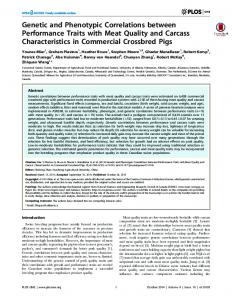
(b) Figure 1: The Spanish neurohistologist Santiago Ramon y Cajal (1852-1934) won a Nobel Prize for his studies of neurons, including the discovery of dendritic spines. (a) Drawings of neurons from Cajal’s work: Red arrowhead: dendrite; thick arrow: cell body (with nucleus); thin arrow: axon. (b) Close-ups, showing dendritic spines [3].
illuminated with light of another wavelength, causing fluorescence of DiO, as a second image of the same slice was captured. Confocal microscopy yields thin (