iMapping – A Zooming User Interface Approach for Personal and Semantic Knowledge Management Heiko Haller
Andreas Abecker
FZI Forschungszentrum Informatik an der Universität Karlsruhe Haid-und-Neu-Str. 10-14 76131 Karlsruhe, Germany
FZI Forschungszentrum Informatik an der Universität Karlsruhe Haid-und-Neu-Str. 10-14 76131 Karlsruhe, Germany
[email protected]
[email protected]
ABSTRACT We present iMapping, a zooming based approach for visually organizing information objects. It was developed on top of semantic desktop technologies and especially targets the support of personal knowledge management. iMapping has been designed to combine the advantages of spatial hypertext and other proven visual mapping approaches like mindmapping and concept mapping, which are incompatible in their original form. We describe the design and prototypical implementation of iMapping – which is fundamentally based on deep zooming and nesting. iMapping bridges the gap between unstructured content like informal text notes and semantic models by allowing annotations with the whole range from vague associations to formal relations. First experimental evaluation of the iMapping user-interface approach indicates favorable user experience and functionality, compared with state-of-the-art Mind-Mapping software.
Categories and Subject Descriptors H.5.2 [Information Interfaces and Presentation]: User Interfaces; L.1.0 [Knowledge and Media]: Knowledge Construction/Representation; M.4 [Knowledge Modeling]
General Terms Design, Human Factors, Experimentation
Keywords visual knowledge mapping, spatial hypertext, personal knowledge management, semantic desktop, human-computer interaction, interaction design
1.
INTRODUCTION
Many knowledge management systems, especially those which rely on highly structured information and meta data being entered and maintained by the users, fail because users
Permission to make digital or hard copies of all or part of this work for personal or classroom use is granted without fee provided that copies are not made or distributed for profit or commercial advantage and that copies bear this notice and the full citation on the first page. To copy otherwise, to republish, to post on servers or to redistribute to lists, requires prior specific permission and/or a fee. HT’10, June 13–16, 2010, Toronto, Ontario, Canada.. Copyright 2010 ACM 978-1-4503-0041-4/10/06 ...$10.00.
do not make this additional effort if they do not have to. This may be one of the reasons why semantic technologies have not found widespread use, so far, although semantic meta data would undoubtedly improve findability, interoperability and, in general, automated processing of information and knowledge items. For these technologies to be widely used, they have to provide immediate benefit to the user and it is crucial that they are very easy to use and do not constrain the user in her daily work. This immediate benefit is more likely to be experienced when users manage their everyday knowledge resources like personal notes, files, bookmarks etc. like in the setting of a semantic desktop environment (cp. [24]). On the other hand, Frank Shipman and Catherine Marshall warn that such semantic formality should be “Considered Harmful”, because it often forces the user to make formal decisions where they are premature, inconvenient or simply not possible [15]. We believe that it is critical to leave it up to the user, how much effort she wants to put into formalizing her content. So we aim at building an environment that covers the full range from informal note-taking over more structured graphical representations up to semantically formal knowledge models, and that provides semantic functionalities without restricting the user’s modeling freedom that she has in informal (‘non-semantic’) tools. In knowledge-intensive activities, it is even more crucial than otherwise, to unburden the user of all cognitive overhead in order to leave as much of the user’s limited working memory [19] to the actual task at hand. Cognitive overhead is that part of a user’s cognitive load that is not directly related to the intended action, but rather to dealing with side-issues or the software as such. When semantically formalized knowledge structures are used, content is typically fine grained and highly structured. Such content structures are typically more complex than plain text or classical hypertext structures. Even with the relatively simple structures in classical hypermedia, where we just have interlinked information objects on the granularity level of whole pages or documents, hypertext research has shown that users may get “lost in hyperspace” when browsing without additional navigational help [8]. This stresses the need for user interfaces that facilitate navigation and authoring of such structures without losing orientation. Using graphical environments for structuring externalized knowledge enables the users to use their highly efficient sense of spatial orientation on their personal knowledge and information space, and it enhances the link between their mental
and external models because it enables the use of diagrammatic depictions whose obvious structure corresponds more closely to the structure of the content because unlike text, diagrammatic knowledge representations carry a structural analogy to the content they represent [25]. We developed iMapping as a new visual mapping approach that tries to unite the strengths of established mapping techniques. It combines these strengths with modern IT approaches like deep zooming and semantic technologies. iMapping supports the whole range from easy informal notetaking to formalized knowledge engineering in the same powerful, yet easy-to-use, environment. The basic metaphor of an iMap is that of a large pin-board where information items can be spatially arranged, enabling users to gain a visual overview over collections of items at once. These items can represent bits of text as well as (in the near future) any kind of external resources like files, Web pages, pictures or other maps. They can also be nested into each other and interlinked in various ways. Besides browsing by links, users can navigate an iMap by zooming through it. This paper is structured as follows: in Section 2, we start from widespread visual knowledge mapping approaches and collect requirements for a new approach which combines advantages of prior work. Section 3 presents iMapping, the solution derived from that requirements, with a short sketch of implementation aspects in Section 4. Some emphasis is laid on experimental, comparative evaluation, discussed in Section 5. The concluding Section 6 relates iMapping to other contemporary work, summarizes and gives a brief outlook.
2.
BACKGROUND
From the many different forms of knowledge visualization [9], we focus on diagrammatic knowledge maps in the tradition of the following, that have proven useful for building knowledge models in the last decades: From the 1970ies on, a number of visual mapping techniques have evolved, some of which have found widespread use and have proven their usefulness, e.g., as learning aids in numerous studies. According to their basic topology, most of them can be related to one the following three fundamentally different primary approaches:
Mind-Maps. Introduced and trademarked by Tony Buzan [5], mind-maps provide an easy-to-understand, hierarchical, tree-like structure. Labeled branches and sub-branches are drawn extending from a single central node. Mind-Mapping is an established technique for brainstorming, outlining, note taking and clustering. Mind-Maps are however not suitable for relational structures between items because they are constrained to the hierarchical model.
Concept Maps. Contrary to that, concept maps, as introduced by Joseph Novak [21], have a graph-based structure which emphasizes the interrelations of items. Practically, concept maps consist of labeled nodes and labeled edges linking all nodes to a connected directed graph. They are not as easy to handle because explicitly specifying all these relations is often too laborious, e.g., for simple note-taking or brainstorming.
spatial hypertext paradigm in its pure form as described by Catherine Marshall and Frank Shipman [17] expressly abandons the concept of explicitly interrelating objects. Instead it uses spatial positioning as the basic structure. Because, as D. Kolb argues, “It would seem that linguistically labeled typed links and paths-patterns could carry more kinds of connections than spatial arrangements, if link types could be conveniently indicated. This may be so, but spatial arrangements can accommodate n-ary relations and gradations of meaning relations that are difficult to put into link type labels.” [16](p. 3). Like that, a self-contained hypertext can so be seen from an overview perspective, by spatially arranging single pages. To fuzzily relate two items, they are simply placed near to each other, but maybe not quite as near as to a third object. This allows for so-called “constructive ambiguity” [27] and is an intuitive way to deal with vague relations and orders. An overview over these and related approaches, their cognitive psychological foundations, studies about their effectiveness along with an evaluation of corresponding software tools can be found in [11]. It contains a comparison of these approaches and 13 software programs for certain typical knowledge mapping tasks.
Semantic Desktops. To interlink existing desktop objects, e.g. contacts, e-mails, events, tasks, files and notes, and to do that in a comprehensive way that they can be accessed with semantic technologies is the goal of so-called semantic desktops. A semantic desktop system can, e.g., answer queries like a list of all e-mails received from participants of the last project meeting. There are existing semantic desktop projects like DeepaMehta[23], haystack[14] and nepomuk1 . The development of iMapping, and the semantic data model CDS that it is based on, began as part of the nepomuk project. iMapping was designed with semantic desktop environments and use-cases in mind. For more information on semantic desktop systems in general, see [24] and 2 .
Zooming User Interfaces. Pad [22] as well as its successor Pad++3 by Ben Bederson [2], were the seminal developments in this area. They have been used in various applications and also as a Web browser capable of showing the viewed web pages and their link-structure from a bird eye’s view. In a study where participants had to perform browsing tasks in order to answer some questions, subjects using Pad++ were 23% faster than those using Netscape [3]. This suggests that large zoomable information surfaces are wellsuited hypertext front-ends. The work on Pad++ finally led to “Piccolo”[1], now community maintained as “Piccolo2D”4 , a scene-graph toolkit in Java and .Net that supports the development of 2D structured graphics programs, in general, and, in particular, Zoomable User Interfaces like iMapping, whose current implementation is based on it.
2.1
Based on the analysis of existing tools and approaches in [11], as well as literature from the areas of UI design and cognitive science, we have identified a set of functional re1
http://nepomuk.semanticdesktop.org http://semanticdesktop.org 3 http://www.cs.umd.edu/hcil/pad++/ 4 http://piccolo2d.org/ 2
Spatial Hypertext. A concept that evolved somewhat later out of hypertext research is called “spatial hypertext”. The
Requirements
quirements to be met by diagrammatic knowledge mapping techniques and tools in order to be cognitively adequate for personal knowledge management. This collection of requirements and its rationale is published in [13], and will here only be listed in brief:
Requirements for Knowledge Mapping Approaches. • Free Placing (Items should be freely placeable anywhere and should maintain their positions – at least relative to their surrounding.)
• providing overview and scalability by integrating context and detail through zooming; • facility for graph-based node-and-link representations as is common in concept maps and many other modeling approaches; • allowing constructive ambiguity (as in spatial hypertext);
• Free Relations: Interlinking items in different levels of formality:
• support for formal semantic statements (to reap the benefits of semantic technologies) and
– Formalized / semantic links (like in ontology editors)
• querying these semantic structures at the various levels of formality they have (so far, this is only covered the QuiKey extension mentioned in Section 3.1).
– Informal labeled links (like in concept maps) – Unlabeled links (e.g., just plain arrows or lines) – Free nodes that do not have any explicit relation to others. • Annotations: optionally hideable additional notes or highlights • Overview / Abstraction through clustering and hierarchical sub-maps • Scalability (ability to visually deal with large amounts of items)
Requirements for Knowledge Mapping Software. • Simple Editing: Adding or modifying items without additional interaction needed. • Connecting External Content (e.g., local files or remote Web pages) • Focus / Filter: deliberately narrowing down visibility to the essential • Integration of Detail and Context through smooth and steady zooming, overview functions, levels of detail. • Interoperability with other related tools We do not consider the use of formal semantics a requirement for all visual knowledge mapping applications. However if formal modelling is supported, then, as Shipman [15] argues, the system should allow incremental formalization and structure evolution rather than requiring the user to make formal decisions where she does not want to.
3.
• easy hierarchical overall topology (like in mind-maps and as demanded by the requirement of abstraction);
THE IMAPPING DESIGN
In the design of the iMapping approach and software tool, we aimed at fulfilling to the greatest possible extent the requirements listed above (Sec. 2.1) and simultaneously combining the core advantages of the classical mapping techniques (described in Sec. 2). These are in particular: • visual knowledge representations with structural analogy to content (inherent in any of the mentioned approaches);
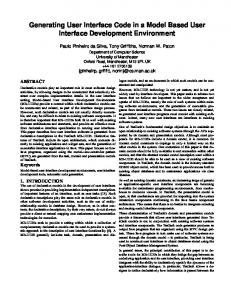
To be more concrete, here are the basic functionalities of iMapping: We began with the requirement of free placing. Like in spatial hypertext, items can be freely created at or moved to any position in the map. An iMap can be seen as a virtually infinite pin board. Usually (e.g., for personal note-taking or idea management), these items will be short text passages. The size can vary from just a keyword to a short note or whole paragraphs. The current CDS-based implementation also permits the use of rich text marked up by using a Wiki syntax (c. f. Section 4). Creating and adding content to an iMap is done by clicking anywhere in the map and typing some text. It is always possible to add informal text items. Although allowing for semantic knowledge management, it has been a fundamental design decision to never force the user to specify any semantics. Content can later be refined and formalized incrementally. A basic hierarchical structure is represented by visual inclusion: nested items are shown inside one another (see Fig. 1). Compared to a classical tree view like it is used, e.g., in Mind-Maps, this has the following benefits: (a) It leaves more freedom to place items according to gestalt principles [18] (e.g., grouping). (b) Node-and-link representations (like in classical concept maps and many other visual languages) are still possible without visually interfering with connecting lines used for the hierarchical structure. (c) The layout principle stays the same on all levels of the hierarchy (in concentric trees like Mind-Maps, all sub-branches point in one direction – c.f. Fig. 2). Like that, each item and each part of the map can be treated like a self-contained sub-map which largely helps clustering and modularization. (d) Nesting by inclusion (which is also widespread, e.g., in the use of parentheses, Venn diagrams, tree-maps), is closer to natural orientation where details are parts of their surrounding. In real life, when we want to see the big picture, we take a step back to see the surrounding context of something. Of course, this kind of nesting is not new in itself. However, traditional, paper-and-pencil based mapping techniques can not cover many levels of hierarchy like this. But computerbased mapping approaches allow virtually infinite depths of nesting. In Zooming User Interfaces (ZUI) like iMapping, transitions between levels of hierarchy are made with a smooth zooming function that allows users to swiftly change perspective from overview to any detail or back. This opens
Figure 1: Screen shot with part of an iMap (about iMapping). Only links from and to one item are visible. up a virtually infinite amount of space for iMaps to grow over time, e.g. when used as personal knowledge repositories. Re-using existing named items in other contexts can be done in a copy-and-paste manner or just by re-using their name in a new context. The user will be prompted to decide whether she wishes to create a logically separate item or reuse the existing one which would then have multiple visual instances. These “equivalent items” are represented by the same logical item in the CDS data model. This is adequate if a logical entity is relevant in different contexts like, e.g., one and the same person can occur in an sub-map of friends in a private context and also in an sub-map of co-workers in a work related context. Levels of detail: Some information objects – especially text – are rather hard to recognize when they are scaled down to thumbnail size. So, composite items have two possible states: open and closed (or expanded and collapsed). Switching between these states is done either manually per mouse click, or can take place automatically, depending on how large the object is displayed. This method is also sometimes referred to as “semantic zooming”. A longer textitem can be represented, e. g., by a keyword in collapsed state and with its full content in expanded mode. A more structured article shows from a distance only its title, when zoomed larger also some additional information like authors and date, then the table of contents and when zoomed to reasonable size, fades over to the full content. Vice versa, the two presentation modes also serve the purpose of reducing visual clutter and saving screen space: Items containing many children items can be collapsed such that the huge “belly” containing the children is not visible. This also accounts for Shneiderman’s idea of showing details only on demand. For establishing link structures, we distinguish several dif-
ferent ways of interrelating items which can be used in an iMap: 1. implicit linking: Following the principle of Spatial Hypertext, items can be loosely placed in spatial relations to one another without explicitly linking them at all. As described [17] and refined [10] by Frank Shipman, these spatial relations can be parsed to extract implicit relations, like sequence, grouping or hierarchy. 2. explicit linking on an item level (stating a relation between two objects); each of these can be mere navigational links or carry formal semantics if specified; in particular, we can distinguish four kinds of links and ways of establishing them: (a) labeled links: If no pre-existing relation type is suitable, the user can always just enter the full label of the link to be displayed, e.g., along the arrow. By that, in the back-end a new relation type with that name is automatically created; (b) unlabeled links: Links do not have to be labeled at all; (c) relating items by short semantic statements with the QuiKey tool mentioned below in Section 3.1: When relating two items, the user gets a choice of existing relation types selectable by an incremental text search over their names, supporting reuse of existing relation types and avoiding misspellings; (d) hyperlinks: Links do not have to be drawn as arrows; hyperlinks go from within the text content of an item to any other item. In classic graph-based approaches, nodes usually have to be arranged in a layout that minimizes edge-crossings in
order to reduce visual complexity. But even then, maps with large amounts of nodes and links often suffer from tangled links (aka “spaghetti syndrome”). To avoid that, in item’slinks are only shown on demand. Like that, the links of current interest are more salient and easier to visually integrate with the nodes they connect. Depending on user settings, links can be made permanent or, for instance, only become visible when the item is hovered over or selected (see Fig. 1). While iMaps can be freely navigated by panning (scrolling) and zooming like it is known, e.g., from Google maps, our user tests have shown that users much prefer navigation guided by content structure like directly zooming to specific items by point-and-click or following links. Additional to that, a search function lets users jump to any item directly. However, any transition to another place in the iMap is carried out by smooth panning and zooming to maintain a sense of spatial orientation while moving through the map.
In order to be able to handle extremely large maps, we prepared to use scene-graph pruning and pre-loading, so only the currently viewed part of the map and those parts directly linked to it would be loaded in memory. However, in favor of getting the more basic core features mature enough for user testing, we put the goal of infinite scalability behind in our development agenda. So, in the current implementation the whole content of the map is loaded into main memory thus theoretically limiting its size. Other limitations of the current iMapping implementation that are subject to ongoing and future work include the following: Currently, there are only text-items. In the future, it should be possible to drag external content into iMaps, such as pictures, documents and web pages. Also, currently iMapping does not use a spatial parser to extract implicit structures, like sequence and proximity. The only spatial configuration that is structurally interpreted is inclusion through nesting.
3.1
4.2
QuiKey
iMapping focuses on overview and intuitive use through a visual approach. However it can also be a burden when every item needs to be deliberately positioned and when items need to be located before they can be edited or referred to. Hence, it is desirable to complement such a visual tool by techniques that provide map-independent access to the same structured information. Just like envisioned by Uffe Wiil [30], iMapping uses a semantic back-end (CDS – explained later in Section 4.2) that can be accessed during runtime by other CDS tools. One such tool that is specifically designed to fill the above mentioned gap QuiKey, a kind of smart semantic command-line that focuses on highest interactionefficiency to browse, query and author semantic knowledge bases in a step-by-step manner. It combines ideas of simple interaction techniques like auto-completion, command interpreters and faceted browsing to form a generic, extensible user interface for graph structured knowledge bases. Among other things, QuiKey allows to jump to any item in an iMap with just a few keystrokes through a incremental search function. QuiKey is explained in more detail in [12]; for further information, see http://quikey.info/.
4.
Content Datamodel: CDS. “Conceptual Data Structures” [29] is a light-weight top-level ontology, providing relations that naturally occur in common knowledge artifacts designed by humans who express their knowledge and structure their information spaces. It is designed to bridge the gap between unstructured content like informal notes and formal semantics like ontologies by allowing the use of vague semantics and by subsuming arbitrary relation types under more general ones. By that it is suitable for representing knowledge in various degrees of formalization in a uniform fashion, allowing gradual elaboration. CDS serves several purposes here: 1. CDS is a flexible semantic data model providing a set of crucial structural primitives that can be extended by the user. The core top-level relations in CDS are: order (before, after, etc.); hierarchy (corresponding to item nesting in iMapping and subsuming semantic relations like is a and part of ); linking (subsuming hyperlinks as well as any other freely specified relation carrying formal semantics or not); and finally annotation (subsuming free-form notes as well as tagging and categorization).
IMPLEMENTATION
All implementations of iMapping so far are open source and available online 5 .
4.1
GUI
Several rounds of prototyping have been carried out in the Semantic Desktop project Nepomuk, ranging from paper and video prototypes to Flash-and Java-based ones. Our current implementation is written in Java and based on the zooming user interface framework Piccolo2D6 that provides a 2D scene-graph. Although our current implementation covers the basic functionality, is steadily growing and is seeing its first tentative users, it is still a research prototype and forgoes some costly features in favor of bringing the basic iMapping principles to a level of usability where they can be evaluated and started to be used.
2. The java-based CDS-API serves as a back-end for both iMapping and QuiKey, providing basic querying and reasoning functionality. 3. CDS supports interoperability, as the data can be directly accessed and modified by other CDS based tools like QuiKey or the browser-based CDS tool HKW7 or can be exported to other formats like plain RDF through generic CDS converters. For more information about CDS, see [29].
5
http://svn.imapping.info/ 6 http://piccolo2d.org/
Back End
All data is stored in semantically defined formats. For the actual content and its structure (nesting and interrelations between items), we use “Conceptual Data Structures” (CDS). For the merely visual metadata (positions, sizes expansion status et c.) we use our own RDF model. Both technologies are described below.
7
http://semanticweb.org/wiki/HKW
Visual Data Model. All visual metadata that does not represent the explicit content structure and would not make sense to share with other CDS tools (unless aware of iMapping), are stored separately in RDF format8 . To generate a Java API from this semantic data model and to read and write the RDF data during runtime, we use the semweb4j9 suite.
5.
EVALUATION
During the implementation process, we have repeatedly used formative evaluation [26] to guide our design decisions. Of course, initially there were many interaction details criticized, of which most have been addressed by now. However some are simply too much implementation effort for a research prototype. With the current prototype, we carried out a more comprehensive comparative evaluation study to specifically test the suitability of the nesting and zooming approach for personal knowledge management tasks on a larger scale, because this seems to be the biggest difference to the classical approaches discussed in Section 2. For that purpose, we compared the iMapping prototype with MindManager 7, the most wide-spread state-of-the-art Mind-Mapping application.
5.1
Method
In order to reduce the necessary time, we presented test users with pre-filled maps in both applications: A small biological taxonomy. Both maps contained the same content in the same structure – once as a classical Mind-Map, once as a nested iMap (see Fig. 2 and 3). In order not to be unfair to the MindManager side, we chose a limited map size of only 100 nodes that was still easily manageable in MindManager and a limited number of 8 cross-links to avoid unfair visual complexity in the mind-map paradigm that is not designed for highly interrelated structures. Each tester went through the following process: 1. Short introduction to the first tool: basic functionalities and interactions needed for the tasks. Testers were asked to try out the interactions and explore the map and the tool until they feel confident in using it. 2. Testers were asked to carry out a set of tasks. The time taken for each task was measured for comparison. The tasks were (a) adding certain new items to specific places in the structure (b) rearranging items in the hierarchy (c) interlinking existing items (d) finding remote items by mere visual search and reading out all their connections 3. In the end, without being able to look at the map, subjects where asked a question like “How many categories of plants were there in the map, and which ones were they?”. We recorded the percentage of right answers. 4. Introduction to the second tool. 5. Second set of tasks. 8 defined at http://dev.nepomuk.semanticdesktop.org/ repos/trunk/java/org.semanticdesktop.nepomuk.comp. imapping/info.imapping.store/src/main/resources/ imapping.n3 9 http://semweb4j.org/
Figure 2: Part of the mind-map containing a small biological taxonomy in MindManager used for evaluation (in German). 6. After that, testers were asked for their spontaneous impressions as well as for explicit ratings of the tools in several aspects on a scale from 1 to 5 (German school grades). Although structurally equivalent, the two sets of tasks differed slightly to avoid content-related learning effects. To also avoid effects of sequence, the order of the tools was balanced out, so each of them came fist for every second tester. To avoid cross-over effects of tasks with tools, the pairing of task sets with tools was also balanced out. The sample of testers consisted of 12 rather heterogenous individuals (6 male and 6 female), aged 23 – 64. Their primary occupations were: painter, journalist, interactive media engineer, photo model, students (English and biology, computer science, psychology, economical engineering), PhD students (health-care, economics, logistics, semantic web). The average time each user needed for the different kinds of tasks and the ratings given by the users were compared between the two tools and tested for statistical significance with a dependent t-test for paired samples.
5.2
Results
There were no effects of gender or age on any of the measures and there was no statistically significant difference in the interaction times measured. However, as table 1 shows, there was a clear tendency of all editing tasks (adding, rearranging and interlinking of content) being carried out slightly faster in the iMapping application. This could be explained by users’ comments that in the iMap, the topology was clearer and easier to grasp, which is also reflected in the ratings (see table 2).
Figure 3: Part of the iMap used for evaluation containing the same taxonomy (also German). When people were challenged to find information about an item outside their current view, this was especially hard because these items were not where most users expected them. And since they were asked not to use the search function, they had to visually search for it because we wanted to test the visual concept. In the iMap, it took some testers over a minute to spot the target item, resulting an a longer average search time for iMapping. This can be explained by the fact that with the given size of the two maps, in MindManager, which by default does not decrease font size for items deep down the hierarchy, there was a zooming level, where the whole map was still readable with very little scrolling needed. This made it easier to overlook all the content in the mind-map, while in the iMap, deeply nested items were too small to read from an overview perspective. We did not use larger maps for comparison in order to remain fair on the side of MindManager, which is not designed for very large maps that vastly exceed the size of one screen. When used with larger maps, the mind-map should become harder to overview, while in the iMap it should not get worse, since deeper hierarchies would be hidden from the overview in the tiny areas and thus not increase visual complexity for a given zoom-level. While this claim remains to be proven by further investigation, this kind of visual search can be avoided in real usage, since QuiKey offers an efficient search functionality, that allows to find any item fast without scanning the map. While not systematically tested in this study, those users that asked for a search function were presented with QuiKey’s basic search function and uniformly appeared very satisfied by it. When asked to remember the number and names of cer-
tain items (how many categories of plants and categories of vertebrates there were in the map), recall was nearly twice as good from the iMap. This is probably due to the more characteristic layout allowed by iMapping compared to MindManager, where all sibling items appear as a vertical list. This would also explain why the difference in remembering what these actual categories were was actually much smaller. The time until users said they were familiar enough with the tools and the content to begin with the tasks was shorter for MindManager. It could be argued that this longer practice time accounts for the higher efficiency in certain tasks and even through a mere exposure effect for the better ratings. However – although we avoided heavy MindManager users – 75% of the testers had used MindManager or similar tools before, so the overall exposure to mind-mapping applications and even MindManager itself was higher than for iMapping in most cases. Several testers even explicitly stated that although they prefer the iMapping concept, using the mind-map was easier for them because it was more familiar, and that they expect that, after getting used to it, iMapping would be more efficient for them than mind mapping. The exact mean times and percentages in comparison can bee seen in table 1. The average subjective ratings that were given as German school grades for both tools are listed in table 2. iMapping was rated better in every surveyed aspect and almost one full grade better in average. Most of these findings were statistically significant – in particular: overview and aesthetics were rated better in iMapping, which was also perceived to be more suitable for note taking and personal knowledge
practice time adding new text items rearranging items in hierarchy drawing links visually finding items and reading out their links remembering number of certain items without looking at the map remembering names of these items without looking at the map
Mind Manager 5,8 min 28,0 sec 25,5 sec 27,4 sec 25,9 sec 33,3% 30,8%
iMapping 8,6 min 23,6 sec 21,8 sec 25,7 sec 33,0 sec 62,5% 37,1%
difference 2,8 min -4,4 sec -3,7 sec -1,7 sec 7,1 sec 29,2% 6,3%
Table 1: Mean times and percentages for groups of tasks in comparison (rounded values) – None of them are significant at the 5% level. management in general. Especially in the overall rating, iMapping was rated ‘good’ in average as opposed to only ‘satisfactory’ MindManager. The good rating for overview is also backed by many spontaneous comments made during testing, in the direction of iMapping providing an easier way to get an overview over especially the coarse structure – through the general approach of nested items, the possibility to arrange them freely and through the facility to zoom all the way out and back in a gain with only two keystrokes. The good rating for aesthetics came somewhat as a surprise, since three of the female testers had vehemently complained about the lack of color in the predominantly grey iMapping prototype. But even so, the current visual design of the iMapping application seems to be quite well-received. We proudly note that the best rating and highest advantage has been given for the aspect suitability personal knowledge management in general. However this is not surprising, since MindManager is not designed for very large maps whereas it was a core requirement for iMapping to be able to scale up to extremely large maps as they can evolve over years of personal knowledge management. All in all we are satisfied with the result that iMapping is in objective measures of time needed for interaction for typical tasks comparable and in subjective measures even superior to MindManager, which can be regarded as state of the art, has millions of users and is on the market since 1994. Since the intended usage scenarios for iMapping exceed those overlapping with MindManager, some hypothesized advantages could not be tested in this setting and are subject to ongoing investigation. Namely: Long-term use for personal knowledge management, the use of much larger maps with thousands of items, the use of QuiKey and using semantic links and queries.
6.
DISCUSSION
6.1
Similar Tools
There is a huge variety of personal knowledge management tools – both research prototypes and industrial ones and they are way too many to be listed here. A comprehensive overview over such tools and their history can be found in [7]. The following few are some of the most closely related to iMapping:
Visual Knowledge Builder. Frank Shipman’s VKB[28] is a free research tool implementing the pure Spatial Hypertext approach. It differs from iMapping in several respects – most
notably in that iMapping does also feature explicit visible links between items and a zooming facility to ease nested navigation.
Tinderbox. by Mark Bernstein[4] is a commercial tool and probably the most widely used spatial hypertext editor. It is a mature tool rich in useful features and it is the closest to iMapping. While it seems to be mainly targeted at supporting authors’ writing processes, it is also being used for personal knowledge management. Its structural approach is in many aspects comparable to iMapping – e. g. it is mainly based on freely placeable text-items that can be interlinked and nested into each other and that can have user-defined types of properties. However, in Tinderbox, the focus is on one hierarchy level at a time. Nested items are regarded rather as separate sub-maps that need to be expanded one at a time. Also the intended way of use is to keep separate files for separate projects. This differs from the iMapping vision, which is targeted to support a continuously growing personal knowledge repository where everything can be semantically linked to everything else, that is represented on one infinite canvas and where several levels of hierarchy are seen simultaneously and transitioned fluently. Whether users actually benefit from this is being investigated in ongoing user studies.
Popcorn. [6] is an experimental personal knowledge base tool that combines the concept mapping approach with the principle of transclusion [20] and is in some points quite similar to iMapping. However it does not use a zooming approach to visually bind single sub-maps together and it does not use semantic technologies.
6.2
Summary
Semantic knowledge management technologies might in the future be able to significantly increase interoperability between applications even across context boundaries and they might leverage the creative and productive power of knowledge workers. However, if knowledge management does not start at the personal level, and starts with providing immediate benefit to the individual knowledge worker, it is questionable whether semantic knowledge management systems will ever spread very far. Focusing on user interaction and cognitive ergonomics is obviously an important issue there, especially because in knowledge-intensive tasks, a user can barely afford to sacrifice much of his limited cognitive capacity [19] to dealing with the tool instead of dealing with the content itself. iMapping is a zooming based visual knowledge mapping approach presented along with an implemented prototype
navigation overview structure / interrelations aesthetics look and feel suitability for brainstorming suitability for note-taking suitability for personal KM overall rating average
Mind Manager 2.4 3.0 2.7 3.3 2.5 2.5 3.0 3.3 3.0 2.9
iMapping 2.1 1.9 2.1 2.2 2.0 2.0 1.9 2.0 2.0 2.0
difference 0.3 1.1∗∗ 0.6 1.1∗ 0.5 0.5 1.1∗∗∗ 1.3∗∗∗ 1.0∗∗∗ 0.9∗∗∗
sig. (p) .275 .003 .270 .038 .065 .137 .001 .000 .000 .001
Table 2: Mean ratings given as German school grades for both tools: iMapping is rated better en every category surveyed (1=“very good”, 2=“good”, 3=“satisfactory”, 4=“sufficient”, 5=“insufficient”). which is unprecedented in respect of combining a set of functionalities that have so far not been covered by any other technique or tool. These are in particular: (i) visual knowledge representations with structural analogy to content, (ii) easy hierarchical overall topology, (iii) providing overview by integrating context and detail through zooming, (iv) facility for graph-based relation mapping, (v) allowing constructive ambiguity, (vi) support for formal semantic statements and (vii) the ability to handle very large maps. iMapping-based user interfaces could be a step forward to make highly structured knowledge management in different levels of formalization easier and more intuitive. Especially for large knowledge repositories with highly interlinked information items of different levels of formalization, iMapping-based user interfaces can make knowledge management more intuitive, on one hand, and more powerful, on the other hand, because it provides a medium that fosters the use of visual orientation in a flexible and easy way and yet supports more structured knowledge modeling in just the desired degree of formalization.
6.3
Outlook
A long-term field study is currently being carried out to evaluate the overall usability and usefulness of the current iMapping tool in users’ everyday work environments. Statistical analysis of detailed interaction logs and model parameters as well as qualitative interviews are expected to give deeper insight in the actual use of distinct features and the associated problems. Apart from that, we plan on addressing the following areas in future research: An unobtrusive annotation assistant that proposes incremental formalizations. Such suggestions could come from spatial parsing[17] or could be guessed from pre-existing semantic information – e.g., when an item representing a person is dragged into an item representing an event, probable annotations would be ‘participant of’ or ‘organizer of’. Another field of work is spatial search results where result sets from either keyword search or semantic queries are shown in their spatial distribution. Spatial filters could limit the search to certain areas of a larger map. Query items (like so-called “agents” in Tinderbox) are be persistent semantic queries that automatically update their search results and that can be placed anywhere in the map like usual items. Depending on the structure of the underlying query, such query items could even be used as annotation devices: When
an item is dragged into or out of the result set, the corresponding semantic properties could be set accordingly. While we continue improving our first iMapping tool, we hope the general approach will find more widespread application. Its flexible, zooming-based approach, e.g., also makes iMapping a candidate for mobile use on rather small displays which – as the iPhone has shown – is a popular way of dealing with small screen space on mobile devices. For more information on iMapping and to download the latest implementation, please check http://imapping.info/.
Acknowledgements Partial support provided by the European Commission in the Projects NEPOMUK (IST-FP6-027705) and MATURE (IST-FP7-216356).
7.
REFERENCES
[1] B. B. Bederson, J. Grosjean, and J. Meyer. Toolkit design for interactive structured graphics. IEEE Trans. Softw. Eng., 30(8):535–546, 2004. [2] B. B. Bederson, J. D. Hollan, J. Perlin, K. Meyer, D. Bacon, and G. Furnas. Pad++: a zoomable graphical scetchpad for exploring alternate interface physics. Journal of Visual Languages in Computing, 7(1):3–31, 1996. [3] B. B. Bederson, J. D. Hollan, J. Stewart, D. Rogers, and D. Vick. A zooming web browser. In Human Factors and Web Development, Second Edition. LEA, Inc., 2002. [4] M. Bernstein. Collage, composites, construction. In Hypertext, pages 122–123. ACM, 2003. [5] T. Buzan and B. Buzan. The Mind Map Book: How to Use Radiant Thinking to Maximize Your Brain’s Untapped Potential. Plume, 1996. [6] S. Davies, S. Allen, J. Raphaelson, E. Meng, J. Engleman, R. King, and C. Lewis. Popcorn: the personal knowledge base. In DIS ’06: Proceedings of the 6th conference on Designing Interactive systems, pages 150–159, New York, NY, USA, 2006. ACM. [7] S. Davies, J. Velez-Morales, and R. King. Building the memex sixty years later: trends and directions in personal knowledge bases. Technical report, University of Colorado, 2005. Available at: http://www.cs.colorado.edu/department/ publications/reports/docs/CU-CS-997-05.pdf.
[8] D. M. Edwards and L. Hardman. Lost in hyperspace: cognitive mapping and navigation in a hypertext environment. In Hypertext: theory into practice, pages 90–105. Intellect Books, Exeter, UK, UK, 1999. [9] M. Eppler and R. Burkhard. Knowledge visualization. Technical report, http://www.netacademy.com, 2004. [10] L. Francisco-Revilla and F. Shipman. Parsing and interpreting ambiguous structures in spatial hypermedia. In HYPERTEXT ’05: Proceedings of the sixteenth ACM conference on Hypertext and hypermedia, pages 107–116, New York, NY, USA, 2005. ACM. [11] H. Haller. Mappingverfahren zur Wissensorganisation, 2003. http://www.knowledgeboard.com/. Last access: 2010-02-10. In German. [12] H. Haller. Quikey. In S. Bloehdorn, M. Grobelnik, P. Mika, and T. T. Duc, editors, Proceedings of the Workshop on Semantic Search (SemSearch 2008) at the 5th European Semantic Web Conference (ESWC 2008), volume 334, pages 74–78. CEUR-WS, JUN 2008. [13] H. Haller and A. Abecker. Requirements for Diagrammatic Knowledge Mapping Techniques. In Conference Proceedings of I-KNOW’09 and I-SEMANTICS’09, 2009. Online Proceedings, URL: http://i-know.tugraz.at/. Last access: 2010-02-10. [14] D. Huynh, D. R. Karger, D. Quan, and V. Sinha. Haystack: a platform for creating, organizing and visualizing semistructured information. In IUI ’03: Proceedings of the 8th international conference on Intelligent user interfaces, pages 323–323, New York, NY, USA, 2003. ACM. [15] F. M. S. III and C. C. Marshall. Formality considered harmful: Experiences, emerging themes, and directions on the use of formal representations in interactive systems. In Computer Supported Cooperative Work, volume 8, pages 333–352. Kluwer Academic Publishers, 1999. [16] D. Kolb. Places and spaces: Adjacency effects, 2001. Position Paper presented on Spatial Hypertext Workshop of the ACM Conference on Hypertext and Hypermedia, Aarhus, Denmark. [17] C. C. Marshall and F. M. Shipman, III. Searching for the missing link: discovering implicit structure in spatial hypertext. In HYPERTEXT ’93: Proceedings of the fifth ACM conference on Hypertext, pages 217–230, New York, NY, USA, 1993. ACM.
[18] W. Metzger. Gesetze des Sehens. Kramer, Frankfurt, 1953. In German. [19] G. A. Miller. The magical number seven, plus or minus two: Some limits on our capacity for processing information. Psychological Review, 63:81–97, 1956. [20] T. H. Nelson. The heart of connection: hypermedia unified by transclusion. Commun. ACM, 38(8):31–33, 1995. [21] J. D. Novak and D. B. Gowin. Learning how to learn. Cambridge University Press, New York, 1984. [22] K. Perlin and D. Fox. Pad: An alternative approach to the computer interface. In Proceedings of the 20th Annual Conference on Computer Graphics and Interactive Techniques, pages 57–64. ACM Press, 1993. [23] J. Richter, M. V¨ olkel, and H. Haller. Deepamehta – a semantic desktop. In S. Decker, J. Park, D. Quan, and L. Sauermann, editors, Proceedings of the 1st Workshop on The Semantic Desktop. 4th International Semantic Web Conference (Galway, Ireland), volume 175. CEUR-WS, NOV 2005. [24] L. Sauermann, M. Kiesel, K. Schumacher, and A. Bernardi. Semantic Desktop. In A. Blumauer and T. Pellegrini, editors, Social Semantic Web, pages 337–362. Springer-Verlag, X.media.press, 2009. [25] W. Schnotz and M. Bannert. Construction and interference in learning from multiple representation. Learning and Instruction, 13:141–156, 2003. [26] M. Scriven. Prose and cons about goal-free evaluation. American Journal of Evaluation, 1:55–62, 1991. [27] F. Shipman and C. Marshall. Spatial hypertext: An alternative to navigational and semantic links. ACM Computing Surveys, 31(4), 1999. [28] F. Shipman, J. M. Moore, P. Maloor, H. Hsieh, and R. Akkapeddi. Semantics happen: knowledge building in spatial hypertext. In HYPERTEXT ’02: Proceedings of the thirteenth ACM conference on Hypertext and hypermedia, pages 25–34, New York, NY, USA, 2002. ACM. [29] M. V¨ olkel and H. Haller. Conceptual data structures for personal knowledge management. Online Information Review, 33(2):298–315, 2009. [30] U. K. Wiil. Hypermedia technology for knowledge workers: a vision of the future. In HYPERTEXT ’05: Proceedings of the sixteenth ACM conference on Hypertext and hypermedia, pages 4–6, New York, NY, USA, 2005. ACM.