Immersive Network Monitoring Mike Fisk∗ , Steven A. Smith† , Paul M. Weber† , Satyam Kothapally‡ , and Thomas P. Caudell‡ ∗ Computing,
Communications, and Networking Division Los Alamos National Laboratory Los Alamos, New Mexico 87545 Email:
[email protected] † Decision
Applications Division Los Alamos National Laboratory Los Alamos, New Mexico 87545 ‡ Department
of Electrical and Computer Engineering University of New Mexico Albuquerque, New Mexico 87131
Abstract— In this paper we present our immersive network monitoring system that is used for real-time and retrospective analysis of network traffic. Our 3-D representations are designed from the perspective of monitoring traffic at an administrative boundary between the Internet and an internal network. In our virtual environment, a physical boundary and defended territory serve as a familiar visual metaphor for users. The user is provided with multiple ways of exploring the environment and interrogating visual objects for additional information and synchronizing the environment with external analysis tools. We have used this system on complete data from multiple sites for purposes of situational awareness and detecting and analyzing traffic patterns for anomalous behavior.
I. I NTRODUCTION In this paper we describe an immersive network monitoring system which provides an immersive environment for situational awareness, exploration of large archives and large networks with a high flux of traffic, and tools for analysis such as data drill-down and association. The system can present traffic in near real-time or can move back and forth in archived data at any time scale. The use of an animated, immersive, 3dimensional environment with physical metaphors allows us to display large volumes of data from disparate sources as well as data with high degrees of dimensionality. The system provides visual representations that allow analysts, operators, and researchers to explore and discuss network issues in a rich and intuitive environment. We use realworld metaphors to lay out and encode abstract information in an attempt to more fully engage the human perceptual and cognitive systems. Doing so leverages the instinctual and learned knowledge that animals, and humans in particular, use to function in everyday life. Our environment is designed primarily for everyday use by network security analysts, but investigations of other issues in network monitoring, such as network utilization, health, and performance characteristics, can also benefit from our infrastructure, visual metaphors, and experience. This system
was designed to complement existing intrusion detection systems used by network operators. In particular, the goal is to present human operators with information that enables them to perform their own pattern recognition and anomaly detection of network events. The primary goal is not to observe wellknown attacks that can be detected automatically, but to enable detection of uncharacterized attacks. The human perceptual and cognitive system comprise an incredibly flexible pattern recognition system which can recognize existing patterns and discover new patterns. Most successful, algorithmic pattern matching systems are generally limited to recognizing patterns whose general form has been anticipated by the developers of the algorithms. Humans, as creatures who have evolved in a highly complex environment under the strict laws of natural selection, are specifically good at recognizing novel patterns in their environment which may either represent threats or opportunities. This system consists of several components: a real-time data gathering module; a fast access database system; a highly efficient data filtering and processing pipeline; a time management system; a system for mapping the data domain into a metaphorical representational domain; a system for interacting with the metaphorical world to produce queries into the database system and trigger the generation of interactive web-based reports supporting further drill-down; and a physical interface environment to provide the right level of immersion for the task including a large field of view, real-time locomotion and animation, joystick interaction, and ambient and spatialized audio. Our work has four significant contributions. First, it is the first case we are aware of in which an immersive environment has been used for real-time network monitoring or anomaly detection. Second, we have developed multiple, complementary visual representations for address space and network traffic at an administrative boundary in a network. Third, we have provided users of our environment with three different ways to
Fig. 1.
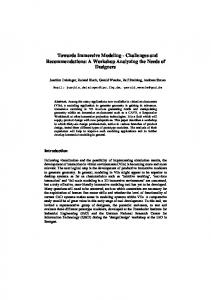
Multiple Scans Affecting the Defended Territory
Fig. 2.
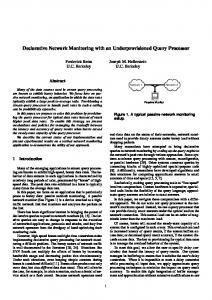
A 2-D Projection of the 3-D Space Shield
interrogate visual objects, including the ability to synchronize the environment with existing, external applications. Finally, we share the lessons learned thus far from exposing this system to security analysts in a problem solving environment. A. Paper Organization After explaining our motivations for this work in Section II, we present our data-reduction strategy in Section III. We describe the visual metaphor of our environment in Section IV and present the details of its composition in Section V. In Section VI, we discuss how we use the system. Section VII reviews the related work, and Section VIII presents our experiences with this system and conclusions from using it. Future work is described in Section IX. II. W HY 3-D V ISUALIZATION ? Graphs and charts such as logarithmic plots and strip charts of traffic statistics have previously been put to good use in keeping track of trends and understanding the general character of network traffic. Only limited progress has been made in providing visual depictions of the complex collections of information issuing from systems monitoring network traffic. Various algorithmic techniques have been used to reduce the amount of information to be reviewed. These techniques primarily fall into the categories of statistical sampling and
integration. A global understanding of the data is thereby offered at the expense of the detail. In our own experience, the analysis of network intrusions and anomalies is dominated by a series of activities that each reveal a single additional facet of the event. We can judge implications of an event only after a large number of these facets have been learned. Our goal with this system is to prefetch many of these facets into the visual environment. This should reduce the learning curve of information that an analyst must know in advance, as well as reducing the number of steps that must be taken to put an event in context. We have chosen to use the richest visualization environment available to us today. We are not only using three dimensional layouts of the data but we are embedding them in a fully interactive, metaphorical world which evolves over time. The amount of conceptual real estate available for encoding the information increases multi-fold with the addition of the third spatial dimension, a metaphorical encoding, and time evolution of the system. While there is also a risk of ambiguity in projecting this multi-dimensional environment, we believe the gains exceed the risks by offering a much flatter learning curve, a more automatic, intuitive understanding, and a much more synthetic (as opposed to analytic) view of the traffic and its interpretation. Immersive, interactive, metaphorical environments offer not only a great increase in richness but a closer, more intuitive and personal relationship to the data. We are adding basic sound encoding of data as well to broaden and reinforce the perceptual experience. Figures 1 and 2 demonstrate the difference between 3-D and 2-D views of the same representation. Figure 2 shows the data from a top-down view as if the connections were projected onto a 2-D surface. In contrast, Figure 1 shows the same data with 3-D perspective. Moving through this 3-D space provides additional cues such as the ability to recover structure from motion as a result of motion parallax [1]. Finally, the use of an immersive environment allows the user to explore different parts of the space and affect the level of detail, from different perspectives. III. DATA R EDUCTION S TRATEGY To achieve our goal of presenting the user with a complete picture of what is happening on the network, we must maintain a balance between presenting all available information and creating confusing amounts of clutter. Our use of an immersive environment allows us to present more information, without overwhelming the user, than we normally could. We use this capability to avoid making automated, error-prone filtering decisions like traditional intrusion detection systems. Instead we focus on data reduction strategies and representations that include every event in the information being displayed and depend on the ability of the human visual and cognitive system do do some of the aggregation and filtering. Our goal is a visual fusion of related elements. Given raw packets as a source of data, we have chosen the following feature extraction strategy. Individual packets are grouped into bidirectional network flows analogous to
Fig. 3.
Multiple Representations Running in Flatland
TCP connections. For each flow, we compute the start and end times, the endpoint IP addresses, the endpoint TCP or UDP ports, where applicable, and the total number of bytes and packets in each direction. While this reduction clearly discards large amounts of information, it leverages the ‘hourglass’ architecture of Internet protocols to analyze all traffic without requiring extensive, application-specific logic in the monitoring system. We have used our visualization system with two different tools for data reduction. In both cases a flow is identified by a 5-tuple (srcip, dstip, srcport, dstport, protocol). We used an existing Los Alamos system that only monitors TCP traffic, but follows TCP connection state and produces a flow record as soon as the connection is torn down. Our second tool differs in that it monitors all forms of IP traffic, and also produces flow records in near real time. This tool uses the System for Modular Analysis and Continuous Queries [2] to examine traffic and emit flow start and end events that are buffered and sorted by time. A flow is defined purely by a sequence of packets with the same identifying 5tuple and no gaps between packets longer than some timeout value k. Because the visualization system can read data from both systems, an analyst can switch between observing the current network condition to reviewing archived data within the same environment. For real-time monitoring, a relatively short (k < 5 seconds) flow timeout value is used and the visualization environment runs an equal amount of time behind the current time. Consider the case of a flow that stops at time t0 . The monitoring system will time-out the flow and issue a stop event to the visualization environment at time t0 +k. By running k seconds behind real-time, the visualization can correctly display the stop event at time t0 . Otherwise, the duration of connections will be artificially lengthened. There is a tradeoff between reducing lag time and increasing the accuracy of connection duration measurements. However, we feel that a few seconds of lag time does not have a significant impact on the ability of a person to see and react to events.
ρmax
ρ ρmin
θ
Internal Address Space
External Address Space
Coordinates for internal IP address k1 .k2 .C.D: Radius Angle Fig. 4.
ρ = C × (ρmax − ρmin ) /255 + ρmin θ = D × 360o /255
Layout of Internal Address Space (viewed from zenith)
Data collection is typically done on a separate machine from the rendering and communicated via NFS to the rendering system. For real-time data, the visualization system continues to periodically read from the data file, even if an end-of-file is received. Thus, new data will be found when it is available. IV. V ISUAL M ETAPHOR We are currently focusing on the exploration and analysis of Internet traffic as measured at an administrative boundary, such as an enterprise firewall. Following the work of Lakoff and Johnson [3] we use the systematicity of metaphorical concepts to motivate, inform and structure the encoding of
ρmax
ρ
ρmin
φ
External Address Space
θ Internal Address Space
Coordinates for external IP address A.B.C.D: Altitude φ = A × 90o /255 Azimuth θ = B × 360o/255 Radius ρ = C × (ρmax − ρmin ) /255 + ρmin Fig. 5.
Fig. 6.
Layout of External, Untrusted, Address Space
The Shield Representation by Itself
our real-world but abstract data into a metaphorical world. We describe this world as a metaphor complex, a collection of consistent and complementary components that each support the metaphor as a whole. The specific metaphorical encoding we have developed is rooted in the primitive concept of self vs. other which relates to concepts such as attack and defend and a territory and shield. Using the concept of territory, we map the internal address space of our network into a circular region. We then map the external address space, the Internet at large, into a hemispherical region centered on this region and separated by a shield represented by a semi-transparent dome or shield as shown in Figure 6. This shield represents the administrative boundary,
firewall or DMZ of a protected network. Our first and default layout is simply one of mapping IP addresses to fixed locations in the environment. As shown in Figure 4, the third and fourth octets of our internal address space map to the ρ and θ of the polar (actually annular) coordinate system implicit in the circular defended territory. Each /24 subnet is assigned one concentric ring and the 256 sequential individual IP addresses on each subnet are distributed around each ring. The external address space is distributed similarly into a spherical coordinate system with the first three octets of the IP address mapped to φ, θ and ρ (in a range between two hemispherical shells) as seen in Figure 5. In this layout, the most significant octet of the IP address determines the altitude (φ) of the source and the next most significant octet determines the azimuth (θ). The third octet determines ρ, the distance of the host from the center of the hemisphere. Individual differences within a subnet are not distinguished in this layout. Other, more sophisticated layouts are planned which highlight different aspects of the source address such as geopolitical origin [4] or institutional affiliation and will be discussed in Section IX, Future Work, at the end of this paper. We represent each of these flows as a ray connecting the originating host to the destination host through the shield. Each ray is deflected by some angle at the shield and has internal and external segments with different directions. The portion of the ray that is outside the shield is always directed at the center of the internal territory. The portion of the ray that is inside the shield runs between that point of intersection with the shield and the location of the internal host. The result is that multiple flows from the same external source share a common ray up to the shield, but then fan-out to individual rays. While network flows form the basic level of abstraction
for data provided to the system, our visual metaphors seek to provide additional levels of abstraction. For example, the deflection of rays at the shield causes all of the traffic from the same external /24 network to share a common ray up to the shield. Thus, higher-level events, such as an aggregation of distinct flows, appear as single visual elements. In the following section, we describe in more detail the specifics of the encodings, how they are constructed, and their behaviors. V. G RAPHICAL C ONSTRUCTION The system we have implemented is an aggregation of multiple technologies. The representations shown in this paper are implemented in C++ and OpenGL. Each component of the representation runs as a dynamically loaded module in the Flatland immersive visualization environment [5]. Flatland provides functions abstractly similar to a window manager in that it handles placement of multiple visual objects in a virtual space and mediates user input to those objects and movement around the space. This section describes the Flatland components we have developed to create our immersive network monitoring environment. Our visual environment in Flatland consists of a collection of representation applications, overlaid in space and time. Each of these representations reflects a different aspect of the data that we are monitoring. Each component may accumulate its own state information as it processes data. Animation of each of the representational elements may reflect the transient data as well as derived information from the accumulated data and correlations between different sources. We can combine these component representations in arbitrary combinations based on which aspects of the data are currently being examined. We developed a data flow mapping and time management system to abstract the problems of flexibly and dynamically managing many synchronized data sources and representations. Data sources can be mapped to multiple representational parameters. Intermediate processing modules can also be added to the data flow. A central controller module manages this data flow and dynamically changes the data flow as required. We use the metaphor of a heads-up display to allow users to interact with the controller and other representation modules. Figure 7 shows the heads-up display interfacing with the controller module. In this example, the display shows both the current status and recent changes to the global time system. The heads-up display is also used to display textual information for selected visual elements. This particular interaction is described further in Section VI. Our current visual metaphor is a shield surrounding a defended territory. The territory is a central, planar area surrounded by a semi-transparent, hemispherical shield and two larger, concentric domes demarcating the boundaries of the external host space. Figure 6 shows only the representation module responsible for displaying this structure. A second representation module builds a dynamic topology on top of the internal plane. This colored topology depicts the
activity of the internal hosts. The current color and height of a particular point within the field is a decaying count of the number of sessions that have recently involved that host. The decay function smoothly raises and lowers the height. A third representation draws animated, colored rays for each flow. The color of each ray indicates what port number the originating host is using for this flow. The animation involves the ray first extruding and then traveling from originating host to destination host. The animation of the extrusion of the ray provides a secondary encoding of the duration and direction of the flow between the two hosts. In addition, extremely shortduration flows, exacerbated by accelerated time-scales, would often too brief to be visible. However, the animation has a minimum duration that allows these flows to be seen. The animation of these rays helps to reinforce an overall sense of the texture and intensity of the current traffic. Without animation, the only indicator of the busyness of the network is something more like a flicker-rate. Rays, in practice, are cones whose tip points in the direction of the flow. While a given network flow exists, rays will extrude from the originating host. Once the flow ends, the ray is completed and appears to travel toward the destination host. For flows whose duration is long enough, the tip of the ray reaches the destination before the flow ends and a continuous ray is established between origin and destination host. Rays are assigned colors based on the port used on the originating host, and ranges of port numbers. The color encoding of port ranges is chosen primarily to distinguish major common services by port grouping. A much more careful encoding is planned which should help in detailed analysis. A fourth representation module provides a reference skeleton when the dynamic, animated rays are too complex or shortlived to easily maintain the relation between the origin and destination hosts. This skeleton is built from simple white cylinders whose diameter is smaller than the rays. Thus, as rays are animated, they obscure portions of the underlying skeleton. However, the skeleton is created immediately when a flow begins. Thus, it identifies the destination before the ray animation can reach it. Because the lifetimes of the skeleton cylinders are independent of the corresponding ray lifetimes, the skeleton can be used to provide persistence that visually connects back-to-back flows involving the same hosts. The skeleton representation also places glyphs (currently simple spheres) at the origin and destination hosts and at the point where the ray will deflect through the shield. These glyphs are currently markers of the location but will be used to encode other properties of a given connection and the accumulated and statistical properties of individual hosts or host pairs. These glyphs also provide a target to select for drill-down into the databases connected to the system. Drilldown is discussed further in Section VI. Together, these four representation modules combine with data input modules, user-interface modules, and a central controller module to implement a rich graphical environment in which graphical features can be individually configured or disabled on the fly. In addition, this structure enables us to
Fig. 7.
Flatland With a Heads-up Display
easily and incrementally develop new graphical elements and experiment with them. VI. U SER E NVIRONMENT In the Intrusion Detection Lab at Los Alamos, we have a large, cylindrical quarter-section of screen displaying a fully interactive, semi-immersive, animated image of a three dimensional metaphorical environment. We run Flatland on a typical Linux workstation with a dual-headed Nvidia video card with video output provided by two low-cost DLP projectors aligned for a panoramic projection. The analysts sit at a workstation table with their own flatpanel monitors and the view on the screen in front of them feels like a window into the world in which they monitor, navigate, and interact with the metaphorical environment. The analysts can fly around in the world as if in a vessel of their own and interact with the world with a virtual beaming device. As they examine the environment, users select objects and instigate database lookups and queries. The analysts can also move forward and backward in time and can affect the rate
of time at which they are viewing archived data. For example, time compressions of up to 60:1 have been used effectively with full data sets, allowing for review of 24 hours of traffic in less than half an hour. Visual representations facilitate pattern recognition and trend analysis, but inevitably lead to specific questions about the details of an event or object. Within the environment, we use three techniques to provide this information: proximitybased level of detail exposure, a virtual heads-up display, and triggers to external applications. First, flying in close to an object causes a proximity-based increase in the level of detail. At present, this results in the IP address and port of an endpoint becoming visible. This text is two dimensional and automatically rotates to face the position of the user in the virtual environment. Second, an on-screen display representing a virtual headsup display presents additional information such as the current time in the environment, the number of active events, etc. When an object in the environment is selected or beamed,
supporting information is displayed on the heads-up display. Figure 8 shows the selection of an external host that is scanning the internal address space. Within the perimeter, all connections belonging to the selected host are shown in green. 1 The connection from the perimeter to the external host is gray. The heads-up display lists the total number of active sessions that are selected, and additional data for some sample connections. A. External Triggers Our third method of interrogation is based on triggering external applications. While the immersive environment is well suited to presenting rich data sets, it is is still useful to appeal to other existing textual and 2-D tools outside of the environment. In order to couple the immersive environment with other tools, we have extended the beaming capability so that selecting an object can cause an event external to the system. Screen real-estate on the primary display is a precious resource. In addition, the primary display is designed to be projected and have novel input devices. In contrast, most other tools are tuned for use at a typical user workstation with normal input devices and displays. As a result, we have chosen to use a second such workstation for the results of external triggers. Because most of our other tools are web-based or have web interfaces, we focused on the ability to trigger the display of a URL on the second workstation. The URL is built from the selected object’s attributes. The referenced web server can then produce arbitrary web pages that integrate existing webbased databases and tools. Figure 9 shows an example of the web interface we use to present related information about an external host. This triggering is done through the Mozilla remote control facility [6]. Netscape and Mozilla browsers register Xt callbacks with the X-Windows server. Any other authorized client of this X server can call certain browser functions. We use this capability to have the visualization application open a connection to the workstation’s X server and tell a browser on that X server to load a new URL. Because the browser is already running, the latency of this RPC is minimal. VII. R ELATED W ORK Our work complements previous visualization work done using a variety of techniques including active measurement, 2-D graph layout, 3-D information visualization, geographic layout, and glyph-based representations. An introduction to 3-D information visualization is provided in [7]. We have used the Flatland infrastructure previously to visualize simulations of the Quadrics fat-tree interconnect of large clusters [8]. Cichlid [9] is a client/server tool in which a server produces data-points and a client provides a 3-D environment for 1 A color version of this paper is available at http://public.lanl.gov/mfisk/papers/pam03.pdf
Fig. 10.
Landscape Inside the Defended Territory
viewing bar charts and graph topologies. The system can operate on real-time data and can animate graphs over time. SeeNet [10] and SeeNet3D [11] were used to study 2-D and 3-D representations based techniques such as geographic representations and helix-based graph layout. Users can interact with the representations using techniques described in [12]. These tools have been used to visually detect fraud in the telephone network [13]. Erbacher built a visual system for representing system audit log data as 2-D graphs with a suite of glyphs representing the behavior of edges and vertices [14]. Additional work was done to build a representation when fusing the logs from multiple systems in one representation [15]. Nam [16] animates packet-level events from a precomputed trace file. These trace files can be generated by the ns2 simulator or passive monitoring tools. The trace file also specifies the graph connectivity of the network topology. Nam uses traditional 2-D graph layout algorithms to render this topology on a plane. Active measurement has been used to build visual maps of the Internet [17], [18]. CAIDA has developed several tools for visualizing large-scale graphs. The Otter tool [19] provided 2-D views while the Walrus tool provides 3-D views with nonlinear magnification [18]. VIII. E XPERIENCES
AND
C ONCLUSIONS
To date, the system has been used primarily by researchers and developers to explore archived data sets as well as real time data and has been effective in discovering interesting and useful features in the traffic. It has been used in-house and live on the floor at the IEEE SC 2002 conference to monitor the normal and experimental network traffic. The use of familiar visual metaphors to represent traffic has made it possible for casual observers to see events that only skilled analysts were aware of before. This flattens the learning-curve experienced by new analysts and increases the number of people to can make meaningful observations. The metaphorical environment also provides a common reference abstraction for people of different levels of understanding and with different terminology to converse meaningfully about data and events. Even for people already familiar with the datasets, the animation over time has exposed new information that was not
Fig. 8.
Heads-up Display of a Selected Attacker
observed before. Static graphs and tables make it challenging to characterize bursty behavior that can occur on very disparate time scales. In contrast, animation over time makes it trivial to identify bursts over a wide range of times. We find ourselves frequently replaying the same data at very different speeds (60:1 speedup, for example) in order to observe timing at scales beyond our real-time cognition. The utility of such high-speed representations allow users to survey days worth of traffic in minutes. The analyst’s valuable time can be spent focusing on the interesting periods within the survey period. Earlier tests with real use of the system demonstrated the absolute necessity of drill-down capabilities. Without them, the system merely teases the user with interesting events without providing a way for the user to understand the nature and ramifications of those events. In addition, drill-down cannot be limited to a single set of information. Different users and events can cause users to want a wide variety of information from statistics that are more aggregated than the selected event (such as previous traffic from the selected host) to detailed
information about the connection or the packets that make up a connection. Thus, the utility of the system is limited not just by the visuals, but also by the back-end data storage and the ability to query it in different ways. The ‘flashy’ nature of a 3-D environment is a mixed blessing. It draws people into the problem domain and data, but can also evoke negative feelings. Perhaps due to the fact that most people are exposed to this type of visualization only at the movies or in video games, people frequently have an initial reaction that the representations are more amusing than explanatory. However, our experience is that this opinion changes once the person starts seriously analyzing the data being presented. The literature regarding graphical systems such as ours is dominated by case studies of systems as a whole rather than fundamental experiments that establish strong bases for constructing new systems. While this paper has the same deficiency, we have attempted to explain the hypotheses that motivate our approach, as well as our basis for presenting these
Fig. 9.
Web-based Drill-down of an External Host
hypotheses. More time with the system running in a production environment will provide us with additional experience. In particular, we are eager to explore the ergonomics and human-computer interface of a semi-immersive environment with group problem solving and interaction. IX. F UTURE W ORK This project is just the beginning of what we hope will prove to be the initial seed of a much more ambitious set of goals. Our plans include increasing the variety of data sources fused into this metaphorical environment, improving the user interface to enhance immersion, improving usability and flattening the learning curve, adding more perceptual cues such as spatialized audio and ambient sound, enriching the
representation to encode more aspects of the data already available and to merge it with other data sources, and implementing collaborative features from the Flatland environment to support distributed analysis between the IDS lab, analysts in their offices, and perhaps other sites. We hope that a single, integrated metaphorical environment such as this can be used to fuse disparate data sources into a single, easy to use, intuitive, common view for analysts, network managers and policy makers to share in their daily work and decision making. Currently, we are only displaying flow or session data in its rawest form. but we intend to integrate other data sources from vulnerability scans of our networks, Snort Alerts, statistical properties of the network traffic, anomalies and other features of traffic derived algorithmically, and normally unused
portions of address space. We hope that this type of system will significantly aid in supporting collaboration, allowing not only the fusion of multiple types of data but also the parallax of looking at traffic on different networks or even sites at the same time. Currently communication and collaboration between individual analysts, analysts and network managers, analysts at different sites and policy makers at all levels is difficult. Each group has their own view of the network, or their piece of the network, their own terminology and to some extent different agendas. We hope that this type of system will help to at least make explicit these differences if not help to alleviate some of them. The intrusion and anomaly detection process often begins with the review of log files and statistical summaries of those logs. Due to the diversity of innocuous behavior, and the resulting high false-positive rates in automated systems, a good deal of this work is like looking for a needle in a haystack by discarding the hay one handful at a time. We currently provide a much more efficient and intuitive mechanism for reviewing logs, but also hope to accelerate this process by providing good mechanisms for filtering out known patterns and artifacts in the data as well as new patterns as they are recognized. Similarly, we hope to provide mechanisms for capturing and playing back only the salient data in any given intrusion attempt so that it can be used to explain, communicate and train others in recognizing these particular types of attacks or exploits. ACKNOWLEDGEMENTS We thank Paul Criscuolo, Ben Uphoff, Ron Wilkins, Tony Heaton, Danny Quist, Ken Summers, Chris Kemper and others for their support and numerous discussions regarding representations and environment usability. The Flatland environment was created by Tom Caudell and numerous student contributors at the University of New Mexico. This work was supported by the U.S. Department of Energy under contract W-7405-ENG-36 with Los Alamos National Laboratory. A color copy of this paper is available at the following URL: http://public.lanl.gov/mfisk/papers/pam03.pdf
R EFERENCES [1] S. Ullman, The Interpretation of Visual Motion. The MIT Press, 1979. [2] M. Fisk and G. Varghese, “Agile and scalable analysis of network events,” in Proceedings of SIGCOMM Internet Measurement Workshop. ACM, Nov. 2002. [3] G. Lakoff and M. Johnson, Metaphors We Live By. The University of Chicago Press, 1980. [4] D. Moore, R. Periakaruppan, and J. Donohoe, “Where in the world is netgeo.caida.org?” in Proceedings of INET 2000. Internet Society, June 2000, poster. [Online]. Available: http://www.caida.org/Papers/inet netgeo.html [5] U. of New Mexico, “The homunculus project.” [6] The Mozilla Organization, “Remote control of Unix Mozilla,” 19982003, http://www.mozilla.org/unix/remote.html. [7] G. Robertson, S. Card, and J. Mackinlay, “Information visualization using 3-d interactive animation,” Communications of the ACM, vol. 36, no. 4, pp. 57–71, Apr. 1993. [8] F. J. Alexander, K. Berkbigler, G. Booker, B. Bush, K. Davis, A. Hoisie, S. Smith, T. P. Caudell, D. P. Holten, K. L. Summers, and C. Zhou, “Design and implementation of low- and medium-fidelity network simulations of a 30-teraops system,” Los Alamos National Laboratory, Tech. Rep. LA-UR-02-1930, Apr. 2001. [Online]. Available: http://public.lanl.gov/bwb/fy2002q2.pdf [9] J. Brown, A. McGregor, and H.-W. Braun, “Network performance visualization: Insight through animation.” in Proceedings of the Passive and Active Measurement Workshop, 2002. [Online]. Available: citeseer.nj.nec.com/brown00network.html [10] R. A. Becker, S. G. Eick, and A. R. Wilks, “Visualizing network data,” IEEE Transactions on Visualization and Computer Graphics, vol. 1, no. 1, pp. 16–28, 1995. [Online]. Available: citeseer.nj.nec.com/becker95visualizing.html [11] K. C. Cox, S. G. Eick, and T. He, “3D geographic network displays,” SIGMOD Record, vol. 25, no. 4, pp. 50–54, 1996. [Online]. Available: citeseer.nj.nec.com/article/cox96geographic.html [12] T. He and S. G. Eick, “Constructing interactive network visual interfaces,” Bell Labs Technical Journal, vol. 3, no. 2, pp. 47–57, Apr. 1998. [Online]. Available: citeseer.nj.nec.com/he98constructing.html [13] K. C. Cox, S. G. Eick, G. J. Wills, and R. J. Brachman, “Visual data mining: Recognizing telephone calling fraud,” J. Data Mining and Knowledge Discovery, vol. 1, no. 2, pp. 225–231, 1997. [Online]. Available: citeseer.nj.nec.com/cox97visual.html [14] R. F. Erbacher, K. L. Walker, and D. A. Frincke, “Intrusion and misuse detection in large-scale systems,” Computer Graphics and Applications, vol. 22, no. 1, pp. 38–48, Jan./Feb. 2002. [Online]. Available: http://www.cs.albany.edu/ erbacher/publications/CGAGlyphBasedIntrusionDetection.pdf [15] R. F. Erbacher, Z. Teng, and S. Pandit, “Multi-node monitoring and intrusion detection,” in Proceedings of the IASTED International Conference On Visualization, Imaging, and Image Processing, Sept. 2002, pp. 720–725. [16] D. Estrin, M. Handley, J. Heidemann, S. McCanne, Y. Xu, and H. Yu, “Network visualization with the Nam, VINT network animator,” IEEE Computer, vol. 33, no. 11, pp. 63–68, November 2000. [Online]. Available: http://www.isi.edu/ johnh/PAPERS/Estrin00b.html [17] B. Cheswick, H. Burch, and S. Branigan, “Mapping and visualizing the Internet,” in Proceedings of the USENIX Technical Conference, 2000, pp. 1–12. [Online]. Available: citeseer.nj.nec.com/cheswick00mapping.html [18] B. Huffaker, D. Plummer, D. Moore, and k claffy, “Topology discovery by active probing,” in Proceedings of 2002 Symposium on Applications and the Internet (SAINT) Workshop on Measurement Technology for Internet Applications. IEEE, Jan. 2002. [19] B. Huffaker, E. Nemeth, and k Claffy, “Otter: A general-purpose network visualization tool,” in Proceedings of INET ’99. Internet Society, June 1999.