Forests 2013, 4, 279-295; doi:10.3390/f4020279 OPEN ACCESS
forests ISSN 1999-4907 www.mdpi.com/journal/forests Article
Impact of Forest Fragmentation on Patterns of Mountain Pine Beetle-Caused Tree Mortality Christopher Bone 1,*, Joanne C. White 2, Michael A. Wulder 2, Colin Robertson 3 and Trisalyn A. Nelson 4 1 2
3
4
Department of Geography, University of Oregon, Eugene, OR 97403, USA Canadian Forest Service (Pacific Forestry Centre), Natural Resources Canada, 506 West Burnside Road, Victoria BC V8Z 1M5, Canada; E-Mails:
[email protected] (J.C.W.);
[email protected] (M.A.W.) Department of Geography & Environmental Studies, Wilfrid Laurier University, 75 University Avenue West, Waterloo ONT N2L 3C5, Canada; E-Mail:
[email protected] Spatial Pattern Analysis & Research (SPAR) Laboratory, Department of Geography, University of Victoria, P.O. Box 3060, Victoria BC V8W 3R4, Canada; E-Mail:
[email protected]
* Author to whom correspondence should be addressed; E-Mail:
[email protected]; Tel.: +1-541-346-4197; Fax: +1-541-346-2067. Received: 1 March 2013; in revised form: 10 April 2013 / Accepted: 17 April 2013 / Published: 29 April 2013
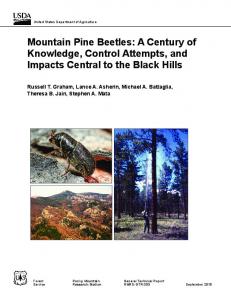
Abstract: The current outbreak of mountain pine beetle, Dendroctonus ponderosae Hopkins, has led to extensive tree mortality in British Columbia and the western United States. While the greatest impacts of the outbreak have been in British Columbia, ongoing impacts are expected as the outbreak continues to spread eastward towards Canada’s boreal and eastern pine forests. Successful mitigation of this outbreak is dependent on understanding how the beetle’s host selection behaviour is influenced by the patchwork of tree mortality across the landscape. While several studies have shown that selective mechanisms operate at the individual tree level, less attention has been given to beetles’ preference for variation in spatial forest patterns, namely forest fragmentation, and if such preference changes with changing population conditions. The objective of this study is to explore the influence of fragmentation on the location of mountain pine beetle caused mortality. Using a negative binomial regression model, we tested the significance of a fragmentation measure called the Aggregation Index for predicting beetle-caused tree mortality in the central interior of British Columbia, Canada in 2000 and 2005. The results explain that mountain pine beetle
Forests 2013, 4
280
exhibit a density-dependent dynamic behaviour related to forest patterns, with fragmented forests experiencing greater tree mortality when beetle populations are low (2000). Conversely, more contiguous forests are preferred when populations reach epidemic levels (2005). These results reinforce existing findings that bark beetles exhibit a strong host configuration preference at low population levels and that such pressures are relaxed when beetle densities are high. Keywords: mountain pine beetle; forest fragmentation; density dependent; insect outbreak
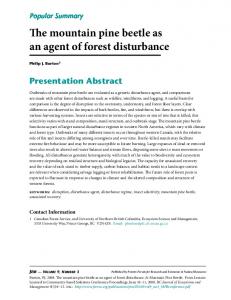
1. Introduction The recent epidemic of mountain pine beetle, Dentroctonus ponderosae Hopkins, in British Columbia, Canada has led to tree mortality spanning 18.3 million ha [1]. Since the current outbreak began in the late 1990s, the insect, which is native to the pine forests of western North America, has killed a significant component of forests dominated by lodgepole pine, Pinus contorta var. latifolia Engelmann —its main host and the most commercially viable species in the region [2]. It has since spread beyond the continental divide into Canada’s boreal forest beyond its historic range [3–5]. While past outbreaks have led to widespread tree mortality in British Columbia and other parts of Canada as well as in the United States [6], beetles are selective in their attack strategy, resulting in a patchwork of tree mortality across the landscape [7]. Such observations have important implications for management as beetles exhibit selective behaviour that, if understood, could guide mitigation efforts to minimize tree mortality. Following the more than decade-long outbreak, we are now entering a period of retrospection regarding this unprecedented situation. While mitigation in British Columbia is not currently emphasized, observing the outbreak from a number of perspectives will inform on the nature of the year-on-year outbreak development and identify those factors (mitigation or otherwise) that can be seen to have influenced infestation spread. The mountain pine beetle typically has a one-year life cycle. During the summer months of July and August, adult beetles emerge from their host tree and immediately begin some period of flight in search of a suitable tree to attack. Beetles exhibit a preference for larger diameter trees that have thicker phloem and bark, both of which facilitate successful reproduction and brood development [8–10]. Furthermore, microclimate conditions, particularly at forest edges, create favourable conditions for successful attack [11]. Once a beetle begins boring through the bark of a tree, it releases plumes of aggregation pheromones that attract other beetles to the suitable host [12,13]. Thousands of beetles can accumulate on a tree, known as mass attack, through pheromone communication [14]. Tree mortality is a typical consequence of mass attack resulting from gallery development and inhibited translocation due to fungal inoculation [15], which eventually facilitates beetle reproduction. However, reproduction is a density-dependent process in which reproductive success diminishes when the density of beetles crosses some threshold. As a result, beetles will emit anti-aggregation pheromones that repel additional beetles from coming to the tree once the tree’s resistance has been exhausted [12,16]. Following the below-bark boring and aggregation, beetles mate and oviposit under the bark of the tree. Adult beetles
Forests 2013, 4
281
die, the eggs hatch, and the larvae remain in the tree through the winter until they pupate and prepare to emerge during acceptable climatic conditions the following summer [17]. An individual tree that is under attack produces a toxic resin that pitches invading beetles from the tree. The likelihood of overcoming the tree’s defensive mechanisms increases with high beetle densities [18]; however, weakened or diseased trees have reduced vigour and are more likely to succumb to attack [19] and can be killed by a relatively smaller number of beetles. Therefore, during the incipient stages of an outbreak, beetles are more likely to be selective with regard to which hosts they attack [20]. As beetle populations increase due to favourable climatic conditions and availability of lodgepole pine, selective pressure declines as higher densities facilitate successful attack on more vigorous trees [18,21]. The selective behaviour of mountain pine beetle has been observed in studies that demonstrate that older, less defensible hosts are attacked in years previous to the attack of nearby younger and more vigorous trees [22]. At the stand level, tree density influences beetle selective behaviour as the presence of more trees leads to a decline in available resources needed for thwarting beetle attack [23,24], which allows us to expect a preference for stands with higher densities of lodgepole pine at low beetle populations. While observations of mountain pine beetle selective behaviour at the tree [25] and stand level are pertinent for understanding outbreaks, the size of the outbreak in British Columbia requires an examination of beetle interactions at a broader scale. Questions concerning potential locations of beetle attack at varying beetle population densities need to transcend from individual trees towards landscape units if the impacts of mitigation strategies are to be understood over the scale of the outbreak. Forest landscape patterns, specifically those resulting from anthropogenic and natural fragmentation processes, can alter insect infestations as demonstrated by the selective behaviours of defoliating insects [26], such as the western spruce budworm, Chorisoneura occidentalis [27], jack pine budworm Chorisoneura pinus [28], and forest tent caterpillar, Malacosoma disstria [29,30]. While fragmentation patterns have been found to influence how mountain pine beetle traverse across forested landscapes from one year to the next [31] and to influence predator-prey ratios [32], it is unclear how fragmentation influences the beetle’s selective behaviour over time, thereby resulting in observed patterns of tree mortality across the landscape. This leads us to ask: how does the arrangement of forest patches in a landscape influence the location of mountain pine beetle attack during low versus high population levels? To address the proposed question, we seek in this study to estimate and compare mountain pine beetle caused mortality with a measure of forest fragmentation during the initial stage of an infestation when beetle population density is low versus during a later stage of an infestation when an epidemic population level is reached. We develop a negative binomial regression model for testing the significance of fragmentation (as estimated by a patch index) in explaining the variability of mortality caused by mountain pine beetle (estimated from aerial surveys during these two periods in time). The intent of this study is to provide more broad scale information to complement individual insect-host relationships that can aid managers in understanding the processes of mountain pine beetle infestation at specific infestation stages, as well as aid in building a retrospective understanding of how this unprecedented outbreak developed.
Forests 2013, 4
282
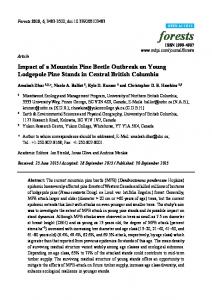
2. Experimental Section 2.1. Study Site and Data Our analysis was carried out over a 200 km × 200 km study site in the central interior of British Columbia, Canada (Figure 1). The site was selected based on previous observations that the current mountain pine beetle outbreak primarily commenced in this area in the late 1990s and subsequently spread to other lodgepole pine dominated forests in the province [33]. While beetle-caused tree mortality in this area is currently estimated at 18.3 million ha [1], this number represents the overall area that is affected (at any level of severity) and not the total amount of tree mortality [34]. Some areas experience widespread tree mortality, while other areas experience low mortality for a single year and, in some cases, little to no mortality the next year. Figure 1. 200 km by 200 km study site in central interior of British Columbia, Canada.
2.1.1. Mountain Pine Beetle Survey Data Beetle induced pine mortality is surveyed annually as part of the Aerial Overview Survey (AOS) program administered by the British Columbia Ministry of Forests and Range [35]. Surveyors record locations of killed trees as polygons on 1:100,000 or 1:250,000 basemaps. Infestation locations are coded with a rating of severity that represents the percentage of beetle-induced tree mortality area in the polygon. All AOS data and detailed surveys were compiled and integrated for the province of British Columbia from 1999 to 2006 [34], from which the location and severity of infestations at a 1 ha resolution were derived. It is important to emphasize that the AOS data record locations where beetles have attacked and successfully killed host trees in the previous year, and that we use this information as a surrogate to identify where beetles have been (occupancy). Similarly, the severity rating provides
Forests 2013, 4
283
a surrogate for beetle population density, as large population densities are required to cause severe mortality. For the purpose of this study, the AOS data were summarized into a binomial occupancy variable of presence/absence by assigning those areas to the “presence” class if beetle-induced tree mortality was greater than 0. The lack of current knowledge pertaining to how different levels of beetle populations respond to varying levels of forest fragmentation led to the selection of the binomial classification scheme. Furthermore, while beetle caused mortality in this area was first observed in the 1999 survey, we used the 2001 survey data to represent mountain pine beetle occupancy in 2000, as this year coincides with the land cover classification data that were used for obtaining measures of forest fragmentation. The 2006 AOS data were used to represent mountain pine beetle presence at the outbreak stage in 2005, as a notable proportion of the study site had been infested by this point in time. Figure 2 depicts the 2001 and 2006 AOS data that represent the presence of mountain pine beetle in the study site in 2000 and 2005, respectively. The number of hectares occupied by mountain pine beetle in the study site from 2000 to 2005 is presented in Figure 3. Figure 2. Mountain pine beetle (MPB) occupancy in study site in 2000 and 2005 based on aerial overview survey data acquired in 2001 and 2006. MPB Occupancy 2001
MPB Occupancy 2006
200 Km
Forest Type
Pine Forest
Non-Pine
Non-attacked Forest
Attacked Forest
2.1.2. Land Cover Classification Land cover classification was derived from a Canada wide mapping project called Earth Observation for Sustainable Development of forests (EOSD) [36]. The EOSD project mapped land cover for the forested ecosystems of Canada. To cover the forested ecosystems of Canada, over 480 Landsat-7 Enhanced Thematic Mapper Plus (ETM+) images were classified. The classification resulted in a 23 category depiction of land cover for circa year 2000 with a spatial resolution of 25m, with all products available freely as mosaics or as 1:250,000 scale map tiles [36]. The resultant EOSD land cover classes were also subsequently reclassified into forest and non-forest binary maps to support the generation of landscape metrics [37].
Forests 2013, 4
284
Figure 3. Area occupied by mountain pine in study site during recent epidemic. Note that the Area Occupied (y-axis) reflects the number of 1 ha cells that contain at least some proportion of beetle-induced tree mortality. The total area of British Columbia covered by forest land is approximately 60 million ha.
2.2. Methods 2.2.1. Measure of Forest Fragmentation Landscape metrics, such as those estimated from the EOSD data, quantify some property of landscape pattern and have become widely used due to greater availability of software and growing quantities of spatial data available for large areas [37]. Understanding the role of landscape patterns in ecological processes is critical for proper management of natural resources as decision-makers can manipulate landscapes in order to achieve desired management outcomes [38,39]. While a large set of landscape metrics exist, recalling the need for appropriate selection of metrics [40], we chose the Aggregation Index (AI) [41] for measuring forest fragmentation in the study site. As appropriate for this study, the AI is used to measure the amount of forest patch edges that are adjacent with each other, which is calculated by: AI
ef , f max[e f , f ]
(1)
where the edge, e, of forest patch, f, adjacent with other forest patches is divided by the maximum potential shared edge between forest patches. Therefore, AI results in a value in the interval (0~1), where AI = 0 when no forest patches share an edge (i.e., the area is non-forested), and AI = 1 when ef,f reaches the maximum (i.e., there exists a single forest patch). That is, low values of AI represent fragmented forests while values close to 1 represent non-fragmented forests. While there are multiple
Forests 2013, 4
285
indices that estimate fragmentation, and the use of the AI (as well as all landscape metrics) has limitations [42], the AI was selected because it provides a linear measure of forest fragmentation that can be adequately utilized in a regression in order to explain the variability in mountain pine beetle populations. The AI values from the EOSD data at 1 km resolution are shown in Figure 4. Figure 4. Values for the Aggregation Index in the study site as measured from the 2000 EOSD data [36].
2.2.2. Regression Model A negative binomial regression model was selected to estimate the degree to which forest fragmentation, as measured by the AI, explains the variation in presence of mountain pine beetle attack. This selection was based on the positively skewed (i.e., over-dispersed) distribution of mountain pine beetle occupancy in the study site (discussed in detail in the results section). Data from previous mountain pine beetle research [43] were classified for our study site into a binomial variable where pine = 0 represents an absence of any pine species, and pine = 1 indicates that at least some pine species are present. While other pine species are potentially present in all stands in the study site, lodgepole pine is by far the most dominant species. For providing a measure of fragmentation, each 1 km cell was also represented by an AI value between 0 and 1. Mountain pine beetle presence was calculated for each 1 km cell based on the count of 1 ha cells in which beetle-induced tree mortality was present, resulting in a value in the range 0–100. The presence-absence data set at the 1 ha scale thus provides density counts when aggregated to the 1 km scale. In summary, for each 1 km cell in which pine = 1, the AI value is measured against the count of
Forests 2013, 4
286
1 ha cells that are occupied by mountain pine beetle. Figure 5 provides a schematic of how the three variables are integrated. Figure 5. Data integration for developing the regression model. For each 1 km cell in which pine is present, the significance of the Aggregation Index for predicting counts of mountain pine beetle occupancy was analysed.
The occupancy counts for 2005 were adjusted in order for the data to correspond to a negative binomial distribution. In 2005, the majority of 1 km cells had high counts of beetle occupancy, while very few cells had low occupancy. Thus, we took the inverse counts (i.e., 100—the number of 1 ha cells occupied by mountain pine beetle) to represent the counts for 2005. The adjustment to the 2005 data is accounted for in the evaluation of the regression results in the next section by reversing the relationship between fragmentation and occupancy counts in the analysis. That is, we interpret a positive relationship between occupancy counts and the AI in the regression results as a negative relationship. Furthermore, the spatially dependent nature of outbreaks led to the removal of 26,365 one ha cells that contained no beetle caused mortality, leaving 13,635 cells. The reason for this is because some cells may have an AI that is conducive to attack, but if that cell is far from all infested cells there is a very low likelihood that it will be attacked (similar to notions of risk, see [44]). The data were prepared using ArcMap 9.3 [45], and the negative binomial regression model was developed in the statistical software R 2.12.2 [46] using the glm.nb model in the MASS library. 3. Results and Discussion The distribution of mountain pine beetle occupancy counts are displayed for 2000 and 2005 (adjusted) in Figure 6. The histograms depict a positively skewed distribution of beetle occupancy which represent patterns akin to the negative binomial distribution. In 2000, the majority of 1 km cells
Forests 2013, 4
287
have minimal beetle occupancy, and few cells are almost entirely occupied. Given the adjustment to the 2005 data, the majority of cells in the latter period of the infestation now have high beetle occupancy with few cells containing low beetle populations. The distribution in both years supports the use of a negative binomial regression model as occupancy counts are positively skewed. Figure 6. Frequency of 1 km cells containing a specific number of 1 ha cells in which mountain pine beetle are present for the years 2000 (left) and 2005 (right). Note that for 2005, Counts = 100—the number of 1 ha cells occupied by mountain pine beetle.
The results from negative binomial regression for predicting the number of occupied 1 ha cells in 2000 from the AI are presented in Table 1. The model was statistically significant as indicated by Chi-square = 9.9733, p < 0.001588. Furthermore, the AI was found to be statistically significant with p < 0.00378. The negative binomial regression model is log linear, thus the coefficients can be translated into multiplicative effects. The expected log count increase for a one unit increase in the AI is í0.331; therefore, a one unit increase in the AI (which signifies less fragmentation) is associated with a decrease in mountain pine beetle occupancy count of exp(í0.3351) = 0.7153. Thus, at the beginning of the outbreak in the study area, lower counts of mountain pine beetle-caused tree mortality are associated with less fragmented forest while higher counts are associated with more fragmented forests. It should be emphasized here that higher AI values are not a result of mountain pine beetle-induced mortality in 2000 because, while the data for both variables were collected in the same year, tree mortality resulting from attack occurs over several months. Table 1. Results from negative binomial regression for predicting beetle occupancy based on the aggregation index in 2000. (Intercept) AI
Estimate 3.2107 í0.3351
Standard Error 0.1094 0.1157
z value 29.352 í2.896
p