channel quality within all bins. The decision on proper bin size should take both factors into account. II. ANALYSIS. We shall now estimate the spectral efficiency ...
Impact of Multiuser Diversity and Channel Variability on Adaptive OFDM �
�
Wei Wang , Tony Ottosson , Mikael Sternad , Anders Ahl´en , and Arne Svensson Dept. � Signals and Systems, Chalmers University of Technology, SE-41296 G¨oteborg, Sweden Signals and Systems, Uppsala University, PO Box� 528,SE-751 20 Uppsala, Sweden � wei.wang, tony.ottosson, arne.svensson � @s2.chalmers.se; mikael.sternad, anders.ahlen � @signal.uu.se Abstract A downlink radio interface for cellular packet data systems with wide area coverage and high spectral efficiency is evaluated. A slotted OFDM radio interface is used, in which time-frequency bins are allocated adaptively to different mobile users within a downlink beam, or sector, based on their channel quality. Frequency division duplex (FDD) is assumed, which requires channel prediction in the terminals and feedback of this information to a packet scheduler. The adaptive modulation scheme is optimized by a novel approach which maximizes the throughput including also the ARQ part of the transmission. A theoretical evaluation of the resulting multiuser diversity under some idealized assumptions shows that the spectral efficiency increases significantly with the number of active users. The simulations indicate that the loss of performance due to channel variability within the bins for vehicular users in frequency-selective fading environments is rather small. I. I NTRODUCTION Higher spectral efficiency will be a key feature of any cost efficient future radio interface. A promising approach, in particular for the downlink, is to minimize interference between users within a cell by orthogonal signaling in the form of OFDM. Multiple users may then share the total bandwidth by multiplexing their data in both time and frequency. In an adaptive OFDM system, spectral efficiency can be improved by allocating the time-frequency resources based on throughput requirements, quality of service constraints and the channel qualities of each user. A scheduler, which optimizes the resource allocation for multiple active users, becomes a key element in such a solution. In present CDMA systems, the spectral efficiency decreases with an increasing number of active users having conventional detectors. The reason is intra-cell interference due to imperfect orthogonality of the downlinks. In an adaptive OFDM system, where orthogonal time-frequency resources are given to the user who can utilize them best, the spectral efficiency will instead increase with the number of active users. This effect is denoted as multiuser diversity [2] and it is quantified in this paper by both analysis and simulations. We will assume the following target system parameters (more details, especially on the cellular aspects of the proposal, can be found in the companion paper [3].):
�
time-frequency bins of size 0.667 ms and 200 kHz; symbols and cyclic prefix of length ������ s and � �� s, respectively; � a subcarrier spacing of 10 kHz. The resulting time-frequency bin thus carries 120 symbols, with 6 symbols of length ��� �� s on each of the 20 subcarriers. Of the 120 symbols, 12 are for training and downlink control, leaving 108 payload symbols [3]. Each terminal predicts the signal to interference and noise ratio (SINR) for all bins 3 time-slots ahead and signals the appropriate modulation format to be used within the upcoming time-frequency bins. The scheduler allocates these timefrequency bins exclusively to different users and broadcasts its allocation decisions on a downlink channel. The remainder of the paper is organized as follows. In Section II, we derive and investigate the spectral efficiency of the proposed system under some idealized conditions. Section III investigates the scheme by simulations, and quantifies the reduction in spectral efficiency due to channel variability within the bins in frequency-selective fading channels. This is typical for vehicular users in suburban environments. The effect of varying bin size is studied in Section IV. A too large bin size reduces the spectral efficiency severely, while a too small bin size leads to an excessive required feedback bandwidth if each active user has to signal the predicted channel quality within all bins. The decision on proper bin size should take both factors into account. �
II. A NALYSIS We shall now estimate the spectral efficiency for best effort services under some idealized assumptions. Flat AWGN channels are assumed time-invariant within bins and independent Rayleigh fading between bins. All users are assigned equal average received power1 and channels to different users fade independently. All terminals are assumed to have receiver antennas and to use maximum ratio combining, while each transmitter has only one single antenna. Accurate prediction of SINR � is assumed, and the symbol detection is based on error-free channel estimation. Finally, 1 This assumed power control scheme is wasteful from a system capacity perspective. However, it simplifies the analysis considerably. The capacity of the proposed adaptive downlink with a better power control strategy is evaluated by Monte-Carlo simulation for an interference-limited environment in [3].
c
Here g� is the average SINR per receiver antenna. �ih � and c �jh SNkY� are the gamma and incomplete gamma functions, respectively. Consequently, the cdf after selection diversity of users each using MRC with antennas can be calculated as the product of individual user’s cdf (3), and given as
TABLE I
� 0 1 2 3 4 5 6 7
S WITCHING LEVELS ��� Modulation BPSK 4-QAM 8-PSK 16-QAM 32 Cross-QAM 64-QAM 128 Cross-QAM 256-QAM
������� (dB) 1 ��� 2 3 4 5 6 7 8
8.701 14.58 16.84 20.46 23.59 26.86 29.94
3 � ���b�ml �J1
�"!#�%$'&)(+*-,/. 0 � �214365�7 0 � ���8��9 bits/s/Hz :
(1)
Here, . 0 is the number of bits per symbol using uncoded ;/= ary QAM modulation. �?!@�A��� �/BC� ��� is due to the cyclic prefix and �%$D�E�F��GCBC�F;�� is due to the 12 pilots and control symbols per bin. Moreover, 3'5�7 0 � ��� is the frame error rate for the modulation level H . These frame error rates can be calculated as 365�7 0 � �����I�J1
� �21K3MLN7 0 � ���8�NOQP>RTS
(2)
where 3 L>7 0 � ��� is the symbol error rate for level H when ;/= ary QAM is used in a SINR region U � 0 S8� 0WV � , �YXZ�\[ . O The exponent 108 represents the number of payload symbols. These SINR thresholds � 0 , obtained by using the analytical expressions for 3 L>7 0 � ��� , are given in Table I. Note that there is no lower cutoff threshold that forbids the transmission for lower SINRs, since we don’t limit the number of retransmissions. We believe this is a novel approach to the optimization of adaptive modulation schemes including also the ARQ part of the transmission. To calculate the average spectral efficiency we need to calculate the average of (1) over the pdf ] � ��� . This pdf ] � ��� results from selection diversity of users each using maximum ratio combining (MRC) with antennas in the receiver. The cdf of � of one user after MRC with antennas can be written as [5] 3M^`_�a � � � �b�I�J1
c �
S d e � 2 c � d
f� :
:
(4)
Finally the resulting pdf ] � ��� , obtained by differentiating (4), can be written as
all users always have data to transmit, and the allocated bins are fully utilized by their designated users. The assumed scheduler works as a selection diversity scheme, where the user with the best predicted SINR out of all users will transmit in a bin. Fast link-level retransmission (ARQ) is performed whenever bit errors occur within the 108 payload symbols. We optimize the adaptive modulation scheme in the sense of attainable spectral efficiency instead of introducing BER constrains. Given the instantaneous SINR the user will select the modulation format (one of the � modulation formats: BPSK, 4-QAM, 8-PSK, 16-QAM, 32 Cross-QAM 64-QAM, 128 Cross-QAM, and 256-QAM) that results in the highest spectral efficiency ��� �����
c �
S de � 2 c � d
n�po�q
(3)
e � sr t + d u d d e �wv c � c � t O c
n�M1
xS d e � : l � nd � � d o q The average spectral q efficiency thus is ] � ���b�
� �y� ! � $
Xz
t O 0W{ P
d =~}C � �C1%3 5�7 0 � ���#�] � ���Y�
. 0/|
(5)
bits/s/Hz : (6)
d =
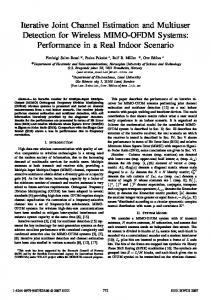
A numerical evaluation is presented in Fig. 1 for an average SINR of � g � � ���b�I�F
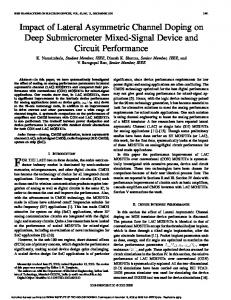
dB per receiver antenna, for all users. There is a notable improvement with an increasing multiuser selection diversity and of course also an increase with the number of receiver antennas. The spectral efficiency saturates for a high number of users, when most bins are occupied by users who can utilize a high modulation format. The addition of more receiver diversity branches (larger ) decreases the OFDM channel variability [4]. Here, this tends to decrease the multiuser diversity effect. Another interesting result is presented in Fig. 2 where we can see the probability of a given modulation level (or rate . 0 ) being used assuming �I� antennas. As seen, the likelihood for high rates increases drastically with the number of users. However, we can also see that 256-QAM is almost never used (the probability is actually not zero) and would therefore not contribute much to the throughput. This would of course change if the SINR is larger, which definitely would be the case close to the base station. III. S IMULATION
RESULTS
The analysis above is derived under some rather idealized assumptions and simulations are thus needed to verify the validity of these assumptions. In this section we will relax the assumptions about the channel and instead generate a frequency-selective channel with variations within a bin. We still however assume perfect knowledge of the channel. We assume a system operating at carrier frequency 1900 MHz with 5 MHz bandwidth divided into 500 sub-carriers. The channel model employed in the simulations is a finite impulse response (FIR) filter with time-varying tap values. Every propagation path is characterized by a fixed time delay and a time-varying amplitude, which is the product of a Rayleigh fading process and a fading coefficient. The power delay profiles used are from [6] but modified so that time delays are sample-spaced. The resulting profiles are given in Table II.
TABLE II
5.5
P OWER DELAY PROFILES
L=8
Spectral efficiency [bits/s/Hz]
5
Case 1 Speed 120 km/h Relative Relative Delay Mean [ns] Power [dB] 0 0 200 -3 400 -6 600 -9
L=4
4.5 L=2
4 L=1
3.5 3
Case 2 Speed 50 km/h Relative Relative Delay Mean [ns] Power [dB] 0 0 800 -10
2.5 2 0
10
20 30 Number of Users (K)
40
50
� � ���b�
Fig. 1. Spectral efficiency at SINR 16 dB per receiver antenna, th order MRC diversity in the mobile and th order of selection diversity between the users.
0.9 0.8 0.7
Probability
0.6
K=1 K=5 K=10 K=20 K=30 K=50
0.5 0.4 0.3 0.2 0.1 0 1
2
3
4 5 Rate/symbol (ki)
6
7
8
�"!N�%$�. 0 � �J1K3?5� 7 0 � ���8�8 bits/s/Hz :
(8)
Here, . 0 , � ! and � $ are defined in Section II. It is apparent that the low SINRs in the bin, which deviate significantly from the average SINR, essentially determine the symbol error rate and consequently the overall spectral efficiency of the bin. Therefore the modulation format obtained by using the minimum SINR within the bin yields a reliable but pessimistic result. However, based on this initial estimate, one can increase the modulation format one step higher and recalculate the frame error rate by using (7) and the corresponding spectral efficiency with (8). If the new spectral efficiency is higher than the one obtained by using minimum SINR, then the new modulation format is used. This new scheme does not change the idea of maximizing the spectral efficiency in each bin described in the analysis. However, it simplifies the calculation from a full search of modulation formats including evaluation of (7) and (8) to only a one step test, which is more practical to implement. 4
The adaptation algorithm in the simulations is slightly modified as compared to the one in the analysis, which helps to decrease the computational complexity without sacrificing throughput. In the simulations, the channels are no longer time-invariant within the bins. On the contrary, large variations can be observed. Therefore the actual frame error rate is calculated as 3?5� 7 0 � ���b��J1N
� �J1K3 LN7 0i7 � � �8�:
assume the knowledge of the variablity of � within the bins.
3.5
3
2.5
Theoretical spectral efficiency Simulated spectral efficiency (case 2) Simulated spectral efficiency (case mix) Simulated spectral efficiency (case 1)
2
1.5 0
(7)
Here 3 5� 7 0 � ��� denotes the actual frame error rate for the modulation level H . The index is the payload symbol number and � is the instantaneous SINR of the Fi payload symbol. 2 3 LN7 0i7 � � � denotes the symbol error rate of the i payload symbol for modulation level H . With the actual frame error rate, one can also recalculate the spectral efficiency as 2 We
Spectral efficiency [bits/s/Hz]
� � as a function of the number of users Fig. 2. Probability of using rate � at SINR 16 dB, all having `s antennas.
5
10
15
20
Number of Users (K)
Fig. 3.
Simulated spectral efficiency at SINR 16 dB with one antenna
Three simulations are presented in Fig. 3. In the first and second cases all of the channels are generated according to the corresponding power delay profile listed in Table II. In the mixed case, half of the channels are generated by the case 1 power delay profile and the other half are generated by the case 2 power delay profile. The spectral efficiency of case
efficiency according to the simulations. TABLE III M ODIFIED SYSTEM PARAMETERS Half bin size 60 symbols 4 symbols and 15 subcarriers (0.444ms and 150kHz) 4.95 MHz total bandwidth
0.7 K=1 K=5 K=10 K=20
0.6
4
3.5
3
2.5
60 payload symbols (theo) 120 payload symbols (theo) 240 payload symbols (theo) 60 payload symbols (simu) 120 payload symbols (simu) 240 payload symbols (simu)
2
0.5 Probability
Double bin size 240 symbols 8 symbols and 30 subcarriers (0.889ms and 300kHz) 5.1 MHz total bandwidth
4.5
Spectral efficiency [bits/s/Hz]
2 is higher than that of case 1 and the spectral efficiency of the mixed case consequently lies in between. One can also observe that there is a gap between the theoretical curve and the simulated curves, which comes from the variation of the channels within the bin. The symbol error rate formulas of 32 Cross-QAM and 128 Cross-QAM that we are using to calculate the thresholds and frame error rate are upper bounds [7], which give an underestimated theoretical spectral efficiency. This effect becomes stronger with an increasing number of users due to a more frequent use of these two modulation formats, which also explains the merge of the theoretical spectral efficiency curve and the simulated curve (case 2) for high . The probability of occurrence of a certain modulation format with one receiver antenna is also simulated in a channel condition with case 2’s power delay profile. In Fig. 4, the simulated curves exhibit almost identical trends and values as those in the analysis, see Fig. 2.
1.5 0
5
10
15
20
Number of Users (K)
0.4
Fig. 5. Simulated spectral efficiency of different bin size at SINR 16 dB with one antenna. All the channels are generated with power delay profiles according to case 2. Neither training nor downlink control information symbols are assumed.
0.3 0.2 0.1 0 1
2
3
4 5 Rate/symbol (ki)
6
7
8
Fig. 4. Simulated probability of using rate �F� as a function of the number of users at SINR 16 dB, all having @ antennas.
It is also interesting to examine the use of other bin sizes in order to evaluate the current system proposal. In Fig. 5, both double bin size (240 symbols) and half bin size (60 symbols) are considered. In order to make a fair comparison, all the symbols within the bins are assumed to be payload symbols. We still assume symbol time and cyclic prefix of length ������ s and � �� s, respectively and a subcarrier spacing of 10 kHz. The other system parameters are however modified in these two cases and given in Table III. The change of bin size will also affect the adaptive modulation thresholds, which have been recalculated and are listed in Table IV. Note that all the channels in Fig. 5 are generated by the power delay profile of case 2. In the half bin size case, one can gain in spectral efficiency at the price of more feedback information. In the double bin size case, there is relatively large variation of SINRs within the bins. Therefore the assumption of timeinvariant AWGN channels within the bins becomes a worse approximation in this case. The use of a single modulation format within the bins results in an obvious loss in spectral
Finally we study the system performance for an average SINR of � g � � �����F� dB per receiver antenna, for all users, which could be the case when the users are far from the base station. The power delay profile of case 2 is still in use, and the proposed system with 120 symbols (108 payload symbols) is simulated, see Fig. 6. As expected, the low average SINR reduces the spectral efficiency. However, the adaptive algorithm still does the job since the channel variability is unaffected. IV. D ISCUSSION In the previous section, we have shown the impact of different bin sizes on spectral efficiency. Here we discuss the amount of channel quality feedback information required in the uplink with respect to the different bin sizes. TABLE IV N EW SWITCHING LEVELS � � >¡¢¤£ AND � �C¥8¦8§�¨i¢ª©
�
0 1 2 3 4 5 6 7
Modulation BPSK 4-QAM 8-PSK 16-QAM 32 Cross-QAM 64-QAM 128 Cross-QAM 256-QAM
���«� � >¡¢¤£ (dB) ��� 1 2 3 4 5 6 7 8
8.03 13.99 16.31 20.00 23.13 26.42 29.51
USED IN
F IG . 5
� �C¥8¦#§�¨i¢ª© (dB) ��� 9.48 15.27 17.47 21.02 24.14 27.38 30.46
Spectral efficiency − uplink control [bits/s/Hz]
4
Spectral efficiency [bits/s/Hz]
3.5 3 2.5 2 1.5 Theoretical spectral efficiency 16dB Theoretical spectral efficiency 10dB Simulated spectral efficiency 10dB
1 0.5 0
5
10
15
20
Number of Users (K)
Fig. 6. Simulated spectral efficiency at SINR 16 dB and SINR 10 dB with one antenna. All the channels are generated with power delay profiles according to case 2. We assume 108 payload symbols in the simulations.
4 3.8 3.6 3.4 3.2 3 2.8 60 payload symbols 120 payload symbols 240 payload symbols
2.6 2.4 0
5
10
15
20
Number of Users (K)
Fig. 7. Net spectral efficiency (downlink spectral efficiency minus required uplink control bandwidth) as a function of number of active users .
V. C ONCLUSIONS The channel quality feedback in the uplink conveys the information of a suggested modulation format of each timefrequency bin. In the proposed system, 3 bits are needed for each of the 25 frequency bins in a 0.667ms time slot in order to represent the 8 modulation formats. With K active users over 5 MHz bandwidth, the required uplink bandwidth would be ¬� \®¯� �F;K. °>H²±8³+B³ , which becomes 1.1Mbits/s in a 10 user case. Although this consumes a considerable amount of uplink spectral efficiency, it is not overwhelming under the assumption of a total uplink capacity of 15Mbits/s per base station sector [8]. If the bin size is reduced to half (33 frequency bins in a 0.444ms time slot), then the amount of feedback information increases to ´®@; ;µ¶. °H±8³+B�³ . On the other hand, only A®· ¸@. °>H²±8³+B³ is required in the double bin size scenario (17 frequency bins in a 0.889ms time slot). The previous simulation of spectral efficiency in Fig. 5 and the current analysis of required uplink feedback bandwidth with varied bin size clearly shows the tradeoff between these two important aspects in the system design. A bin size of 120 symbols represents a good balance for µ-1;�� users per cell, see Fig. 7. Furthermore, there are also many possible methods of reducing the feedback bandwidth demand. �
One may notice that 256-QAM is rarely used when all users have average SINR 16dB. Discarding this modulation format could be a reasonable solution in a situation where one needs to be strict on the feedback bandwidth. � The choice of BPSK need not be explicitly declared. The use of these two tricks reduce the 3 bits per timefrequency bin into 2.585 bits, and feedback bandwidth of ¹®»º�
:¤¸`. °>H²±8³+B³ can be obtained. � It is reasonable to assume that most of the active users move at a low speed. Under this assumption, we can take into account the correlation in time and frequency. This will further reduce the feedback bandwidth together with coding.
An adaptive OFDM radio interface is outlined for the FDD downlink of a packet switched mobile data system with high throughput and wide area coverage. The impact of multiple simultaneous users and channel variability on spectral efficiency has been investigated. Analysis made under some idealized channel conditions indicates that a system with high spectral efficiency is attainable. The simulation results in frequency selective fading environments are as promising as in the analysis of the proposed system. The degradation in spectral efficiency is insignificant for a vehicle speed even up to 120 km/h. The appropriate size of the OFDM timefrequency bins has also been discussed. A bin size of 200 kHz in frequency and 0.667 ms in time represents a reasonable balance between the attainable downlink spectral efficiency and the required uplink quality feedback control bit rate. R EFERENCES [1] Online: www.signal.uu.se/Research/PCCwirelessIP.html. [2] R. Knopp and P.A. Humblet, “Multiple-accessing over frequencyselective fading channels”, IEEE PIMRC, Toronto, Canada, Sept. 27-29, 1995. [3] M. Sternad, T. Ottosson, A. Ahl´en and A. Svensson, “Attaining both coverage and high spectral efficiency with adaptive OFMA Downlinks”, VTC 2003-Fall, Orlando, USA, Oct. 6-9, 2003. [4] T. H. Liew and L. Hanzo, “Space-time block coded adaptive modulation aided OFDM”, IEEE Globecom 2001, 136-140. [5] M. D. Yacoub, Foundations of Mobile Radio Engineering, CRC Press, 1993 [6] 3rd Generation Partnership Project (3GPP), Technical Specification Group Radio Access Networks, UE Radio Transmission and Reception (TDD), (release 1999), 3GPP TS 25.102 v3.12.0 (2002-09), pp. 38. [7] John G. Proakis, Digital Communications, 3rd edition, McGraw-Hill, 1995 [8] T. Ottosson, M. Sternad, A. Ahl´en, A. Svensson and A. Brunstr¨om, “Towards a 4G IP-based Wireless System Proposal”, Radiovetenskap och Kommunikation, RVK 02, Stockholm, Sweden, June 10-13, 2002.