Impact of Source Counter on DTN Routing Control under Resource Constraints Xiaolan Zhang
Honggang Zhang
Yu Gu
Dept. of Computer and Information Science Fordham University Bronx, NY
Dept. of Mathematics and Computer Science Suffolk University Boston, MA
NEC Laboratories, America 4 Independence Way Princeton, NJ
[email protected]
[email protected]
[email protected]
ABSTRACT
1. INTRODUCTION
We study routing schemes for resource constrained Disruption Tolerant Networks (DTNs) where transmission bandwidth is scarce resource. In such a setting, a key issue is how to schedule the transmission of packets under limited bandwidth to optimize performance. Such a scheduling consists of source control (i.e., source nodes choosing a routing scheme) and the local buffer management scheme adopted by each node. Existing works typically focus on transmission buffer management, but due to theoretical and practical difficulties, only heuristics have been proposed. In this work, we explore alternative ways to improve DTN routing performance via source control. We focus on spray-and-wait counter-based routing scheme. We first show that there exists an optimal counter value to achieve minimum average network-wide packet delivery delay. Then as a first step towards understanding multi-hop multicopy DTN routing schemes, we model a two-hop multi-copy DTN routing via a continuous time Markov Chain. Our modeling analysis provides insights into the impact of counter on routing performance and further suggests the existence of optimal counter value. In this process, we derive the capacity region of DTN routing (i.e., the maximum sustainable per-node throughput), and provide an accurate analysis of the average packet delivery delay of the two-hop single copy relaying scheme. Relying on the insights gained via simulations and modeling, we propose an adaptive scheme that allow nodes to adjust their counter values to achieve minimum packet delivery delay, in a distributed and asynchronous fashion. Simulations demonstrate the effectiveness of our scheme and suggest the potential of exploring this rich area for improving DTN routing performance.
Recent advances in routing control for Disruption Tolerant Networks (DTN) have led to a better understanding of DTN routing and have produced many routing schemes [18, 9]. Unlike traditional routing, DTN routing protocols have adopted a “store-carryforward” paradigm, where each node in the network stores a packet that has been forwarded to it by other nodes, carries the packet while it moves around, and forwards or duplicates it to other nodes (or the destination node) when they come within transmission range. DTN routing schemes can be classified into single-copy or multicopy schemes. Under single-copy schemes, at any time, there is a single copy of each packet in the network; each packet is forwarded along a single path. Under multi-copy schemes, there can be multiple copies of a packet concurrently traveling in the network; a packet is copied (i.e., duplicated) to other nodes, allowing simultaneous use of multiple paths to the destination. For example, epidemic routing [18] floods the whole network in order to deliver a packet. Many variations of epidemic-like routing schemes have been proposed, such as spray-and-wait [17, 15, 16], K-hop, probabilistic forwarding [7]. Compared to single-copy schemes, multicopy schemes enjoy better delivery performance (i.e., lower delivery delay and higher delivery probability), at the expense of more transmission overhead and buffer occupancy. DTNs are often subject to severe resource constraints. For example, transmission bandwidth is often limited due to the low data rates of wireless radio and the short duration of node-to-node encounters. Applications such as mobile sensor networks often use small battery-powered nodes, hence energy and memory capacity are also scarce resources. While most early DTN routing schemes ignored resource constraints, several recent works [2, 1, 12] addressed some transmission scheduling and buffer management problems in their proposed DTN routing schemes. For a classification of DTN routing schemes, interested readers are referred to [1]. In this paper, we studies routing in DTNs where transmission bandwidth is scarce resource but power and storage are not constrained. Typical examples include vehicle based DTNs [2, 19, 4]. In such a setting, a key research problem is how to schedule the transmission of packets under limited bandwidth to optimize performance. Fundamentally, such a scheduling involves two key parts: the routing scheme chosen by data source nodes and the local transmission scheduling scheme adopted by each node. Specifically, a source node (at the application or transport level) can choose a particular forwarding or routing scheme such as epidemic routing, or a spray-and-wait scheme with certain counter number for each packet, or probabilistic forwarding with a certain forwarding probability. Note that different routing schemes chosen by source nodes incur different overhead (such as the number of simultaneous du-
Categories and Subject Descriptors C.2.2 [Computer-Communication Networks]: Network Protocols— Routing protocols
General Terms Performance, Experimentation,Verification
Permission to make digital or hard copies of all or part of this work for personal or classroom use is granted without fee provided that copies are not made or distributed for profit or commercial advantage and that copies bear this notice and the full citation on the first page. To copy otherwise, or republish, to post on servers or to redistribute to lists, requires prior specific permission and/or a fee. MobiOpp ’10, February 22-23, 2010, Pisa, Italy. Copyright 2010 ACM 978-1-60558-925-1/10/02 ...$10.00.
plicated copies of a packet in the network), and result in different performance. In addition, each node in the network (at the routing level) employs a transmission scheduling scheme that decides which packets in its buffer to forward when it encounters another node. Existing works typically focus on transmission scheduling and buffer management, assuming that the routing scheme chosen by source nodes are fixed. But [1] shows that finding an optimal schedule for DTN routing is NP-hard. Thus existing works [1, 12] rely on heuristics for improving routing performance which imposes lots of control traffic for information exchange. In this work, we explore alternative ways to improve DTN routing performance via source control, assuming scheduling algorithms are given and fixed. In this paper, we focus on spray-and-wait counter-based routing scheme. The central question we address in this paper is: Can source nodes improve their routing performance by adjusting the copy count or duplication factor for each packet? Here we assume that all nodes in a network are fully cooperative in carrying out the routing scheme chosen by a source node. Our main contributions are summarized as follows. First, we observe via simulations that there exists an optimal counter value to achieve minimum average network-wide packet delivery delay. Then as a first step towards understanding multi-hop multi-copy DTN routing schemes, we model a two-hop multi-copy DTN routing via a continuous time Markov Chain. This modeling analysis provides insights into the impact of counter on routing performance and further suggests the existence of optimal counter value. In this process, we study the capacity region of DTN routing, and accurately analyze the average packet delivery delay under the two-hop single copy relaying scheme. Relying on the insights gained via simulations and modeling, we design an adaptive scheme that allow nodes to adaptively adjust their counter values (in search for an optimal counter value) to achieve minimum packet delivery delay. Simulations demonstrate the effectiveness of our scheme and suggest the great potential of exploring this rich area for improving DTN routing performance. The remainder of this paper is organized as follows. We discuss related work in Section 2, and describe our network and traffic model in Section 3. Then in Section 4 we present our finding of an optimal counter in counter-based DTN routing schemes. In Section 5 we give an accurate analysis of two-hop single copy routing scheme, and in Section 6, we present our Markov Chain model for two-hop multi-copy routing. In Section 7, we demonstrate the effectiveness of counter-adaptation routing control based on our modeling results. Finally, we conclude our paper in Section 8.
2.
RELATED WORK
Some recent works [1, 12] have taken resource constraints into consideration when designing routing schemes. While these works focus on the local transmission scheduling and buffer management policy adopted by the network nodes, we focus on a different aspect of DTN routing control, i.e., the choice of duplication factor at the source node. As to the performance modeling of DTN routing schemes, the majority of work (e.g.,[5, 20, 8]) assume there is no bandwidth constraint, i.e., when two nodes meet, they can transfer unlimited number of packets. To the best of our knowledge, [10] is the only modeling work taking into account bandwidth constraint. [10] studies delivery delay under epidemic routing and spray-and-wait routing with randomized scheduling scheme. We however focus on the single-copy and multi-copy two-hop scheme. And furthermore, we take into considerations more sophisticated scheduling schemes. In particular, we study the prioritized scheduling scheme where relaydestination transmission is given higher priority than source-relay
Notation N β B λ K PSR PRD Td Tp E[Cr ] cmin cinc cdec
Description number of nodes pair-wise inter-meeting rate number of packets that can be exchanged during a contact per flow packet generating rate packet duplication factor used in two-hop K-copy scheme fraction of bandwidth used for source-relay transmission fraction of bandwidth used for relay-destination transmission packet delivery delay packet propagation duration average number of relay nodes carrying a copy of a packet the minimal spray-and-wait counter to use the increment step when adapting spray-and-wait counter the decrement step when adapting spray-and-wait counter
Table 1: Summary of Notations
transmission, and we study proportional allocation. For scheduling within the same type of transmission, we study First-Come-FirstServe (FCFS) scheduling (for single-copy case) and randomized scheduling scheme (for multiple-copy case). As [1, 12] pointed out and our simulation studies confirmed, prioritized scheduling outperforms randomized scheduling scheme. [13] characterized the scaling properties (i.e., asymptotic behavior) of the throughput and delay of DTNs under the two-hop relay scheme proposed by Grossglauser and Tse [6]. Based on a different DTN model, we have performed an exact analysis on the delay under the two-hop relay scheme, and demonstrated that this scheme achieves the network capacity for DTNs with even number of nodes and circular traffic patterns.
3. SYSTEM MODEL 3.1 Network and Traffic Model Consider a network of N mobile nodes moving according to mobility models such as random waypoint model or random direction mobility model within a closed region. Each node has a limited transmission range such that the network is sparse and disconnected. Let inter-meeting time between a pair of nodes denote the duration of time from the time when the two nodes go out of transmission range of each other to the next time they come into range of each other. [5] show that under random waypoint and random direction models, the inter-meeting time follows an exponential distribution when node velocity is relatively high compared to the region size and the transmission range is relative small. Furthermore, [3, 11] show that under a large class of mobility scenarios, the inter-meeting time follows a power-law up to a point, and then exhibits an exponential decay. Based on these previous studies, we assume in this paper that the pair-wise inter-meeting time follows exponential distribution with rate β, an assumption that has been made by most previous modeling work in DTNs (e.g.,[5, 20, 8]). We leave the study of more general inter-meeting time distribution as future work. We consider bandwidth constraint by assuming a total of B packets can be exchanged between two nodes when they meet. We consider the following traffic model commonly adopted in DTN and MANET literature [20, 6]. There are N unicast flows in the network. Each node is the source of one flow, and the destination of another flow. We use fi to denote the unicast flow originated from node i (1 ≤ i ≤ N ), and use d(fi ) to denote the destination node of flow fi . We have d(fi ) ∈ {1, 2, ..., N } − {i} and d(fi ) 6= d(fj ) for i 6= j. Packets arrive at each source node
1
1
3
5
6
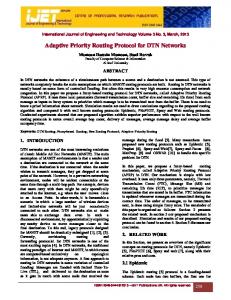
2
sparsest cut 3 5 4 (a) A circular traffic pattern for N = 6 case. This figure only shows the traffic flows. There are 30 edges in the graph.
2
4
6
(b) Sparsest cut for the network shown in (a). This figure only shows the traffic flows. There are 9 edges cross the cut.
Figure 1: Example of a network with even number of nodes and circular traffic pattern according to a Poisson process with rate λ. The simulations reported in the paper were carried out using a discrete event DTN simulator that we developed. For each simulation run, the N unicast flows are configured as follows: for each node, we choose a node uniformly at random (from all nodes that have no flow destined to it yet) to be the destination of its generated packets. Simulation setting can be described as a 4-tuple (N, β, B, λ). N, β, B, and λ, together with other notations used in the paper, are summarized in Table 1.
3.2 Network Capacity Region For the network and traffic model under study, there is a maximum per-flow throughput that the network can support. In this section, we first show that a per-flow throughput of λ∗ = NBβ can 4 be achieved by the two-hop single-copy relay scheme proposed in [6]. Then we show that this throughput is the maximum achievable throughput if the network has an even number of nodes and the N unicast flows form a circular traffic pattern. We use the per-flow throughput result derived in this section to guide us in choosing various traffic load levels for studying DTN routing performance in the remaining part of the paper. Under the two-hop single-copy relay scheme [6], packets are delivered to the destination node via a one-hop path or a two-hop path. When the source node of a flow encounters the destination node of the flow, packets are directly transmitted to the destination node (i.e., by one-hop path). When the source node encounters one of the other N − 2 nodes (that are not destination node and can act as relay node) in the network, it forwards a source packet to the relay node. The relay node stores the packet, and delivers the packet to the destination when they encounter each other. More specifically, when node i and j encounter each other, the total bandwidth B are equally allocated to packet transmission in the two directions (from node i to j, and from node j to i). This means that B/2 packets can be transferred in each direction. We now consider the packet transmission from node i to node j (the packet transmission from node j to node i is similar). If node j is the destination node of flow fi , i.e., j = d(fi ), then all bandwidth (B/2 packets per contact) is used for direct source-destination transmission. If j is not the destination node of flow fi , then j acts as a relay node for flow fi , and node i acts as a relay node for the flow destined to j. The total available bandwidth, B/2, are equally allocated to these two types of transmissions, i.e., B/4 packets for source-relay transmission from source node i to relay node j, and B/4 packets for relay-destination transmission from relay node i to destination node j. Now consider the throughput achieved by this scheme. The di-
rect source-destination transmissioncan be modeled as an M/M/1 queue with batch service, where the arrival rate is the packet arrival rate, the batch service rate is given by β where up to B/2 packets can be simultaneously served. Such direct transmission yields a perflow throughput Bβ/2. A packet can also be delivered through one of the N − 2 two-hop paths, each going through one of the N − 2 relay nodes. Each of the two-hop paths provides a throughput of Bβ . Summing up throughput of all possible paths, the throughput 4 of each flow is (N − 1)Bβ/4 + Bβ/2 = N Bβ/4. When considering maximum network throughput, the DTN can be viewed as a static undirected network where every node is connected with every other node in the network and the long-term average bandwidth of each edge is Bβ. The maximum achievalble per-flow throughput can be found by solving a classical maximum concurrent multi-commodity flow problem. And [14] has shown that the sparsest cut of a (undirected) multi-commodity flow problem is an upper bound of the max-flow. Here the sparest cut is defined to be the minimum ratio of capacity to demand for all cuts. For a DTN with an even number of nodes and a circular traffic pattern (e.g., Figure 1.(a)), the sparsest cut can be formed as follows (as Figure 1.(b) illustrates). We divide the set of N nodes (set V ) into two sets, U and V − U , such that for each of the N unicast flows, its source node is in one set while its destination is in another set. The capacity of the cut is N/2 ∗ N/2 ∗ Bβ, obtained by multiplying the number of edges crossing the cut with the edge bandwidth. The demand of the cut is N , the number of unicast flows through it. One can easily show that this cut is the sparest cut, and its value is N Bβ/4. Therefore the per-flow throughput is upper-bounded by N Bβ/4. As this upper bound is achieved by the two-hop single-copy relay scheme, we conclude that for DTNs with an even number of nodes and circular traffic pattern, the maximum per-flow throughput is λ∗ = N Bβ/4. We subsequently only consider traffic rate that is smaller than λ∗ .
3.3 Performance Metric For DTN scenarios studied in our paper where the nodes are not power constrained, the performance metric of interest is the delivery performance. We focus on the packet delivery delay, defined as the time duration from when a packet is generated to the time when the packet is first delivered to the destination. Our systemwide optimization goal is to minimize the average delivery delay of all packets of all flows.
5. TWO-HOP SINGLE-COPY RELAY 220 200
Delivery delay
180 160 140 120 100 80 60 40 210 30 50
100 200 Spray-and-wait counter
epidemic routing
Figure 2: The existence of an optimal spray-and-wait counter. Network setting: (N = 101, β = 0.0049, B = 2, λ = 0.05). All nodes use same spray-and-wait counter.
4.
IMPACT OF COUNTER ON ROUTING PERFORMANCE
As we stated earlier, under limited link bandwidth, a key research issue is how to schedule the transmission of packets to optimize performance. Such a scheduling can be done either by data source nodes and/or each node’s local buffer management scheme. Existing routing schemes typically focus on individual nodes’ transmission scheduling and buffer management, assuming that the routing scheme chosen by source nodes are fixed. As there are theoretical and practical difficulties with the above approach, we seek alternative solutions in this paper for improving routing performance via routing control from source nodes. Specifically, we assume that the transmission scheduling of each node is given, and we explore whether source nodes can vary their counter values for packet replication such that the routing performance can be improved. To pursue this direction, we conduct a set of simulations of binary spray-and-wait scheme and epidemic routing scheme under the network setting given by N = 101, β = 0.0049, B = 2, λ = 0.05. All nodes adopts same local transmission scheduling. Under binary spray-and-wait scheme with a counter value of L, the source packet is assigned a token value of L upon generation. When a node u carrying the packet with n(n > 1) tokens meets a relay node v that does not carry a copy, node u copies the packet to node v and split the n tokens in half with node v. When a node has 1 token left, it only delivers the packet to the destination (no more replicating). Our simulation results shown in Figure 2 shows that there exists an optimal counter value, denoted as L∗ , which minimizes the average packet delivery delay. Using larger and smaller counter leads to larger delivery delay. Note that L∗ depends on system parameters, one can imagine when the network load is very low, L∗ can be very large and the spray-and-wait scheme approaches to epidemic routing. The above results motivate us to explore the potential of routing control by source nodes. We attempt to understand why the counterbased relay routing schemes have optimal counter values, and how to design simple yet effective algorithms to allow source nodes to improve their routing performance by adjusting packet replicating counters. Next, we start off with formally analyzing counter-based routing schemes. To keep our analysis tractable, we focus on twohop relay schemes. We first give an accurate analysis for singlecopy two-hop relay, then we model k-copy two-hop relay scheme via a continuous time Markov Chain.
In this section, we analyze the average packet delivery delay under the two-hop single-copy relay scheme. We assume that the bandwidth of each nodal contact is B = 2. Note that since we consider an abstract model, the unit of bandwidth B can be interpreted in many different ways. B = 2 can represent that 2 packets or messages or files are exchanged per nodal contact. Without loss of generality, we will use packets per contact as B’s unit. As we assume that bandwidth is equally shared by transmissions in the two opposite directions, then one packet can be transmitted in each direction on each contact. Packets generated at a node are referred to as source packets. Recall that our traffic model assumes that there is only one destination node for source packets generated at a node. Each node has a queue for its own source packet, referred to as source queue. And a node has N − 2 other queues (called relay queues), each for a flow for which this node is a relay. Note that this node is also a destination of one flow. When a source packet arrives to a node, it is first queued in the node’s source queue. After a certain queuing delay, the packet is either directly delivered to the destination, or forwarded (not duplicated) to another node (i.e., a relay node) where the packet will be queued at the relay node’s relay queue and forwarded to the destination later. If a source node meets the destination node of its flow, it only transfers packets in its source queue (i.e. utilizes all B/2 oneway bandwidth). For other scenarios, we consider two bandwidth allocation schemes: equal allocation scheduling where relay-todestination transmission shares the B/2 bandwidth equally with source-to-relay transmission, and priority scheduling where relayto-destination transmission is given strictly higher priority over sourceto-relay transmission.
5.1 Equal Allocation Scheduling Under equal allocation scheduling, the source queue can be modeled as a M/M/1 queue. The arrival rate is per-flow packet arrival rate, λ. As the source node delivers packets to destination at the rate it meets the destination, and also forwards a source packet to a relay node when it meets one of the N − 2 relay, the service rate is β + (N − 2)β/2 = N β/2. For a meeting between a pair of nodes that are not source-destination pair, the available bandwidth is equally shared between source-to-relay traffic and relayto-destination traffic, therefore we have (N − 2)β/2 in the service rate. We obtain the average sojourn time of this queue, i.e., the total 2 time a packet spent in the queue, to be Ts = Nβ−2λ . When a packet leaves the source queue, with probability 2/N , the packet is delivered to the destination, i.e., no further delay; with probability 1 − 2/N , the packet is forwarded to a relay node. Each relay queue at a node can also be modeled as an M/M/1 queue. Packet arrives whenever the relay meets the source node of the flow with a non-empty source queue. We denote by po the 2λ probability that source queue is empty, we have p0 = 1 − Nβ . The arrival rate to the relay queue is then (1 − p0 )β/2 (only half of the meetings are used for source-to-relay transmission). The service rate of the queue is β/2, considering only half of the meetings between the relay to destination node are used for relay-todestination transmission. The sojourn time in the relay queue is 2N therefore Tr = Nβ−2λ . In summary, the average packet delivery delay is: Td = Ts + (1 − 2/N )Tr =
2N − 2 . N β − 2λ
Interestingly, the above two queues have same utilization factor, 2λ ρ = Nβ , and therefore same average queue length. Figure 3(a)
2200
1000
Simulation (95% confidence interval) Model estimated avg delay
2000
900 800
1600
Delivery delay
Delivery delay
1800
Simulation (95% confidence interval) Model estimated avg delay
1400 1200 1000
700 600 500
800
400
600
300
400
200 0
0.02 0.04 0.06 0.08 0.1 0.12 0.14 0.16 0.18 0.2 Per Flow Packet Arrival Rate
0.05 0.1 0.15 0.2 Per Flow Packet Arrival Rate
(a) Equal Allocation Scheduling
0.25
(b) Priority Scheduling
Figure 3: Two-hop single-copy relay scheme, N = 101, β = 0.0049, B = 2 compares the simulation results against the model prediction on packet delivery delay, which shows the accuracy of our model. The analysis can be easily extended to the more general case where p and (1 − p) fractions of the bandwidth are allocated to source-torelay and relay-to-destination transmission respectively.
5.2 Priority Scheduling We now consider the priority scheduling where relay-to-destination transmission is given higher priority than source-to-relay transmission. For the transmission from node i to node j where j 6= d(fi ), node i first transmits all relay packets it carries for destination j, and only transmits its own source packets to node j if there is remaining bandwidth. For a node in the network, we denote by NS the number of packets in its source queue, and NR the number of packets in the relay queue, and let r0 = P r{NR = 0} and s0 = P r{NS = 0}. We model the source queue as an M/M/1 queue. Source packets arrive to the queue with packet arrival rate, λ. A source packet leaves the queue when source node directly delivers it to the destination node (with rate Bβ/2 = β), or when source node forwards it to a relay node. Recall that source-to-relay transmission has lower priority than relay-to-destination traffic: only when the source node has no relay packet destined to the receiver, will the source packet be forwarded. Therefore, the source node forwards a source packet to a relay node with rate βr0 , and the rate that a source packet is forwarded to one of the N − 2 relay nodes is: (N − 2)βr0 . The service rate of source queue is therefore β +(N −2)βr0 . We therefore have: s0 = P r{NS = 0} = 1 −
λ . β + (N − 2)βr0
βP r{NS 6= 0}P r{NR = 0} = β(1 − s0 )r0 . The service rate of the relay queue is β, as the relay-to-destination traffic has strictly higher priority than source-to-relay traffic. Based on M/M/1 queue, we have r0 = P r{NR = 0} = 1 −
β(1 − s0 )r0 , β
which yields r0 = 1/(2 − s0 ).
(2)
The sojourn time of the relay queue is then given by Tr =
1 . β − β(1 − s0 )r0
In summary, the average packet delivery delay is: Td = Ts +
(N − 2)βr0 Tr , β + (N − 2)βr0
(3)
where r0 and s0 can be obtained by solving the equation systems Eq.(1) and Eq.(2). Fig 3.(b) compares the model predicted average delay with the simulation result which shows a very good match for λ < 0.2, with an under estimation of delivery delay when for heavier traffic rate. We observe that the prioritized scheduling outperforms equal allocation (Fig 3.(a)). As expected, such single-copy schemes yield larger packet delivery delay when compared to spray-andwait scheme (Fig 2).
(1)
The average sojourn time of the source queue is then Ts =
arrival rate to the relay queue is
1 β + (N − 2)βr0 − λ
After a source packet leaves the source queue, with probability (N − 2)βr0 , β + (N − 2)βr0 the packet enters a relay queue, where it experiences another delay before being forwarded to the destination, which will be analyzed below. We model the relay queue as an M/M/1 queue. A packet arrives to a relay queue, when the relay node meets the source node with non-empty source queue, and the source node carries no relay packet that is destined to the relay node. Therefore the packet
6. MODELING STUDIES OF TWO-HOP K COPY SCHEME When per-flow traffic rate is low, the two-hop relay scheme does not fully utilize available network bandwidth. To reduce packet delivery delay, a packet can be replicated in the network and therefore multiple copies of the packet are propagated simultaneously through multiple paths. We consider a simple multi-copy routing scheme, two-hop K-copy scheme, in this section.
6.1 Two-hop K -Copy Scheme Under two-hop K-copy scheme, the source node can replicate a source packet to up to K relay nodes; each of the relay nodes can only forward the packet to the destination. As there might be multiple copies of a packet in the network, when the destination node first receives a packet, it generates and stores an anti-packet. When the destination node encounters another node, it transmits
the anti-packet to the other node to “recover” the other node from the packet, i.e., to ask them to discard the copies they carry. This is so called recovery scheme [20]. We consider IMMUNE recovery scheme where destination node keeps and propagates anti-packets to infected nodes, infected nodes upon receiving an anti-packet, delete the corresponding packet and store the anti-packet. More specifically, when two nodes i and j encounter each other, they first exchange signaling message which includes anti-packets and the IDs of of the packet that they carry. As before, the total bandwidth B is equally allocated to transmission in the two opposite directions. Now consider the transmission from node i to node j. If node j is the destination node of flow fi , all available bandwidth (B/2) is used for source-destination transmission. Otherwise, node i schedules source-relay transmission with probability PSR , and relay-destination transmission with probability PRD (= 1 − PSR ). Within each type of transmission, randomized scheduling is used to pick a packet from all eligible packets. We refer to the above transmission scheduling scheme as proportional allocation with randomized scheduling. The above two-hop K-copy scheme combined with proportional allocation with randomized scheduling represents two important aspects of a DTN routing scheme. First, the choice of PSR and PRD of a node represents how cooperative (or selfish) a node is. The larger the value of PSR , the more selfish a node is. Second, the choice of K allows a source node to adjust its intended usage of available bandwidth in the network to reduce the packet delivery delay.
6.2 Modeling of two-hop K -copy scheme We model the two-hop K-copy scheme for the homogeneous case where all nodes use the same PSR and K. We use a continuous time Markov Chain (MC) to model a packet’s lifetime in the network, coupled with queuing analysis of the source queue and relay queue.
6.2.1 Markov Chain Model of A Packet’s Life Time In this section, we present a Markov Chain that models the propagation and delivery of a typical packet in the network. For easy of explanation, we denote this packet as P . The state diagram of the MC is shown in Figure 4. The states of the MC are denoted as (SI , RI , R), where SI takes 0, 1 value and denotes whether the source node has a copy of the packet, RI denotes the number of infected relay nodes and takes integer values ranging from 0 to K, and R denotes whether the packet has been delivered (with value 1) or not (with value 0). We represent the state where the source node has recovered from the packet (and there are different numbers of infected relay nodes) as (0, ∗, 1). This MC is reducible and transient, where state (0, ∗, 1) is absorbing state and state (1, 0, 0) (the initial state) cannot be reached from any other state. We first introduce a few terms. Let NSD denote the number of eligible source packets to be transmitted to the destination node, when the source node meets the destination node, and E[NSD ] denote its expected value. And let NSR denote the number of source packets in the source node that are eligible to be transmitted to a relay node, and E[NSR ] denote its expected value. Finally let NRD denote the number of relay packets that are eligible to be transmitted to the destination node when the two nodes meet, and E[NRD ] denote its expected value. We will discuss how to evaluate them in Section 6.2.3. There are four types of transitions in the MC, labeled as S-R, S-D, R-D and D-S respectively in the diagram. The S-D transition occurs when the source node node meets the destination which
S-R
1,0,0 S-D
S-R
1,1,0 S-D
S-R
R-D
R-D S-R
1,0,1 D-S
S-R
S-R
1,K,0
1,K-1,0
1,2,0 S-D
S-R
R-D
S-D
S-D
R-D
S-R
S-R
1,K-2,1
1,1,1
1,K-1,1
D-S D-S D-S
0,*,1
Figure 4: MC model of a packet’s lifetime under two-hop Kcopies scheme
has not received packet P yet, and packet P is chosen to be transmitted from all eligible source-to-destination packets. The source node meets the destination node with a rate of β. During the sourcedestination encounter, destination node transmits anti-packets of delivered packets to the source node, allowing source node to remove from the source queue all source packets that have already been delivered (by some relay node). Subsequently, the source node uniformly randomly chooses a packet from the set of all source packets (there are NSD such packets) to transmit to the destination. The probability that packet P is chosen is 1/NSD . Thus, the S-D transition rate is β/NSD , and is approximated as β/E[NSD ]. The S-R transition occurs when the infected source node meets a susceptible relay node that does not carry a copy of packet P and P is chosen to be transmitted from all eligible source-relay packets. The rate that the source node meets a susceptible relay node is (N − 2 − RI )β, where N − 2 − RI is the number of susceptible relay nodes. With uniformly random scheduling, the probability that packet P is chosen to transmit is 1/NSR , which we approximate using 1/E[NSR ]. The S-R transition rate is then (N − 2 − RI )PSR β/E[NSR ]. The R-D transition occurs when a relay node that carries packet P meets the destination node that has not received the packet yet, and the relay node chooses packet P from the set of all eligible relay-destination packets. The encountering rate between infected relay nodes and the destination node is RI β. With probability PRD , the encountering performs relay-destination transmission. The probability that packet P is chosen to transmit depends on the number of relay packets that are eligible to be transmitted to destination node, i.e., NRD . Under uniformly random scheduling, we estimate the R-D transition rate as RI βPRD /E[NRD ]. Finally, D-S transition occurs when the destination node that has already received packet P meets the source node, allowing the source node to delete its copy. Assuming there is no bandwidth constraint for control signaling (a reasonable assumption when control messages are very small compared to data messages), the D-S transition rate is β, the rate that the source node meets the destination node.
6.2.2 Packet Delivery Delay, Propagation Duration and Number of Copies in Network We now derive average packet delivery delay (E[Td ]), average packet propagation duration (E[T[ ]), and average number of copies in the network (E[Cr ]) from the MC model. The packet delivery delay is of interests in its own right, where the other two metrics are needed for estimating E[NSD ], E[NSR ] and E[NRD ]. Let Td denote packet delivery delay and E[Td ] its average value. To calculate E[Td ], we consider the simplified MC (Figure 5(a))
S-R
S-R
1,1,0
1,0,0
S-R
S-R
S-R
1,K-1,0
1,2,0
S−R
1,K,0
R-D,S-D
R-D,S-D
1,1,0
1,0,0 S−D
R-D, S-D
S−R
S−R
S−R
S−R
S−R,S−D S−D
S−D
S−D R−D S−R
R-D,S-D
1,0,1
R−D
R−D
R−D S−R
S-D
1,K−1,0
1,K−2,0
1,2,0
S−R
S−R
1,K−3,1
1,1,1
1,K−2,1
D−S D−S
D−S D−S,S−R
D
Stop
(a) a packet’s lifetime until delivery
(b) a packet’s propagation
Figure 5: MC models of a packet’s lifetime under two-hop K-copy scheme that focuses on capturing delivery delay of the packet. We observe that Td is the duration for the system to enter the state D, starting from the initial state (1, 0, 0). E[Td ] can be calculated by a recursive numerical solution to the MC model. However, note that the transition rates in the MC model involve quantities such as E[NSD ], E[NSR ] and E[NRD ] which in turns depends on E[Td ], E[Tp ], and E[Cr ] (as discussed in the next section). This suggests that a fixed point method is needed to solve the model (Section 6.2.4). Let Tp denote Packet propagation duration, i.e., the duration of time from when a packet is generated by the source node, to the time when the source node stops propagating the packet to relay nodes. Note that the source node stops propagating the packet, after K copies of the packet has been sent or after meeting the destination node which has already received the packet. To calculate E[Tp ], we consider the simplified MC as shown in Figure 5(b) that focuses on capturing the propagation of the packet by the source node. Tp is the duration of time for the system to enter state stop, starting from initial state (1, 0, 0). We evaluate E[Tp ] using a similar approach as that for E[Td ]. Another useful metric is the average number of copies that packet P has in the network during its propagation duration, denoted as Cr , and its expected value as E[Cr ]. We evaluate E[Cr ] based on the MC in Figure 5(b).
6.2.3 Evaluating E[NSD ], E[NSR ], and E[NRD ] Recall that E[NSD ] represents the average number of eligible source packets to be transmitted to the destination node, when a source node meets the destination node. Source packets arrive to the source node with rate λ, and the duration of time that a packet remains eligible to be transmitted to the destination is the time from the packet generation to the time the packet is delivered, i.e., the packet delivery delay Td . Little’s Law yields E[NSD ] = λE[Td ]. We now estimate E[NSR ], the average number of source packets that are eligible to be transmitted to a particular relay node (denoted as r), when the source node encounters the said relay node. Source packets arrive to the source node with a rate of λ, and the duration of time that a source packet remains eligible to be transmitted to relay nodes is the packet propagation duration Tp . Therefore the source node has in average λE[Tp ] source packets that are eligible to be transmitted to relay nodes, based on Little’s Law. However, relay node r might already carry copies of some of these packets. Recall that E[Cr ] represents the average number of relay nodes in the network that carries a packet during the packet’s lifetime. As all relay nodes have equal probability of carrying a copy of a r] packet, relay node r has probability E[C of carrying a copy of a N−2
particular packet. The number of packets that relay node r already r] has a copy of follows a binomial distribution, B(λE[Tp ], E[C ), N−2 r] . Consequently, among the λE[Tp ] sourcewith mean λE[Tp ] E[C N−2 relay packets that the source node carries, relay node r in average r] packets. So the number has already carries a copy for λE[Tp ] E[C N−2 of source packets that are eligible to be transmitted to relay node r (i.e., r does not carries a copy of) is:
E[NSR ] = λE[Tp ] − λE[Tp ]
E[Cr ] E[Cr ] = λE[Tp ](1 − ). N −2 N −2
We estimate E[NRD ] as follows. Packet arrives to the relay node whenever the relay node meets the source node which has some eligible packets to copy, i.e., the arrival rate is βPSR 1{NSR > 0}, which we approximate by its expected value βPSR P r{NSR > 0}. As NSR can be approximated as a binomial distributed random variable, we have: P r{NSR > 0} ≈ 1 − (1 −
E[Cr ] λE[Tp ] ) . N −2
The time that a relay packet remains eligible to be transmitted to the destination is the remaining time to deliver the packet1 , which varies with the current number of copies of the packet in the network. We use its upper bound Td ’s expected value to approximate it, and obtain the following estimation by Little’s Law: E[NRD ] ≈ βPSR P r{NSR > 0}E[Td ].
6.2.4 Iterative Solution of the Model We note that the transition rates in the MC model involve quantities such as E[Td ], E[Tp ], and E[Cr ], which are derived from the same MC model. This suggests the following iterative approach to find a fixed point solution. We first assign randomly chosen initial values to E[Td ],E[Tp ], E[Cr ], then enters a loop where in each iteration i) the transition rates of the MC models are set based on the values of the above three quantities, ii) the MC models are then solved for new values for the three quantities. The loop stops when the values of E[Td ], E[Tp ], E[Cr ] have converged. For each network setting and the value of PRD and K, we run the above iterative algorithm for 100 runs with each run initialized with randomly chosen E[Td ], E[Tp ], E[Cr ].
1 If the packet has been delivered, this relay node deletes the packet upon encountering the destination.
2000
700
1800 Average Delivery delay
Average Delivery Delay
600 500 400 300 λ=0.05, model λ=0.08, model λ=0.1, model λ=0.05,simulation λ=0.08, simulation λ=0.1, simulation
200 100 0 0
5
10 15 20 Number of copies, K
25
Simulation model
1600 1400 1200 1000 800 600 400 200 0 0.1 0.2 0.3 0.4 0.5 0.6 0.7 0.8 Bandwidth allocated to Relay-Destination Transmission, PRD
30
(b) N = 101, λ = 0.05, β = 0.0049, Varying PRD
(a) N = 101, β = 0.0049, PRD = 0.5
Figure 6: Comparison of model predicted delivery delay and simulation results for 2-hop k-copies schemes
6.2.5 Model Validation To validate the model, we perform simulation studies and compare the model predicted average delivery delay with that observed from simulations. Recall that nodes mobility is modeled by pairwise exponential inter-meeting times. Network traffic load, λ, is varied within the network capacity region (Section 3). We first examine the effect of varying K on the average delivery delay. Figure 6(a) plots the average delivery delay under twohop K-copy scheme with various K under three different per-flow traffic rates, comparing the model predicted delivery delay with the simulation result. Both simulation results and model results demonstrate that there exists an optimal K value under which the average delivery delay is smallest. We observe that there exists certain discrepancy between the model prediction and simulation result, however the model prediction not only captures the trend of the curve, but also predicts the optimal K value accurately. This optimal K value varies for different per-flow traffic rate, λ. In particular, the optimal K value is larger when λ is small. Intuitively, under a light traffic load, there are more free bandwidth available in the network for two-hop K-copies scheme to take advantage of. We also observe that when K takes a value larger than the optimal value, the delivery delay first increases sharply and then levels off. This is because when a large K is used, there are more source-relay packets competing for the source-relay transmission opportunities. The imperfect scheduling (randomized scheduling within same traffic) allows packets that have been duplicated more times (or have been delivered) in the network to compete with packets that just start propagating in the network, leading to degraded performance. However, such increases in delay diminish as K increases further, due to the recovery scheme employed. In fact, when the source node encounters the destination node that has received the packet, it stops propagating the packet immediately. This effect keeps the number of copies made for a packet limited. We next study the impact of different bandwidth allocation on the average delivery delay. Figure 6(b) plots the average delivery delay under two-hop 2-copy scheme under various PRD , with per-flow packet arrival rate of λ = 0.08. We observe that the average delivery delay first decreases and then increases, as PRD (the proportion of bandwidth allocated to relay-destination transmission) increases. When PRD increases, it has two opposite effects on delivery delay. On the one hand, it allows more bandwidth to be allocated for relay-destination transmission and enables faster delivery from relays to the destination. On the other hand, it leaves less bandwidth for source-relay transmission and slows down packet propagation (and therefore delivery). When PRD is small, the former effect outweighs the latter, leading to reduced delivery delay when PRD is
increased; when PRD reaches a certain value, the latter effect outweighs the former, and the delivery delay increases when PRD is increased. Generally, the optimal PRD value varies for different K and network load.
7. HEURISTIC SOURCE CONTROL Our modeling and simulation result suggests that routing control via source nodes’ adjusting of counter values can be used to improve routing performance. To illustrate this potential benefit, we now propose a heuristic scheme where network nodes collaboratively find the optimal counter value in an adaptive, distributed, and asynchronous fashion. Each node runs in a sequence of rounds. When a node adjusts its counter (spray-and-wait counter or K in two-hop K-copy scheme), it enters a new round. For the initial two rounds, nodes use cmin and cmin + cinc counter values, where cmin is a pre-set minimum counter value and cinc is the increment step. During each round, a node collects information about the delivery delay of packets transmitted using the current counter value2 . After enough information has been collected, a node adjusts its counter and enters the next round. Each node stores history information about counter values that have been tried before as a vector of tuple (c, Tdc , Vdc ), i.e., counter value c, corresponding average delivery delay Tdc , and delay variance Vdc . Nodes collaborate in their search for optimal counter value by exchanging control information when they encounter each other. Specifically, if the two nodes are in the same round, they average their counter values. Otherwise, the node with smaller round number copy the other node’s round number and counter value. The history information are also exchanged and updated, with newer information overrides older one. Each node monitors the average and coefficient of variance of delivery delay for all packets delivered using current counter value, and checks if the criteria for starting a new round of counter adjustment are satisfied. Possible criteria include threshold values for number of delivery delay samples, the coefficient of variance of delivery delay, and number of source queue length (NSD ) observations. Suppose that node i has observed the average delay for packets using counter ck to be dk . Let c∗ be the counter value that achieved smallest average delivery delay in history (denoted by d∗ ). If node i decides to adjust its counter value, it follows the following rules to choose the new counter value. 1. If ck > c∗ and dk > d∗ , then ck+1 := (c∗ + ck )/2. 2
The anti-packets are extended to include packet delivery delay.
200
6
180
5
Packet delivery delay
Counter used (average over all nodes)
7
4 3 2 1
160 140 120 100 80
0
60
-1 0
5000
10000 Time
15000
20000
(a) Counter used by nodes over time
0
2000 4000 6000 8000100001200014000160001800020000 time
(b) Average delivery delay (averaged over 100s) over time
Figure 7: Dynamically adjusting K for two-hop K-copy scheme under N = 101, λ = 0.05, β = 0.0049, PRD = 0.5 case 2. If ck > c∗ and dk < d∗ , then ck+1 := ck + cinc .
9. ACKNOWLEDGEMENT
3. if ck < c and dk > d , then ck+1 := (c + ck )/2.
This research was supported in part by NSF under grant award CNS-0845500. We are grateful to Don Towsley for his very helpful comments on the paper. We also thank the reviewers for their suggestions and comments.
∗
∗
∗
4. if ck < c∗ and dk < d∗ , then ck+1 := ck − cdec . The cdec is the decrement step. The rationale behind these rules is to let a node search for the minimum point in the U-shape curve of the delivery delay as a function of the counter value (e.g., Figure 2). We conduct simulations to evaluate this simple heuristic scheme, using a threshold value of 200 for the number of delivery delay samples as the adjusting criteria. Figure 7.(a) plots the average counter used averaged over all nodes under the given simulation setting, and Figure 7.(b) plots the average packet delay’s change over time. We can see that source nodes can quickly learn optimal counter value. These initial results illustrate the benefits of routing control via source nodes choosing optimal counters. To design an effective adaptive algorithm with guaranteed convergence, there are many issues to be addressed, for example, how to choose adjusting criteria and steps (cinc and cdec ). We leave this as our future work.
8.
SUMMARY AND FUTURE WORK
In this work, we studied how to improve DTN routing performance via source control. We first showed that there exists an optimal counter value that achieve minimum average network-wide packet delivery delay. Then in order to understand multi-hop multicopy DTN routing schemes, we modeled the two-hop K-copy scheme via a continuous time Markov Chain. This modeling analysis provides insights into the impact of counter on routing performance and further suggests the existence of optimal counter value. We also derived the capacity region of DTN routing and provided an accurate analysis of the average packet delivery delay of the twohop single-copy relaying scheme. Relying on the insights gained from the model, we proposed an adaptive scheme that allow nodes to adjust their counter values (in search for an optimal counter value that minimize packet delivery delay). Our initial evaluation of this scheme demonstrated its effectiveness and suggested the potential of this approach for improving DTN routing performance. For the future work, we plan to investigate the more general case of multi-copy multi-hop DTN routing schemes, using the insights we obtained from the two-hop K-copy scheme. We will also explore the effects of mobility models, in particular, mobility models with inter-meeting time of power law and exponential decay, and real mobility traces.
10. REFERENCES [1] A. Balasubramanian, B. N. Levine, and A. Venkataramani. DTN Routing as a Resource Allocation Problem. In ACM Conference on Applications, Technologies, and Protocols for Computer Communication (SIGCOMM), 2007. [2] J. Burgess, B. Gallagher, D. Jensen, and B. N. Levine. MaxProp: Routing for Vehicle-Based Disruption-Tolerant Networks. In IEEE International Conference on Computer Communications (INFOCOM), 2006. [3] H. Cai and D. Y. Eun. Crossing over the bounded domain: From exponential to power-law inter-meeting time in manet. In ACM Conference on Mobile Computing and Networking (MOBICOM), 2007. [4] J. Eriksson, H. Balakrishnan, and S. Madden. Cabernet: Vehicular content delivery using wifi. In ACM Conference on Mobile Computing and Networking (MOBICOM), 2008. [5] R. Groenevelt, P. Nain, and G. Koole. The Message Delay in Mobile Ad Hoc Networks. In Performance, 2005. [6] M. Grossglauser and D. N. C. Tse. Mobility increases the capacity of ad-hoc wireless networks. In IEEE/ACM Transactions on Networking, volume 10, No. 4, pages 477–486, 2002. [7] Z. J. Haas and T. Small. A New Networking Model for Biological Applications of Ad Hoc Sensor Networks. IEEE/ACM Transactions on Networking, 14, No. 1:27–40, 2006. [8] A. A. Hanbali, A. A. Kherani, and P. Nain. Simple models for the performance evaluation of a class of two-hop relay protocols. In IFIP Networking, 2007. [9] S. Jain, K. Fall, and R. Patra. Routing in a Delay Tolerant Network. In ACM Conference on Applications, Technologies, and Protocols for Computer Communication (SIGCOMM), 2004. [10] A. Jindal and K. Psounis. Contention-aware performance analysis of mobility-assisted routing. In IEEE Transactions on Mobile Computing, volume 8, No. 2, pages 145–161, 2009. [11] T. Karagiannis, J.-Y. L. Boudec, and M. Vojnovic. Power law and exponential decay of inter contact times between mobile
[12]
[13]
[14]
[15]
[16]
devices. In ACM Conference on Mobile Computing and Networking (MOBICOM), 2007. A. Krifa, C. Barakat, and T. Spyropoulos. Optimal buffer management policies for delay tolerant networks. In IEEE Communications Society Conference on Sensor, Mesh and Ad Hoc Communications and Networks (SECON), 2008. U. Lee, S. Y. Oh, K.-W. Lee, and M. Gerla. Scaling property of delay tolerant networks in correlated motion patterns. In ACM SIGCOMM Workshop on Challenged Networks (CHANTS), 2009. T. Leighton and S. Rao. Multicommodity max-flow min-cut theorems and their use in designing approximation algorithms. In Journal of the ACM, volume 46, Issue 6, 1999. T. Small and Z. J. Haas. Resource and performance tradeoffs in delay-tolerant wireless networks. In SIGCOMM Workshop on Delay Tolerant Networking (WDTN), 2005. T. Spyropoulos, K. Psounis, and C. Raghavendra. Efficient
[17]
[18]
[19]
[20]
Routing in Intermittently Connected Mobile Networks: The Multi-copy Case. In ACM/IEEE Transactions on Networking, 2007. T. Spyropoulos, K. Psounis, and C. S. Raghavendra. Spray and wait: an efficient routing scheme for intermittently connected mobile networks. In SIGCOMM Workshop on Delay Tolerant Networking (WDTN), 2005. A. Vahdat and D. Becker. Epidemic Routing for Partially Connected Ad Hoc Networks. Technical Report CS-200006, Duke University, April 2000. X. Zhang, J. F. Kurose, B. Levine, D. Towsley, and H. Zhang. Study of a bus-based disruption tolerant network: Mobility modeling and impact on routing. In ACM Conference on Mobile Computing and Networking (MOBICOM), 2007. X. Zhang, G. Neglia, J. Kurose, and D. Towsley. Performance Modeling of Epidemic Routing. IFIP Networking, 2006.