Without tamoxifen treatment, X-gal positive cells are not detected in .... White and yellow arrowheads indicate Hes1+ duct/centroacinar and Hes1+ acinar cells ...
Impact of Sox9 Dosage and Hes1-mediated Notch Signaling in Controlling the Plasticity of Adult Pancreatic Duct Cells in Mice
Shinichi Hosokawa1,3,Kenichiro Furuyama1,3, Masashi Horiguchi1,3,Yoshiki Aoyama1,3,Kunihiko Tsuboi1,3,Morito Sakikubo1,3 Toshihiko Goto1,3,Koji Hirata1,3,Wataru Tanabe3,5 ,Yasuhiro Nakano3, Haruhiko Akiyama2, Ryoichiro Kageyama4, Shinji Uemoto1 and Yoshiya Kawaguchi3,*
Sox9CreERT2; Hes1f/f;Rosa26R
Sox9CreERT2; NICD;Rosa26R
TM(-)
Sox9CreERT2 ; Hes1+/+;Rosa26R
Supplementary Figure S1: Negative control experiment for Sox9 lineage-tracing study. Without tamoxifen treatment, X-gal positive cells are not detected in Sox9CreERT2; Hes1+/+; Rosa26R, Sox9CreERT2; Hes1loxp/loxp; Rosa26R and Sox9CreERT2; RosaNICD; Rosa26R. Scale bars = 100 μm.
X-gal
Hes1/DAPI
X-gal/Hes1/DAPI
Sox9CreERT2; Hes1f/f;Rosa26R
Sox9CreERT2; Hes1+/+;Rosa26R
A
Supplementary Figure S2 A. Hes1 expression was completely deleted in lineage-labeled duct cells. X-gal positive, lineage-labeled duct cells contain Hes1-expressing cells in Sox9CreERT2; Hes1+/+; Rosa26R mice (upper panels), whereas in Sox9CreERT2; Hes1loxp/loxp; Rosa26R mice, Hes1 expression was not detected in lineage-labeled duct cells (white dotted lines in bottom panels). Note that Hes1-expressing cells were conserved in X-gal- ducts (bottom panels, yellow dotted lines) at the same frequency of that in wild type or Sox9CreERT2 mice without tamoxifen treatment . Scale bars = 25 μm. B. Lineage-labeled acinar cells contain Notch-activated and non-activated cells in Sox9CreERT2; RosaNICD; Rosa26R mice. In Sox9CreERT2; RosaNICD; Rosa26R mice, X-gal positive acinar cells are composed of EGFPpositive and negative populations, the former indicating successful recombination of both Rosa26R and Rosa NICD-IRES-EGFP alleles (compare the absence of X-gal and EGFP-double positive cells in the upper and middle panels). Activated Notch signaling by NICD induction was confirmed by X-gal, Hes1 double positive acinar cells (bottom panels). Yellow arrows indicate EGFP+/X-gal+ or Hes1+/X-gal+ acinar cells. White arrows indicate EGFP-/X-gal+ or Hes1-/X-gal+ acinar cells. Scale bars = 25 μm.
Sox9CreERT2; NICD;Rosa26R
Sox9CreERT2; NICD;Rosa26R
Sox9CreERT2; Hes1+/+;Rosa26R
B X-gal EGFP X-gal/EGFP/DAPI
X-gal Hes1 X-gal/Hes1/DAPI
1year
2months
1month
A
B Sox9CreERT2;
Sox9CreERT2;
Hes1f/+;Rosa26R
Hes1f/f;Rosa26R
X-gal
Ins/Glu/DAPI
islet
islet
islet
Supplementary Figure S3: Hes1 is dispensable for the maintenance of progenitor population. (A) Long-term chase at 1 month, 2 months and one year after single tamoxifen injection. As time proceeds, lineage-labeled acinar cells gradually expanded in number in both Sox9CreERT2; Hes1loxp/+; Rosa26R and Sox9CreERT2; Hes1loxp/loxp; Rosa26R mice (representative pictures are shown). Notably, even one year after tamoxifen injection, pancreatic duct cells retain their X-gal labeled status and X-gal positive acinar cells are broadly spread, suggesting that Hes1 is dispensable for the self-duplication of Sox9-expressing progenitor cells and differentiation into the acinar cell type. (B) No X-gal-labeled cells are observed in insulin+ (green) or glucagon+ (red) endocrine cells even in the long-term chase periods. Scale bars = 100 μm.
A
TM TM TM TM
0
4
6
Sox9CreERT2; Hes1+/+;Rosa26R
7
Sox9CreERT2; Hes1f/f;Rosa26R
Sox9CreERT2; NICD;Rosa26R
Hes1/CK19/DAPI
B
2
analysis
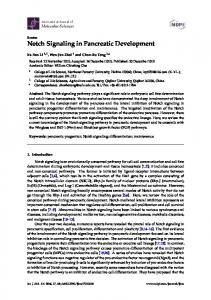
Supplementary Figure S4: Modulation of Notch activity by high-dose tamoxifen treatment. (A) To get more efficient recombination, tamoxifen was injected four times. (B) High dose tamoxifen treatment resulted in a decrease and increase in the number of Hes1-expressing cells in Sox9CreERT2; Hes1loxp/loxp; Rosa26R and Sox9CreERT2; RosaNICD; Rosa26R mice, respectively. White and yellow arrowheads indicate Hes1+ duct/centroacinar and Hes1+ acinar cells, respectively. Scale bars = 50 μm.
Ptf1a
Hes1/Ptf1a/DAPI
HE
Sox9CreERT2; NICD;Rosa26R
Sox9CreERT2; Hes1+/+ ;Rosa26R
Hes1
Supplementary Figure S5: Emergence of Hes1/Ptf1a double positive acinar cells by NICD induction. In Sox9CreERT2; RosaNICD; Rosa26R mice (lower panels), acinar cells contain Hes1/Ptf1a double positive cells (yellow arrows) which were not detected in the control mice (upper panels). Scale bars = 25 μm.
Supplementary Table1 The ratio of Sox9 positive cells among all epithelial cells (% of total DAPI+ cells) Genotype
n
% of total epithelial cells
Wild type
P1
3
13.3±0.23
(Sox9+ / DAPI+ : 2634/19707)
Sox9CreERT2
P1
3
12.7±0.97
(Sox9+ / DAPI+ : 2690/21756)
Wild type
adult
3
9.11±0.22
(Sox9+ / DAPI+ : 8390/92352)
Sox9CreERT2
adult
3
9.22±0.68
(Sox9+ / DAPI+ : 8138/88064)
The numbers shown represent the means number ± standard error of the means(s.e.m)
Supplementary Table2
Hes1 co-localization among CK19+ ductal population (% of total CK19+ cells counted) Adult pancreas
Genotype
n
% of total duct cells
Wild type
3
62.1±1.62
(Hes1+CK19+ / total CK19+ : 647 /1122 )
Sox9CreERT2
3
63.6±1.57
(Hes1+CK19+ / total CK19+ : 693 /1084 )
The numbers shown represent the means number ± standard error of the means(s.e.m)
Supplementary Table3
Number of lineage labeled acinar cells counted day 3 Genotype
X-gal+ acinar cells/20fields
Sox9CreERT2;Hes1+/+;Rosa26R
664
Sox9CreERT2;Hes1+/+;Rosa26R
609
Sox9CreERT2;Hes1+/+;Rosa26R
511
Sox9CreERT2;Hes1loxp/loxp;Rosa26R
709
Sox9CreERT2;Hes1loxp/loxp;Rosa26R
1188
Sox9CreERT2;Hes1loxp/loxp;Rosa26R
1250
Sox9CreERT2;Hes1loxp/loxp;Rosa26R
1413
Sox9CreERT2;Hes1loxp/+;Rosa26R
332
Sox9CreERT2;Hes1loxp/+;Rosa26R
520
Sox9CreERT2;Hes1loxp/+;Rosa26R
531
Sox9CreERT2;Hes1loxp/+;Rosa26R
588
Sox9CreERT2;RosaNICD;Rosa26R
220
Sox9CreERT2;RosaNICD;Rosa26R
510
Sox9CreERT2;RosaNICD;Rosa26R
355
Sox9CreERT2;RosaNICD;Rosa26R
146
average
594
1140
492
308
day 10 Sox9CreERT2;Hes1+/+;Rosa26R
1811
Sox9CreERT2;Hes1+/+;Rosa26R
1913
Sox9CreERT2;Hes1+/+;Rosa26R
1231
Sox9CreERT2;Hes1+/+;Rosa26R
2011
Sox9CreERT2;Hes1loxp/loxp;Rosa26R
2800
Sox9CreERT2;Hes1loxp/loxp;Rosa26R
3402
Sox9CreERT2;Hes1loxp/loxp;Rosa26R
2393
Sox9CreERT2;Hes1loxp/loxp;Rosa26R
2841
Sox9CreERT2;Hes1loxp/+;Rosa26R
779
Sox9CreERT2;Hes1loxp/+;Rosa26R
2262
Sox9CreERT2;Hes1loxp/+;Rosa26R
2035
Sox9CreERT2;Hes1loxp/+;Rosa26R
1131
Sox9CreERT2;RosaNICD;Rosa26R
1138
Sox9CreERT2;RosaNICD;Rosa26R
672
Sox9CreERT2;RosaNICD;Rosa26R
774
Sox9CreERT2;RosaNICD;Rosa26R
846
1741
2859
1551
857
Supplementary Table4
The ratio of Sox9 positive cells among all epithelial cells (% of total DAPI+ cells) Adult pancreas Genotype
n
Sox9CreERT2
3
9.39±0.83
(Sox9+ / DAPI+ : 7268/75825)
Sox9CreERT2 ;RosaNICD
3
9.18±0.54
(Sox9+ / DAPI+ : 9118/99306)
Sox9CreERT2 ;Hes1loxp/loxp
3
8.09±0.17
(Sox9+ / DAPI+ : 7938/98487)
% of total epithelial cells
The numbers shown represent the means number ± standard error of the means(s.e.m)
Supplementary Table 5
Primary Antibodies
Antigen
Species
Dilution
Supplier
Amylase
Rabbit
1:1000
Sigma
Amylase
Goat
1:100
Santa Cruz
CK19
Rat
1:500
DSHB
Glucagon
Rabbit
1:400
DAKO
GFP
Chicken
1:500
abcam
Hes1
Rabbit
1:5000
Dr.Sudo
Insulin
Guinea Pig
1:400
DAKO
PECAM-1
Rat
1:20
BD Biosciences
Ptf1a
Rabbit
1:10000
Dr.Hoshino
Sox9
Rabbit
1:1000
Millipore
Sox9
Goat
1:50
Santa Cruz
Supplementary Table 6
Secondary Antibodies
Conjugate
Antigen
Species
Dilution
Supplier
Alexa Fluor488
Mouse IgG
Goat
1:1000
Molecular Probes
Alexa Fluor488
Rabbit IgG
Donkey
1:1000
Molecular Probes
Alexa Fluor488
Guinea pig IgG
Goat
1:1000
Molecular Probes
Alexa Fluor488
Goat IgG
Donkey
1:1000
Molecular Probes
Cy3
Rat IgG
Donkey
1:500
Chemicon
Cy3
Rabbit IgG
Donkey
1:500
Chemicon