CLIMATE RESEARCH Clim Res
Vol. 8: 225-237.1997
I
Published October 9
Impacts of climate change on net productivity of coastal waters: implications for carbon budgets and hypoxia Dubravko
Justi61r*,
Nancy N. Rabalais2,R. Eugene urne er'
'Coastal Ecology Institute and Department of Oceanography and Coastal Sciences. Louisiana State University, Baton Rouge, Louisiana 70803. USA 2Louisiana Universities Marine Consortium, 8124 Hwy 56, Chauvin, Louisiana 70344, USA
ABSTRACT: General circulation models predict that freshwater discharge from the Mississippi River (USA)to the coastal ocean would increase 20% if atmospheric CO2concentration doubles. Here we use a coupled physical-biological 2-box model to investigate the potential impacts of increased freshwater and nutrient inputs on the production and decay of organic matter in the coastal waters of the northern Gulf of Mexico. Model results for a doubled CO2 climate indicate that the annual net productivity of the upper water column (NP, 0 to 10 m) is likely to increase by 65 g C m-' yr-', relative to a 1985-1992 average (122 g C m-' yr-'). Interestingly, this projected increase is of the same magnitude as the one that has occurred slnce the 1940s due to the introduction of anthropogenlc nutrients. An increase in annual NP of 32 g C n1r2 yr-' was observed during the Great Mississippi River Flood of 1993, thus indicating the general validity of a doubled CO2 scenario. The total oxygen uptake in the lower water column (10 to 20 m), in contrast, IS likely to remain at its present value of about 200 g O2 m-' yr-'. Thus, carbon export and burial, rather than in situ respiration, are likely to be the dominant processes balancing coastal carbon budgets, leading perhaps to an expanded extent of the hypoxic zone. KEY WORDS: Climate change . Mississippi River. Gulf of Mexico - Net productivity . Carbon budget. Hypoxia . Eutrophication
1. INTRODUCTION
Since the turn of the century, the combined land and sea surface temperature averages increased by approximately 0.5"C on a worldwide basis (Kerr 1990, NOAA 1994). This increasing temperature trend is thought to be a consequence of increasing atmospheric concentrations of 'greenhouse' gasses, primarily carbon dioxide (CO2). Concentrations of CO2 in the atmosphere increased from 280 parts per million by volume (ppm,) in the mid 1700s (Neftel et al. 1985) to about 360 ppm, at present (Thorning et al. 1989, NOAA 1994), and continue to increase at an annual rate of about 0.4%. General circulation models (GCMs) that include radiative forcing of enhanced greenhouse gas concentrations, predict a global tem'E-mail:
[email protected] 0 Inter-Research 1997
perature increase of 2 to 6°C over the next 100 yr (Schneider 1989, IPCC 1996, Webb et al. 1997). GCM simulations further suggest that this temperature increase will affect the global hydrologic cycle, and will be manifested in increased evaporation over oceans, water vapor transport, and global riverine runoff, Miller & Russell (1992), for example, used a GCM to exanline the impact of global warming on the annual runoff for 33 of the world's largest rivers. For a doubled CO, climate, the runoff increases were detected in all rivers in high northern latitudes, with a maximum of +47%. At low latitudes there were both increases and decreases, ranging from + 96 % to -43 %. Importantly, the model results for a doubled CO2 climate projected a n increase in annual runoff for 25 of the 33 studied rivers. Climate change, if manifested by increasing riverine freshwater inflow, may affect coastal and estuarine
226
Clim Res 8: 225-237, 1997
ecosystems in several ways. First, changes in freshwater inflow will affect the stability of the water column, and this effect may be enhanced due to changes in sea surface temperatures. Vertical density gradients are likely to increase, which could decrease vertical oxygen transport and create conditions in the bottom water favorable for the development of severe hypoxia or anoxia (Justit et al. 1996).Second, the concentrations of nitrogen (N), phosphorus (P),and silicon (Si)in riverine freshwater inflows are typically a n order of magnitude higher than those in coastal waters (e.g. Justik et al. 1995).The mass fluxes of riverine nutrients are generally well-correlated with integrated runoff values (Turner & Rabalais 1991, Goolsby 1994). Consequently, the nutrient inputs to the coastal ocean are expected to increase as a result of the increasing riverine runoff, which could have an immediate effect on the productivity of coastal phytoplankton. Third, the stoichiometric ratios of riverine nutrients, Si:N, N:P and Si:P, may differ from those in the coastal ocean (Justit et al. 1995). Increased freshwater inflow, therefore, may also affect coastal phytoplankton communities by increasing or decreasing a potential for single nutrient limitation and overall nutrient balance (Smayda 1990, Dortch & Whitledge 1992, Justik et al. 1995).Thus, it appears that there is a plausible link between global climate change and the productivity of river-dominated coastal waters. Here we use our previously published model (Justic et al. 1996) to investigate the potential impacts of global climate change on the production and fate of organic matter in the northern Gulf of Mexico. The model is based on a coupled physical-biological 2-box modeling scheme and uses dissolved oxygen as a pnmary state variable. Our study has 2 major objectives: (1)to quantify the relationship between riverine freshwater and nutrient inputs and net productivity of the surface coastal waters, and (2) to examine the potential for in situ decomposition of produced organic matter under present and projected 2xC02 climates.
2. SENSITIVITY OF THE NORTHERN GULF OF MEXICO COASTAL WATERS TO GLOBAL CLIMATE CHANGE
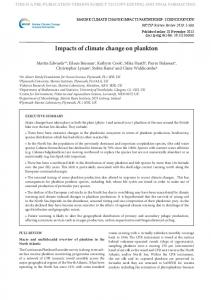
The combined discharges of the Mississippi-the eighth largest river in the world (Milliman & Meade 1983)-and the Atchafalaya Rivers (USA) account for 98% of the total freshwater inflow into the northern Gulf of Mexico (Dinnel & Wiseman 1986). The nutrient-rich plumes of these 2 rivers rapidly form the Louisiana Coastal Current that flows predominantly westward along the Louisiana coast, and then southward along the Texas coast. Riverine nutrients are confined within the upper 10 m by a strong seasonal pycnocline (Ao,= 4 to 10 kg m-3), which persists from April through October (Rabalais et al. 1991). Given this physical setting, it is not surprising that biol.ogical processes in the northern Gulf of Mexico are strongly influenced by the pattern and relative magnitude of riverine freshwater runoff (Justik et al. 1993). Changes in the areal extent of hypoxic ( < 2 mg O2 I-') bottom waters provide a representative example of this influence (Fig. 1).The northern Gulf of Mexico is presently the site of the largest (up to 18000 km2) and most severe hypoxic zone in the western Atlantic Ocean (Rabalais et al. 1991, 1994a, in press). Hypoxia normally occurs from April through October in waters below the pycnocline, and extends between 5 and 60 km offshore (Rabalais et al. 1991). During the drought of 1988 (a 52 yr low discharge record of the Mississippi River), however, bottom oxygen concentrations were significantly higher than normal, and formation of a continuous hypoxic zone along the coast did not occur in midsummer (Fig. 1). The opposite occurred during the Great Flood of 1993 (a 62 yr maximum discharge for August and September), when the areal extent of summertime hypoxia showed a 2-fold increase with respect to the average hydrologic year (Fig. l ; Rabalais et al. 1994a, in press). Hypoxia in the
Fig. 1. Northern Gulf of Mexico showing station g n d and locat~onof Stn C6. Shaded areas represent the dlstnbution of h y p o x ~ c(< 2 mg O21 - l ) bottom waters during August 1988 a n d July 199.7
227
Justic et al.: Climate change impacts on productivity
coastal bottom waters of the northern Gulf of Mexico develops as a synergistic product of high surface primary productivity, which is also manifested in a high carbon flux to the sediments, and high stability of the water colun~n(Rabalais et al. 1991).Likewise, the 1993 event was associated with both the increased stability of the water column and nutrient-enhanced primary productivity, as indicated by the greatly increased nutrient concentrations and phytoplankton biomass in the coastal waters influenced by the Mississippi River (Dortch 1994, Rabalais et al. 1994a, in press). Strong riverine influence implies that the ecosystem of the northern Gulf of Mexico will be highly sensitive to changes in global freshwater inflow. This is important, because GCMs predict an increase in the Mississippi River runoff of 20%, if the concentration of atmospheric CO2 doubles (Miller & Russell 1992). A higher runoff is expected during the May-August period, with an annual maximum most likely occurring in May. This hydrologic change would be accompanied by an increase in winter and summer temperatures over the Gulf Coast of 4.2 and 2.2"C, respectively (Giorgi et al. 1994).Justit et al. (1996) used a coupled physical-biological 2-box model to examine the effects of this increased freshwater input and temperature on the vertical oxygen fluxes in the northern Gulf of Mexico. Their results indicate that a 20% increase in the annual Mississippi River runoff, accompanied by a 2 to 4°C increase in the average sea-surface temperature, may cause a 30 to 60% decrease in summertime subpycnoclinal oxygen content. Those model projections are in agreement with the observed increase in severity and area1 extent of hypoxia during the Great Flood of 1993 (Rabalais et al. 1994a, in press).
appears to be of lesser importance than the vertical oxygen transport. This is suggested by a high coherence between changes in vertical temperature gradients and changes in bottom oxygen concentration. In contrast, a strong tidal signal, which would indicate horizontal transport, is not present in the periodograms of oxygen data series from Stn C6 (Rabalais et al. 199413). Also, maximum lateral displacement of water parcels that can be expected due to diurnal and semidiurnal currents is only about 3 km (Rabalais et al. 1994b), which is not likely to affect the inner section of a 60 km wide hypoxic zone. Third, because of the high turbidity of the continental shelf waters near the Mississippi River, primary productivity below the depth of 10 m is low (Lohrenz et al. 1990), and may be considered insignificant when compared to vertical oxygen transport. 3.2. Computation of surface net productivity and bottom respiration rates. In this study, we adopted our previously published 2-box model, which assumes uniform properties for the layers above and below the average depth of the pycnocline (Justit et al. 1996). The model includes relevant physical and biological processes that affect oxygen cycling in shallow, riverdominated, coastal waters. A brief account of the most important theoretical formulations is given below. The net productivity of the upper water column (NP, g O2 m-2 d-l, 0 to 10 m) is described by the expression
NP = Fo, + Do
+ INT,
where Fo, is the total air-sea oxygen flux (g O2 m-2 d-l), Do is the diffusive oxygen flux through the pycnocline (g O2 m-2 d-l), and INT, is the rate of change in the oxygen content of the upper water column (g O2 m-2 d-l), given as 10
3. METHODS
3.1. Study site. The study area encompasses the Louisiana coastal waters (Fig. 1).Stn C6, located in the inner section of the hypoxic zone, was used as a reference site for studies of impacts of climate change. This site was chosen because it has the longest and most consistent oceanographic data records (1985 to present) that are available for the northern Gulf of Mexico. Three distinct oceanographic features of this region facilitated the application of a 2-box modeling scheme. First, between the beginning of April and the end of October, a strong pycnocline (Ao,= 4 to 10 kg m-3) is typically found at the average depth of 10 m (Rabalais et al. 1991). Because the depth is only about 20 m, the pycnocline virtually divides the upper and the lower water column into 2 distinct water bodies of approximately equal volumes. Second, the horizontal oxygen transport in the inner section of the hypoxic zone
INT, = j*dz dt 0 We computed the air-sea oxygen flux (Fo,)from a formulation proposed by Stigebrandt (1991), which takes into account the effect of gas transfer d u e to bubbles:
In the above expression Vdenotes transfer velocity (m d-l), O2is the surface oxygen concentration (g O2 m-3, 0 to 1 m), and 02'is the surface oxygen saturation value (g O2 m-3, 0 to 1 m). Negative Fo, values indicate that the oxygen flux is directed towards the water column. The transfer velocity was computed from a formula given by Liss & Merlivat (1986). The vertical diffusive flux of oxygen (Do) was estimated from the equation:
where K, is the vertical eddy diffusivity (m2 S-'). O2is
228
Clim Res 8: 225-237, 1997
ambient oxygen concentration (g O2 m-3), and z is depth (m). We assumed that the only properties of the stratified water column controlling K, are the turbulent kinetic energy dissipation rate ( E ) and the buoyancy frequency (= Brunt-Vaisala frequency, N):
Daily discharge data for the Mississippi River at Tarbert Landing were obtained from the U.S. Army Corps of Engineers. Tarbert Landing is located in Mississippi, 8.2 miles (ca 13.2 km) downstream from the inlet channel to the Old River control structure (river mile 306.3), which diverts approximately one-third of the Mississippi River discharge to the Red River forming the N (S-') was calculated directly from the conductivityAtchafalaya River. Wind speed data were obtained temperature-depth profiles (CTD)using the expression: from the Louisiana Office of State Climatology. Monthly nitrate (N-NO3)concentrations for station St. Francisville (river mile 266), measured by the Louisiana where g i s the acceleration due to gravity (9.81 m s - ~ ) , Department of Environmental Quality (LDEQ 1984p, is the average density of the water column (kg m-3), 1993), were used in order to compute the Mississippi and dp/az is the vertical density gradient (kg m-4). River N-NO3 flux. Nitrogen is often considered to be The total oxygen uptake in the lower water column the limiting nutrient for the growth of the estuarine and coastal phytoplankton (e.g.D'Elia et al. 1986).The data (TR, g O2 m-' d-l, 10 to 20 m) was described by the expression from the northern Gulf of Mexico indicate that the frequency of stoichiometric nitrogen limitation is on the order of 30 % (Justic et al. 1995). The data were subdivided into 1985-1992 and 1993 where INTb is the rate of change in the oxygen content subsets. The 1985-1992 subset included 2 years with in the lower water column (g O2 m-' d-l), given as above average annual discharge of the Mississippi River (1990 and 1991),3 years with below average discharge (1987, 1988 and 1992), and 3 average hydroWe assume here that the estimated TR value also logic years (1985, 1986 and 1989).Given the time-span accounts for a large portion of anaerobic respiration. of the data, we considered the 1985-1992 data subset to be representative of the present day climate. The Most of the dissolved sulfide produced under anoxic conditions, for example, is re-oxidized by free disGreat Flood of 1993, in contrast, provided us with the solved oxygen (e.g. Berner 1982). Conversion of oxyopportunity to examine conditions that may occur as a gen to carbon equivalents was carried out using a ratio result of future clunate change. In this respect, the 'natural experiment' of 1993 was used to validate the of 0.288 by weight (mol. C:mol. O2 = 106:138, respiramodel generated scenarios. tory quotient = 0.77; Redfield et al. 1963). 3.3. Data. The data on temperature, salinity and dissolved oxygen concentration were obtained from a 4. RESULTS series of monitoring cruises conducted during the period June 1985 to October 1993. Our sampling sta4.1. Period 1985-1992 tion (C6)was occupied on a biweekly to monthly basis. Standard water column profile data were obtained The 1985-1992 runoff of the Mississippi River at from a Hydrolab Surveyor or a SeaBird CTD system Tarbert Landing showed a sinusoidal seasonal pattern with an SBE 13-01 (S/N 106) dissolved oxygen meter. (Fig. 2a), which is also characteristic for longer The dissolved oxygen measurements were calibrated records (Bratkovich et al. 1994). The average monthly with Winkler titrations (Parsons et al. 1984) that were runoff peaked in March (2.4 X 10⁴ m3 S-') and periodically carried out during deployment of the decreased afterwards until a seasonal minimum in instruments. Continuous (15 min intervals) temperaSeptember (6.9 X 10³ m3 S-'). Riverine N-NO3 fluxes ture and oxygen measurements were also obtained at ranged from 0.6 X 10⁶ kg d-' in September to 3 X 10" Stn C6 from July 1990 onward, using an Endeco 1184 kg d-l in April (Fig. 2b), which is consistent with prepulsed dissolved oxygen sensor. The instrument was vious estimates (Bratkovich et al. 1994).Although seadeployed at the depth of 19 m, approximately 1 m sonal dynamics in the Mississippi River nitrate flux above the seabed. Predeployment and postdeployment generally resemble the dynamics of the freshwater calibrations of the pulsed dissolved oxygen sensors runoff, the peak in N-NO3 flux is somewhat delayed were performed in accordance with factory specificawith respect to the peak in freshwater runoff (comtions. Continuous oxygen measurements were conpare Fig. 2a and 2b). This delay is the result of a trolled during hydrographic surveys of the study area, seasonal pattern in riverine N-NO3 concentrations by comparison with Winkler titrations, Hydrolab Sur(Fig. 3). veyor, or SeaBird CTD data.
Justic et al.: Climate change Impacts on productivity
229
Months
Months
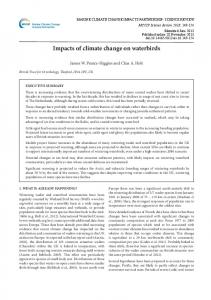
Fig. 2. Monthly averages (1985-1992) of (a)Mississippi River runoff, (b)Mississ~ppiRiver N-NO3 flux, (c)net productivity of the upper water column (NP, 0 to 10 m), and (d)total oxygen uptake in the lower water column (TR. 10 to 20 m), at Stn C6 in the northern Gulf of Mexico. The average annual net productivity during 1985-1992 was 122 g C m-2 yr-l. Vertical bars represent 1 standard error
+
The net productivity rates for the upper water column (NP, 0 to 10 m) were computed from Eq. 1, using temperature, salinity, dissolved oxygen, and wind speed averages for the period 1985-1992 (Table 1). The annual net productivity at Stn C6 was 122 g C m-2 yr-l (Fig. 2c). The NP values showed a welldefined seasonal cycle, with a minimum of -0.2 g C m-2 d-' in December and a maximum of 1.2 g C m-2 d-l in April (Fig. 2c). The maximum in NP occurred coincidentally with the runoff maximum (Fig. 2a, c), thus indicating a high degree of coherence between the N-NO3 load of the Mississippi River and NP values at Stn C6. Indeed, a cross correlation function (CCF) shows that the 2 series are highly correlated (CCF = 0.73; p < 0.01), and that a seasonal maximum in NP is lagged with respect to a riverine N-NO3 maximum by approximately 1 mo (Fig. 4a). The best fit time-delayed linear model is NP, = -0.34
+ 3.93 X
From Eq. (3) we computed the average monthly airsea oxygen fluxes (Fol)at Stn C6. The Folvalues for the period 1985-1992 ranged from -0.9 to 3.5 g 0, m-, d-'
1
10-' (N-NO3),-,
2
3
4
(9)
where NP is in g C m-2 d-l, N-NO, is in kg d-l, and subscripts t and t-l denote values for the current and preceding months, respectively (Fig. 4b).
5
6
7
8
9 1 0 1 1 1 2
Months Fig. 3. Monthly averages (1985-1992) of N-NO3 concentration in the Mississippi h v e r at St. Francisville. Vertical bars represent 1 standard error
+
Clim Res 8: 225-237, 1997
230
Table 1. Average total air-sea oxygen fluxes (Fol,g O2 m-' d-l), vertical oxygen fluxes across the pycnocline (Do, g O2 m-2 d-l), changes in the oxygen content of the upper water column (INT,, g O2 m-2 d-l, 0 to 10 m), and changes in the oxygen content of the lower water column (INTb,g O2 m-' d-l, 10 to 20 m), at Stn C 6 , for the period 1985-1992. Also shown are monthly averages of surface temperature (T, "C, 0 to 1 m), surface salinity (S,psu. 0 to 1 m), surface dissolved oxygen concentration (02, g O2 0 to 1 m), surface oxygen saturation value (021,g O2 m-.', 0 to 1 m), wind speed (W, m S-'), transfer velocity (V, m d-l), density gradient between the upper and the lower water column (Ap, kg m3),buoyancy frequency (N, S-'), vertical eddy diffusivity (K,. m2 S-'), oxygen concentration in the upper water column (0,,g O 2 m-',0 to 10 m), and oxygen concentration In the lower water column (Q,, g O2 m-? l 0 to 20 m). For numbers of observations see Justic et al. (1996) OS
KZ
Jan Feb Mar Apr May Jun Jul Aug Sep Oct Nov Dec
Q
For
Do
INT,
INT,
16.72 16.67 19.09 21.61 25.64 28.95 30.18 30.05 28.98 25.34 22.61 18.93
(Table l ) ,and were highly correlated with the NP values of the upper water column (R = 0.98; p < 0.01) (Fig. 5). The integrated annual Fo, value was 226 g O2 m-2 yr-' (Table 1). The oxygen uptake rates in the lower water column (TR, 10 to 20 m; Eq. 7) were computed from in situ changes in dissolved oxygen content (INT,) and vertical oxygen fluxes (Do) during the period 1985-1992 (Table 1).At Stn C6, TR values ranged from 0.1-0.34 g O2 m-2 d-l during late summer and fall, to 0.7-1.1 g O2 m-' d-l, during winter, spring and early summer (Fig. 2d). There is an apparent coincidence between the low TR values and severity of hypoxia in the lower water column (Table 1). The integrated annual TR value was 197 g O2 m-2 yr-' (Fig. 2d), which is stoichiometrically equivalent to 57 g C m-2 yr-l, if the 02:C conversion ratio of 0.288 by weight is assumed (Red-
-0.51 0
Time lag (months)
field e t al. 1963). Given a n annual NP value of 122 g C m-2 yr-' for the upper water column, it follows that 47% of the annual net organic production at Stn C6 was decomposed in the lower water column and sediments (TR/NP = 0.47).
4.2. The Great Flood of 1993 A highly increased spring and summer runoff characterized the Mississippi River in 1993 (Fig. 6a). Between August 5 and September 10, for example, runoff was above the 62 yr maximum daily record (Boyles & Humphries 1994). The higher streamflow of the Mississippi and Atchafalaya Rivers resulted in lower than normal surface salinities, higher surface temperatures, and increased stability (Ap) in the
, 1x10⁶
, 2x10⁶
, 3x10⁶
N-NO3 load (kg d-1)
Fig. 4 . (a) Cross correlation function (CCF) for Mississippi River N-NO, flux at Tarbert Landing and net productivity of the upper water column (NP. 0 to 10 m) at Stn C6, and (b) best-fit timedelayed linear model for the regression of NP on N-NO3. Symbols in (b) 4x10⁶ denote monthly averages for the period 1985-1992
1
23 1
Justik et al.. Climate change impacts on productivity
Fig. 5. Relationship between the net productivity rates (NP, 0 to 10 m) and total oxygen fluxes at the air-sea interface (Fot) at Stn C6. Symbols denote monthly averages for the period 1985-1992; Fo,> 0 denotes flux towards the atmosphere
coastal waters of the northern Gulf of Mexico (Table 2). Upstream flooding greatly increased the overall loading of nutrients. Mississippi River N-NO3 fluxes were significantly higher in comparison with averages for the period 1985-1992 (t-test;p < 0.01) (Fig. 6b). The NNO3 flux during the spring runoff maximum, for example, increased from 3 X 10⁶to 6 X 10⁶kg d-'. The fluxes for July and August increased 3-fold and 4-fold, respectively (Fig. 6b). Surface oxygen anomaly (02- 0;) at Stn C6 was higher during 1993 (Table 2), relative to the 1985-1992 average (Table 1). During the period June to Novem-
ber, for example, O2- 0; values increased from 0.07 g 0' m-3 (Table 1) to 1.28 g O2 m-3 (Table 2), which is a significant increase (t-test; p < 0.05). This suggested that the net productivity of the upper water column increased in response to a higher nutrient input from the Mississippi River. We could not estimate the net productivity for January, February and December of 1993, because Stn C6 was not occupied during those months. Based on a comparison for the period March to November, however, we estimated that the NP values increased 29%, from 110 g C m-2 yr-' during 19851992, to 142 g C m-2 yr-' in 1993 (Fig. 6c). Net productivity was highly increased during April 1993, but perhaps the most notable change was the appearance of June and September-October maxima (Fig. 6c). By assuming that the NP values for January, February and December 1993 were unchanged with respect to the period 1985-1992, we estimated that the annual NP value during 1993 was 154 g C m-* yr-'. Similarly, we estimated that the integrated annual air-sea oxygen flux (Fo,) during 1993 was 356 g O2 m-' yr-l (Table 2), which is a 58% increase with respect to the period 1985-1992 (Table 1). The seasonal pattern of oxygen uptake in the lower water column (TR) during 1993 was generally similar to that of 1985-1992. Perhaps the only difference was an increased TR value during the spring productivity maximum (Fig. 6d). The integrated TR value during the period February to November 1993 was 133 g O2 m-', about the same as during the period 1985-1992 (135 g O2 m-'). Assuming that the TR values for December, January and February of 1993 were unchanged with respect to the 1985-1992 average, we
Table 2. Average total air-sea oxygen fluxes (F,,, g 0 2 m-2 d-l), vertical oxygen fluxes across the pycnocline (Do. g O 2 m-' d-l), changes in the oxygen content of the upper water column (INT,, g O2 m-' d-l, 0 to 10 m), and changes in the oxygen content of the lower water column (lNTb,g O 2 m-' d-l, 10 to 20 m), at Stn C6, during 1993. Also shown are monthly averages of surface temperature (7; " C , 0 to 1 m), surface salinity (S, psu, 0 to 1 m), surface dissolved oxygen concentration (02, g 0' m-3, 0 to 1 m), surface oxygen saturation value (02', g O2 m-3, 0 to l m), transfer velocity (V, m d-'), density gradient between the upper and the lower water column (Ap, kg m-3),buoyancy frequency (N, S-'), vertical eddy diffusivity (K,, m2 S-'), oxygen concentration in the g O2 10 to 20 m). upper water column (OS,g O 2 m-3, 0 to 10 m), and oxygen concentration in the lower water column Wind speed averages are the same as in Table 1. -: no data
(a,
Jan Feb Mar A P ~ May Jun J ul Aug
Sept Oct Nov Dec
232
Clim Res 8: 225-237, 1997
Months
Months
Fig. 6. Monthly 1993 averages of (a) Mississippi River runoff, (b) Mississippi River N-NO, flux, (c) net productivity of the upper water column (NP, 0 to 10 m), and (d) total oxygen uptake in the lower water column (TR, 10 to 20 m) at Stn C 6 . The annual net productivity during 1993 was 154 g C m-2 yr-'
estimated that the annual TR value for 1993 was 195 g O2m-2 yr-l. This is stoichiometrically equivalent to 56 g C2 m-2 yr-' Thus, 36% of the annual net organic production at Stn C6 was decomposed in the lower water column and sediments during 1993 (TR/NP = 0.36). In a steady-state model (EINT, = 0, Z INTh = O), the annual NP value should be equal to TR + Fo,. Because of the lack of data for January, February and December, and approximations used, the combined annual TR and Fo, values for 1993 (551 g O2 m-2 yr-l) are slightly higher than the annual NP value (535 g O2 m-2 yr"). Nevertheless, this error is only about 3 % , and will be considered insignificant in comparisons of global oxygen and carbon budgets.
4.3. Doubled CO2 climate
Based on simulations of a general circulation model, Miller & Russell (1992)predicted that the annual freshwater runoff of the Mississippi River would increase 20% if the concentration of atmospheric CO2 doubles.
A higher runoff is expected primarily during the May to August period, with the peak in runoff most likely occurring during May. Here we adopt this scenario by using the average Mississippi River runoff for the period 1985-1992 as a reference for the present day climate (Fig. 2a). Assuming a 20% increase, the annual 2xC02 runoff a t Tarbert Landing would be around 0.5 X 10'' m3 yr-'. The maximum monthly runoff would be in the proximity of 4 X 10⁴ m3 S-' (Fig. ?a; JustiC et al. 1996), which is substantially higher than during the Great Flood of 1993 (3.2 X 10⁴ m3 S-') (Fig. 6a). We cannot predict changes in nitrate concentrations in the Mississippi River that may occur with the doubling of atmospheric CO2 concentration. The N-NO, concentration in the lower Mississippi River increased approximately 3-fold between the 1960s and 1980s (Turner & Rabalais 1991, Bratkovich e t al. 1994). Nevertheless, the concentration stabilized around 1985, and remained practically unchanged over the last decade (Turner & Rabalais 1991, Antweiler et al. 1995, Rabalais et al. 1996). For the purpose of this analysis,
Justit e t al.: Climate change impacts on productivity
233
centration for the 2xC02 runoff maximum is suggested by the increased riverine N-NO3 concentrations during the peak of the flood of 1993. Nitrate concentrations in excess of 1.8 mg 1 - l , for example, were measured in the Mississippi River during May, July, and August of 1993 (LDEQ 1984-1993). Under these assumptions, a 20% increase in the Mississippi River runoff would yield a N-NO, flux of 0.6 X 1OQg d d ' (September)to 6 X 10' kg d-' (May) (Fig. 7b). The latter value is of the same order of magnitude as the peak N-NO3 flux during the flood of 1993 (Fig. 6b). NP for a doubled CO2 climate was estimated from projected N-NO3 fluxes, using the time-delayed linear model described in Eq. (9). Results show (Fig. ?c) that the integrated annual NP at Stn C6 may increase to 187 g C m-2 yr-'. This is a 53 % increase relative to the 1985-1992 average, and a 21 % increase relative to the NP calculated for the Great Flood of 1993. for a doubled CO2 cliAir-sea oxygen fluxes (Fo,) mate were computed from projected NP values, using the relationship in Fig. 5. The results indicate that the annual F,, value may increase to 457 g 0 2 m-' yr-l, which is approximately a 2-fold increase with respect to the estimated annual Fo, value for the period 1985-1992. The NP value of 187 g C m-2 yr-' is stoichiometrically equivalent to 649 g O2 m-2 yr-'. Assuming steady-state conditions for an average annual cycle (X INT, = 0, Z INTb = 0), it follows from Eqs. (1)& (7) that the total oxygen uptake in the lower water column would be equal to NP-F,, = 192 g O2 m-* yr-'. Thus, it appears that the annual TR value would remain practically unchanged with respect to the periods 1985-1992 and 1993. Nevertheless, only 29 % of the annual net organic production at Stn C6 would be decon~posedin the lower water column and sediments (TR/NP = 0.29).
5. DISCUSSION Months Fig. 7 Projected 2xC02 values of the (a) Mississippi River runoff, (b) Mississippi River N-NO3 flux, and (c) net productivity of the upper water c o l u n ~ n(NP, 0 to 10 m), at Stn C6. The projected annual net productivity is 187 g C m-'yr-'
we assumed that the riverine N-NO3 concentration during the June to April period will remain unchanged with respect to 1985-1992 (Fig. 3). Because of the exceptionally high runoff values that are predicted for May (-39 000 m3 S-', Fig. ?a), the average N-NO3 concentration for this month was increased by 1 standard error with respect to the 1985-1992 baseline, from 1.54 mg 1-' to 1.76 mg 1-l. This increase in nitrate con-
5.1. Implications of future climate change for coastal oxygen and carbon budgets Climate change, if manifested by increasing runoff of the Mississippi River, is likely to have important implications for the production and decay of organic matter in the northern Gulf of Mexico (Fig. 8). The annual NP of the upper water column (0 to 10 m) at Stn C6 would increase 53%, from 122 g C m-' yr-' (1985-1992) to 187 g C m-' yr-' (2xC02 climate). The T R in the lower water column (10 to 20 m) would remain at its present value of about 200 g O2 m-' yr-l, and the TR:NP ratio would decrease from 0.47 to 0.29 (Fig. 8). The above evidence supports a hypothesis that export and/or burial of the organic matter, rather than
234
Clim Res 8: 225-237, 1997
Surface (0 - 10 m)
Fig. 8. Global oxygen fluxes (g O2 d.') at Stn C6 for the periods 1985-1992 and 1993, and model projections for a doubled CO2 climate. Fo, denotes the total air-sea oxygen flux. NP is the net productivity of the upper water column (0 to 10 m ) , Do is the diffusive oxygen flux through the pycnocline, and TR is the total oxygen uptake in the lower water column (10 to 20 m). Carbon equivalents, computed from the Redfield stoichiometric model (AC:A02 = 0.288. by weight), are given in parentheses
Pycnocline
Bottom (10-20 m)
in situ decomposition, would become the predominant fate of organic matter produced within the hypoxic zone. Model results for a doubled CO2 climate indicate that the annual TR value would remain practically unchanged, in spite of a substantial increase in net productivity (Fig. 8). This allows us to hypothesize that the benthic and the epibenthic respiration rates may have already reached the limits that are set by the availability of dissolved oxygen. Indeed, both the 1985-1992 and the 1993 data sets show an apparent coincidence between the decreased TR values and the severity of hypoxia in the lower water column (Tables 1 & 2 and Figs. 2 & 6). Rowe et al. (1992) reported an average sediment oxygen uptake rate of 17.7 m1 O2 m-2 h-' (= 222 g O2 m-' yr-l) for the continental shelf of the northern Gulf of Mexico. For the same area, Dortch et al. (1994) reported a n average oxygen uptake rate in the bottom water of 11 mg O2 m-3 d-l. This converts to an annual value of 40 g 0' m-', if the entire lower water column (10 to 20 m) is taken into account. The combined oxygen uptake due to benthic and water column respiration, therefore, is 262 g 0, m-' yr-'. This is equivalent to the remineralization of 75 g C m-' yr-', which compares favorably with our estimate of 57 g C m-2 yr-' (Fig. 8).
5.2. The Great Flood of 1993
During the Great Flood of 1993, the annual NP value at Stn C6 increased to about 154 g C m-2 yr-', which is a 29% increase relative to the period 1985-1992 (Fig. 8). This result is in agreement with the greatly increased phytoplankton biomass that was observed during most of 1993. Between July and September 1993, for example, the total phytoplankton density at a
station in the core of the hypoxic zone was an order of magnitude higher than normal (Dortch 1994, Rabalais et al. in press). At Stn C6, the annual TR value during 1993 (195 g 0' m-' yr-l) was approximately the same as during the period 1985-1992 (197 g O2 m-' yr-l). During April 1993, however, the TR value was unusually high (Fig. 6d), indicating perhaps an increased vertical flux of organic matter during the spring NP maximum (Fig. 6c). Also, vertical oxygen fluxes (Do) between March and November of 1993 were significantly lower ( p < 0.01) in comparison with the 19851992 data, presumably as a result of increased watercolumn stability (Ap) (compare Tables 1 and 2; also Justic et al. 1996).The altered pattern of seasonal oxygen uptake and resupply was probably responsible for a decreased subpycnoclinal oxygen content at Stn C6 during 1993 (Table 2). The area1 extent of 1993 hypoxia in the northern Gulf of Mexico, however, showed an approximately 2-fold increase in size, relative to the 1985-1992 midsummer average (Fig. 1; Rabalais et al. 1994a, in press).
5.3. Retrospective analyses of sedimentary records
Analyses of two 2'0Pb-dated sediment cores collected in the vicinity of the Mississippi River Delta have demonstrated a substantial increase in the organic carbon accumulation rates, from about 30 g C m-2 yr-' in the 1950s to 50-70 g C m-2 yr-' at present (Eadie et al. 1994). Interestingly, the rate of carbon burial has been significantly higher at a station within the area of chronic hypoxia (-70 g C m-' yr-l), in comparison with an adjacent site at which hypoxia has not been documented (-50 g C m-2 yr-l). The 6'" partitioning of organic carbon into terrestrial and marine fractions has further indicated that the increase in accumulation for
J u s t i t et al.: Climate chan g e impacts o n productivity
both cores is exclusively in the marine fraction. Parallel evidence of historical changes in the river-dominated coastal waters of the northern Gulf of Mexico has been obtained from the skeletal remains of diatoms sequestered as biologically bound silica (BSi). BSI accumulation rates in sediments adjacent to the Mississippi Delta have doubled since the 1950s, indicating greater diatom flux from the euphotic zone (Turner & Rabalais 1994). In addition, stratigraphic records of bent.hic foraminifera, i.e. the relative dominance of 2 common species of Ammonia and Elphidium ( A - E index), indicate an overall increase in the bottom oxygen stress in the same region (Sen Gupta et al. 1996). The above changes in the accumulation rates of organic carbon and BSi in the sediments, along with biostratigraphic records, present strong evidence for the hypothesis that the productivity of the surface waters near the outflow of the Mississippi River has increased since the 1950s. Also, the oxygen deficiency in the bottom waters has increased in response to a higher organic flux from the upper water column. Significantly, the above changes have occurred coincidentally with changes in the riverine nitrogen, phosphorus and silicon inputs. The nitrate flux of the Mississippi River, for example, has increased between 2- and 3-fold since the 1950s, mostly as a result of increased fertilizer use in the watershed (Turner & Rabalais 1991, Bratkovich et al. 1994). Because of changing riverine nutrient inputs, stoichiometric nutrient ratios in the coastal surface waters of the northern Gulf of Mexico have become more balanced and overall less limiting for phytoplankton growth (Justii: et al. 1995). A high degree of coherence between the Mississippi River N-NO3 fluxes and NP rates at Stn C6 (Fig. 4) allows us to hypothesize that the net productivity of the upper water column has increased since the 1950s. If we assume that the riverine nitrogen input was 50% lower than at present (Fig. 2b), the monthly N-NO3 flux during the 1950s did not exceed 1.6 X 10' kg d-l. Based on the relationship in Fig. 4b, that flux would be sufficient to support net productivity of about 0.29 g C m-2 d-l, which is only 25 % of the peak NP value for 1985-1992 (1.15 g C m-2 d-l). Consequently, the integrated annual NP was substantially lower than at present, and probably did not exceed 35 g C m-' yr-l. Even if we assume that losses due to export and burial were not significant, and the total annual production of 35 g C m-' yr-' was decomposed in the lower water column and sediments, the annual TR value would have been around 121 g O2 m-' yr-l. This result is substantially lower when compared with the estimates for 1985-1992 (197 g O2 m-2 yr-l) and 1993 (195 g O2 m-' yr-l). Thus, the net productivity of the upper water column appears to be an important
235
factor controlling the accun~ulationof organic matter in coastal sediments and development of hypoxia in the lower water column. Evidently, modifications of coastal carbon and oxygen budgets under anthropogenic nutrient enrichment are not confined only to the northern Gulf of Mexico, but have occurred in many coastal and estuarine areas worldwide. Evidence from the northern Adriatic Sea (Benovic et al. 1987, JustiC: et al. 1987), Chesapeake Bay (Officer et al. 1984, Cooper & Brush 1991) and the Baltic Sea (Andersson & Rydberg 1988, Hickel et al. 1993), for example, indicates a close coupling between riverborne nutrients, net productivity, vertical carbon flux, and hypoxia on decadal time scales.
6. CONCLUSIONS Climate change, if manifested by increased freshwater and nutrient inputs of the Mississippi River, would have significant implications for the global oxygen and carbon budgets in the northern Gulf of Mexico. The annual net productivity (NP) of the upper water column (0 to 10 m) a t Stn C6 is likely to increase by about 53%, from 122 g C rn-'yr-' (1985-1992) to 187 g C m-2 yl--' (2xC0, climate). This model scenario is supported by 2 findings. First, the annual NP value during the Great Flood of 1993 (154 g C m-' yr-l) was significantly higher when compared with the average for the period 1985-1992. Also, retrospective analyses of sedimentary records clearly indicate that the productivity of the surface coastal waters adjacent to the Mississippi River has increased coincidentally with riverine nitrogen flux. In the vicinity of the Mississippi River Delta, a doubling of atmospheric CO2 is likely to increase the rates of deposition and burial of organic matter. Given a projected increase in NP of 65 g C m-' yr-', the increase in carbon deposition due to a doubling of atmospheric CO2 could b e of the same magnitude, or higher, than that resulting from 5 decades of anthropogenic eutrophication (20 to 40 g C m-' yr-l). The total oxygen uptake in the lower water column (TR), in contrast, is likely to remain at its present value of about 200 g 0 ' m-' yr-l, and would not increase in spite of significant increase in NP of the upper water column. This suggests that the TR value at Stn C6, in the inner section of the hypoxic zone, has already reached the limit that is set by the availability of dissolved oxygen. Thus, it appears that export and burial, rather than in situ respiration, would likely become the ultimate fate for any surplus of organic matter that is produced in the inner section of the hypoxic zone. Carbon export is likely to increase the oxygen demand in adjacent bottom waters, leading perhaps to a n expanded hypoxic zone.
236
Clim Res 8-
Acknowledgements. This research was funded in part by the U.S. Department of Energy's (DOE) National Institute for Global Environmental Change (NIGEC) through the NIGEC South Central Regional Center at Tulane University (DOE Cooperative Agreement No. DE-FC03-90ER61010). Other sources of support came from NOAA Ocean Assessments Division grants to LUMCON/LSU for hypoxia studies, the NOAA Nutrient Enhanced Coastal Ocean Productivity (NECOP)Program. Louisiana State University, Louisiana Universities Marine Consortium, and the Louisiana Board of Regents LEQSF Program.
LITERATURE CITED Andersson L, Rydberg L (1988)Trends in nutrient and oxygen conditions within the Kattegat: effects on local nutrient supply. Estuar Coast Shelf Sci 26:559-579 Antweiler RC, Goolsby DA, Taylor HE (1995) Nutrients in the Mississippi River In: Meade RH (ed) Contaminants in the Mississippi River, 1987-92. US Geological Survey Circular 1133. Denver, CO, p 73-86 Benovik T, Justit D. 3ender A (i387) Enigmatic changes In the hydromedusan fauna of the northern Adriatic Sea. Nature 326597-600 Berner RA (1982) Burial of orgamc carbon and pyrite sulfur in the modern ocean: ~ t geochemical s and environmental significance. Am J Sci 282:451-473 Boyles R Jr, Humphries RG (1994) Lower Mississippi River streamflow. In: Dowgiallo MJ (ed) Coastal oceanographic effects of summer 1993 Mississippi Rlver flooding. Special NOAA Report, NOAA Coastal Ocean Office/National Weather Service, Silver Spring, MD, p 28-29 Bratkovich A, Dinnel SP, Goolsby DA (1994) Variability and prediction of freshwater and nitrate fluxes for the Louisiana-Texas shelf: Mississippi and Atchafalaya h v e r source functions. Estuaries 17:766-778 Cooper SR, Brush GS (1991) Long-term history of Chesapeake Bay anoxia. Science 254:992-996 D'Elia CJ, Sanders JG, Boynton WR (1986) Nutrient enrichment studies in a coastal plain estuary: phytoplankton growth in large-scale, continuous cultures. Can J Fish Aquat Sci 43:39?-406 Dinnel S, Wiseman WJ Jr (1986) Freshwater on the Louisiana shelf. Cont Shelf Res 6:765-784 Dortch Q (1994) Changes In phytoplankton number and species composition. In: Dowgiallo MJ (ed) Coastal oceanographic effects of sulnmer 1993 Mississippi River flooding. Special NOAA Report, NOAA Coastal Ocean Office/ National Weather Service, Silver Spring, MD, p 46-49 Dortch Q, Rabalais NN. Turner RE, Rowe GT (1994) Respiration rates and hypoxia on the Louisiana shelf. Estuaries 17: 862-872 Dortch Q, Whitledge TE (1992) Does nitrogen or s~liconlimit phytoplanktori production in the Mississippi River plume and nearby regions? Cont Shelf Res 12:1293-1309 Eadie BJ, McKee BA, Lansing MB. Robbins JA, Metz S, Trefry JH (1994) Records of nutrient-enhanced coastal ocean productivity in sediments from the Louisiana continental shelf. Estuaries 17:754-765 Giorgi F, Shields-Brodeur C, Bates T (1994) Regional climate change scenarios produced with a nested regional climate model. J Clim 7:375-399 Goolsby DA (1994) Flux of herbicides and nitrate from the Mississippi River to the Gulf of Mexico. In: Dowgiallo MJ (ed) Coastal oceanograph~ceffects of summer 1993 Mississippi River flooding. Special NOAA Report, NOAA
Coastal Ocean Office/National Weather Service, Silver Spring, MD, p 32-35 Hickel W, Mangelsdorf P, Berg J (1993) The human impact in the German Bight: eutrophication during three decades (1962-1991). Helgolander Meeresunters 47:243-263 IPCC (Intergovernmental Panel on Climate Change) (1996) Climate change 1995. The science of climate change. Contribut~onof working group I. Cambndge University Press, Cambridge Justic D, Legovik T, Rottini-Sandrini L (1987) Trend in the oxygen content 1911-1984 and occurrence of benthic mortality in the northern Adriatic Sea. Estuar Coast Shelf S C25:435-445 ~ Justit D, Rabalais NN, Turner RE (1996) Effects of climate change on hypoxia in coastal waters: A doubled CO2 scenario for the northern Gulf of Mexico. Limnol Oceanogr 41:992-1003 Justik D, Rabalais NN, Turner RE, Dortch Q (1995) Changes in nutrient structure of river-dominated coastal waters: stoichiometric nutrient balance and its consequences. Estuar Coast Shelf Sci 40:339-356 Justik D, Rabalais NN, Turner RE, Wiseman WJ Jr (19931 Seasonal coupling between riverborne nutrients, net productivity and hypoxia. Mar Pollut Bull 26:184-189 Kerr RA (1990) Global warming continues in 1989. Science 247:521 LDEQ (Louisiana Department of Environmental Quality) (1984-1993) Louisiana water quahty data-summary 1984-1993. Office of Water Resources, Baton Rouge Liss PS, Merlivat L (1986) Air-sea gas exchange rates: Introduction and synthesis. In: Buat-Menard P (ed) The role of air-sea exchange in geochemical cycling. Reidel. Norwell, p 113-127 Lohrenz SE, Dagg MJ, Whitledge TE (1990) Enhanced primary production in the plume/oceanic interface of the Mississippi fiver. Cont Shelf Res 10:639-664 Miller JR, RusseU GL (1992) The impact of global warming on river runoff. J Geophys Res 97:2757-2764 Milliman JD, Meade RH (1983) Worldwide delivery of river sediment to the ocean. J Geol91:l-21 Neftel A, Moor E, Oeschger H, Stauffer B (1985) Evidence from polar ice cores for the increase in atmospheric CO2 In the past two centuries. Nature 315:45-47 NOAA (Nahonal Oceanic and Atmospheric Administration) (1994) Flfth annual climate assessment 1993 Climate Analys~sCenter, Camp Springs, MD Officer CC, Biggs RB, Taft JL, Cronin LE, Tyler M, Boynton WR (1984) Chesapeake Bay anoxia: origin, development and significance. Science 223:22-27 Parsons TR. Maita Y, Lalli M (1984) A manual of chemical and biological methods for seawater analyses. Pergamon Press, New York Rabalais NN, Turner RE, Justii. D, Dortch Q. Wiseman WJ Jr. Sen Gupta BK (1996) Nutrient changes in the Mississippi River and system responses on the adjacent continental shelf. Estuaries 19:386-407 Rabalais NN, Turner RE, Wiseman WJ Jr (1994a) Hypoxic conditions in bottom waters of the Louisiana-Texas shelf In: Dowgiallo MJ (ed) Coastal oceanographic effects of summer 1993 Mississippi River flooding Special NOAA Report, NOAA Coastal Ocean Office/National Weather Service, Silver Spring, MD, p 50-54 Rabalais NN, Turner RE, Wiseman WJ Jr, Boesch DF (1991)A brief summary of hypoxia on the northern Gulf of Mexlco continental shelf: 1985-1988. In: Tyson RV, Pearson TH (eds) Modern and ancient continental shelf anoxia. Geological Society Special Publication No. 58, London, p 35-47
Justic et al.. Climate change impacts on productivity
237
Rabalais NN, Turner RE. Wiseman WJ Jr. Dortch Q (in press) Consequences of the 1993 Mississippi River flood in the Gulf of Mexico. Regulated Rivers Rabalais NN. Wiseman WJ, Turner RE (1994b) Comparison of continuous records of near-bottom dissolved oxygen from the hypoxia zone along the Louisiana coast. Estuaries 17. 850-861 Redfield AC, Ketchum BH, Richards FA (1963) The influence of organisms on the composition of seawater In: Hill MN (ed)The sea, Vol2. John Wiley, New York, p 26-77 Rowe GT, Boland GS, Phoel WC (1992) Benthc community oxygen demand and nutrient regeneration in sediments near the Mississippi River plume. In: Proceedings of the Nutrient Enhanced Coastal Ocean Productivity Workshop, National Oceanic and Atmospheric Administration, Coastal Ocean Program, PublTAMU-SG-92-109, p 136-139 Schneider SH (1989) The greenhouse effect: science and policy. Science 243:771-781 Sen Gupta BK, Turner RE, Rabalais NN (1996) Seasonal oxygen deplet~onin continental-shelf waters of Louisiana: historical record of benthic foraminifers. Geology 24:22?-230
Smayda TJ (1990) Novel and nuisance phytoplankton blooms in the sea: evidence for global epidemic. In: Graneli E, Sundstrom B, Edler R, Anderson DM (eds) Toxic marine phytoplankton. Elsevier Science, New York, p 29-40 Stigebrandt A (1991) Computation of oxygen fluxes through the sea surface and net production of organic matter with application to the Baltic and adjacent seas. Limnol Oceanogr 36:444-454 Thorning KW, Tans PP, Komhyr WD (1989) Atmospheric carbon dioxide at Mauna Loa Observatory. 2. Analysis of the NOAA/GMCC data, 1974-1985. J Geophys Res 94: 8549-8565 Turner RE, Rabalais NN (1991) Changes in the Mississippi River water quality this century-Implications for coastal food webs. BioSci 41:140-147 Turner RE, Rabalais NN (1994) Evidence for coastal eutrophication near the Mississippi River delta. Nature 368: 619-621 Webb RS, Rind DH, Lehman SJ, Healy RJ, Sigman D (1997) Influence of ocean heat transport on the climate of the Last Glacial Maximum. Nature 385:695-699
Editorial responsibility: Brent Yarnal, University Park, Pennsylvania, USA
Manuscript received: September 17, 1996 Revised version accepted: May 6, 1997