ImpactViz: Visualizing Class Dependencies and the Impact of Changes in Software Revisions Matthew Follett
Orland Hoeber
Memorial University St. John’s, NL A1B 3A8 Canada
Memorial University St. John’s, NL A1B 3A8 Canada
[email protected] ABSTRACT Object oriented software development is designed to be modular, with code reuse being very common. When bugs are introduced, they can manifest themselves in one or more sections of code, but originating in a completely different area. This poster outlines the features of ImpactViz, a novel approach for visualizing class dependencies and the impact of changes in software revisions stored within a repository.
Categories and Subject Descriptors D.2.5 [Software]: Software Engineering—Testing and Debugging; H.5.2 [Information Systems]: Information Interfaces and Presentation—User Interfaces
General Terms Design, Human Factors
1.
INTRODUCTION
Due to the class encapsulation features of object oriented languages, the interaction between method calls within even a small project can become rather complex. For example, a single method may call numerous methods from its encapsulated classes, each of which may make method calls of their own encapsulated classes. As a result, the method call stack may become very deep. When a bug is accidentally introduced into the method of a class, it not only affects the method in which it originates, but also manifests itself as a problem in other classes that make use of the bugged method. Since the source of the bug may appear many levels deep in the method call stack, tracing the bug back to its origin can be a difficult and time consuming task. In order to address this problem, we have developed a software visualization tool that represents the class dependencies as defined by the method call stack, and the changes that have been made to these classes within the revision history of a source code repository such as Subversion (SVN). While others have developed methods for illustrating the dependencies between classes [2] and detecting changes within revisions as potential sources of bugs [5], the novelty of our work is the visual approach that ImpactViz employs to illustrate the cascading effects that the changes to the classes can have on the whole system. The goal is to allow the software developer to visually trace from the class in which a bug Copyright is held by the author/owner(s). SOFTVIS’10, October 25–26, 2010, Salt Lake City, Utah, USA. ACM 978-1-4503-0028-5/10/10.
[email protected]
is manifesting itself to the classes that have been changed (which may be the source of the bug).
2.
IMPACTVIZ
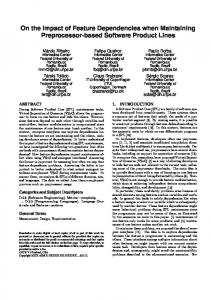
ImpactViz uses a force-directed graph layout to represent the method call stack, as shown in Figure 1. Nodes represent classes; edges represent method calls between classes. The direction of the edge shows the method call direction: an edge pointing from class A to class B illustrates that class A calls a method from within class B (i.e., that an object of type class B is encapsulated in an object of type class A, and that a method in the class A object is calling a method from the class B object). This edge representation places the focus on the direction in which methods are being called, similar to how UML class diagrams use direction to show association and ownership. The graph layout algorithm, provided by Prefuse [1], dynamically organizes the nodes such that connected classes are pulled together, while unrelated classes are pushed away from one another. ImpactViz uses colour to provide different visual distinctions among the class nodes. Class nodes with a white background and black font represent classes that have not changed within the revision history. Class nodes with a black background and white font represent classes that have changed. This visual encoding at the extremes of the luminance channel allow the user to readily perceive the set of classes that have been modified from those that have not. The impact that a particular change in a class can have on the project is determined at the method level. Each change in a particular method for each revision in the software repository generates a separate change impact region. These change impact regions are subsets of the method call stack graph, which include the class in which the method is defined, as well as all other classes that make use of the changed method. The change impact regions are visually encoded as coloured regions layered on the background of the method call stack graph, enclosing all the class nodes that can make use of the changed method. Since the human eye can only reliably differentiate between a limited number of colours [4], the change impact regions are visually encoded using a set of ten distinct hues. Obviously, there may be more than ten change impact regions that need to be represented. To address this issue, colours are reused for multiple change impact regions; wherever possible, this reuse occurs for disjoint regions. Due to potentially overlapping change impact regions, the colours are also rendered using partial trans-
Figure 1: A screenshot of the software visualization provided in ImpactViz. Classes that make method calls to one another are represented in a force-directed graph layout. Nodes that have changed within the revision history are represented using a black background. The impacts that these changes have on other classes are encoded using coloured change impact regions. parency, allowing the user to see the overlapping regions and interpret the extent of the change impact regions. Two scenarios are possible for the change impact regions. A change impact region may encapsulate only a single class (i.e., the class in which a change has been made). In this case, the change is local and is not impacting any other classes within the project. Therefore, if a bug is manifesting itself elsewhere in the project, its source cannot be in this class. In other circumstances, a change impact region may encapsulate multiple classes (i.e., the class in which a change has been made, and other classes that make calls to the changed method). In this case, if the bug is manifesting itself in one of the classes within this change region, the changed class is a candidate for the source of the bug. When a software developer is familiar with the revision history of the project and they know when a bug might have been introduced into the project, they can limit the changes that are shown using a revision filter. Only classes that changed within the revision history start and end dates will be visually encoded as changed nodes (i.e., black) and produce encapsulating change impact regions. The end result of this filter operation is that there will be fewer changed classes to visually encode, and fewer change impact regions to vie for the user’s attention. The software developer can select the class in which a bug is manifesting itself, placing additional visual dominance on it and the other classes in which method calls are being made. The sizes of these class nodes are increased, while at the same time, all other class nodes are made smaller and transparent. As well, the edges representing the method calls are made more dominant, highlighting the portion of the method call stack graph that relates the other classes to the selected class. Combining this focusing action with the colour encoding of the changed classes and change impact regions, software developers can trace from the selected class to the classes that may be the source of the bug.
3.
USING IMPACTVIZ
The process for using ImpactViz to trace a bug from the class in which it is manifesting itself to the source follows Shneiderman’s visual information-seeking mantra [3]. The
visual representation initially shows an overview of all of the class dependencies and revisions in the repository. The software developer can zoom into the particular area of the method call stack graph that contains the class under investigation, as well as filter the revisions to show only the changes between a known bug-free state and when the bug was first identified. The features of a particular class that may be a candidate as the source of a bug can then be examined in detail within the development environment.
4.
CONCLUSION
ImpactViz is a software visualization tool that allows developers to analyze the method call stack and the associated class dependencies, and to visualize the impact that changes in the software code may have on the operation of other classes within the project. The goal is to enable a software developer to easily trace a bug from the class in which it has manifested itself to its potential source locations. By considering which classes have been changed between a previous known bug-free state and when the bug was first identified, the developer can readily identify which changed classes have an impact on the class in which the bug has manifested itself. This can greatly reduce the number of classes that need to be inspected as the source of the bug.
5.
REFERENCES
[1] J. Heer, S. K. Card, and J. A. Landay. Prefuse: A toolkit for interactive information visualization. In Proceedings of CHI, pages 421–430, 2005. [2] C. Pich, L. Nachmanson, and G. G. Robertson. Visual analysis of importance and grouping in software dependency graphs. In Proceedings of SoftVis, pages 29–32, 2008. [3] B. Shneiderman. The eyes have it: A task by data type taxonomy for information visualizations. In Proceedings of VL, pages 336–343, 1996. [4] C. Ware. Information Visualization: Perception for Design. Morgan Kaufmann, 2nd edition, 2004. [5] A. Zeller. Yesterday, my program worked. today, it does not. why? In Proceedings of ESEC/FSE, pages 253–267, 1999.