accuracy, stability, and settling time were evaluated as a function of contrast and ..... full contrast simulations and reduced the contrast by 50% using the Python.
Implementation and Validation of Bioplausible Visual Servoing Control by Vishnu Ganesan, Alec Koppel, Shuo Han, Joe Conroy, Alma Wickenden, Richard Murray, and William Nothwang
ARL-TR-6387
Approved for public release; distribution unlimited.
March 2013
NOTICES Disclaimers The findings in this report are not to be construed as an official Department of the Army position unless so designated by other authorized documents. Citation of manufacturer’s or trade names does not constitute an official endorsement or approval of the use thereof. Destroy this report when it is no longer needed. Do not return it to the originator.
Army Research Laboratory Adelphi, MD 20783-1197
ARL-TR-6387
March 2013
Implementation and Validation of Bioplausible Visual Servoing Control Vishnu Ganesan Sensors and Electron Devices Directorate, ARL and Case Western Reserve, Cleveland Clinic
Alec Koppel Sensors and Electron Devices Directorate, ARL and University of Pennsylvania, GRASP Lab
Joe Conroy, Alma Wickenden, and William Nothwang Sensors and Electron Devices Directorate, ARL
Shuo Han and Richard Murray California Institute of Technology
Approved for public release; distribution unlimited.
Form Approved OMB No. 0704-0188
REPORT DOCUMENTATION PAGE
Public reporting burden for this collection of information is estimated to average 1 hour per response, including the time for reviewing instructions, searching existing data sources, gathering and maintaining the data needed, and completing and reviewing the collection information. Send comments regarding this burden estimate or any other aspect of this collection of information, including suggestions for reducing the burden, to Department of Defense, Washington Headquarters Services, Directorate for Information Operations and Reports (0704-0188), 1215 Jefferson Davis Highway, Suite 1204, Arlington, VA 22202-4302. Respondents should be aware that notwithstanding any other provision of law, no person shall be subject to any penalty for failing to comply with a collection of information if it does not display a currently valid OMB control number.
PLEASE DO NOT RETURN YOUR FORM TO THE ABOVE ADDRESS. 1. REPORT DATE (DD-MM-YYYY)
2. REPORT TYPE
March 2013
Final
3. DATES COVERED (From - To)
4. TITLE AND SUBTITLE
5a. CONTRACT NUMBER
Implementation and Validation of Bioplausible Visual Servoing Control 5b. GRANT NUMBER
5c. PROGRAM ELEMENT NUMBER
6. AUTHOR(S)
5d. PROJECT NUMBER
Vishnu Ganesan, Alec Koppel, Shuo Han, Joe Conroy, Alma Wickenden, Richard Murray, and William Nothwang
5e. TASK NUMBER
5f. WORK UNIT NUMBER
7. PERFORMING ORGANIZATION NAME(S) AND ADDRESS(ES)
8. PERFORMING ORGANIZATION REPORT NUMBER
U.S. Army Research Laboratory ATTN: RDRL-SER-L 2800 Powder Mill Road Adelphi, MD 20783-1197
ARL-TR-6387
9. SPONSORING/MONITORING AGENCY NAME(S) AND ADDRESS(ES)
10. SPONSOR/MONITOR'S ACRONYM(S)
11. SPONSOR/MONITOR'S REPORT NUMBER(S)
12. DISTRIBUTION/AVAILABILITY STATEMENT
Approved for public release; distribution unlimited. 13. SUPPLEMENTARY NOTES
14. ABSTRACT
In this report, we compare the performance of the Lucas-Kanade algorithm with feature tracking with the bioplausible optical flow algorithm to achieve pose stabilization in the context of one-dimensional (1-D) attitude stabilization. These results have been benchmarked against an ideal controller in both simulation and robotic experimentation. Within both environments, the accuracy, stability, and settling time were evaluated as a function of contrast and system noise. Both algorithms achieved reasonable performance when compared to the ideal controller, but in most cases the Lucas-Kanade algorithm outperformed the bioplausible algorithm. Within the evaluated serial implementation, the Lucas-Kanade algorithm was also faster. It is anticipated that both performance and processing speed will improve for the bioplausible algorithm when it is implemented in a parallel instantiation. 15. SUBJECT TERMS
Optical flow, feature tracking, bioplausible, pose stabilization, computational efficiency, robotic control 17. LIMITATION OF ABSTRACT
16. SECURITY CLASSIFICATION OF: a. REPORT
Unclassified
b. ABSTRACT
Unclassified
c. THIS PAGE
Unclassified
UU
18. NUMBER OF PAGES
32
19a. NAME OF RESPONSIBLE PERSON
William Nothwang 19b. TELEPHONE NUMBER (Include area code)
(301) 394-1163 Standard Form 298 (Rev. 8/98) Prescribed by ANSI Std. Z39.18
ii
Contents
List of Figures
v
List of Tables
vi
1.
Introduction
1
2.
Visual Servoing Techniques
2
3.
2.1
Bioplausible Control........................................................................................................3
2.2
Feature Tracking..............................................................................................................4
2.3
“Ideal” Control ................................................................................................................5
Simulations
5
3.1
Contrast ...........................................................................................................................6
3.2
Noise................................................................................................................................6
3.3
Controller Gains ..............................................................................................................6
3.4
Simulation Setup .............................................................................................................7
4.
Experimental Approach
8
5.
Simulation Results
9
6.
5.1
Controller Stability ........................................................................................................10
5.2
Steady State Errors ........................................................................................................11
5.3
Settling Time .................................................................................................................12
5.4
Summary .......................................................................................................................13
5.5
Computation Time.........................................................................................................13
Experimental Results 6.1
14
360° Sweep ....................................................................................................................15
7.
Conclusions
17
8.
References
19
iii
List of Symbols, Abbreviations, and Acronyms
22
Distribution List
24
iv
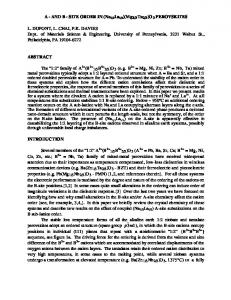
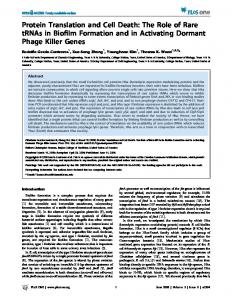
List of Figures Figure 1. Example simulation of compound fly vision in GUF. This is the rendering of a forest environment seen through the receptors of a model fly...................................................5 Figure 2. Full contrast (top) and low-contrast (bottom) naturalistic panorama scenes used in the cylindrical arena for fsee rendering. These scenes are included in the GUF simulator (25). ............................................................................................................................................6 Figure 3. Overview of the simulation setup and the number of simulations used. .........................7 Figure 4. Input images to the algorithms under different environments. The images have been upscaled for visualization purposes only...........................................................................8 Figure 5. Two scenes representing low (bottom) and high (top) contrast environments used in testing the TurtleBot on the two algorithms. .........................................................................9 Figure 6. Percentage of simulations for each controller and environment where the system was stable. The graph on the left corresponds to the high-contrast simulation environment, and the image on the right corresponds to the low-contrast environment. The three shaded bars for each controller correspond to No Noise (light gray), 10% Noise (medium gray), and 20% noise (dark gray). ............................................................................10 Figure 7. Simulation results looking at the mean steady-state error and variance across the 25 combinations of gains for each controller in each of the six environments varying in noise and contrast. The bars represent the mean of the 25 trials and the error bars represent ±1 STD. The mean and STD for the ideal controller were approximately 0. The graph on the left corresponds to the high-contrast simulation environment, and the image on the right corresponds to the low-contrast environment. The three shaded bars for each controller correspond to No Noise (light gray), 10% Noise (medium gray), and 20% noise (dark gray). The “ideal” controller had a steady-state error of 0.0 ±0.0 degrees....................11 Figure 8. Average settling time for each controller across 25 combinations of gains. Error bars represent the standard deviation in settling times across the 25 gains. The graph on the left corresponds to the high-contrast simulation environment, and the image on the right corresponds to the low-contrast environment. The three shaded bars for each controller correspond to No Noise (light gray), 10% Noise (medium gray), and 20% noise (dark gray). ...............................................................................................................................12 Figure 9. Percent of cases in the 360° sweep where the TurtleBot accurately stabilized back to the goal orientation. .............................................................................................................15 Figure 10. Percent of cases in the 360° sweep where the controller kept the TurtleBot stable, even if the stabilization point was incorrect. ...........................................................................16
v
List of Tables Table 1. The Kp and Kd gain settings examined. ............................................................................7 Table 2. Computation time measurements and estimates for serial and parallel implementations. ......................................................................................................................13 Table 3. The accuracy of the controller, when the controller settled to an image for both high- and low-contrast environments.......................................................................................17
vi
1. Introduction In recent years, micro air vehicles (MAVs) have been increasingly applied in rescue, surveillance, and aerial observation tasks. These new applications demand more autonomous behavior to support human operators, improve capabilities, and generally increase operational safety (17). For many of these applications, MAVs are required to navigate complex urban environments in potentially turbulent conditions. The signal processing, control system, and hardware computation bandwidth constraints are major hurdles in tackling this problem. MAVs typically have wingspans less than 6 in and small payload capacities, limiting their size, weight, and power usage (18). Visual sensors offer the potential to address the bandwidth issue within the overall size, weight, and power (SWaP) constraints. In this report, we focus on vision-based algorithms for control, collectively known as visual servoing. Visual servoing algorithms in robotics have been extensively developed over the past two decades for use in industrial applications, stabilization, and navigation (11, 13–15). Visual servoing processes information gathered by an image sensor to generate control signals to steer a dynamical system by comparing where a system is, as measured by the visual sensor, to where the system should be (20). Most of the available servoing techniques use optical flow, which can be generally divided into two classes: those that use the whole image to improve accuracy and those that use a portion of the image to improve computational cost. Those that use a portion of the image are typically either feature based or model based. Feature-based servoing tracks twodimensional (2-D) features such as points, lines, circles, or other points of interest, which can be extracted using computer vision techniques (21). Model-based approaches extract a threedimensional (3-D) model representation of the object being tracked and, assuming the model is highly correlated to the object, are typically more robust to outliers and occlusions (21). Recently, visual servoing approaches that bypass the classic matching and tracking approach, such as those by Collewet et al., (14), Deguchi (22), and Kallem et al. (16), have been proposed. Kallem et al. (16) for example, consider using a kernel-based method that gives a highly decoupled control law. However, this approach cannot be used for six-degrees-of-freedom (DOF) control of a robot (20). In that manner, the Murray group (3) has developed what they define as a bioplausible approach to visual servoing. Bioplausibility refers to a loose collection of engineering principles that seek to confine design research to that which could occur in a biological process (such as a neural network) (2). Control theory inspired by the principles of biological systems has recently made significant advancements due to the work of Dickson et al. (1) and many others. The bioplausible approach proposed by Han et al. (2), and implemented in this report, uses the full image and removes the normalization matrix to enable it to be featureless and parallelizable, thus reducing
1
the computational cost, but this process is at the expense of global normalization, which introduces some approximation error. In the constrained MAV environment, algorithms that have both speed and minimal approximation error are desirable (19). Toward this end, we present two algorithms within this report. The first, based on the work by Han et al. (2) uses the more accurate full image and then relaxes the algorithm to improve the computational cost. The second approach begins with a feature tracking based approach that is initially less accurate but more computationally efficient, and then we introduce some iterative windowing. This improves the accuracy but at some additional computational cost. Our previous research (23) indicated that the bioplausible algorithm developed by Han et al. (2) was stable for modest noise and contrast. However, for high noise and low contrast, the bioplausible control algorithm had difficulty settling in a time that enable the control loop to be closed fast enough for stable flight. It is anticipated that the bioplausible control will converge more quickly but at a reduced accuracy for pose stabilization behavior. To fully evaluate the efficacy of the proposed bioplausible approach, it is essential to understand the tradeoffs between the complexity of the visual servoing task in terms of sensor noise and image contrast, the bandwidth of the feedback controller, the stability of the closed loop, and the performance of the closed loop system (18). We examine these tradeoffs by comparing the newly developed bioplausible control against the Lucas-Kanade (L-K) imagebased feature tracking approach (4) in simulation and experimental platform
2. Visual Servoing Techniques For this report, we implement a proportional-derivative (PD) control using either the bioplausible or the L-K approach to accomplish a visual servoing task. Visual servoing aims to drive the orientation and position of the robot to a reference image (26). Visual servoing was chosen as an exemplar task because it is sensitive to both noise and contrast, can be computationally intractable, and enables an exact comparison between the goal and current state for all controls We assume at each time a collection of sensors with a fixed field of view and orientation relative to the vehicle body center outputs a visual field. The assumption of a discrete visual field is equally applicable to standard cameras, catadioptric cameras, or the compound vision of a fruit fly. From this assumption, it is possible to map each pixel on the focal plane to a vector on the unit sphere . Thus, as shown in equation 1, each observed luminance can be transformed through a function defined on the unit sphere: (1) where m is some known map of the orientation, environment, and time to the visual input . R is the body attitude and s spans the visual sphere (2).
2
Both the bioplausible and L-K approaches were shown to be nominally robust in all three axes in simulation with moderate noise and contrast. For visualization purposes, in this report, we constrain the simulation and the experimental controls to one dimension (yaw), and evaluate the effects of noise, contrast, computational load, and settling time for both the bioplausible and L-K compared to an ideal control. 2.1
Bioplausible Control
The bioplausible visual servoing technique aims to be parallelizable and featureless in its computations. The bioplausible approach calculates the raw error between the observed image and the goal image, and generates the input control servoing signals from the change in error with time. The full derivation of this approach can be found in Han et al. (2). Here, we predefine a goal image , which is a particular value of at a certain goal orientation , where y is the vector of luminosities or pixel brightness values. The problem of visual attitude stabilization is stated succinctly as choosing the input torque such that the error between the visual input and the goal image approaches zero. Under mild assumptions on the environment, this also guarantees that the orientation approaches and the angular velocity approaches zero. The problem of visual attitude stabilization amounts to minimizing an error function that represents how “far” away the present visual input is from the goal image. The error function we chose to minimize is . From Censi et al. (3), we know the gradient flow that minimizes this cost functional is differential operator
. In equations 2, we define S to be a linear
(2) where refers to the space of continuous functions from tangent vector field to the unit sphere.
to
and
is the
Equation 3 represents the control law as a PD controller with as the proportional part and as the derivative part. The damping term is necessary to choose the torque such that is driven to zero near the goal image. (3) This control makes , locally asymptotically stable. We define , the bilinear estimate of the angular velocity. Therefore, the above control simplifies to (3). For the results presented in this report, we further simplify this control for use in onedimensional (1-D) yaw stabilization.
3
2.2
Feature Tracking
To evaluate the proposed bioplausible control, we have implemented another PD control using the Shi and Tomasi corner detector for feature identification and the sparse implementation of the L-K algorithm for tracking them (4, 5, 8). Together, these two algorithms are compared against the bioplausible control for stabilization. Using the L-K feature tracking algorithm, we can determine the shifts of features between the goal image and the observed to generate an error, which is fed to the control loop. As with the bioplausible control, the aim of feature tracking, shown in equation 4, is to minimize an error e(t) and bring the system to the goal image and orientation. The error is defined here as (4) where is the set of measurements in the observed image, e.g., pixel brightness values. These image measurements are used to compute a vector of k visual features, , e.g., using the Shi and Tomasi corner detector. The vector contains the features in the goal image (7). This error term should be interpreted as the “distance” between the features of the present image and the features of the goal image. To identify features, we use the Shi and Tomasi corner detector (8) and track these features from image to image using the sparse implementation of the L-K algorithm (4, 5). The tracking problem can be explained in the following way. As shown in equation 5, for two grayscale images, and , where is the value of the pixel at . If we let be a feature in image , we want to find
on such that
is similar to
.
.
(5)
in this case is the optic flow at . In our case, d is the error between the two points. L-K estimates using a least-squares minimization of the error residual, as shown in equation 6: (6) Here, and are the integration window size parameters. We use the pyramidal implementation of the L-K tracker in our algorithm (6). For this study, we perform 1-D visual servoing in the yaw axis and compute the error as the average of for all the features found in the image. To add robustness to the L-K controller, we reject mistracked points by computing from both and and removing points that differ by more than 50 pixel lengths. Our final control law is shown in equation 7. (7)
4
is the spatial difference on the x-axis between the observed feature and the goal feature for the i-th feature; and n is the number of features. We use implementations of the Shi and Tomasi corner detector and the LK feature tracker found in the open source computer vision library, OpenCV, for our simulations and experiments. 2.3
“Ideal” Control
We create an ideal linear controller within the simulation that knows its exact orientation at all times. This perfect controller provides a reference to compare the bioplausible and feature tracker against. The error for this ideal controller is the signed difference in angle between the goal and the current orientation. The ideal PD control law the same as equation 7 with perfect knowledge of state and error.
3. Simulations Our simulations are implemented on the Grand Unified Fly (GUF) component fsee, a fly vision simulation environment illustrated in figure 1 (25). Given a 3-D virtual world model, fsee generates monochromatic luminance readings for a simulated hexagonally sampled 1398 fly ommatidia (3). We choose a cylindrical arena as the environment with a panorama of a natural scene on the walls of this environment along with a sky and ground. The contrast and noise within the image shown in figure 1 were altered, and the settling time, residual error, and stability were measured for the bioplausible, L-K, and ideal PD controllers across a range of controller gains. Grand Unified Fly Goal Image
Example Starting Image
Figure 1. Example simulation of compound fly vision in GUF. This is the rendering of a forest environment seen through the receptors of a model fly.
We describe the rotational motion of a fully actuated rigid body through a constrained secondorder system. We constrain the torques that can be applied to this system to those seen in natural fly saccades (9), as shown in equation 9.
5
(8) Here
is the body attitude with respect to a fixed world frame; and are the angular velocity and its associated skew-symmetric matrix, respectively; is the symmetric angular inertia matrix; and is the input torque. Note that in our simulations, is set to the identity matrix. 3.1
Contrast
The performance of many visual servoing algorithms suffer when there is low contrast or texture. To investigate the effect of low contrast on the controllers, we took the naturalistic scene that was used for the full contrast simulations and reduced the contrast by 50% using the Python Imaging Library (PIL). The two scenes are shown in figure 2.
Figure 2. Full contrast (top) and low-contrast (bottom) naturalistic panorama scenes used in the cylindrical arena for fsee rendering. These scenes are included in the GUF simulator (25).
3.2
Noise
Real-world sensors at the MAV scale are often very noisy, and image collection and rendering can add additional noise to a system. To investigate the effect of noise on the controllers and evaluate their robustness, we added Gaussian noise with a range of standard deviations to the simulated luminance values of the GUF environment. We tested noise levels of 0%, 10%, and 20%. An n-vector of randomly distriburted numbers with a stadard deviation of 0, 0.1, and 0.2 was created, and then normallized from 0–255 (the max pixel intensity). This was added to the original image to create the 0%, 10%, and 20% noise. 3.3
Controller Gains
The bioplausible control law lacks a normalization term, as such the controller is sensitive to change in contrast within the observed environment. For optimum control, gains would need to be adjusted for different environments. Thus, to have a fair comparison across controllers, we ran simulations using a range of 25 and gains. Across all the simulations and controllers we
6
kept the ratio of the constant while scaling them individually for each controller to account for the differences in magnitude of the error computation. The matrix of simulations conducted is shown in table 1 and figure 3. For these simulations we used the following gain ratios: Table 1. The Kp and Kd gain settings examined.
1. 2. 3. 4. 5. 6. 7. 8. 9. 10. 11. 12. 13.
Kp:Kd ratio 4.5 14. 20.0 5.6 15. 22.0 6.4 16. 25.0 7.8 17. 35.0 8.2 18. 45.0 9.1 19. 50.0 10.0 20. 50.0 10.0 21. 55.0 10.0 22. 70.0 11.1 23. 90.0 12.2 24. 100.0 14.0 25. 110.0 18.0
Scaling Factors Bioplausible 0.1 LK Feature Tracker 4.5 Ideal Controller 1.0
Figure 3. Overview of the simulation setup and the number of simulations used.
3.4
Simulation Setup
We initialize each simulation with a random goal orientation. We rotate the system 40° clockwise (CW) or counterclockwise (CCW) from this goal orientation—this is the initial orientation where the simulation begins. The pose stabilization control law tries to bring the system back to the goal orientation. We simulated 25 sets of gains, 3 types of controllers, 2 types of environments, and 3 noise levels, for a total of 450 simulations. For each simulation, we tracked the geodesic distance* between the goal orientation and the system’s orientation across time. While the bioplausible controller is able to directly use the luminosity readings of the full image of 1398 simulated fly ommatidia, the L-K feature tracking implementation in OpenCV was not designed to process the hexagonally sampled luminositie. To establish a reasonible basis for *Geodesic distance can be thought of as arc length across along the surface of a sphere; the geodesic degree follows naturally. When geodesic distance approach zero, it implies the current has reached the goal orientation.
7
comparison, we used the fsee program to render a mercator representation of the luminosities (figure 1) and used the resulting 273 x 143 pixel image as the input for the L-K feature tracker an the Shi and Tomasi feature detector.
4. Experimental Approach In order to validate the simulation results, experiments were performed using the mobile robot TurtleBot developed by WillowGarage (27). We conducted stability analysis of the two control algorithms in a real-world environment using the TurtleBot. Method. At a fixed position, we rotate the TurtleBot a full 360° in approximately 20° intervals. At each 20° interval, we set the observed image as the goal. We then rotate the TurtleBot clockwise by 20° and activate either the bioplausible or the feature tracker control law. Ideally, either control law should rotate the robot 20° CCW to return it back to the goal image and orientation. In the experiment, we note whether the controller was (1) able to return the system back to the goal orientation and stabilize, (2) whether the system stabilized but to an incorrect goal orientation, or (3) whether the system was unstable. To create a high and low-contrast environment, we modified the lighting in the room. Figure 4 shows examples of the images under different conditions that the control algorithms operated on. A series of 25 tests at each environmental condition were performed. Blurred
Normal
Low Contrast
High Contrast
Figure 4. Input images to the algorithms under different environments. The images have been upscaled for visualization purposes only.
8
The robot uses a differential drive for motion and is equipped with a Kinect sensor (28). The Kinect provided RGB image data for the bioplausible and feature tracker control algorithms tests. The input image of 640x480 was resized down to 40x32 (1280 pixels) for use in the control algorithms. For the bioplausible controller, we first blurred the image using a 64x64 Gaussian kernel before resizing, as we found it decreased noise and inaccuracy in the residual error measurement. For the feature tracker, we examined both a blurred and unblurred input image. We repeated the experiments in both a high-contrast and low-contrast environment, as shown in figure 4. Figure 5 shows a panorama of the testing environment in what we called the low and high-contrast states.
Figure 5. Two scenes representing low (bottom) and high (top) contrast environments used in testing the TurtleBot on the two algorithms.
We did not use the depth data from the Kinect. The proportional gain for the bioplausible controller used to perform the following experiments was for the low-contrast case and in the high-contrast case. The proportional gain for the feature tracker was set to in both the high- and low-contrast cases. We found the inherent damping of the TurtleBot to be sufficient for stable control and did not require a derivative term for the PD controller.
5. Simulation Results In order to study the performance of the three visual servoing algorithms (bioplausible, feature tracker, and “ideal”), a set of simulations were carried out across 25 different combinations of proportional and derivative gains. We explored two levels of contrast (high and low) and three levels of sensor noise (none, 10%, and 20%). For each algorithm, under each condition, we evaluated the stability of the controller, the residual steady state error, and the settling time. Additionally, we calculated the computation required to execute each algorithm.
9
5.1
Controller Stability
In the high-contrast environment, shown on the left of figure 6, all three visual servoing algorithms were stable across all combinations of gains and image noise tested. Simulations where the geodesic distance between the goal orientation and the rigid body’s orientation exceeded 180° were marked as unstable. Noise is plotted for each controller type and for both contrast environments, where light gray corresponds to no noise; medium gray corresponds to 10% noise; and, dark gray corresponds to 20% noise. However, in the low-contrast environment, the bioplausible controller remained stable for only 60%–72% of the simulations depending on noise level, while both the feature tracker and ideal controller were stable for 100% of those identical simulations (figure 5). It is interesting to note that for the bioplausible control in the low-contrast environment, the 20% noise performs better than the 10% noise. Increasing the noise level adds additional energy to the system allowing the controller to avoid some local minima. As the magnitude of proportional term is generated by the magnitude of the error term, without a global normalization term, changes in contrast have a greater impact on the stability of the bioplausible controller than do increases in sensor noise. Controller Stability in Simulation
Figure 6. Percentage of simulations for each controller and environment where the system was stable. The graph on the left corresponds to the high-contrast simulation environment, and the image on the right corresponds to the low-contrast environment. The three shaded bars for each controller correspond to No Noise (light gray), 10% Noise (medium gray), and 20% noise (dark gray).
The graphs in figure 6 indicate 100% stability for all cases, except those for the bioplausible control under low-contrast environments. This performance is expected, as the bioplausible control algorithm discards the normalization matrix that would account for changes in the environment, such as contrast, to accelerate the computation.
10
5.2
Steady State Errors
We examined the steady-state error for each controller across the different noise and contrast environments. We define steady-state error as the maximum deviation from the goal orientation reached when starting the simulation at the goal orientation. In figure 7, we see that for both the bioplausible controller and the feature tracker the steady-state error increases with increasing noise and decreasing contrast. Noise is plotted for each controller type and both contrast environments, where light gray corresponds to no noise, medium gray corresponds to 10% noise, and dark gray corresponds to 20% noise. The bars in the graphs represent the range of values for each of the different gains tested. Across all the simulations, the feature tracker has lower variance in the steady-state error as a function of the gains tested. Yet there is no evidence to support the feature tracker has significantly lower steady-state errors. Both the feature tracking algorithm and the bioplausible algorithm had statistically significant differences from perfect control under all conditions. Controller Steady State Error – Simulation 50
Steady State Error (Degrees)
45
High Contrast Environment
Low Contrast Environment
40 35 30 25 20% Noise 20 15 10% Noise 10 No Noise 5 0
Bioplausible
Feature Tracker
Ideal
Bioplausible
Feature Tracker
Ideal
Controller Type Figure 7. Simulation results looking at the mean steady-state error and variance across the 25 combinations of gains for each controller in each of the six environments varying in noise and contrast. The bars represent the mean of the 25 trials and the error bars represent ±1 STD. The mean and STD for the ideal controller were approximately 0. The graph on the left corresponds to the highcontrast simulation environment, and the image on the right corresponds to the low-contrast environment. The three shaded bars for each controller correspond to No Noise (light gray), 10% Noise (medium gray), and 20% noise (dark gray). The “ideal” controller had a steady-state error of 0.0 ±0.0 degrees.
11
5.3
Settling Time
For each simulation, we measure a settling time, as defined as the time the system took to stabilize to within 10% of the initial displacement from the goal image. Because settling time is determined to a large extent by the proportional and derivative gains, for each controller in each environment, we measure a mean settling time and a standard deviation across 25 sets of gains. As shown in figure 8, there is a large standard deviation in the settling times, which is expected because we tested a wide range of gains for each setup. We found that in the ideal case of nonoise, both the bioplausible and the feature tracker settled at approximately the same time. Interestingly, in this case, both the bioplausible and the feature tracker outperformed the ideal control. Settling Time – Simulation 3
Low Contrast Environment
High Contrast Environment
*Limited data
Mean Settling Time (s )
2.5 20% Noise 2 10% Noise 1.5
1
No Noise 0.5
*No Data 0
Bioplausible
Feature Tracker
Ideal
Bioplausible
Feature Tracker
Ideal
Controller Type
Figure 8. Average settling time for each controller across 25 combinations of gains. Error bars represent the standard deviation in settling times across the 25 gains. The graph on the left corresponds to the highcontrast simulation environment, and the image on the right corresponds to the low-contrast environment. The three shaded bars for each controller correspond to No Noise (light gray), 10% Noise (medium gray), and 20% noise (dark gray).
Adding 10% and 20% noise to the system caused the settling times to increase for both the bioplausible and feature tracker algorithms. The increase in variance within the settling times is more pronounced for the bioplausible control over the feature tracker due to the lack of a normalization matrix within the bioplausible control algorithm. In the low-contrast, 20% noise scenario, the settling time for the bioplausible control simulations exceeded the time limits of the simulation. In the high-contrast environment, while the mean settling time for the bioplausible controller is larger than for the feature tracking algorithm, this difference is not statistically significant (figure 7).
12
5.4
Summary
In simulation, we found that in the ideal case without noise, both the feature tracker and bioplausible controller were comparable in performance in all three criteria, stability, steadystate error, and settling time. Contrast appeared to have a greater impact on stability than noise for the bioplausible control. In steady-state error, the bioplausible control performed comparably to the feature tracker. While the feature tracker algorithm generally had a smaller variance and a lower error across all the gains tested under the different environments, it was not significantly better than the bioplausible control. For each condition, with the exception of the low-contrast with 20% noise, there were particular combinations of gains for which the bioplausible control outperformed the L-K feature tracker. In settling time measurements, both the feature tracking and bioplausible algorithms outperformed the linear controller with perfect sensors for the particular sets of gains used. It is possible the nonlinearity in the bioplausible and feature tracker controls work better for the proportional and derivative gain ratios used in this study. Otherwise, in the high-contrast case the bioplausible control performed comparably to the feature tracker across the different noise levels. Contrast appeared to have a greater impact on the bioplausible controller. In the low-noise case for the bioplausible control, many simulations did not settle within the fixed time. 5.5
Computation Time
We approximated the computation time (table 2) of each algorithm by timing the crucial steps across 1000 iterations of the simulation. For the bioplausible control, the important steps were the two matrix multiplications to estimate and where and We use Python’s NumPy library for the matrix multiplication. grad_r[i] = -dot(dot(S[:,:,i],y_lum), g_lum) omega_est[i] = dot(dot(S[:,:,i],y_lum), y_dot)
For the feature tracker, the crucial steps are identifying good features and tracking them using L-K pyramidal implementation in OpenCV 2.3. In Python code: pp = cv2.goodFeaturesToTrack(im_array, mask = mask, **self.feature_params) p1, st, err = cv2.calcOpticalFlowPyrLK(img0, img1, p0, None,**self.lk_params) p2, st, err = cv2.calcOpticalFlowPyrLK(img1, img0, p1, None,**self.lk_params) Table 2. Computation time measurements and estimates for serial and parallel implementations. Measured Serial Implementation of Bioplausible Control
8.17 s
Measured Serial Implementation of L-K Feature Tracker
1.22 s
The measurements were done on a Dell Latitude with Intel Pentium M 1.86 GHz processor and 1 GB of RAM. Both timings were done using Python’s time.time() function. It is important to note that these timings may not exactly reflect computational complexity due to underlying
13
.
optimizations done within the NumPy and OpenCV libraries. Furthermore, the timings do not take into account the benefits of parallelization the bioplausible control offers. However, they provide a rough approximation of computational workload. Timing measurements suggest that the L-K feature tracker implementation is faster than the bioplausible control algorithm. To further examine this, we followed up the timing measurements with a computational complexity analysis. the OpenCV implementation of the LK feature tracker scales with O(N*Q), where N is the number of pixels within a window and Q is the number of features tracked (30, 31). From the work by Baker and Matthews (28), the complexity of the L-K approach O(n2*N+n3), we fix the warp factor (n) at 2, so it’s O(N) for one optic flow estimate. Thus O(n2*N+n3) reduces to O(N*Q). This is preceded by the one-time call to the Shi and Tomasi corner detector (31), which can be quite complex depending on implementation. The serial implementation of the bioplausible controller used and evaluated in this report scales with , where N is the number of pixels. However, the bioplausible algorithm was designed to operate in parallel. Parallelizing the bioplausible control algorithm across N number of processors, where N is the number of pixels should bring the computation complexity down to O(N log N), but this does not account for inline delays needed. The actual implementation of a parallelized bioplausible control will be O(N*log(N)) in the best case and O(N3) in the worst case. The L-K algorithm is not as readily parallelized, but it too would benefit from parallelization, such that the computational cost would become O(N*log(Q)) in the worst case and O(Q) if a version of the L-K algorithm that was more amenable to parallelization was implemented. It is estimated that the parallel implementation of the bioplausible control would require substantially less computational time than the L-K implemented either serially or in parallel or the serial bioplausible implemented algorithm. This analysis explains the results seen in the timing analysis. After the one-time step of identifying features, the LK tracker scales linearly with window size and number of features, where as the bioplausible controller scales with the fourth power of the number of pixels. In our simulations, the window size used for the L-K algorithm was 15x15 (N=225) and the number of features tracked was roughly 10. The image size for the bioplausible controller was N=1398. Thus, the bioplausible algorithm operating in serial requires a much greater number of computations.
6. Experimental Results A series of experiments were performed to validate the simulation results with the TurtleBot. The results are shown for the TurtleBot rotating a full 360° in approximately 20° intervals, setting a new goal image each time. The L-K and bioplausible algorithm were assessed on whether each was (1) able to return the system back to the goal orientation and stabilize, (2) whether the system stabilized but to an incorrect goal orientation, or (3) whether the system 14
was unstable. The aggregate results from 25 experiments are shown as a function of contrast and blurring of the L-K algorithm. In addition to resizing the input image from the Kinect down to 40x32, we also attempted to resize it to a 640x12 image and select the two center rows of pixels as the input to the control algorithms. While the bioplausible controller was able to use this input data successfully, the L-K feature tracker algorithm failed at finding features when given a 640x2 input image. Therefore, the experimental results presented here are only those from the 40x32 images. 6.1
360° Sweep
The experimental stabilization and accuracy results for the full 360° sweep of the room in 20° intervals, are shown here. For each orientation, we noted whether the TurtleBot was able to accurately stabilize back to the goal, whether it stabilized to an incorrect goal orientation, or whether it was unstable. These tests were repeated 25 times, and the aggregate results are shown in figures 9 and 10. When we examined the accuracy of the two algorithms, in the high-contrast environment, we found that the feature tracker using the unblurred image performed the best with 69% of cases stabilizing accurately. The difference between the unblurred L-K algorithm and the bioplausible control (at 59% accurate stability) was statistically insignificant. The feature tracker using the blurred image performed the worst (41%). In the low-contrast environment, there were no statistically significant difference between the three controllers; each achieved accurate 45% of the time (figure 9). The reduced contrast environment significantly reduced the ability of both of the algorithms to achieve accurate stability.
Figure 9. Percent of cases in the 360° sweep where the TurtleBot accurately stabilized back to the goal orientation.
15
Next, we looked at the percent of cases in the 360° sweep where the controller went unstable (i.e., did not settle within 30 s). For this stability analysis, stabilization of any sort, to either an accurate goal orientation or an incorrect goal orientation, were equivalent. In the high-contrast environment, the unblurred L-K algorithm achieved the best results (94%), and it was significantly different than the bioplausible algorithm (81% accuracy). In the low-contrast environment, the blurred and unblurred L-K algorithm were not statistically significantly different, and both stabilized significantly more often than the bioplausible algorithm. In each environment, both variations of the feature tracker remain more stable than the bioplausible controller. These results are shown in figure 10.
Figure 10. Percent of cases in the 360° sweep where the controller kept the TurtleBot stable, even if the stabilization point was incorrect.
In general, it appears that the bioplausible controller is more likely to become unstable. We hypothesize that this is a result of the lack of the normalization vector. When switching from the high-contrast to the low-contrast image, we found that the TurtleBot did not initially respond using the bioplausible control algorithm. The gain needed to be increased from to for the controller to provide enough torque for the TurtleBot to rotate. The output of the bioplausible algorithm is directly proportional to the brightness of the environment, as the normalization matrix has been discarded (3). Therefore, a decrease in environment brightness, when switching from the high contrast to the low-contrast environment, needed to be compensated for with higher gains. Similar to the simulations, the experiments on the TurtleBot showed the L-K feature tracker using a sharp input image performing best in both accurate stabilization as well as stability in high-contrast situations. In the low-contrast situation, the bioplausible controller appears more
16
likely to go unstable, but it performs comparably to the feature tracker on accuracy to goal image when it remains stable. Additionally, it is noteworthy that while the bioplausible controller is more likely to not settle, when it does settle, it is much more likely to settle to the correct image. Thus, the bioplausible was much more likely to be accurate, when it did settle. As shown in table 3, the bioplausible controller performed as well as the unblurred L-K algorithm in the highcontrast environment, and is significantly better than the blurred L-K algorithm. In the lowcontrast environment, the bioplausible algorithm significantly outperformed both the blurred and unblurred L-K algorithm. Table 3. The accuracy of the controller, when the controller settled to an image for both high- and low-contrast environments. High Contrast
Low Contrast
Bioplausible
71.4%
63.2%
Feature Tracker
45.5%
40.0%
Feature Tracker-Unblurred
70.8%
45.8%
It is important to note the L-K feature tracker is limited by the rectangular image requirement and fails when using images of unusual sizes such as 640x2. The bioplausible controller is agnostic to the actual shape of the image and works under a 640x2, and will work under any arrangement of pixels as long as their orientations are known.
7. Conclusions We have compared the performance of two visual servoing algorithms with an ideal linear control, the bioplausible controller and the feature tracking controller, in simulation and robotic experimentation. Given that the bioplausible control disregards a normalization term in the algorithm, the greater losses in performance observed in different environments is understandable. However, in highcontrast environments, the bioplausible controller generally performed on par with the feature tracker. The variance in errors, stability, and settling time are larger; however, this was because we were testing over a range of gains while in reality an optimal set of gains would be chosen. In this study comparing the bioplausible control against feature tracking in 1-D yaw stabilization, there are two important outcomes. First, the bioplausible controller is particularly sensitive to contrast. Gains that are dynamically adjusted to scene contrast and brightness may overcome this sensitivity. Second, in good conditions, high contrast and low noise, the bioplausible controller performs comparably to the feature tracker, and given its potential to be parallelized, it could perform faster as well. For non-optimal gains, the bioplausible controller is much more likely to become unstable compared to the feature tracker.
17
Computationally, the serial implementation of the L-K feature tracker ran faster than the bioplausible controller. The true benefit of the bioplausible controller stems from its parallelization capability. Theoretically running the computation across many hundreds or thousands of processing elements should increase speed by orders of magnitude. The same scale of improvements with parallelization simply is not possible with the L-K feature tracker. The validity of this assertion is the subject of future research. The bioplausible controller is more sensitive to the values of the proportional and derivative gains relative to its counterpart the feature tracker. The optimal set of gains to use will change with environment brightness and contrast. A system that is able to dynamically adjust its gains as it traverses through new environments will be required for the bioplausible controller. The gains could be calibrated at predetermined time intervals using. It may be possible to use other sensors such as an inertial measurement unit or a brightness detector to aid in this calibration and gain modification approach.
18
8. References 1. Dickson, W. B.; Straw, A. D.; Poelma, C.; Dickinson, M. An Integrative Model of Insect Flight Control. in 44th AIAA Aerospace Sciences Meeting and Exhibit, 2006. 2. Han, S.; Censi, A.; Straw, A. D.; Murray, R. M. A Bio-plausible Design for Visual Pose Stabilization. in IEEE Conference on Intelligent Robots and Systems, 5679–5686, 2010. 3. Censi, A.; Han, S. A Bio-plausible Design for Visual Attitude Stabilization. in 48th IEEE Conference on Decision and Control, 2009. 4. Lucas, B. D.; Kanade, T. An Iterative Image Registration Technique with an Application to Stereo Vision. in Proc. of the 7th IJCAI, Vancouver, Canada, 674–679, 1981. 5. Tomasi, C.; Kanade, T. Shape and Motion from Image Streams - Afactorization Method. Proc. of the National Academy of Sciences of the United States of America November 1993, 90 (21), 9795–9802. 6. Bouguet, Jean-Yves. Pyramidal Implementation of the Lucas Kanade Feature Tracker. Intel Corporation, Microprocessor Research Labs. 7. Chaumette, F; Hutchinson, S. Visual Servo Control Part I: Basic Approaches. in IEEE Robotics and Automation Magazine 2006, 13 (4), 82–90. 8. Shi; Tomasi, C. Good Features to Track. Proceedings of the IEEE Conference on Computer Vision and Pattern Recognition, 593–600, June 1994. 9. Bender, J. A.; Dickinson M. H. Visual Stimulation of Saccades in Magnetically Tethered Flies. Journal of Exp. Biol. 2006. 10. Hamel, T; Mahony R. Visual Servoing of an Under-Actuated Dynamic Rigid-Body System: An Image-Based Approach. IEEE Transactions On Robotics And Automation April 2002, 18 (2), 187. 11. Corke, P. Visual Control of Robotic Manipulators. CSIRO Division of Manufacturing Technology, 1994. 12. Hafez, A.H.A.; Achar, S.; Jawahar, C. V. Visual Servoing Based on Gaussian Mixture Models. in Proc. IEEE Int. Conf. Robot. Autom., Pasadena, CA, 3225–3230, May 2008. 13. Chesi, G.; Hashimoto, K. Eds. Visual Servoing via Advanced Numerical Methods; New York: Springer-Verlag, 2010.
19
14. Marchand, E.; Chaumette, F. Feature Tracking for Visual Servoing Purposes. Robot. Auton. Syst. Jun. 2005, 52 (1), 53–70, (Special Issue on “Advances in Robot Vision,” D. Kragic, H. Christensen, Eds.). 15. Collewet, C.; Marchand, E. Photometric Visual Servoing. IEEE Trans. Robot. 2011, to be published. 16. Kallem, V.; Dewan, M.; Swensen, J. P.; Hager, G. D.; Cowan, N. J. Kernel-based Visual Servoing. in Proc. IEEE/RSJ Int. Conf. Intell. Robots Syst., San Diego, CA, 1975–1980, Oct. 2007. 17. Brockers, R.; Bouffard, P.; Ma, J.; Matthies, L.; Tomlin, C. 2011 SPIE Conference on Micro- and Nanotechnology Sensors, Systems and Applications III, Orlando, FL, USA. 18. Webb, T; Prazencia, R. Vision-based State Estimation for Autonomous Micro Air Vehicles. Journal of Guidance, Control, and Dynamics May–June 2007, 30 (3). 19. Kurdila, A.; Nechyba, M.; Prazenica, R.; Dahmen, W.; Binev, P.; Devore, R.; Sharpley, R. Vision-based Control of Micro-Air-Vehicles: Progress and Problems in Estimation. 43rd IEEE Conference on Decision and Control, Paradise Island, Bahamas, December 2004. 20. Dame, A.; Marchand, E. Mutual Information-based Visual Servoing. IEEE Trans. on Robotics October 2011, 27 (5), 958–969. 21. Marchand, E.; Chaumette, F. Feature Tracking for Visual Servoing Purposes. Robotics and Autonomous Systems June 2005, 52 (1), 53–70. 22. Deguchi, K. A Direct Interpretation of Dynamic Images with Camera and Object Motions for Vision Guided Robot Control. Int. J. Comput. Vis. Jun. 2000, 37 (1), 7–20. 23. Koppel, A.; Ganesan, V.; Wickenden, A.; Nothwang, W.; Proie, R.; Sadler, B. Slow Computing Simulation of Bioplausible Control; ARL-TR-5959; U.S. Army Research Laboratory: Adelphi, MD, March 2012. 24. Fry, S. N.; Rohrseitz, N.; Straw, A.; Dickinson, M. H. Visual Control of Flight Speed in Drosophila Melangoster. J Exp Biol 2009, (212), 1120–1130. 25. Epstien, M.; Waydo, S.; Fuller, S. B.; Dickson, W.; Straw, A.; Dickinson, M. H.; Murray, R. M. Biologically Inspired Feedback Design for Drosophila Flight. in American Control Conference, New York, NY, 3395–3401, 2007. 26. Deguchi, K. Optimal Motion Control for Image-Based Visual Servoing by Decoupling Translation and Rotation. Proceedings of the IEEE Intl. Conf on Intelligent Robots and Systems, 1998. 27. TurtleBot. http://www.willowgarage.com/turtlebot (accessed May 2012).
20
28. Microsoft Corp. Redmond WA. Kinect for Xbox 360. 29. Rojas, Raúl, Lucas-Kanade in a Nutshell, class tutorial, Freie Universität Berlin. http://www.inf.fu-berlin.de/inst/ag-ki/rojas_home/pmwiki/pmwiki.php?n=Main.Tutorials, (accessed January 8, 2013). 30. Baker,S.; Matthews, I. Lucas-Kanade 20 Years On: A Unifying Framework. International Journal of Computer Vision 2004, 56 (3), 221–255. 31. http://opencv.willowgarage.com/documentation/cpp/imgproc_feature_detection.htm (accessed January 9, 2013).
21
List of Symbols, Abbreviations, and Acronyms Bioplausibility
a loose collection of engineering principles that seek to confine design research to that which could occur in a biological process
CCW
counterclockwise
CW
clockwise
fsee
the optical engine of the GUF flight simulator
GUF
Grand Unified Fly flight simulator for the drosophila
L-K
Lucas-Kanade optical flow algorithms
MAV
micro air vehicle
MOSFETs
metal oxide semiconductor field effect transistors
PD
proportional-derivative/damping (controller)
PIL
Python Image Library
RGB
red, green, blue
STD
standard deviation (normal)
SWaP
size, weight, and power the space of continuous functions from
to
the L-K estimate using a least-squares minimization of the error residual; e.g., the optic flow at . the spatial difference on the x axis between the observed feature and the goal feature for the i-th feature e(t)
error as a function of time vector containing the features in the goal image as the proportional part of the PD controller
k
visual features for the Shi and Tomasi corner detector
kd
gain for the derivative controller
kp
gain for the proportional controller
22
Image with grayscale values at location x,y the
symmetric angular inertia matrix
J(R)
error function
m
known map of the orientation, environment, and time to the visual input . the set of measurements in the observed image, e.g. pixel brightness values
N
The number of pixels in an image
n
the number of features being tracked
Q
the number of features to be tracked
R
orientation goal orientation
R
is the body attitude with respect to a fixed world frame
S
differential operator
s
spans the visual sphere input torque a feature in image a feature in image such that
is similar to
angular velocity the angular velocity matrix ,
bilinear estimate of angular velocity associated skew-symmetric matrix for the angular velocity
and
the integration window size parameters in the x and y direction for the pyramidal implementation of the L-K feature tracker the tangent vector field to the unit sphere
y
the visual input as the derivative/damping part of the PD controller
23
the goal image
NO. OF COPIES 1 (PDF only)
ORAGANIZATION DEFENSE TECHNICAL INFORMATION CTR DTIC OCA 8725 JOHN J KINGMAN RD STE 0944 FORT BELVOIR VA 22060-6218
1
DIRECTOR US ARMY RESEARCH LAB IMAL HRA 2800 POWDER MILL RD ADELPHI MD 20783-1197
1
DIRECTOR US ARMY RESEARCH LAB RDRL CIO LL 2800 POWDER MILL RD ADELPHI MD 20783-1197
1
US ARMY RSRCH LAB ATTN RDRL VTU V
10
US ARMY RSRCH LAB ATTN RDRL CII A E STUMP ATTN RDRL CII A S YOUNG ATTN RDRL CIN B SADLER ATTN RDRL SER L A WICKENDEN ATTN RDRL SED E B MORGAN ATTN RDRL SER L B PIEKARSKI ATTN RDRL SER L W NOTHWANG ATTN RDRL SER L J CONROY ATTN RDRL SER P AMIRTHARAJ ATTN RDRL SE SEDD DIRECTOR
3
CALIFORNIA INSTITUTE OF TECHNOLOGY ATTN E WOLFF ATTN S HAN ATTN R MURRAY
1
UNIVERSITY OF PENNSYLVANIA ATTN A KOPPEL
1
VISHNU GANESAN
TOTAL:19 (19 ELEC)
24