Apr 30, 2013 - The PHC generally works as a hydro-pneumatic spring to absorb the .... Roller assemblies that are bolted to the crown block keep the crown block .... (b) One of the pairs of eccentric hubs on the scaled ..... Drillstring.k = 1.0 × 10⁷ N/m ..... 2.8. 3. 3.2. Heave position [m]. Force [kN]. CMC. SimX. (a) text. −0.1. 0.
Implementation of Active Control Design for Crown Mounted Compensator to Improve Drilling Performance
by Atle Aalerud Tomas Klevmo
Supervisors: Hamid Reza Karimi, UIA Jan Terje Håkedal, NOV
This Master’s Thesis is carried out as a part of the education at the University of Agder and is therefore approved as a part of this education. However, this does not imply that the University answers for the methods that are used or the conclusions that are drawn.
University of Agder, 2013 Department of Engineering Faculty of Technology and Science
Preface This thesis was written as part of the University of Agder’s (UiA) Master of Science program in Mechatronics. Here we have implemented an active control design for a crown mounted compensator to improve drilling performance. The thesis demonstrates the synergy of cooperation between the many fields that make up mechatronics. Combining several fields into one large project gives a unique perspective when it comes to understanding the practical use of the theory that is taught. It was very rewarding and motivating for us to see this multidisciplinary project come to life. References to relevant literature are provided in the bibliography. A special thanks goes to our thesis supervisor, professor Hamid Reza Karimi, PhD, for weekly guidance throughout the 20 weeks the project lasted. We would also like to thank our supervisor and Manager Machine Control, Compensation and Hoisting Equipment at National Oilwell Varco, Jan Terje Håkedal for help and insight into the equipment and for letting us borrow it. Moreover, we want to thank the professors Geir Hovland, PhD, and Michael Rygaard Hansen, PhD, and PhD student Yulin Si for their help throughout the project. We are also grateful to Hugo Rosano, PhD, Kjell Løvås, Arve Johnsen and several other NOV employees for their assistance with specific issues. For help with fabrication of parts and practical matters, our sincere gratitude goes to the UiA laboratory staff, Eivind Arne Johansen and Roy Werner Folgerø. We have found the process very educational and appreciate the opportunity to work with such fascinating equipment.
Grimstad, the 3rd of June 2013
Atle Aalerud
Tomas Klevmo
Atle Aalerud and Tomas Klevmo Implementation of Active Control Design for Crown Mounted Compensator to Improve Drilling Performance
iii
iv
Atle Aalerud and Tomas Klevmo Implementation of Active Control Design for Crown Mounted Compensator to Improve Drilling Performance
Abstract This thesis presents an improved active heave compensation system that has been designed and tested in conjunction with a 1:7 scale model of a passive crown mounted compensator. The combined system has been placed on a Stewart platform to simulate wave induced heave motion. The friction in the passive system produces weight fluctuations on the drill bit that need to be actively attenuated. A reduced heave disturbance leads to faster drilling and longer drill bit life, thereby reducing operational costs. The heave disturbance at the suspended load has as a result of this project been reduced significantly. This was accomplished using an active sub-system which is comprised of a controller, sensors and an electrical actuator. The active sub-system was designed, procured, adapted and assembled on the compensator. Furthermore, nonlinear simulation models were developed as part of the controller design and two control strategies were subsequently designed and simulated. The control strategy employing a LuGre friction estimator was then implemented in the physical system and tested on the Stewart platform. A significant load variation with an RMS of approximately 320 N was apparent in the system, with the main contribution arising from the nonlinear friction in the compensator seals. The LuGre friction model proved to capture most of this behavior and by using the estimator as a feed forward in the control system, the fluctuations were reduced to around 100 N RMS. This thesis demonstrates that implementation of active compensation is feasible using an electric drive and a rack and pinion gear.
Atle Aalerud and Tomas Klevmo Implementation of Active Control Design for Crown Mounted Compensator to Improve Drilling Performance
v
vi
Atle Aalerud and Tomas Klevmo Implementation of Active Control Design for Crown Mounted Compensator to Improve Drilling Performance
CONTENTS
Contents Preface
iii
Abstract
v
1 Introduction
1
2 The 2.1 2.2 2.3
Crown Mounted Compensator (CMC) Principle of Operation . . . . . . . . . . . . . . . . . . . . . . . . . . . . . . . . . The Scaled CMC . . . . . . . . . . . . . . . . . . . . . . . . . . . . . . . . . . . . The Move Towards an Active System . . . . . . . . . . . . . . . . . . . . . . . . .
3 Modeling the Scaled CMC 3.1 The Importance of Correct Models . . . . . . . 3.2 Dynamic Modeling Using Simulation Software . 3.3 Dynamic Modeling Using Differential Equations 3.4 Comparison of the Two Models . . . . . . . . .
. . . .
. . . .
. . . .
. . . .
. . . .
. . . .
. . . .
. . . .
. . . .
. . . .
. . . .
. . . .
. . . .
. . . .
. . . .
. . . .
. . . .
. . . .
3 3 7 10
. . . .
13 13 14 24 33
4 Active Control Design 4.1 Considerations When Choosing a Control System . . . 4.2 Traditional Control with Additional Friction Estimator 4.3 Model Predictive Control . . . . . . . . . . . . . . . . 4.4 Simulation of Control Strategies . . . . . . . . . . . . .
. . . .
. . . .
. . . .
. . . .
. . . .
. . . .
. . . .
. . . .
. . . .
. . . .
. . . .
. . . .
. . . .
. . . .
. . . .
35 35 37 42 48
5 Hardware for Measurement and Control 5.1 Introduction to the Instrumentation . . . . 5.2 Programmable Logic Controller and Control 5.3 Electric Drive, Rack and Pinion . . . . . . . 5.4 Pressure and Force Sensors . . . . . . . . . 5.5 Wire Encoder and Motion Reference Unit .
. . . . .
. . . . .
. . . . .
. . . . .
. . . . .
. . . . .
. . . . .
. . . . .
. . . . .
. . . . .
. . . . .
. . . . .
. . . . .
. . . . .
. . . . .
49 49 51 53 55 56
6 System Implementation 6.1 Transportation and Placement on the Stewart Platform . 6.2 Mechanical Adaptations and Mounting of Instrumentation 6.3 Electrical Wiring . . . . . . . . . . . . . . . . . . . . . . . 6.4 Programming the PLC . . . . . . . . . . . . . . . . . . . .
. . . .
. . . .
. . . .
. . . .
. . . .
. . . .
. . . .
. . . .
. . . .
. . . .
. . . .
. . . .
. . . .
59 59 61 67 69
7 Testing and Verification 7.1 Test Setup . . . . . . . . . . . . . . . . . . . . . . . . . . . . . . . . . . . . . . . . 7.2 Performance . . . . . . . . . . . . . . . . . . . . . . . . . . . . . . . . . . . . . . . 7.3 Implications . . . . . . . . . . . . . . . . . . . . . . . . . . . . . . . . . . . . . . .
79 79 81 89
. . . . . Cabinet . . . . . . . . . . . . . . .
. . . . .
Atle Aalerud and Tomas Klevmo Implementation of Active Control Design for Crown Mounted Compensator to Improve Drilling Performance
vii
CONTENTS
8 Conclusion
91
Bibliography
92
List of Figures
95
List of Tables
98
Appendix
A Abbreviations
99
B SimulationX Model Report
103
C Motion Reference Unit (MRU) Supporting documentation
123
D PLC, New Program Blocks *
127
viii
Atle Aalerud and Tomas Klevmo Implementation of Active Control Design for Crown Mounted Compensator to Improve Drilling Performance
CHAPTER 1. INTRODUCTION
Chapter 1
Introduction The cost of drilling a well is primarily time dependent [29]. This implies that the faster the drilling of a well can be completed, the lower the cost will be of completing the well. Many operations are required to drill and complete a well, but perhaps the most important operation is the drilling of the bore hole [29]. The most common term used when discussing drilling efficiency is Rate of Penetration (ROP). It is the rate at which a drill bit breaks the rock to make the hole deeper. Normally ROP is influenced by several parameters including type of drill bit, type of rock, revolutions per minute, downhole pressure and weight on bit (WOB) [14]. The rate of penetration for a given set of circumstances increases with increasing weight on bit until a certain optimal weight on bit is reached and decreases with further weight on the bit [29]. Hence, optimizing the drilling performance depends very much on stabilizing WOB. Drilling offshore from ships and floating rigs makes controlling the WOB more difficult than from fixed platforms for obvious reasons. Floating drilling vessels are not stable and wave induced heave motion can therefore interfere with the drill string and seabed interaction. This problem exists in six degrees of freedom, but heave motion is the most problematic and will be the focus of this thesis. A drilling vessel is designed to act as a stable work platform minimizing the effects of heave, roll and pitch as much as possible. Heave motion is typically in the range of 0.2 to 2 meters with a period of 5 to 15 seconds [21]. Higher heave amplitudes typically occur at the longer wave periods and some sea areas experience more benign weather conditions than others [21]. The motivation is therefore strong to reduce the heave disturbance at the suspended load in order to stabilize the WOB. There are many ways to accomplish this reduction, some of which will be presented in the next chapter. The scope of this thesis is limited to heave compensation for drilling operations where the drill bit is in contact with the formation. Over the years, passive, active and semi-active heave compensation systems have been developed in order to reduce heave related issues. Passive heave compensation (PHC) systems such as drill string compensators and riser tensioners have been in use since the 1970’s and are still in widespread use. The PHC generally works as a hydro-pneumatic spring to absorb the forces generated as the vessel heaves in relation to the drill string while it is in contact with the seabed [15].
Atle Aalerud and Tomas Klevmo Implementation of Active Control Design for Crown Mounted Compensator to Improve Drilling Performance
1
CHAPTER 1. INTRODUCTION According to its installation position, the system can be referred to as crown block compensator, travelling block compensator, deadline compensator and fast line compensator [19]. The crown mounted compensator (CMC) is a common drill string compensation system which compensates the heave using the mentioned principle. As there are no power consuming parts in the passive compensator, the solution is very cost efficient during operation. However, it can not achieve the precision of an active system. One strong advantage of using a combination of a passive and an active system is that the system will continue to work in the event of a failure in the active system. Another point is that the passive system will never become unstable, as it only dissipates energy. The aim of the project was to develop a new control approach for WOB stabilization for vertical dynamic vessel heave. Models and control systems had to be evaluated, documented and tested using a scaled model of the CMC mounted on a Stewart platform. Actuation for active control was to be done by implementing an electric drive and control cabinet that was supplied by NOV and adapting it to fit on the CMC using a rack and pinion that needed to be procured. The drive should only be strong enough to compensate for the friction as the CMC does the heavy lifting. Modeling and simulation of the system, and testing of control systems, could be done using software such as Mathworks Matlab and ITI SimulationX. The Siemens SIMATIC Step 7 software was to be used for programming the controller and the accompanying WinCC Flexible was be used to create a Human Machine Interface (HMI) for operating the system. The program PLC Log from NOV was to be used for creating logs. The primary goals of the project were: (1) document and test the passive CMC to estimate model parameters, (2) design and simulate two different control strategies, (3) implement the electric drive with supporting instrumentation and (4) implement at least one of the control strategies in the physical system. This thesis aims to give the reader insight into how these goals were accomplished. The report structure mimics the work flow of the project, although many parts were done in parallel. Chapter 2 starts by describing the passive Crown Mounted Compensator and explains the need for active control. Much emphasis has been put on understanding the system in order to make well informed decisions. A good way to gain this understanding is to model the different parts and how they interact. Two modeling approaches and a comparison of these follows in Chapter 3. The models have served different purposes and they were both very useful during the control design. Subsequently, the control system is developed and simulated in Chapter 4 and the active hardware is outlined in Chapter 5. The physical implementation of the total system is described in Chapter 6. Finally, Chapter 7 describes the tests that have been done and their implications before the thesis is concluded in Chapter 8.
2
Atle Aalerud and Tomas Klevmo Implementation of Active Control Design for Crown Mounted Compensator to Improve Drilling Performance
CHAPTER 2. THE CROWN MOUNTED COMPENSATOR (CMC)
Chapter 2
The Crown Mounted Compensator (CMC) 2.1
Principle of Operation
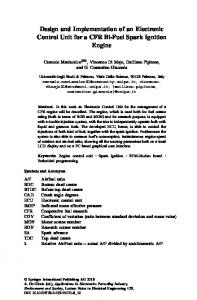
The National Oilwell Varco Crown Mounted Compensator type E is installed on top of drilling derricks as shown in Figure 2.1 and is a passive motion compensator. The CMC’s objective is to compensate for the vertical wave movements, also called heave, of the rig or vessel. The following subchapter is mostly drawn from the product’s technical user manual [37] and conversations with employees at NOV.
Crown Mounted Compensator
Figure 2.1: The CERRADO drillship with a CMC from NOV
Atle Aalerud and Tomas Klevmo Implementation of Active Control Design for Crown Mounted Compensator to Improve Drilling Performance
3
CHAPTER 2. THE CROWN MOUNTED COMPENSATOR (CMC) In this application, the puropse of the heave compensation is to ensure that the top drive position versus the seabed remains stable, thus applying a relatively constant tension to the drill string. Correct WOB is extremely important in order to maintain efficient drilling and long drill bit life. The CMC employs air pressure vessels (APVs) to act as an energizer that can be compared to an enormous pneumatic spring. The compressed air in the APVs supports the hookload via an accumulator and hydraulic cylinders. A simplified principle sketch of this setup is shown in Figure 2.2. As the figure shows, the components with the colored background can move up and down due to the waves while the mass remains stationary with a certain tension in the spring that results from the pressure. It is merely meant to illustrate the principle and only vertical motion is considered, hence there is no moment on the mass.
Figure 2.2: Principle of operation for the CMC air/fluid system Figures 2.3 and 2.4 shows the various components that make up the CMC. There are two main vertically mounted hydraulic lifting cylinders that convert the hookload into hydraulic pressure. They are free to move independently relative to the movement of the rig and do most of the heavy lifting. Hydraulic fluid is used on the cylinder side of the system so that the crown block can be locked in any position. The stuffing boxes in the cylinders are equipped with low friction seals to make it as efficient as possible, but there will always be some friction. The piston rods in the cylinders are attached directly to the crown block by means of four tie rods as shown in Figure 2.4. The figures also show guide structures that are mounted on the side of each main cylinder. Roller assemblies that are bolted to the crown block keep the crown block fixed inside the guide structures. The cylinders are also hard piped to the air/fluid accumulator which is located next to the cylinders, which is seen in both Figures 2.3 and 2.4. The main purpose of the accumulator is to separate the hydraulic fluid from the air system. This is done with a free floating steel piston inside the accumulator which is also equipped with low friction seals.
4
Atle Aalerud and Tomas Klevmo Implementation of Active Control Design for Crown Mounted Compensator to Improve Drilling Performance
CHAPTER 2. THE CROWN MOUNTED COMPENSATOR (CMC)
Equalizing cylinder Accumulator
Equalizing chain
APVs
Lifting cylinders
Crown block
Eccentric hubs
Figure 2.3: Overview of the crown mounted compensator
Lifting cylinders
Tie rods Equalizing cylinder APVs Equalizing chain
Guide structures
Eccentric hubs Accumulator
APVs
Main isolation valve
Figure 2.4: Detail view of the main parts of the crown mounted compensator
Atle Aalerud and Tomas Klevmo Implementation of Active Control Design for Crown Mounted Compensator to Improve Drilling Performance
5
CHAPTER 2. THE CROWN MOUNTED COMPENSATOR (CMC) The pressure in the system will naturally decrease as the main cylinders move out causing the volume in the hydraulic circuit to increase. However, it is desirable to have a near constant lifting force provided by the system no matter where the cylinders are in their stroke. A fluctuation in this force would translate to a variation in the WOB that is dependent on the stroke of the cylinders, which is clearly undesirable. In order to minimize this lifting force fluctuation, the CMC is equipped with an equalizing system that counteracts the variation of the lifting force as it moves up and down. It consists of two auxiliary equalizing cylinders that are permanently hooked up to the same working pressure as the main cylinders. The equalizing cylinders each rotate a pair of interconnected eccentric hubs by use of chains, generating a hub torque. The other hub is in turn connected to the crown block by use of another chain, providing a varying lifting force on the crown block. The engineering of the eccentric hubs and orientation of the two relative to each other is carefully chosen to give the overall system the desired lifting characteristic. The eccentricities of the hubs make the lever-arm for the chains vary, resulting in varying translations between chain forces and hub torque that depend on the rotation angle. The configuration of the equalizing system is therefore such that the additional lifting force balances out the force variation as the main lifting cylinders move in and out. A more detailed explanation of how this works can be found in Chapter 3. The air reservoir consists of multiple APVs made of either a composite material or steel. Each vessel is designed with a shut off valve mounted at the top and are hard piped to the accumulator. The vessel volume is closely chosen according to the main cylinder volume and equalizing system configuration to give the desired lifting force configuration and ensure a nearly constant tension over the working range. During normal operation it is important that the air pressure is adjusted so that the compensation takes place around the mid-stroke point. The volume of the system can also be varied by closing one or more of the APV shut off valves.
6
Atle Aalerud and Tomas Klevmo Implementation of Active Control Design for Crown Mounted Compensator to Improve Drilling Performance
CHAPTER 2. THE CROWN MOUNTED COMPENSATOR (CMC)
2.2
The Scaled CMC
The physical scaled model of the CMC is shown in Figure 2.5. It is an almost exact replica of the full scale system. Comparing drawings for the full scale system with the dimensions on the scaled CMC results in a clean ratio of 1:7 in almost all cases. It appears that the person that made it paid a very good attention to detail. The report writers have therefore scaled down full scale measurements in cases where no documentation for the scaled CMC has been found. Their correctness was then verified using physical measurements as outlined later in this section.
Figure 2.5: The scaled CMC placed on the Stewart platform in the lab
Atle Aalerud and Tomas Klevmo Implementation of Active Control Design for Crown Mounted Compensator to Improve Drilling Performance
7
CHAPTER 2. THE CROWN MOUNTED COMPENSATOR (CMC) One example of verifying scaled dimensions is the work done on the geometry of the eccentric hubs that are part of the equalizing system. Few drawings and data have been found for the scaled CMC, but after some searching in NOV’s document portal, an excel spreadsheet was found for the full scale system that included the radii of the two hubs with corresponding angles. The values for the radii in the spreadsheet were divided by 7 and a polynomial regression was carried out to yield equations for the radii as functions of the angle. The resulting equations were
r1 (θ) = 0, 0003θ2 − 0, 0137θ + 0, 3143
(2.1)
r2 (θ) = −0, 0003θ5 + 0, 0036θ4 − 0, 017θ3 + 0, 0362θ2 + 0, 0131θ + 0, 0673
(2.2)
for the large hub and
for the small hub. Here, θ is the angle measured in radians. These functions were simulated as part of the dynamic model described in Subchapter 3.3 where the main cylinder is moved through the full stroke. A plot of the shape of each hub was therefore possible to make as shown in Figure 2.6a. When compared with the picture in Figure 2.6b, the shape of the hubs can be visually confirmed. The same procedure as described above was carried out on the scaled CMC. The main cylinder stroke was recorded along with the radii of the hubs and the stroke of the equalizing cylinder as it was stroked out. The measurements were then done with a folding ruler by climbing onto the side of the scaled CMC and getting very approximate values for the operating range. It is hard to guess the exact point where the chain pulls on the hub, so these values are not very trustworthy. They are shown as circles in Figure 2.6a and provide a fast visual verification of the equations. 90
400
120
60 300 200
150
30
100 180
0
210
330 240
300 270 r1(θ)
r2(θ)
(a) The two hubs’ measured and calculated radius in millimeter as a function of the angle which is visually adapted to the photo on the right
(b) One of the pairs of eccentric hubs on the scaled CMC
Figure 2.6: Calculated and actual radii of the eccentric hubs
8
Atle Aalerud and Tomas Klevmo Implementation of Active Control Design for Crown Mounted Compensator to Improve Drilling Performance
CHAPTER 2. THE CROWN MOUNTED COMPENSATOR (CMC) It is clear that the functions match the measurements for the radii, but it is not clear how accurate they are. The ultimate test of the theory, however, comes when the strokes of the main cylinders and equalizing cylinders are compared. There are two reasons for this. One is that the simulated equalizer stroke depends solely on the functions for the radii and any slight deviation in the functions would compound to a large one in the equalizing stroke. The other reason is that it was possible to measure the equalizer stroke much more accurately than the radii and the measurements should therefore be trusted more. It is therefore a great indicator of the correctness of the functions. As seen in Figure 2.7, the deviation is small and it was concluded that the functions were sufficiently accurate for this project. Several other similar assessments have been done throughout the project.
Equalizing stroke [mm]
600 500 400 300 200 100 0 0
200
400
600 800 Main stroke [mm] Calculated Measured
1000
1200
Figure 2.7: The equalizing cylinder stroke plotted as a function of the main cylinder stroke. The main cylinder operative area is at 500 ± 300 mm Naturally as the CMC is scaled down, the ocean heave signal for testing must also be scaled down. Ocean waves with a heave motion in the range of 0.2 to 2 meters with a period of 5 to 15 seconds (0.2 to 0.07 Hz) are considered relevant for this type of equipment [21]. Higher heave amplitudes typically occur at the longer wave periods and some sea areas experience more benign weather conditions than others [21]. The CMC dynamic performance is typically specified at the nominal maximum operating condition of a 12 foot heave peak-to-peak in a 12 second period which equates to a peak velocity of 1 m/s [20]. Converting this to metric units yields an amplitude of 1.83 m. The frequency is approximately 0.08 Hz. To observe behaviour at different scenarios, three scaled waves were used. A normal wave, a large wave and a combination of waves. The first signal emulates a wave with an amplitude of 0.7 meters and a period of 10 seconds. Thus the signal is wave 1:
zw1 = 0.1 sin(0.1 · 2πt).
(2.3)
The second wave emulates a wave of 1.82 meters and a period of 12.5 seconds which is close to the typical motion range. wave 2:
zw2 = 0.26 sin(0.08 · 2πt)
Atle Aalerud and Tomas Klevmo Implementation of Active Control Design for Crown Mounted Compensator to Improve Drilling Performance
(2.4) 9
CHAPTER 2. THE CROWN MOUNTED COMPENSATOR (CMC) The third wave is a combination of several waves where the maximum peak is 1.72 meters which equates to 0.25 meters when scaled. This wave also includes the stop and go effect where the wave reaches zero velocity and then continues in the same direction. wave 3:
� � 1 = sin · 2πt · 0.15 sin(0.08 · 2πt) + 0.1 sin(0.11 · 2πt) 600 �
zw3
�
(2.5)
3.2
0.2
3
0.1
2.8
0
2.6
−0.1
2.4
−0.2
2.2
−0.3
2
Heave
0.3
0
5
10
15
20
Hook load [kN]
Figure 2.8 shows the effects of the friction in the scaled CMC on hookload. The rapid changes in the hookload are the main focus of this thesis.
25
Time [s] Hook load [kN]
Heave [m]
Heave velocity [m/s]
Figure 2.8: The hookload resulting from the wave pattern described by equation (2.4) at 7 bar
2.3
The Move Towards an Active System
According to a document by the Integrated Ocean Drilling Program–United States Implementing Organization (IODP–USIO) PHC systems have approximately 85 % efficiency in heave compensation when ship heave is > ∼4 m, but only 40% when ship heave is < ∼2 m. The large variation in heave compensation efficiency for different ship heave conditions is one of PHC systems’ weaknesses. [15] Perfect compensation using the passive compensator would only be possible if the APVs had an infinitely large volume and there was no friction in the system. Naturally neither is physically possible. The equalizing system reduces the pressure induced fluctuations, but the friction will most likely be increased. Thus, a variation is still present in the hookload. Improving the compensation further requires physical changes to the CMC to reduce the friction, or introduction of an active heave compensation (AHC) system. AHC is commonly used in addition to, or instead of, PHC alone [21]. This is to ensure a higher accuracy and increased performance [21]. The performance objective of the active compensator is to reduce the heave disturbance by 90 95 % [21]. Note that this performance is measured in meters and is not directly comparable to the results in this thesis.
10
Atle Aalerud and Tomas Klevmo Implementation of Active Control Design for Crown Mounted Compensator to Improve Drilling Performance
CHAPTER 2. THE CROWN MOUNTED COMPENSATOR (CMC) An active sub-system for the CMC is typically designed to apply a force on the load holding mass by reacting to the vessel heave. The force is generally exerted by a hydraulic cylinder placed at the very top of the CMC. Such a cylinder is installed on the CMC at the Cerrado drillship that was shown in Figure 2.1 on page 3. The hydraulic power unit energizing the system can not be placed near the CMC. Consequently long hydraulic lines are run up the derrick which typically introduces transport delay. The delay or lag depends on the length of hydraulic lines, how much air is entrapped in the oil and if there are lengths of flexible elements such as hoses [21]. J.T. Hatleskog and M.W. Dunnigan describes two types of hydraulic drives termed open-loop and closed-loop systems. When using the open-loop Hydraulic Drive, as illustrated in Figure 2.9a, a servo valve can be placed close to the actuator to mitigate some effect of the long hydraulic lines. Nevertheless, the long hydraulic lines will affect the dynamic response somewhat. In order to control the position of the actuator with a degree of accuracy this arrangement will require a position feedback loop where the long hydraulic lines tend to limit the available loop-gain. The second approach, illustrated in Figure 2.9b, comprises a swash plate axial piston pump placed near the actuator. As the returning oil from the actuator is returned to this pump rather than the tank, the system is referred to as closed-loop. This solution offers better flow control and is less affected by back pressure, but it is also more expensive and more sensitive to contamination. [21]
(a) Simplified Diagram illustrating the open-loop Hydraulic Drive [21].
(b) Simplified Diagram illustrating the closed-loop Hydraulic [21].
Figure 2.9: Two types of hydraulic drives for the active sub-system as presented by J.T. Hatleskog and M.W. Dunnigan [21] The approach used in this thesis is based on replacing the hydraulic actuator in the typical active sub-system, with a rack driven by an electric variable frequency drive (VFD) connected to a pinion. Thus the lag from hydraulic linkage is removed. The cost of this solution has not been evaluated. Many designs and analyses for active crown mounted compensation systems can be found in recent litterature. Examples other than the work done by J.T. Hatleskog and M.W. Dunnigan are a nonlinear control system designed using Lyapunov’s direct method [13], a study of both active and passive heave compensation for CMC [16] and a system that exploits favorable interaction of coupled oscillators to counteract the heave [31]. This is an area where several for profit companies have invested a lot of time an money researching and the literature might therefore not give the whole picture. It can safely be said that AHC for CMC is a topic of great interest both in the academic and for profit worlds.
Atle Aalerud and Tomas Klevmo Implementation of Active Control Design for Crown Mounted Compensator to Improve Drilling Performance
11
CHAPTER 2. THE CROWN MOUNTED COMPENSATOR (CMC)
12
Atle Aalerud and Tomas Klevmo Implementation of Active Control Design for Crown Mounted Compensator to Improve Drilling Performance
CHAPTER 3. MODELING THE SCALED CMC
Chapter 3
Modeling the Scaled CMC 3.1
The Importance of Correct Models
The costs of a project tend to grow exponentially from one step to the next as more working hours and/or materials are spent in each step. Engineering and design is usually done at an early stage, while adjustments on site are done in the final steps. Hence an error within the first project steps will be exponentially more costly to correct within the final steps of a project compared to correcting it early. Especially when creating something new, such design flaws may be difficult to discover before it’s too late. Discovering such flaws can be achieved by making a model of the system. Tests can be run in a simulated environment, and the design can be improved long before the large production costs. A model is commonly used to better the understanding of already existing equipment. The functionality of the CMC in general has been described in Chapter 2. But to fully understand the scaled model, and be able to control it, it is very beneficial to create a simulation model of the system. New ideas can quickly be tested in an environment that captures most of the system behavior without having to perform time consuming physical tests. It is very important that the models capture what you are interested in on the physical system. For the purpose of testing control strategies, a model in a simulation software was used. For the purpose of Model Predictive Control (MPC), a purely mathematical model was needed. This model was not required to capture all the dynamics in the model, as long as it could predict what would happen in a few time steps as discussed in Chapter 4. Another requirement was that it needed to be simple enough to run very frequently. Both the traditional control system and the MPC control system could then be tested using the model made in the simulation sofware. This yielded a more realistic response to challenge the control system. The next section deals with modeling the CMC in a commercial simulation software.
Atle Aalerud and Tomas Klevmo Implementation of Active Control Design for Crown Mounted Compensator to Improve Drilling Performance
13
CHAPTER 3. MODELING THE SCALED CMC
3.2
Dynamic Modeling Using Simulation Software
The simulation software SimulationX version 3.4 has been used in this modeling approach. A model including pipe dimensions, orifices and dimensions for the full scale CMC components was provided by National Oilwell Varco. The dimensions of this model were changed according to the 1:7 ratio and checked with manual measurements as discussed in Subchapter 2.2. For control design purposes it was desired to export the entire model to Matlab Simulink. For more on the reasons for this, please consult Chapter 4. However, the complete model was very computationally heavy, taking one half hour to simulate one minute. To reduce simulation time, the model was simplified by replacing pipe dimensions with simple volumes, and combining orifices into two equivalent orifices, one on the air side of the accumulator and one on the fluid side. Further, all six APVs were combined into one volume and all ocean movement except rig heave, was removed. The performance of the simulation compiler was greatly increased while the response change was minor. As this performance was sufficient for control design, it was reasonable to use the simplified model which is shown in Figure 3.1 on the facing page. On the real CMC, both the equalizing cylinders and the accumulator are slightly affected by acceleration from the ocean waves. However, calculating the second derivative of the scaled ocean waves in equations (2.3) to (2.5) on page 9 and on page 10 yields a maximum acceleration of approximate 0.08 m/s2 . Multiplied with the mass of the accumulator piston, this yields a force of only 0.32 N. This force is even smaller on the equalizing cylinders as the stroke is scaled down. Since these forces are very small, it is reasonable to neglect their inertia. Hence, it is an acceptable approximation to consider both the accumulator and the equalizing cylinders as fixed for simulation purposes. This was done in the SimulationX model using preset1 and preset3 as seen in Figure 3.1 on the next page. Furthermore, the figure also shows that the main cylinders and the equalizing cylinders are connected to the same hydraulic pressure. The fluid for the hydraulic system was specified to be Erifon 818 as given by the CMC-E Product Data Sheet [37]. “Erifon 818 fluids are explosion resistant water based hydraulic fluids for use in offshore riser tensioner, motion compensator, drill string compensator, crown compensator systems and in tension leg platforms.” [32]
14
Atle Aalerud and Tomas Klevmo Implementation of Active Control Design for Crown Mounted Compensator to Improve Drilling Performance
CHAPTER 3. MODELING THE SCALED CMC
Figure 3.1: The simplified SimulationX model of the scaled CMC system To visualize the main cylinders and the crown block, Multi-Body System (MBS) Mechanics has been used. These components are yellow in the model. The rig heave is applied in the preset M otion_Centre which is visualized as a blue plate that represents the ocean. Note that this is just a simplification for visualization purposes as the equipment is normally mounted at the top of the derrick. This motion center is initially placed in the origin of the global coordinate system. Hence, all positions are calculated relative to this point. The displacement of the motion center is given by M otion_Centre.xP reset = {0, 0, Rig_Heave.F }
(3.1)
where Rig_Heave.F is the output from the function block Rig_Heave shown in the right of Figure 3.1. The input of this block is selectable between three different types of waves described in equations (2.3) to (2.5). Further, the preset, M otion_Centre, is connected to a guide and two plungers which visualize the two main plunger cylinders on the CMC. The guide, which is a prismatic joint, has a relative displacement in the z-direction of Guide.xRel0 = 1.270 m − P lungerCylinder1.dxh
Atle Aalerud and Tomas Klevmo Implementation of Active Control Design for Crown Mounted Compensator to Improve Drilling Performance
(3.2)
15
CHAPTER 3. MODELING THE SCALED CMC where P lungerCylinder1.dxh = −self.maxStroke/2 = −1.270 m/2 = −0.635 m
(3.3)
which ensures that the guide will have a starting position of 1.905 m.This is at the height of the PlungerCylinder1 piston rod which is started mid stroke. A mass is located for each piston rod on the top of the guide. The tie rods connecting the piston rods down to the crown block are not modelled, but the crown block is offset from the top of the guide with a displacement given by Crownblock.x0 = {0, 0, −Guide.xRel0 − P lungerCylinder1.dxh} .
(3.4)
This places the crown block aligned with the piston inside the plunger cylinders with a starting position of 0.635 m. The sheaves are offset from the crown block center and the connection point, “Hook”, is placed at the lower edge. This hook is normally placed at the travelling block connected to the crown block by several wires and a drawworks. But when drawworks interaction is not to be included, the connection between travelling block and crown block is less interesting. Hence, the model is simplified by not modeling or visualizing the travelling block. The mass of the travelling block, and masses of other components which have been left out, is instead placed directly in the hook. This is demonstrated in Figure 3.2. The vertical displacement of the hook point is
Hook.x0 = P redecessor F rame − Crownblock.lz/2 − Sheaves.ro = 0.635 m − 0.140 m/2 − 0.130 m = 0.435 m
(3.5)
where the P redecessor F rame is the position of the crown block, Crownblock.lz is the height of the crown block and Sheaves.ro is the outer radius of the sheaves. Note that these dimensions may not be accurate compared to the scaled CMC, but this is not essential as they are only used for the visualization. On the other hand, the properties of the “Drillstring” placed between the hook and the floor has a big effect on the simulation results. The drill string is simply modelled as a spring damper system. For the physical implementation as discussed in Chapter 6, a short steel rod was used to simulate the drill string. This is probably not very realistic, but is assumed to be an extreme case of drilling using a short drill string on a hard formation. As the drill string is connected to the travelling block using wires which is further connected to the crown block using more wires, the drill string consists of several spring elements. Ideally, the effect of springs in series is removed completely for testing and simulation purposes as this makes isolation of the drill string more difficult. However, it was decided to not remove the travelling block from the scaled CMC. Nevertheless, simplifications were done to the model as shown in Figure 3.2 on the facing page. The spring stiffness of the springs shown in Figure 3.2a can be estimated using k= 16
E·A L
Atle Aalerud and Tomas Klevmo Implementation of Active Control Design for Crown Mounted Compensator to Improve Drilling Performance
(3.6)
CHAPTER 3. MODELING THE SCALED CMC
(a) Most realistic model
(b) Travelling block and drawworks wire removed
(c) Hook wire included in drill string
Figure 3.2: Simplifications applied to the implemented string geometry where E is Young’s modulus of steel, A is the cross sectional area and L is the equilibrium length of the element. The drawworks wires are 12 parallel PVC-coated steel wires with a steel thickness of 4 mm and a length of one meter. Using a Certex product catalogue it was found that this wire has a steel cross sectional area of 9.6 mm2 . The hook wire consists of two parallel 6 mm thick steel wires which have an effective cross sectional area of 14.7 mm2 and an approximate length of 0.5 m. [10] Finally, the drill string is in this case a 22 mm thick steel rod with a length of 0.3 m. Using equation (3.6) and E = 210 GPa, it can be estimated that
kDS
≈ 2.7 × 10⁸ N/m
(3.7)
kHW
≈ 1.2 × 10 N/m
(3.8)
kDW
≈ 2.8 × 10 N/m
(3.9)
7
7
When these springs are connected in series as in Figure 3.2a, the equivalent spring stiffness is
kE =
�
1 kDS
+
1 kHW
+
1
�−1
kDW
≈ 8.3 × 10⁶ N/m.
(3.10)
To simplify, the mass of the travelling block is placed in the hook which is moved to the crown block as demonstrated in Figure 3.2b. Normally, kDS would have a much lower stiffness than kHW and kDW . This would make the effect of the two latter close to neglectable and it would be possible to make the approximation kE = kDS
(3.11)
which is shown in Figure 3.2c. But since the hook wire is the softest link in this case, they can not be neglected. This is also shown in the model in Figure 3.1 on page 15. Keeping earlier simplifications in mind, it was decided to use a total spring stiffness of Drillstring.k = 1.0 × 10⁷ N/m
Atle Aalerud and Tomas Klevmo Implementation of Active Control Design for Crown Mounted Compensator to Improve Drilling Performance
(3.12) 17
CHAPTER 3. MODELING THE SCALED CMC Note that there is a sensor on the top and bottom of the drill string. The purpose of using two sensors is to be able to see the difference from the top of the drill string to the seabed. But you can not expect to see a difference between these two measurements until the drill string is exchanged with a more advanced model involving attenuation and phase shift. A physical implementation could be done using several masses interconnected with short springs. A more advanced drill string model has not been the focus of this thesis, but the lower instrument was implemented to allow for further expansions. The eccentric hub is an important part of the passive system. Hence, the interaction between the main cylinders and the equalizing cylinders, caused by the eccentric hubs, is modelled in two parts in the SimulationX model. Firstly, the stroke displacement of the equalizing cylinders is induced in preset2. Secondly, the force returned from the equalizing cylinders is a force, Eq, placed directly on the crown block. The different strokes and forces are illustrated in Figure 3.3.
f2
f1
s1 r1
r2 s2
Figure 3.3: Illustration of the equalizing hub forces, radii and displacements [34] The displacement in the equalizing cylinders is given by s2 = preset2.x = Lstr.F
(3.13)
where Lstr.F is a function of s1 . Using the calculated stroke data from Subchapter 2.2 on page 7, s2 can be plotted as a function of s1 . The estimated function of the curve is s2 = −0.0472 s1 4 + 0.1292 s1 3 + 0.1846 s1 2 + 0.1988 s1 + 0.0005
(3.14)
Comparing this function with Figure 2.7 on page 9 yields a norm of residuals of 0.0015. s2 (s1 ) and the calculated data is plotted in Figure 3.4a
18
Atle Aalerud and Tomas Klevmo Implementation of Active Control Design for Crown Mounted Compensator to Improve Drilling Performance
CHAPTER 3. MODELING THE SCALED CMC 0.9 0.8
0.5
0.7 Gain, k [ ]
Equalizing stroke [m]
0.6
0.4 0.3
0.6 0.5
0.2
0.4
0.1
0.3
0
0
0.2
0.4 0.6 0.8 Main stroke [m] Calculated
1
1.2
0
0.2
r2(θ)/r1(θ)
Lstr
(a) Lstr is a fourth order polynomial fit of s2 plotted as a function of s1
0.4 0.6 0.8 Main stroke [m]
1
1.2
k
(b) The gain, k, is the gearing of the equalizing force, f2 . It is expressed as a fourth order polynomial fit of r2 (θ)/r1 (θ) as a function of the main stroke s1 .
Figure 3.4: Functions for describing the equalizing system When the stroke, s2 , of EqCyl1 and EqCyl2 is known. The next step is to calculate the body force Eq returned to the main cylinders and the crown block. This force is given by f1 = {0, 0, (−2 · f2 · k)}
(3.15)
where f2 is the cylinder force of EqCyl1 and k is a function of the main cylinder stroke, s1 . By using the measured data from Subchapter 2.2, the gear ratio r2 (θ)/r1 (θ) can be plotted as a function of the s1 , and not depending on the hub rotational angle θ as is done in Subchapter 3.3. The fourth order polynomial fit of this curve is k = −0.4380 s1 4 + 1.4809 s1 3 − 2.0204 s1 2 + 1.3912 s1 + 0.1385
(3.16)
The norm of residuals of equation (3.16) is 1.52 × 10⁻³ . k and r2 (θ)/r1 (θ) is plotted in Figure 3.4b Since equations (3.14) and (3.16) are based on approximations, it is important to verify the accuracy of the results. This can be done by comparing the mechanical power on both sides of the equalizing hubs. As no friction is modelled in the bearings of the hubs, these powers should be equal in magnitude. The power on the main cylinder side of the hubs is P1 = Eq.F i · P lungerCylinder1.vP iston = 2 f1 · s˙ 1
(3.17)
and the power on the equalizing cylinder side of the hubs is P2 = −2 EqCyl1.F cyl · EqCyl1.vP iston = −2 f2 · s˙ 2
(3.18)
where variables are according to Figure 3.3 on the facing page. Further, by applying the wave from equation (2.4) on Rig_Heave, the response in P1 and P2 can be plotted as shown in Figure 3.5.
Atle Aalerud and Tomas Klevmo Implementation of Active Control Design for Crown Mounted Compensator to Improve Drilling Performance
19
Power [W]
CHAPTER 3. MODELING THE SCALED CMC
100 0 −100 0
5
10
15 Time [s] P1
20
25
P2
Figure 3.5: The equalizing power on the two sides of the equalising hubs It can be seen that the two powers are not perfectly identical. Hence, equations (3.14) and (3.16) may be somewhat inaccurate. This is the consequence of using two curve fit equations instead of calculating the inverse. However, the scaled CMC model probably has some small frictions in the hubs which also would yield a difference in the power. As it can be seen that P1 is slightly smaller than P2 , the hub model is found acceptable without further verification as f1 , f2 and s˙ 2 are not measured on the scaled CMC. Even if the described system is functional and will work perfectly, it is not completely realistic. As mentioned in Subchapter 2.2, the scaled CMC also contains a lot of friction. It would be possible to implement friction based on assumptions, but it was found much more precise to base the model on logged data. How this data was acquired is discussed later in Chapter 7. Several components can be assumed to have significant friction, but the cylinder seals are assumed to be the dominant friction contributor. The Stribeck pressure dependent friction model was considered sufficient for capturing the most essential dynamics of the cylinder frictions. This is also well supported in SimulationX where the Stribeck model’s friction force is defined as !!
ff r
|vpiston | = FC + (FS − FC ) · exp − vL
+ kv · v av + kp · |pAB |
(3.19)
where FS is the breakaway friction force, FC is Coulomb friction force, vL is the linear region velocity threshold, kv is the viscous friction coefficient, av is a curvature exponent and kp is the pressure dependent coefficient. The variables are vpiston which is the cylinder piston velocity and pAB which is the pressure difference in the cylinder. Choosing the friction parameters of the Stribeck friction model was done in two steps. The first step was to tune the friction model without the equalizing system connected, and secondly tune the model with the equalizing system connected. Thus, the friction caused by the main cylinders and the equalizing cylinders could be evaluated separately. On the scaled CMC the equalizing system was suspended by disconnecting the equalizing chains 20
Atle Aalerud and Tomas Klevmo Implementation of Active Control Design for Crown Mounted Compensator to Improve Drilling Performance
CHAPTER 3. MODELING THE SCALED CMC from the crown block and equalizing cylinders. The equalizing system in the SimulationX model was inhibited by multiplying the displacement of the equalizing cylinders given in equation (3.13) and the equalizing force in equation (3.15) with zero. Thus, it would not move and also not apply a force to the crown block. To tune the parameters, a reference was made by offsetting the Stribeck function. This reference is given by
fStribeckref = ff r + W T 002
(3.20)
where ff r is the Stribeck function defined in equation (3.19) and W T 002 is the mean measured hook load. Figure 3.6 shows hook load data from the scaled CMC and hook load from simulation. fStribeckref is also included as this was used for the tuning. The implemented parameters are listed in Table 3.1. FS 400
FC 250
vL 0.002
kv -1000
av 1
kp 10
Table 3.1: Pressure dependent Stribeck model parameters that were used in the SimulationX model with the equalizing system disconnected. The friction is illustrated in Figure 3.6 by plotting the hookload against the heave position and velocity. The heave is in this case directly proportional with the main cylinder movement. The position plots can be followed clockwise and the velocity counterclockwise with increasing time. In SimulationX, the entire friction was put in P lungerCylinder1, and the other main cylinder was left without friction. As the parameters of the friction in the two main cylinders were found, the equalizing system was put back on. When simulating with the equalizing system enabled, a change in the friction is observed mainly due to the added cylinders. Adding this change in friction can be done in several ways. One way is to implement it in one of the equalizing cylinders i.e. EqCyl1. However, the solution that was used was to change the parameters of the friction in P lungerCylinder1 as multiple frictions complicates the model. Using the same procedure as before, the new friction parameters were found to be as shown in Table 3.2. The new friction curves are shown in Figure 3.7.
Atle Aalerud and Tomas Klevmo Implementation of Active Control Design for Crown Mounted Compensator to Improve Drilling Performance
21
2.6
2.6
2.4
2.4
2.2
2.2 Force [kN]
Force [kN]
CHAPTER 3. MODELING THE SCALED CMC
2 1.8
1.8
1.6
1.6
1.4
1.4
1.2
1.2 −0.2
−0.1 0 0.1 Heave position [m] CMC
0.2
−0.1 0 0.1 Piston velocity [m/s]
SimX
CMC
(a) The hookload as a function of heave position using 7 bar pressure.
1.8
1.8
1.6
1.6
1.4
1.4
1.2 1
1 0.8
0.6
0.6 −0.1 0 0.1 Heave position [m] CMC
0.2
SimX
(c) The hookload as a function of heave position using 6 bar pressure.
SimX
1.2
0.8
−0.2
Matlab
(b) The hookload as a function of piston velocity using 7 bar pressure.
Force [kN]
Force [kN]
2
−0.1 0 0.1 Piston velocity [m/s] CMC
Matlab
SimX
(d) The hookload as a function of piston velocity using 6 bar pressure.
Figure 3.6: Curves for the hookload with the equalizing system disabled at 6 and 7 bar (Data was recorded the 3rd of April, 2013)
An essential property in Figure 3.6 is the effect of pressure drop, which was described in Chapter 2. As the displacement of the platform decreases, the pistons of the main cylinders will extend. This causes a pressure drop which decreases the lifting force. Without the equalizing system, this force has a difference in magnitude for the outermost positions of more than 200 N dependent on the pressure in the main cylinders. When using the equalizing system, the pressure variation in the main cylinders is compensated. This can be seen by the variations in the hook load in Figure 3.7. Using the equalizing system, the difference in magnitude is reduced to less than 100 N. However, this comes with the cost of increased static friction.
22
Atle Aalerud and Tomas Klevmo Implementation of Active Control Design for Crown Mounted Compensator to Improve Drilling Performance
CHAPTER 3. MODELING THE SCALED CMC
FS 500
FC 350
vL 0.002
kv 500
av 1
kp 10
3.2
3.2
3
3
2.8
2.8
Force [kN]
Force [kN]
Table 3.2: Pressure dependent Stribeck model parameters that were used in the SimulationX model with the equalizing system connected.
2.6 2.4
2.6 2.4
2.2
2.2
2
2 −0.2
−0.1 0 0.1 Heave position [m] CMC
0.2
−0.1 0 0.1 Piston velocity [m/s]
SimX
CMC
2.6
2.6
2.4
2.4
2.2
2.2
2 1.8
2 1.8
1.6
1.6
1.4
1.4
1.2
1.2 −0.2
−0.1 0 0.1 Heave position [m] CMC
SimX
(b) text
Force [kN]
Force [kN]
(a) text
Matlab
SimX
0.2
−0.1 0 0.1 Piston velocity [m/s] CMC
(c) text
Matlab
SimX
(d) text
Figure 3.7: Curves for the hookload with the equalizing system disabled at 6 and 7 bar (Data was recorded the 3rd of April, 2013) As the model was at this point working satisfactorily, it was ready for implementation of active control. MPC control designed in Simulink was to be applied to the SimulationX model. Thus, it was necessary to export the model to a S-function which can be used in Simulink. This was done by following a tutorial from the lecture notes in MAS602, Advanced Control and Robotics, by Geir Hovland, PhD, for the PhD program in Mechatronics. The export generated a slx- and mex-file to be used in Simulink.
Atle Aalerud and Tomas Klevmo Implementation of Active Control Design for Crown Mounted Compensator to Improve Drilling Performance
23
CHAPTER 3. MODELING THE SCALED CMC
3.3
Dynamic Modeling Using Differential Equations
This section contains a mathematical model of the CMC. This model was needed to implement the model predictive control strategy described in Subchapter 4.3. As opposed to the model made in SimulationX in the previous section, a mathematical model can be simulated in a large range of programming environments and simulation software. It is, however, more cumbersome to implement and requires more detail knowledge of the underlying equations. The designer must therefore choose the strategy that best suits his goal. When analysing a physical system in the steady state, solving a set of algebraic equations is all that is necessary. A dynamic model, however, involves a mixed set of differential equations and algebraic equations. When doing this kind of work, you start with the individual components and combine the equations to form the whole system in the end. We will start with the main cylinders and the reader is encouraged to consult Subchapter 2.1 for a description of the various components. The cylinders are of the plunger type, which means that there is only one chamber. The governing equations for a plunger cylinder are
Q=v·A
(3.21)
F = p · A,
(3.22)
and
where Q is the flow into the cylinder, v is the velocity of the piston, F is the force exerted by the cylinder, p is the cylinder pressure and A is the piston area [17]. The equations show the simple connection between pressure and force that the CMC relies on to function as a pneumatic spring. When a force on the crown block moves the cylinder downwards, the pressure is increased in the fluid. For dynamic simulations, the conservation of mass for a volume of fluid gives the general equation for a pressure node,
p˙ =
β · (Q − V˙ ) , V
(3.23)
where p is the pressure, β is the bulk modulus of the fluid, Q is the sum of all flows entering the node and V is the volume of the node [17]. A pressure change in the fluid is after a very short instant transferred through the pipes and into the accumulator. The pipes and orifices restrict the flow depending on the pressures on both sides. The general orifice equation gives the flow from a to b by
s
Q = C d · Ad ·
2 · |pa − pb | · sign(pa − pb ), ρ
(3.24)
where Cd is the discharge coefficient, Ad is the orifice area, ρ is the density of the fluid, pa is the pressure in port a and pb is the pressure in port b [17]. See Figure 3.8 for an illustration of equation (3.24). 24
Atle Aalerud and Tomas Klevmo Implementation of Active Control Design for Crown Mounted Compensator to Improve Drilling Performance
CHAPTER 3. MODELING THE SCALED CMC
Q pa
pb
Figure 3.8: The direction of hydraulic flow from port a to port b The purpose of the accumulator in the CMC is to facilitate the energy reservoir for the passive compensation. It is assumed to be a polytropic process. The governing steady state equations for the accumulator are [17]:
Va = Vg + Vf = constant
(3.25)
p · Vg n = constant,
(3.26)
and
where Va is the total accumulator volume, Vg is the volume occupied by gas, Vf is the fluid volume and n is a suitable polytropic exponent. The heave cycle is typically too fast to allow heat gain or loss from the APV’s. This means that the process of compressing the air is adiabatic and the polytropic constant, n, was therefore set to 1.4. The gas volume can be found using the preload conditions and the current pressure:
Vg =
�
p0 p
�1
n
· V0
(3.27)
Two of the equations need to be transformed to obtain ones suited for dynamic simulation. Taking the derivatives of equations (3.25) and (3.26) yields
V˙ g + V˙ f = 0
(3.28)
p˙ · Vgn + n · p · Vgn−1 · V˙ g = 0.
(3.29)
and
Solving equations (3.27) to (3.29) for V˙ f gives the following differential equation for the change in fluid volume:
V˙ f =
p˙ · n·p
�
p0 p
�1
n
· V0
Atle Aalerud and Tomas Klevmo Implementation of Active Control Design for Crown Mounted Compensator to Improve Drilling Performance
(3.30)
25
CHAPTER 3. MODELING THE SCALED CMC
Stewart Platform
M
fm
P0 V0 n
Crown and Travelling Blocks
xCB
Vg
feq
xSP
m
A2
fcyl
fhook
Qa p1 V1 β
r1(θ)
ffric
A1
Qcyl
Qeq
r2(θ)
θ
p2 V2 β
kO
kd
ks
Figure 3.9: The simple mathematical model
Now that all the necessary basic equations have been defined, one can start combining and connecting them. Because of the symmetric nature of the components, it is only necessary to model half of the system and then multiply by two in the relevant parameters. A diagram of the complete simplified model was of good use when doing this and it is shown in Figure 3.9. The movement of the main cylinder is defined as the difference between the velocities of the crown block and the Stewart platform. The main cylinder velocity is therefore given as
vcyl = vCB − vSP , 26
Atle Aalerud and Tomas Klevmo Implementation of Active Control Design for Crown Mounted Compensator to Improve Drilling Performance
(3.31)
CHAPTER 3. MODELING THE SCALED CMC and the same for goes for the positions, yielding
xcyl = xCB − xSP .
(3.32)
By continuing to use the notations in Figure 3.9, the equation for the fluid volume in the accumulator becomes
V˙ 1 =
p˙1 · n · p1
�
p0 p1
�1
n
· V0 .
(3.33)
The first pressure node is governed by the equation
p˙1 =
β · (Qa − V˙ 1 ), V1
(3.34)
where the flow into the pressure node is given by a simplified version of equation (3.24): Qa = ko ·
q
|p2 − p1 | · sign(p2 − p1 )
(3.35)
Here, ko is the orifice constant, which is just a combination of all the constants in equation (3.24). Since equation (3.35) is meant to model all the restrictions in the CMC, the physically rooted constants loose their meaning and a simplification is preferable. The constant will need to be estimated based on measured data. The force from the main cylinders becomes
fcyl = p2 · A1 − ff ric ,
(3.36)
where the friction, ff ric is modeled using an adapted LuGre friction model [12]. It is a reasonably well known dynamic friction model and an extensive analysis of the model and its application can be found in [39]. It describes the lag behavior of solid friction and assumes that the lubricant film quickly responds to the velocity variation [11]. The friction force is given by
ff ric = σ0 · z + σ1 · z˙ + σ2 · v + kp · p2 ,
(3.37)
where z is the bristle micro deflection, σ0 is the bristle stiffness, σ1 is the bristle damping, σ2 is the coefficient for viscous friction and kp is a constant that was added to make the friction depend on the cylinder pressure. The derivative of the micro deflection, z, ˙ is given by the following equation:
z˙ = vcyl −
|vcyl | ·z g(v)
(3.38)
where vcyl is the velocity of the main cylinders and g(v) is an arbitrary function to express the
Atle Aalerud and Tomas Klevmo Implementation of Active Control Design for Crown Mounted Compensator to Improve Drilling Performance
27
CHAPTER 3. MODELING THE SCALED CMC Stribeck effect. It was for this project defined as g(v) =
Fc Fs − Fc − |vvcyl | s + ·e σ0 σ0
(3.39)
where Fc is the Coulomb friction, Fs is the maximum static friction force and vs is the Stribeck velocity [11]. The eccentric hubs function as a varying gearing between the equalizing cylinders and the crown block where the eccentric shapes of the hubs determine the gear ratio at a given angle. Modeling the equalizing system proved to be one of the most demanding aspects of this part of the project. Please refer to Subchapter 2.2 and equations (2.1) and (2.2) for a discussion of the geometry of the eccentric hubs and the resulting equations for the radii as a function of hub angle. The rotational velocity of the hubs depend on the speed of the main cylinder and the function for the radius of the large hub: vcyl θ˙ = r1 (θ)
(3.40)
The changing radii influence the angle at which the equalizing cylinders are positioned slightly which in turn influence the lengths and angles of the cylinders and hubs. This effect has been neglected for simplicity. The speed of the equalizing cylinder then depends on the function for the radius of the small hub and the rotational velocity of the hubs:
veq = r(θ) · θ˙
(3.41)
The ratio of the radii as a function of angle gives the gearing between the equalizing cylinders and the crown block. The argument behind this is that the radii function as lever arms for the chains. The force exerted on the crown block by the equalizing cylinders becomes
feq = p2 · A2 ·
r2 (θ) . r1 (θ)
(3.42)
A way to verify that equations (3.40) to (3.42) are consistent is to consider the power that is transferred. It should be the same on both sides, which means that
feq · vcyl = →
feq
p2 · A2 · veq veq = p2 · A2 · vcyl
(3.43)
By extension, r2 (θ)/r1 (θ) must therefore equal veq /vcyl . The simulations confirmed this relationship to be true. Now that the description of the equalizing system is complete, the rest of the system can be 28
Atle Aalerud and Tomas Klevmo Implementation of Active Control Design for Crown Mounted Compensator to Improve Drilling Performance
CHAPTER 3. MODELING THE SCALED CMC modeled. The hydraulic flows depend on the velocities of the cylinders and therefore become Qcyl = vcyl · A1
Qeq = veq · A2 ,
,
(3.44)
and the resulting pressure gradient in the second node, p˙2 , is given by
p˙2 =
β · (−Qa − Qcyl − Qeq ). V2
(3.45)
Here, the volume in the second node, V2 is
V2 = V20 + xcyl · A1 + xeq · A2
(3.46)
where V20 is the initial volume and the other variables have been discussed earlier. The final force is the hookload which is given by fhook = (x0 + xCB ) · ks + vCB · kd ,
(3.47)
where x0 is the initial deflection of the equivalent spring, ks is the equivalent spring stiffness and kd is the damping constant. It was discovered that one of the states were not needed to model the system. The resulting equations for the volume and the pressure in the first pressure node,
V˙ 1 =
p˙1 · n · p1
�
p0 p1
�1
n
· V0
(3.48)
and p˙1 =
q β · (ko · |p2 − p1 | · sign(p2 − p1 ) − V˙ 1 ), V1
(3.49)
can be combined to remove an algebraic loop and speed up computation. This results in the elimination of the state V1 . This leads us to the final set of differential equations that are listed below. Now that all the forces have been described, Newton’s second law can be applied on the mass and the rest of the equations can be combined to yield a system of only first order differential equations.
Atle Aalerud and Tomas Klevmo Implementation of Active Control Design for Crown Mounted Compensator to Improve Drilling Performance
29
CHAPTER 3. MODELING THE SCALED CMC
p˙1
=
β · ko · �
p0 p1
p
�1
n
|p2 − p1 | · sign(p2 − p1 ) · n · p1 · V0 (β − n · p1 ) + V10 · n · p1
β · (−ko ·
p
|p2 − p1 | · sign(p2 − p1 ) − (vCB − vSP ) · A1 − x˙ eq · A2 ) V20 + (xCB − xSP ) · A1 + xeq · A2
p˙2
=
θ˙
=
x˙ eq
=
vCB − vSP r1 (θ) r2 (θ) · θ˙
z˙
=
vCB − vSP −
x˙ CB v˙ CB
=
vCB
=
�
+
(3.50)
(3.51) (3.52) (3.53)
|v| Fc σ0
+
Fs −Fc σ0
·e
−
vCB −vSP vs
+ kv · (vCB − vSP )
·z
(3.54) (3.55)
p2 · A1 + p2 · A2 ·
r2 (θ) − σ0 · z − σ1 · z˙ − σ2 · (vCB − vSP ) r1 (θ) �
fm + m · g − (x0 + xCB ) · ks − vCB · kd /m
(3.56)
An implementation of the model has been made in Simulink as shown in Figure 3.10. It was very beneficial to develop the Simulink model alongside the work with the equations because it gave much insight into how the different equations interact.
30
Atle Aalerud and Tomas Klevmo Implementation of Active Control Design for Crown Mounted Compensator to Improve Drilling Performance
kp
kp
sigma2
sigma2
sigma1
sigma1
vs
vs
Fc
Fc
Fs
Fs
sigma0
sigma0
ffric
fm
0
p
kp
vs
fhook
3
ffric
WT002
1e-5
LuGre friction Gain7
sigma2
vcyl
sigma1
Fs
FC
sigma0
Add4
fcyl -fric
0.26
Gain1
1
A2
mass
feq
ftot
Product3
Product5
fhook
x0
SP_Hz
SP_Amplitude
feq
fcyl
fm
Mass
Product8
0.002287
Add2
A1
0.0056549
Subtract4
x0
0.5
Freq
0.08
Amplitude
mass
m
vCB
xCB
xcyl
vcyl
Product4
Product
Gain5
1e-2
fcyl
r/R
Divide1
xCB
1
theta0
1.65
Gain2
kspring
1.3e6
Product2
Product1
vcyl xcyl
R
r
xeq
veq
theta Hubs
theta0
vcyl
p0
p0
pdiff1
0.15e5
theta
Product6
V20
0.007
Product7
xeq
veq
Add
BulkFluid1
3.3e9 pdot
p
ko
ko
V2
pressure node 2
p0
V
BulkFluid
Qeq
Qcyl
Qa
Subtract2
1 In1
Q
Terminator
orifice
ko
pb
pa
Q
Vg0
0.045
n
n
BulkFluid
3.3e9
V10
0.050
1e-5
Gain4
p1 p2
V
pdot
p
2
pdiff2
0.15e5
PT002
1e-5
Gain3
pressure node 1
Vg0
n
Q
BulkFluid
p0
1
Add1
PT001
CHAPTER 3. MODELING THE SCALED CMC
Figure 3.10: The differential equations implemented in Simulink
Atle Aalerud and Tomas Klevmo
Implementation of Active Control Design for Crown Mounted Compensator to Improve Drilling Performance
31
CHAPTER 3. MODELING THE SCALED CMC The parameter estimation toolbox in Matlab has been used for estimating the parameters in the model. During the development of the Simulink models, parameters had to be guessed in order to test that the model was working. Many parameters, such as the friction parameters, could be set based on physical considerations. The measured data indicated a sliding friction of around 400 N, which served as a good initial guess. The guessed parameters were then verified visually by plotting the hookload and comparing it to the measured data. The estimation toolbox could then use these values as starting points for the algorithm, reducing the chance that it would fall into the wrong local minima. For simplicity, many parameters such as the calculated piston areas were assumed to be correct. It was decided that the parameters that really needed to be estimated were Fs , Fc , σ0 , σ1 , σ2 , vs , kp , ko and n shown in red in Figures 3.10 and 3.11. Because there were so many parameters to estimate, there were many possible local minima for the estimation algorithms when the whole model was run. It was therefore decided to split the task into more manageable portions. The LuGre friction estimator was needed for the PLC implementation and was therefore estimated first. It was done by separating the LuGre block and using recorded data for the pressure, velocity and hookload in the workspace. They were then passed to the estimation using in and out blocks as shown in Figure 3.11. The mean value of the hookload was added to the output from the LuGre block to attempt to get it to capture the behavior that diverged from the mean. This simplification yielded reasonable parameters for all but σ2 . This was expected, because much of the viscous friction should also come from the orifice, which was not simulated in this part. σ2 , ko and n were then estimated using the whole system with the updated parameters for the friction estimator.
sigma0 sigma0
sigma0
Fs
Fc
FC
Fs
Fc
Fs
sigma1
sigma1
sigma1
vcyl
sigma2
sigma2
1 v
sigma2
vs
vs
kp
vs
kp
kp
ffric
1 mean
Add
WT002
Constant
p
2 PT002
LuGre friction
Figure 3.11: Parameter estimation for the LuGre friction estimator There are many different methods and settings to choose from and settings recommended by Yulin Si were chosen as he had experience estimating parameters for nonlinear systems. He reccomended the Levenberg-Marquardt algorithm for nonlinear problems. Estimating the parameters could easily have been the topic of a separate thesis, but the estimation gave parameters that were reasonable and the work with the control design could be started.
32
Atle Aalerud and Tomas Klevmo Implementation of Active Control Design for Crown Mounted Compensator to Improve Drilling Performance
CHAPTER 3. MODELING THE SCALED CMC
3.4
Comparison of the Two Models
The most important aspect of the passive system behavior is the jump in force as the cylinders slip. The slipping behavior that creates the rapid force variations is what the control system should reduce. As seen in Figure 4.2, both the models capture this aspect quite well and both of them are therefore suited to test control strategies. If only traditional control was to be implemented, it would have sufficed with only the model from SimulationX. It would have been preferable because of its speedy and simple creation.
0.2
Heave
0.1 0
−0.1 −0.2 50
60
70
80
90
100 110 120 Time [s] Heave [m] Heave velocity [m/s]
130
140
150
(a) Rig heave position and velocity. (It is a cutout of wave 3 as described by equation (2.5))
2.6
Hook load [kN]
2.4 2.2 2 1.8 1.6 1.4 1.2 50
60
70
80
Logged data
90
100 110 Time [s] Simulink model
120
130
140
150
SimulationX model
(b) Hookload of the passive system and two different simulation models
Figure 3.12: Two simulation models and the scaled CMC subjected to the same wave at 6 bar (Data recorded the 3rd of April, 2013)
Atle Aalerud and Tomas Klevmo Implementation of Active Control Design for Crown Mounted Compensator to Improve Drilling Performance
33
CHAPTER 3. MODELING THE SCALED CMC Primarily, the shapes of the models are the most important, as the magnitude of the friction has changed quite a bit during the duration of the project. The friction parameters might not have changed so much if the scaled CMC had been run in the month prior to the first tests. Nevertheless, both models proved to have realistic magnitudes for the lifting force and the friction parameters at the given pressure (6 bar). An interesting case from the modeling perspective is when the wave velocity is positive to begin with, then goes to zero and finally becomes positive again. This happens twice in Figure 3.12a as seen at around 80 and 120 seconds. In this region, the fluid film in the cylinders might break down only partially, resulting in the beginning of a force reversal. This reversal is then interrupted when the cylinders start moving in the same direction as they had been moving. The effects of this wave behavior is seen in Figure 3.12b at the same time points. This is where the models differ slightly, but the recorded data is not able to provide a clear winner. There are clearly more effects in the physical system than what has been included in the models, but the most important ones have been captured. Both models were deemed sufficiently suited for their respective uses in the control design work. The next chapter explains how the models were used for this purpose.
34
Atle Aalerud and Tomas Klevmo Implementation of Active Control Design for Crown Mounted Compensator to Improve Drilling Performance
CHAPTER 4. ACTIVE CONTROL DESIGN
Chapter 4
Active Control Design 4.1
Considerations When Choosing a Control System
The most essential thing when choosing a control strategy is to know the control objectives. This may sound obvious, and in many cases it is. But what if you want to control the weight of a drill bit which lies thousands of meters below the weight compensation system? Then the dynamics of a long steel drill string filled with mud is added to your control problem. And when it is not yet possible to measure this weight on bit (WOB) in realtime, the complexity increases. A lot of work is being done within this field to either measure the WOB in realtime or create an accurate model of the drill string so it is possible to use an impedance approach to control. [20] The scope of this thesis is limited to the CMC system, and it will not focus on the drill string. Nevertheless, if the platform is completely stable, the WOB should also be stable (excluding sub-sea phenomena,) as there are no accelerations. Hence, the Active Control Design chapter will only focus on stabilizing the hook on the travelling block. The drawworks connection is assumed rigid, thus the crown block is also stabilized. The hookload may be stabilized by keeping it’s position constant. This is done by measuring the crown block position relative to the rig, and estimating the rig heave using a Motion Reference Unit (MRU). Hence the position error can be calculated and used for feed back control. The MRU data is commonly used for velocity feed forward. A typical cascaded position control structure is shown in Figure 4.1 where feedback is drawn for position, velocity and force. When position is used, it is normally not needed to run the force feedback loop. When using such a cascaded control structure, it is important to evaluate the bandwidth of the different controller loops to avoid instability. At this point it is possible to see a clear advantage of using the Siemens Variable Frequency Drive (VFD) as this can be run in speed mode with an inner torque control loop which has a very high bandwidth while normal hydraulic cylinders are much slower.
Atle Aalerud and Tomas Klevmo Implementation of Active Control Design for Crown Mounted Compensator to Improve Drilling Performance
35
CHAPTER 4. ACTIVE CONTROL DESIGN
velocity feed forward
SP
PID(s)
PID(s)
PID(s)
Position Controller
Speed Controller
Force Controller
K
velocity wave
Fa
vw xp vp Fh
Plant force feed back
velocity feed back position feed back
Figure 4.1: A typical cascaded control structure As the CMC itself has the main focus, the goal will be to stabilize the hookload. To achieve this, there are many different approaches to controller design. Firstly there is the on-line tuning method such as the Ziegler Nichols’ method which is well suited when no control design can be done. This is mainly when a model of the system to control does not exist or is to inaccurate for other strategies to work satisfactorily. If a model of the system can be obtained, it is possible to use shaping of transfer functions as a strategy [43]. A more precise control, is the signal-based approach such as the Linear Quadratic Gaussian (LQG) control [43]. Nevertheless, even when using such methods, it may be necessary with on-line tuning due to model imperfections. The two latter approaches basically depend on a good linearized model of the system. However, the models acquired in Chapter 3 are absolutely not linear. Furthermore the friction elements within the models are not suitable for linearization. As counteracting this friction is the main motivation for making the model, this leaves us with the on-line tuning method. A fourth approach is the numerical optimization which often involves multi-objective optimization where one attempts to optimize directly the true objectives, such as rise times, stability margins, etc. The numerical optimization approach may also be performed online, which is useful when dealing with cases with constraints on the inputs and outputs. Combining these methods yields the on-line optimization approach. Such an approach is the model predictive control (MPC). Some of the strong features of the MPC is the ability to use a non-linear state-space model and take into account constraints in a well-defined way. [23, 43] In the following sections the on-line tuning method and the model predictive control will be put in context.
36
Atle Aalerud and Tomas Klevmo Implementation of Active Control Design for Crown Mounted Compensator to Improve Drilling Performance
CHAPTER 4. ACTIVE CONTROL DESIGN
4.2
Traditional Control with Additional Friction Estimator
The PID controller using closed loop control and an added feed forward can be adapted and tuned using the on-line tuning method. The MRU, further described in Chapter 5, measures accelerations. These are integrated to yield velocity, and then position. The velocity is commonly used as a feed forward in maritime operations to compensate for heave. Ocean waves are rather predictable as they will not make sudden changes, thus this specific MRU is able to predict its heave within 5 cm or 5 %, whichever comes first. This uncertainty is especially significant for small scaled waves, hence it requires the use of a feedback control rather than just feed forward. Nevertheless, the feed forward control is still the most significant contributor to compensate for the wave disturbance. The feed forward was designed in several steps. Looking at the hookload of the uncontrolled system in Figure 4.2 it is obvious that there is static friction in the system. This appears as a large step in the force when the velocity is approximately zero. Furthermore, the viscous friction can be seen by the slope of the plot beyond these steps. The curve is strongly dependent on the inverse velocity. Hence, the first step was a simple velocity feed forward gain as previously shown in Figure 4.1 on the preceding page. No other control is added at this point. Such a feed forward gain is a traditional way to compensate for ocean wave disturbances. As shown observing the “velocity feed forward” in Figure 4.2, this compensates for the viscous friction, but the static friction remains. Compensating for such friction will require a friction estimator.
Atle Aalerud and Tomas Klevmo Implementation of Active Control Design for Crown Mounted Compensator to Improve Drilling Performance
37
CHAPTER 4. ACTIVE CONTROL DESIGN
0.2
Heave
0.1 0 −0.1 −0.2
0
5
10
15
20
25
20
25
Time [s] Heave [m]
Heave velocity [m/s]
(a) Rig heave position and velocity.
3.4
Hook load [kN]
3.2 3 2.8 2.6 2.4 2.2 2 1.8 0
5
10
15 Time [s]
Passive system
Velocity feed forward
(b) Hookload of the system with no active control and by the use of traditional velocity gain feed forward.
3.4
Hook load [kN]
3.2 3 2.8 2.6 2.4 2.2 2 1.8 0
5
10
15
20
25
Time [s] Stribeck feed forward
LuGre feed forward
(c) Hookload when using friction models for feed forward control.
Figure 4.2: Rig heave and different kinds of feed forward control to compensate variations in the hookload 38
Atle Aalerud and Tomas Klevmo Implementation of Active Control Design for Crown Mounted Compensator to Improve Drilling Performance
CHAPTER 4. ACTIVE CONTROL DESIGN There are several approaches to making a friction estimator. It is possible to simply tune a lookup table with the friction force at different velocities. Interpolation may be used between the table velocity values. This yields an approximate friction force which probably will work satisfactorily. However, the authors have used a more analytical approach.
0.6
0.6
0.4
0.4
0.2
0.2
Force [kN]
Force [kN]
The pressure dependent Stribeck friction force as described in equation (3.19) on page 20, was implemented as a Matlab function and used as a feed forward gain. It is shown by the “Stribeck feed forward” in Figure 4.2 that the hookload is much better compensated using a friction model. Most of the static friction is compensated. However, some “spikes” are left as it is difficult to compensate at the exact right moment. Comparing the Stribeck friction curve in Figure 4.3b with the simulated hookload reveals that a hysteresis effect must be implemented to further improve the friction model.
0 −0.2
0 −0.2
−0.4
−0.4
−0.6
−0.6 −0.2 −0.1 0 0.1 Heave position [m]
0.2
(a) Friction as a function of displacement.
CMC
Simulated
−0.1 0 0.1 Heave velocity [m/s] (b) Friction as a function of velocity.
Stribeck friction
LuGre friction
Figure 4.3: Comparison of Stribeck and LuGre friction model The LuGre friction model is able to describe such a hysteresis effect where the Stribeck model does not. It was described in Subchapter 3.3 by equations (3.37) to (3.39) and was at this stage implemented as a Matlab Simulink subsystem. The complete system is shown in Figure 4.4 with a feedback gain of zero. The parameters for the LuGre friction model were estimated in Subchapter 3.3. These parameters were applied to the friction model except for σ2 which is the coefficient for viscous friction. This was tuned to σ2 = 1500. It should be expected that the value is different for this application than in the mathematical model because this estimator includes the viscous friction from the orifice. The resulting response in the hookload is shown in Figure 4.2. It appears to have almost the same effect as the Stribeck model, but the spikes are now reduced in amplitude and protrude on both sides of the mean load. However the biggest change can be seen in the velocity-force plot in Figure 4.3. Here it is apparent that the LuGre model has hysteresis, and the Stribeck does not. As the feed forward using a LuGre friction model has reduced the implications of wave disturbances significantly, the next step is generally to apply a feedback control to compensate for uncertainties such as the MRU accuracy.
Atle Aalerud and Tomas Klevmo Implementation of Active Control Design for Crown Mounted Compensator to Improve Drilling Performance
39
CHAPTER 4. ACTIVE CONTROL DESIGN
Gain1
LuGre friction2
-1
2600
PI(z)
Setpoint
PID Controller
ffric
Fa Saturation
vcyl p p2 MRU.v Hook Load
Subsystem
Figure 4.4: Traditional control with friction estimator There are several methods of tuning the PID controller heuristically where the most well known is the Ziegler–Nichols tuning method. However, this method requires that the control loop is brought to the stability limit during the tuning. This is not very desirable using a large mechatronic system. Finn Haugen describes a method he terms The Good Gain method. This method does not require oscillations during tuning. However it requires the use of a step response. The method states that the parameters can be found by increasing the gain, Kp , until an acceptable damped response is achieved. Then the integral time is set to Ti = 0.75 · Tp where Tp is the oscillation period of the response. Finally the gain is reduced by about 20 % to compensate for the introduced integral gain. [22, 24] It was found difficult to get oscillations using a step response due to the high friction in the system. Thus, The Good Gain method could not be applied directly. However, the same strategy was adapted while the system was moving. Firstly the gain was adjusted until the response was satisfactory and stable, then this gain was reduced by 20 % and a an integral time was adapted experimentally. This resulted in a system with P = 0.7 and I = 60. Note that the result was run with a discrete PI-controller using the ideal controller equation Ts z Cid (z) = P 1 + I · z−1 �
�
where Ts was set to 10 ms.
40
Atle Aalerud and Tomas Klevmo Implementation of Active Control Design for Crown Mounted Compensator to Improve Drilling Performance
(4.1)
CHAPTER 4. ACTIVE CONTROL DESIGN The simulated result of this tuning is shown in Figure 4.5 where it can be observed that the hookload variation is negligible most of the time except for when the “spikes”, which are very short in duration, occur. 2.8
Hook load [kN]
2.7
2.6
2.5
2.4
0
5
10
15
20
25
Time [s]
Figure 4.5: The tuned control result for the hookload of the simulated system. The figure illustrates a test where the pressure was 7 bar and the set value for the controller was 2.6 kN
Atle Aalerud and Tomas Klevmo Implementation of Active Control Design for Crown Mounted Compensator to Improve Drilling Performance
41
CHAPTER 4. ACTIVE CONTROL DESIGN
4.3
Model Predictive Control
A more advanced control strategy than the traditional strategy outlined in the previous section may be applied to improve performance. An on-line optimization approach is the Model Predictive control (MPC) [43]. Model Predictive control can be regarded as the next most important control method in the industry after PID control [23]. Most industrial processes are nonlinear in general but MPC applications are normally based on the use of linear models. Linear models provide good results when the plant is operating in the neighborhood of the operating point [9]. It is usually employed in processes with long time constants such as chemical plants where there is ample time to carry out the calculations. As of late, faster implementations have begun to emerge in the litterature, such as in an article in the journal Automatica, where the controller is run in the microsecond range [26]. Figure 4.6 shows the input and output strategy of MPC controllers where the controller predicts system response, y, for a planned input, u, over a finite horizon, N. It is called the horizon because it is analogous to moving along the surface of the earth and the horizon in front of you moves with you and you consequently see a certain distance ahead no matter where you are. It is usually better to be able to see further into the future. However, longer horizons also require more computation time. The horizon size is thus subject to tuning for the specific application. The main advantage for MPC as opposed to traditional control strategies is, as the name suggests, that it predicts what will happen using a model and tries to correct deviations even before they manifest.
Figure 4.6: Principle of MPC strategy [9] Currently, most of the optimal control design software are based on linear systems. For example, the design process in the MATLAB MPC toolbox is based on linear system analysis, and linearization is performed around the system setpoint when dealing with nonlinear systems. The CMC system exhibits severe nonlinearities and the usefulness of predictive control based on a linearized model might be limited. The effects of linearizing is especially detrimental when the fact that there is no steady state operating point is considered. There are several zero-crossings during each wave period. Moreover, the friction force, which resembles a step function, would be pointless to linearize. The system can be viewed as experiencing continuous transitions and it is therefore always operating in transient mode. For this case, the linear control law will not be very effective [9].
42
Atle Aalerud and Tomas Klevmo Implementation of Active Control Design for Crown Mounted Compensator to Improve Drilling Performance
CHAPTER 4. ACTIVE CONTROL DESIGN Since counteracting the friction is the focus of this control effort, a nonlinear implementation of model predictive control was deemed the only viable option. The main disadvantage for a nonlinear model is that convexity of the optimization problem is lost and this makes on-line applications much harder [33]. Where a linearized model might find a global optimum, it might find the optimum for the wrong problem [33]. This is especially the case if the linearized model is a very poor approximation such as in the zero crossing for the friction force. The time for finding the optimum of a nonlinear model may also vary substantially and it might not even be possible to find it [33]. State estimation for nonlinear models also becomes much more problematic than for linear ones [33]. Using MPC with nonlinear models may lead to acceptable performance in practice but it is usually very difficult or impossible to analyse [33]. However as J.M Maciejowski puts it, “Lack of analysis has not been an obstacle to the application of predictive control in the past”. The basic structure for most MPC controllers, both linear and nonlinear, is shown in Figure 4.7. There are three inputs to the controller, namely the setpoint, the measured output and the measured disturbance. The one output of the controller is the control input to the process. The prediction model contains a model of the system and predicts the behavior of the system up to the specified horizon based on the known future input, disturbance and outputs from the process. The optimizer is the algorithm that plans the future control action based on the predicted system behavior, the specified constraints and a cost function. The cost function usually consists of quadratic functions of the deviation from the reference and the control effort [9]. Weighting functions are applied to the quadratic terms in order to be able to penalize or prioritize certain state deviations or actuators. The cost function and the constraints are therefore tuning parameters of the optimization algorithm. A good term for the cost function could be the RMS value of the deviation from setpoint.
MPC controller
Cost Function
Future Error
Setpoint(s)
+
Constraints
Input(s)
Optimizer
Process
Future Input Predicted Output(s)
Prediction Model
Disturbance(s)
Output(s)
Figure 4.7: The basic structure of an MPC controller [9, 33] The ACADO Toolkit [25] is a software environment and algorithm collection written in C++ for automatic control and dynamic optimization. It provides a general framework for using different algorithms for direct optimal control, including nonlinear MPC, which is a promising solution for the control problem at hand. The nonlinear optimization algorithm used in ACADO MPC design is sequential quadratic programming (SQP) [8], which is an iterative method for constrained nonlinear optimization.
Atle Aalerud and Tomas Klevmo Implementation of Active Control Design for Crown Mounted Compensator to Improve Drilling Performance
43
CHAPTER 4. ACTIVE CONTROL DESIGN
The ACADO toolkit is free to use and is distributed under the GNU Lesser General Public Licence. Moreover, it is a cross-platform toolkit which could be used in Windows, Linux, OS X or even an embedded system such as a microcontroller. Besides, the ACADO Toolkit is written in a completely self-contained manner, which has greatly reduced the code transplant complexity. A simulation environment is included in the ACADO toolkit to test the controller before it is implemented in real life. It provides stand-alone efficiently implemented Runge-Kutta and BDF integrators for the simulation of ordinary differential equations (ODEs) and differential algebraic equations (DAEs), which could easily handle smooth differential equations. They are the same integrators that are used in the prediction model of the stand-alone controllers the toolkit generates. Different examples are included to show the user how it is done. The setup of the ACADO toolkit went smoothly and all the examples were simulated correctly. It was verified that an MPC controller could be designed and generated as C++ code using the toolkit. The general workflow [27] of ACADO MPC and its syntax in C++ is shown below: \* Define variables *\ Diff erentialState P1 P2 ... ; Control F ; Disturbance R ; \* Define differential equations *\ D i f f e r e n tialEquation f ; f measured disturbance ( s ) - - >| 2 inputs | | |--> unmeasured disturbance ( s ) - - >| 1 outputs | -------------manipulated variable ( s )
Indices : ( input vector ) ( output vector )
1 measured output ( s ) 0 unmeasured output ( s )
Manipulated variables : [1 ] Measured disturbances : [2 ] Measured outputs : [1 ]
Weights : ManipulatedVariables : ManipulatedVariablesRate : O ut pu tV a ri ab le s : ECR : Unconstrained
46
0 0.1492 0.6703 67032
Atle Aalerud and Tomas Klevmo Implementation of Active Control Design for Crown Mounted Compensator to Improve Drilling Performance
CHAPTER 4. ACTIVE CONTROL DESIGN A plot of the performance of the MPC controller as it controls the differential equation model, is shown in Figure 4.9. This means that it controls “itself” and has full knowledge of the system it tries to control. It is clear that it performs rather well in regions that are not affected by the static friction. The spikes occur as the cylinders stick and subsequently release. This is to be expected because the linearized model is not able to predict the sudden variations. A nonlinear MPC controller would therefore most likely give a much better performance. A plot of how the controller handles the s-function from SimulationX is also shown in the next section.
Hook load [kN]
2.8
2.6
2.4 2.2
2 0
5
10
15
20
25
Time [s]
Figure 4.9: The MPC controller controlling “itsel”
mo 2600
ref
Setpoint
md
MPC
mv
Fa
p2 MRU.v Hook Load Subsystem
MPC Controller
Figure 4.10: MPC controller and s-function from SimulationX Although the MPC control was not implemented in the PLC, it was as shown above successfully used within the Matlab environment. There still remains an alternative way to implement MPC with the physical system through the use of Object Linking and Embedding for Process Control (OPC). OPC is an industry standard for communication between industrial control systems. Matlab has an OPC toolkit and you would therefore not need the ACADO toolkit controller. The MPC toolbox could be used with OPC to communicate with the PLC. This would require the Matlab MPC controller to run in real time. Further investigation into this possibility was not prioritized as the simulated performance of the MPC controller was worse than for the traditional control system.
Atle Aalerud and Tomas Klevmo Implementation of Active Control Design for Crown Mounted Compensator to Improve Drilling Performance
47
CHAPTER 4. ACTIVE CONTROL DESIGN
4.4
Simulation of Control Strategies
The two control systems have been simulated in Simulink where they have controlled the sfunction that was exported from SimulationX. There are two reasons why the differential equation model has not been used to test the control systems. The first one is that the MPC controller should be tested on a system that is more advanced than the one it was designed with. In the opposite case, the controller would know everything and should therefore give a better performance than what is realistic. A model is of course never fully realistic, but the SimulationX model was the preferred choice because it is more complex. Reason number two is the obvious need to compare the strategies on the same system. The SimulationX model in the form of an s-function, was therefore chosen. The simulation is shown in Figure 4.11 and it appears that the MPC controller is able to dampen the oscillations of the modelled system in a better way than the traditional control strategy. This might be due to the fact that the MPC controller has constraints on the rate of the manipulated variable. It might also in part be caused by numerical inaccuracies in the solver. The RMS error for the traditional control system was in this simulation 35 N and for MPC it was 58 N. It was decided to implement only the simple control loop in the physical system. If the MPC controller was designed with an optimization algorithm such as the one employed by ACADO, a reduced amplitude of the load variations is to be expected. One interesting observation is that the MPC controller performs better on the s-function than when it controls its own model (Figure 4.9).
Hook load [kN]
2.8 2.7 2.6 2.5 2.4 2.3 0
5
10 Time [s] Feed forward and PID Control
15
20
25
Model Predictive Control
Figure 4.11: A plot of the simulation of the two control systems using the SimulationX model at 7 bar
48
Atle Aalerud and Tomas Klevmo Implementation of Active Control Design for Crown Mounted Compensator to Improve Drilling Performance
CHAPTER 5. HARDWARE FOR MEASUREMENT AND CONTROL
Chapter 5
Hardware for Measurement and Control 5.1
Introduction to the Instrumentation
The full scale CMC is robustly instrumented using redundant measurements and actuators. An example of such equipment is the flow shutoff valve which is built as an integrated valve block assembly connected between the compensator cylinders and accumulator. Under normal compensation operation of the CMC, the flow shutoff valve is left fully open in AUTO mode. The flow shutoff valve will close in case of sudden crown block load changes. To ensure that this function will not fail, it is equipped with multiple valves, actuators and position sensors. [35, 37] Another key element is the position of the crown block. This is also measured in a redundant manner where one of three alternative sensors is a wire encoder. The sensor is of the rope length transmitter type, and housed in a stationary stainless steel sensor box at the CMC’s upper platform. It is connected to the crown block below by a thin steel wire rope. The two other position sensors are of a different design and measure the angular rotation of the eccentric hubs. [35, 37] The CMC operation parameters such as air pressure, stroke and valve positions will be continuously monitored by the PLC, housed in a control cabinet located in the Local Instrument Room. The PLC forms the signal interface between the operator’s screen/panel and the CMC. In addition to position and pressure transmitters on the CMC unit, the system also includes a Motion Reference Unit (MRU), with unique exactness, measuring rig heave, roll and pitch as well as heave acceleration. The MRU is located in safe area as close as possible to the rig’s center of roll, inside the control cabinet. [35, 37] Although it is normal to use redundant measurements and implement extensive safety measures, this was not the focus when instrumenting the scaled CMC. The main objective was to implement the key measurements necessary to make a control system. Furthermore, the instrumentation should be able to identify features of the model such as friction. The instrumentation requirements were confined to one crown block position sensor, two pressure measurements and three load cells. In addition to this, a motion reference unit (MRU) was provided to measure the heave motion. For actuation, a complete Siemens SINAMICS drive system was provided. An overview of this instrumentation is shown in figure Figure 5.1 on the next page.
Atle Aalerud and Tomas Klevmo Implementation of Active Control Design for Crown Mounted Compensator to Improve Drilling Performance
49
CHAPTER 5. HARDWARE FOR MEASUREMENT AND CONTROL
Siemens Drive
- GT001 Wire Encoder
Stewart Platform
M
- WT001 Force Sensor
MRU
Crown and Travelling Blocks
- PT001 Pressure Sensor
- WT002 Force Sensor
- WT003 Force Sensor
- PT002 Pressure Sensor
Figure 5.1: Illustration of the instrumentation for the scaled CMC model
50
Atle Aalerud and Tomas Klevmo Implementation of Active Control Design for Crown Mounted Compensator to Improve Drilling Performance
CHAPTER 5. HARDWARE FOR MEASUREMENT AND CONTROL
5.2
Programmable Logic Controller and Control Cabinet
The Programmable Logic Controller (PLC) was introduced around 1970 as a replacement of control logic based on relays, cam timers, drum sequencers and dedicated closed-loop controllers. Since then, they have followed the evolution of computer technology. Using the PLC it became much simpler to develop, change, test and maintain control systems as rewiring was no longer needed to make changes. The most important features of the PLCs are that they are more reliable and robust than traditional computers and microcontrollers. They have a long lifespan and are easy adaptable. Since most PLCs are module based, it is easy to adjust the number of required inputs and outputs to fit any specific task from just a simple control with a few sensors, to a large network of interacting PLCs, sensors and actuators made by several manufacturers. [18] A Siemens 319-3 PN/DP CPU is placed in slot 2, shown in Figure 5.2. The CPU is the component that contains the software and executes it. It has ethernet plugs to connect to a computer for programming and monitoring purposes. The two white ethernet cables can be seen coming out of the bottom of the CPU. The blue cable that sticks out the bottom is for communication between the CPU and the Siemens SINAMICS drive control system, which is seen directly below the CPU with a light blue front plate. Figure 5.2 also shows the modules to the right of the CPU that are its way of communicating with the outside world. Slot number 4 contains the CP 341-RS232C RS232 card that is used to interface with the MRU. Slot 5 contains a DI16xDC24V digital input card and slot 6 contains a DO16xRel AC120V/230V digital output card which creates digital 24 V outputs. These two cards are used for the buttons and joystick logic that control the motor manually. Besides the MRU-communication, the most important card for this project is the AI8x14Bit analog input card that is placed in slot number 7. All analog measurements, more specifically the force and pressure sensors in addition to the analog joystick values, are connected to this card. The last slot, contains a counter card for the wire encoder called SM 338 POS-INPUT. The rail mounted terminal block on the left side of the cabinet connects the various electrical equipment to the PLC modules and was installed by the thesis authors along with the PLC components. The other equipment shown on the bottom and on the right are all related to the Siemens SINAMICS drive control system, which was not configured as part of this project.
Atle Aalerud and Tomas Klevmo Implementation of Active Control Design for Crown Mounted Compensator to Improve Drilling Performance
51
CHAPTER 5. HARDWARE FOR MEASUREMENT AND CONTROL
Figure 5.2: The control cabinet containing the Siemens PLC and drive system
52
Atle Aalerud and Tomas Klevmo Implementation of Active Control Design for Crown Mounted Compensator to Improve Drilling Performance
CHAPTER 5. HARDWARE FOR MEASUREMENT AND CONTROL
5.3
Electric Drive, Rack and Pinion
The power capacity of the active system on a CMC is typically only 10% of the passive compensator and can only assist the compensator when it is properly balanced [21]. Thus, it is important for the active drive to work around this balance condition, that is, the active drive must ensure that its mean active force is zero. Simulations of the scaled CMC while using 10 bar pressure mid-stroke, yields approximately 7 kN. Thus, 10 % of this passive force equals 700 N. However, it is more realistic to use the passive system at maximum 8 bar which was the available pressure at the lab. This yields a capacity of 5.6 kN and the rack and pinion were dimensioned to transfer at least 560 N. The Siemens Variable Frequency Drive (VFD) including the gear box ratio of 50 and gear loss, has a rated torque of 14.1 Nm. By selecting an Atlanta rack with a module of 2 and a Atlanta pinion, also with a module of 2 and 25 teeth, the pitch diameter is 50 mm. The nominal output force from the drive is then F anom =
Tnom · 2 14.1 N m · 2 = = 564 N dp 50 mm
(5.1)
which was considered sufficient as the passive system probably will not be used at the maximum pressure. To verify that the chosen rack and pinion will not break, some further calculations were done according to the Atlanta Servo Drive System catalog [7]. Drive and gear specifications was found in the SINUMERIK & SINAMICS Automation Systems for Machine Tools catalog [2]. Figure 5.3 shows an Atlanta rack.
Figure 5.3: The Atlanta rack [2] To be conservative, the maximum torque of the drive gearbox was chosen for verification. Thus, F amax =
Tmax · 2 40 N m · 2 = = 1.6 kN dp 50 mm
(5.2)
was the dimensioning actuation force. The load factor, KA , was chosen at 1.50 as the drive was to execute light shocks and the load inflict medium shocks. A safety coefficient SB was set to 1.2. The life-time factor, fn , was set to 0.5 which emulates low speed and daily lubrication. Finally, the linear load distribution factor, LKHβ , was set to 1.5 in case the aligning between the rack and the pinion was not perfect. These safety factors and the given maximum feed force of the rack, F utab = 5 kN , the maximum force is calculated as following: F umax =
F utab = 1.95 kN KA · SB · fn · LKHβ
Atle Aalerud and Tomas Klevmo Implementation of Active Control Design for Crown Mounted Compensator to Improve Drilling Performance
(5.3)
53
CHAPTER 5. HARDWARE FOR MEASUREMENT AND CONTROL Since F amax < F umax , the selected rack and pinion are strong enough for the application.
Figure 5.4: The Siemens Synchronous Servo Motor [40] Although the rack and pinion will not break, it should be verified that the drive illustrated in Figure 5.4 is not broken due to axial or radial loads. Using the same torque as before, the tangential force is F t = F amax = 1.6 kN.
(5.4)
F r = F t · tanα = 1.6 kN · tan 20◦ = 0.58 kN
(5.5)
Further the radial force is
which is significantly less than the maximum radial load on the output shaft given as 2.7 kN [2]. As spur gears has been chosen, no axial forces apply. Some of the drive specifications are summarized in Table 5.1. Description Motor Rated speed Rated Power Static torque Rated torque Rated current Rotor moment of inertia Weight Gearbox Gear ratio Continuous motor speed Motor speed, max. Output torque Output torque, max. Radial load on output shaft, max. Axial load on output shaft, max. Moment of inertia gearbox (referred to the drive)
Parameter
Value
Unit
nrated Prated M0 Mrated Irated J m
6000 0.19 0.4 0.3 1.1 0.21 1.2
rpm kW Nm Nm A 10−4 kgm2 kg
nrated 1 n1 Mrated 2 MG2 Fr Fa J1
50 4800 6000 26 40 2700 2400 0.06
rpm rpm Nm Nm N N kgcm2
Table 5.1: Features of the 1FT6 synchronous servo motor and two stage planetary gearbox. [2]
54
Atle Aalerud and Tomas Klevmo Implementation of Active Control Design for Crown Mounted Compensator to Improve Drilling Performance
CHAPTER 5. HARDWARE FOR MEASUREMENT AND CONTROL
5.4
Pressure and Force Sensors
The most important quantity to measure in this project are the forces. This is because both the input and the output of the control system are forces. The Tecsis force transducer, model F23011350002, was chosen for all force measurements. According to the data sheet [44], it has a nominal load of 5 kN tension and compression. The measuring accuracy is ≤ 0.2 % of the entire range which yields an accuracy of ≤ 20 N. However, as the equipment has good repeatability, the experienced accuracy after calibration may be higher. The response time, within 10 - 90 % of the range, is ≤ 1 ms. The measuring principle is based on strain gauges connected to a Wheatstone Bridge. Further, this is connected to an integrated amplifier which yields an analogue output signal of 4 - 20 mA using two wires. An advantage of measuring using the current signal is that the measurement is nearly unaffected by cable length. Furthermore, cable break and short circuit can easily be detected. Three force transducers of the mentioned type were used to measure forces on the scaled CMC. The first was attached to the actuating rack to measure the force applied on top of the crown block. The second was attached on the bottom of the travelling block to measure the hookload. This is the weight experienced hanging from the hook. The last transducer was placed on the floor (seabed) and was used to calculate the actual weight on bit. Only the first transducer will operate in both tension and compression. Improved measuring accuracy can be achieved by choosing force transducers with lower range and only tension actuation.
(a) The Tecsis F2301 force transducer [44]
(b) The Aplisens PCE-28 pressure transmitter. [1]
Figure 5.5: The force transducers and pressure transmitters used in the project The force that is exerted by the cylinders is a function of the system pressure. Pressure transmiters were therefore needed and the Aplisens pressure transmitter, model PCE2812000AAC, was chosen for this task. It has a measurement range of 25 bar. The accuracy of the measurement is ≤ 0.2 % which equates to 50 mbar. The thermal error is typically 0.2 % / 10 ◦ C; max 0.3 % / 10 ◦ C. However, since the hysteresis and repeatability is 0.05 %, the long term stability is 0.1 % / year. As the pressure transmitter includes an embedded amplifier, the output signal is 4 - 20 mA using two-wire transmission. On the scaled CMC, two pressure transmitters of the described type were used. One was used to measure the fluid pressure in the main cylinders. The other was used to measure the air pressure within the APV’s. [5, 6]
Atle Aalerud and Tomas Klevmo Implementation of Active Control Design for Crown Mounted Compensator to Improve Drilling Performance
55
CHAPTER 5. HARDWARE FOR MEASUREMENT AND CONTROL
5.5
Wire Encoder and Motion Reference Unit
The FSG Rope Length Transmitter, model SL 3005 - D9 / GS 130 / F, comprises a patented wire drum mechanism and an encoder as shown in Figure 5.6a. A high-flexible measuring wire, made of rust and acid proofed stainless steel, is wound on a precise measuring drum which is powered by a spiral spring. During this winding operation, the measuring drum will be staggered via a threaded spindle in axial direction, so that the measuring wire will be wound parallel and always with a constant pitch. The measuring wire has a diameter of 1.35 mm and a length of 5 m and a repeatability of 0.1 % referring to measuring value of rope length mechanic without encoder system. The drum including the wire, has a circumference of 334.1 mm. [3] Connected to the drum, is a Hengstler EX Heavy Duty Absolute encoder, model AX65/1213EL.72SGA. This is a very robust multi-turn encoder which communicates with PLC using a 25 Bit Synchronous Serial Interface(SSI) and has a 12-bit resolution on the measured value. The encoder has an absolute accuracy of ±1◦ and a repeatability of ±0.2◦ . [4] The combined wire encoder system should then have a repeatability within 334.1 mm · 0.4◦ /360◦ + 5000 mm · 0.1 % = 5.37 mm.
(5.6)
It is noticed that the mechanics is the dominating uncertainty of the combined equipment. However, the actual value may be much better. The rope length transmitter system was placed on top of the scaled CMC measuring the distance to the crown block, thus calculating the stroke of the main cylinders of the system.
(a) FSG SL 3005 Rope Length Transmitter. [3]
(b) The Kongsberg Seatex MRU H.
Figure 5.6: Two different types of position sensing equipment The Motion Reference Unit (MRU) shown in Figure 5.6b is a very expensive piece of equipment, but it provides vital data about the platform accelerations. The Kongsberg Seatex MRU products are supplied in a range of models from MRU 1 to MRU 6 as the top performance model. The MRU provided for this project is the MRU H, which is made in the same way as the MRU 5 but uses different angular rate sensors.
56
Atle Aalerud and Tomas Klevmo Implementation of Active Control Design for Crown Mounted Compensator to Improve Drilling Performance
CHAPTER 5. HARDWARE FOR MEASUREMENT AND CONTROL This MRU is specially designed for motion measurements in marine applications requiring highly accurate heave measurements in environments with extreme horizontal accelerations. The heave motion dynamic accuracy is 5 cm or 5 %, whichever is highest. Additional technical data of the MRU H extracted from the MRU User’s Manual, can be seen in appendix C. [30] The MRU was used to measure the heave motion of the Stewart platform. It is possible to extract the accelerations directly from the Stewart platform using UDP communication. However, it was deemed more realistic to use measurements, and then filter these, so the data would be as comparable to the real scenario as possible. Figure 5.7 shows the MRU coordinate system and the default mounting position.
Figure 5.7: Default mounting position for the MRU (Seatex MRU User’s Manual, Kongsberg Seatex AS) [30]
Atle Aalerud and Tomas Klevmo Implementation of Active Control Design for Crown Mounted Compensator to Improve Drilling Performance
57
CHAPTER 5. HARDWARE FOR MEASUREMENT AND CONTROL
58
Atle Aalerud and Tomas Klevmo Implementation of Active Control Design for Crown Mounted Compensator to Improve Drilling Performance
CHAPTER 6. SYSTEM IMPLEMENTATION
Chapter 6
System Implementation 6.1
Transportation and Placement on the Stewart Platform
The scaled CMC made it into the lab during quite turbulent circumstances because of the ongoing construction outside the lab. The only way the scaled CMC could be transported into the building was through the loading port, but the area in front of it was unreachable by car. After many inquiries with the contractor, a single date was given as the only option to get the CMC into the lab using the construction crane at the site. The group then started working on transporting it from the NOV warehouse in Kristiansand to the university in Grimstad. Jan Terje Håkedal helped in getting the people at the warehouse to wrap it in plastic and place it on a car trailer that was borrowed from the University and drove it to Grimstad. The date came when the contractor had promised that the scaled CMC could be lifted in, but the workers at the site knew nothing about the plans. After a while it became clear that the supervisor had forgotten about it and gone on vacation. A last minute arrangement was made with the excavator operator for him to lift the scaled CMC into the lab as shown in Figure 6.1 where the open loading port is also visible.
Figure 6.1: The scaled CMC was lifted into the lab using an excavator
Atle Aalerud and Tomas Klevmo Implementation of Active Control Design for Crown Mounted Compensator to Improve Drilling Performance
59
CHAPTER 6. SYSTEM IMPLEMENTATION Using drawings for the full scale CMC, it was possible to plan the placement on the Stewart platform. Guide markings were made on the Stewart platform in advance according to the drawing in Figure 6.2a. Because full scale documentation was used, the dimensions for the red drawing needs to be scaled down by a factor of 7 to match the black drawing. The markings ensured that the scaled CMC was placed in dead center of the Stewart platform when using the somewhat imprecise overhead crane. It was verified after placement that it have been done with an accuracy of 1 mm. The scaled CMC was then bolted in place on four points using threaded rods as shown in Figure 6.2b. Because the project focuses solely on heave motion, you could argue that the fastening was unnecessary. Nevertheless, it was deemed necessary in order to maintain safety in the event that the platform would tilt as a result of human error.
(a) Drawings of the Stewart platform in black and the CMC in red (dimensions are not in the same scale)
(b) Fastening using threaded rods and square tubing
Figure 6.2: Placement and fastening of the scaled CMC
60
Atle Aalerud and Tomas Klevmo Implementation of Active Control Design for Crown Mounted Compensator to Improve Drilling Performance
CHAPTER 6. SYSTEM IMPLEMENTATION
6.2
Mechanical Adaptations and Mounting of Instrumentation
The scaled CMC needed a load on the hook and a way to measure this load. In real life, the load would be everything hanging from the hook and a very simple representation of this has been made. This representation is referred to as simply the drill string. The idea was that components can be switched out with for example a spring-mass-damper setup to get a more realistic response. A more advanced physical drill string representation was not prioritized. A large mass would ideally be placed on the floor and connected to the hook. This setup would have made phenomena such as bit bounce possible, but as only contact operations are considered in this thesis, it was decided to bolt the drill string directly to the floor. The load would then include a theoretical mass that will never move. In order for the drill string to be bolted to the ground, a hole had to be made in the concrete as shown in Figure 6.3a. An M16 expansion bolt was then inserted into the hole and tightened to fasten it. The drill string was then connected between the expansion bolt and the travelling block as shown in Figure 6.3b. The components that comprise the drill string are discussed later in this subchapter. With this setup, the system could be pressurized to the correct working pressure without having a large weight on the ground.
(a) A hole in the concrete floor was needed for securing the drill string
(b) The drill string assembly
Figure 6.3: Connecting the scaled CMC to the floor The drill string should only transfer force and not moment. A bracket with a swivel was therefore used to connect the bottom force sensor to the expansion bolt as seen in Figure 6.4a. This force sensor was intended as a measurement of the WOB for more advanced drill string assemblies. The swivel was used in the case that the scaled CMC was not placed exactly in the middle of the Stewart platform. It makes up for any misalignment between the position of the expansion bolt and the travelling block so only a force is transferred. Figure 6.4b on the following page shows the force sensor that is closest to the hook, WT002.
Atle Aalerud and Tomas Klevmo Implementation of Active Control Design for Crown Mounted Compensator to Improve Drilling Performance
61
CHAPTER 6. SYSTEM IMPLEMENTATION
(a) WT003 force sensor placed at end of swivel head and floor bracket (WOB)
(b) WT002 force sensor (hookload) placed between crown block and drill string
Figure 6.4: Two of the force sensors As the MRU is very sensitive, high frequency vibrations will have a detrimental effect on its performance. It was mounted in a special fixture containing rubber mounts to attenuate the higher frequencies. A bracket was made to mount the fixture in the correct operating position on the Stewart platform as shown in Figure 6.5a. Figure 6.5b shows the view from below where the three rubber mounts are visible. The green APV’s and the hydraulic line to one of the main cylinders are also visible in the figure.
(a) The MRU was mounted directly on the Stewart platform
(b) The MRU viewed from below
Figure 6.5: Placement and mounting of the MRU
62
Atle Aalerud and Tomas Klevmo Implementation of Active Control Design for Crown Mounted Compensator to Improve Drilling Performance
CHAPTER 6. SYSTEM IMPLEMENTATION Whereas the drill string assembly consisted simple individual parts that could be fabricated as the work progressed, the placement of the components on the top of the scaled CMC required more careful planning. This was done using the computer aided design (CAD) software Solidworks. Drawings for the drive, pinion and rack were available for download at the different manufacturers’ web sites. Brackets for connecting the equipment together and a footprint for the top of the scaled CMC were designed using the same software. The resulting assembly can be seen in Figure 6.6 where the main components are the electric drive, the wire encoder, the rack and pinion and brackets to keep it all together. It was very helpful to be able to visualize the placement, mostly because of the limited space available on top of the scaled CMC and also due to the challenge involved in getting a good look at the top, as it is about 4 meters above ground.
Figure 6.6: Solidworks model of component placement Figure 6.7 shows one of the brackets that were designed using Solidworks.
Figure 6.7: Solidworks model of rack and pinion assembly featuring a roller and sliding bearings for guiding the rack. The slot in the roller accommodates the encoder wire
Atle Aalerud and Tomas Klevmo Implementation of Active Control Design for Crown Mounted Compensator to Improve Drilling Performance
63
CHAPTER 6. SYSTEM IMPLEMENTATION Figure 6.8 shows the electric drive, planetary gear box, mounting bracket and electrical wires. It was desired to mount the equipment without drilling or cutting in the scaled CMC and the placement of equipment was influenced by this. The bracket that was included with the drive had to be supplemented to achieve the desired placement. The motor bracket was fastened to the scaled CMC using threaded rods and a flat piece of steel as shown in Figures 6.8 and 6.9a. The arrangement proved to be very robust and it did not move visibly during the entire project period. During operation, none of the parts flexed of deformed visibly either. The other side of the motor bracket is shown in Figure 6.9b with the bracket depicted in Figure 6.7 on the previous page bolted on using the same bolts that are used to fasten the motor. The end of the gear box is visible in the circular hole. The pinion is press fitted with a key to the gear box shaft and is also shown in Figure 6.9b. The rack fits exactly in the space that is enclosed by the roller, sliding bearings and pinion and the only way to get it into position is to run the motor.
Figure 6.8: The Siemens electric drive with gear box
(a) Fastening of motor bracket using threaded rods and a flat piece of steel
(b) Bracket for keeping rack and pinion tightly together while allowing the rack to move
Figure 6.9: Brackets for keeping the electric drive and rack connected
64
Atle Aalerud and Tomas Klevmo Implementation of Active Control Design for Crown Mounted Compensator to Improve Drilling Performance
CHAPTER 6. SYSTEM IMPLEMENTATION The wire encoder is fastened in the same manner as the motor bracket using a threaded rod and a flat piece of steel. It is positioned in such a way that the wire can run along the rack inside the groove down to the crown block. It is not necessary to connect the wire exactly in the middle of the crown block as it can be zeroed in any position. It is however, necessary that the crown block can move freely through the entire stroke and the encoder was thus positioned to make this possible. Figure 6.10a shows how the wire encoder is positioned and Figure 6.10b shows the connection point for the wire right next to the WT001 force sensor. Figure 6.10b also shows the assembly connecting the rack to the crown block. An M12 nut is welded to the bottom of the rack to accept one end of the WT003 force sensor. The sensor is in turn connected to a swivel bracket. The bracket that is fastened to the crown block, was made to fit into the existing connection for the equalizing chains, thus removing the need for drilling or cutting in the crown block. The connection between the electric drive and the crown block was now complete and everything was ready for the drive to be put to work.
(a) Placement of the GT001 wire encoder with the wire running in the groove in the roller alongside the rack
(b) Crown block bracket, swivel head adapter, WT001 force sensor, encoder wire and rack
Figure 6.10: Components that link the top of the scaled CMC with the freely moving crown block
Atle Aalerud and Tomas Klevmo Implementation of Active Control Design for Crown Mounted Compensator to Improve Drilling Performance
65
CHAPTER 6. SYSTEM IMPLEMENTATION The air and fluid system had to be configured to measure the two pressures. The pipes on top of the accumulator originally featured a tee section. In order to accommodate the pressure sensor, a cross was desired. The cross and the PT001 pressure sensor are shown in Figure 6.11a along with the necessary fittings. All the fittings between the pipes and the accumulator had to be replaced as part of this process.
(a) The PT001 pressure sensor placed on top of the accumulator
(b) The PT002 pressure sensor placed under the Olmstead valve
Figure 6.11: The air and fluid pressure sensors The hydraulic fittings were delivered by Parker Legris except the equal cross which was delivered by GS-Hydro as it was not currently available at Parker. This cross was a crucial part of the hydraulic adaption as this component would yield an extra port where the pressure transmitter could be connected. To connect directly to the existing piping, an equal cross of a bite type for 16 mm pipe and M24x1.5 threads was chosen. As this will not fit directly on the accumulator or to the pressure transmitter, stainless steel adaptors using British Standard Pipe Parallel (BSPP) threads were used for the rest of the fittings. At the bottom of the cross there is an adapter from M24 to G1/2. This is connected to the reducer, G1 to G1/2, mounted in the accumulator. At the top of the cross there are several adaptors. As the pressure transmitters were ordered with G1/2 threads it was necessary to use an adapter from the cross to G1/2. As this was not available directly, it was further necessary to first convert to G1/4 and then add an increaser from G1/4 to G1/2. As the pressure transmitter was the connected to this increaser, sealing was provided by an O-ring gasket. On the fluid side of the system, it was decided to use the drain line in the Olmstead valve as a connection point for the PT002 pressure sensor as seen in Figure 6.11b. This port was already G1/4 and all that was needed was the increaser from G1/4 to G1/2 before connecting the pressure transmitter using an O-ring gasket as before.
66
Atle Aalerud and Tomas Klevmo Implementation of Active Control Design for Crown Mounted Compensator to Improve Drilling Performance
CHAPTER 6. SYSTEM IMPLEMENTATION
6.3
Electrical Wiring
Control Cabinet
D00/7 AI 8x14BIT
D00/8 POS-INPUT
D00/4 CP341 RS232C
Shielded Cable 18G1
Junction Box
D00/6 DO 16x
5G1
-JB001 2G1 + RS232
2x1
2x1
2x1
2x1
7x1
- PT001 Pressure (Air)
- PT002 Pressure (Fluid)
- WT001 Force (Rack)
- WT002 Force (Hook)
- WT003 Force (WOB)
- GT001 Wire Encoder
MRU
2x1
APV Relay Cabinet
Figure 6.12: Single-line diagram of the instrumentation wiring for the scaled CMC As illustrated in the single-line diagram Figure 6.12, many cables had to be connected for the system to operate. In addition to internal wiring within the Control Cabinet and APV Relay Cabinet, cables had to be connected between the different locations of the equipment. To secure transmission of the analog signals with as little noise influence as possible, a cable with a braided shield was used between the Control Cabinet and the Junction Box. This is the same cable type as NOV uses for this type of instrumentation offshore. The shield of this cable can be seen to the right in the picture in Figure 6.13b. Within the Control Cabinet, the entire PLC rack was changed. Thus, all wiring from the PLC components had to be rewired and supplemented with the new equipment. This cabinet is shown in Figure 5.2, and it is possible to see a new rail-mounted terminal block at the left side of the photo. This was installed between the PLC and the external cables to simplify the testing and troubleshooting process. Moreover, the APV Control Cabinet contained two relays, one to activate the air filling valve and the other to activate the drain valve. By rewiring the cabinet and installing a terminal block, it was possible to control the air filling and draining from the PLC in addition to manual switches on the APV Control Cabinet. Thus, it was also possible to control the air pressure from the HMI using a computer.
Atle Aalerud and Tomas Klevmo Implementation of Active Control Design for Crown Mounted Compensator to Improve Drilling Performance
67
CHAPTER 6. SYSTEM IMPLEMENTATION As shown in Figure 6.13a, the ladders intended for humans on the full scale CMC included on the scaled CMC. These ladders were used to insure that the cables were well protected and securely attached using cable ties so they would not move during the heave motion. The PT001 pressure transmitter can be seen at the top right of the mentioned figure with its signal cable running down the ladder. The green and orange cables in the ladder are for the encoder and power supply of the electric drive.
(a) As the ladders intended for climbing on the real CMC are also built to scale, they are perfect for securing cables
(b) The opened junction box -JB001 revealing the terminal block inside
Figure 6.13: The junction box -JB001 used to connect measuring instruments is placed near the top of the scaled CMC
68
Atle Aalerud and Tomas Klevmo Implementation of Active Control Design for Crown Mounted Compensator to Improve Drilling Performance
CHAPTER 6. SYSTEM IMPLEMENTATION
6.4
Programming the PLC
The Siemens PLC system is programmed using the software SIMATIC Step 7 where several programming languages, and combinations of these, can be used for coding. This includes the languages described by the open standard IEC 61131-3. The most commonly used are Function block diagram (FBD) and Structured text (ST). [41] The code is combined within blocks, and although it would be possible to program most of a complete program using only one block, it is common to reuse code in a structured manner where each block has a specific function. The organization block (OB) is the block type that forms the interface between the operative system and the user program. They are numbered by their function where OB1 is run as fast as possible, while others are e.g. interrupt or event controlled. A function (FC) is the block that typically will contain parts of a program. The function will read data from inputs, execute its program sequence and write data to outputs. The FC has no data storage space assigned by default. Thus all calculation within the block is erased between each cycle. If storage is needed, the function block (FB) should be used. This block has the same properties as the FC, but is attached to a storage area. Hence, the FB should be used if data needs to be stored from one cycle to the next. Assigning storage space is done within a data block (DB). There are two kinds of data blocks, the global DBs, where all OBs, FBs and FCs can read or write data, and instance DBs, which are assigned to a certain FB. Figure 6.14 illustrates the PLC block hierarchy. As shown, it is possible to nest block types. This is common programming practice to achieve a user friendly code. [41] The authors recommend that the reader further investigate the concept of programming blocks in SIMATIC if needed. The remainder of this chapter is written assuming that the reader has prior knowledge about programming in SIMATIC Step 7.
Figure 6.14: Program blocks in Siemens Simatic S7 [41]
Atle Aalerud and Tomas Klevmo Implementation of Active Control Design for Crown Mounted Compensator to Improve Drilling Performance
69
CHAPTER 6. SYSTEM IMPLEMENTATION The software used on the PLC was based on the “Testbench2” winch software [38]. This software comprises functionality such as position control, constant tension (CT) and active heave compensation (AHC). It is made for winching equipment and consequently a lot of adaptations had to be made. The winch software was programmed to enable a holding break on the drive after five seconds of holding the torque. For a winch it this is reasonable to do this to save energy. This function, called break at standstill, would not be safe using the scaled CMC. If this motor break was to be enabled while the Stewart platform was moving, something would have to break. The motor would lock the position of the rack and pinion which in turn was bolted to the floor via the drill string. If the model is to be used on a permanent basis, the authors strongly recommend to physically remove this break from the drive unit. For testing in this project, the break at standstill was disabled in the drive software and in the PLC software. Furthermore, the five second limit for holding the torque was removed. Some of the other crucial changes were inhibiting the MRU simulator and connecting the real MRU by adding a network for MRU data interface. Tension calculations were suspended as the torque was to be used directly for control. Winch length calculation was inverted by switching “wire winch” and “wire payout” due to the rack and pinion configuration. New winch drum dimensions were entered in DB411 to simulate the rack and pinion gear. The drive system has the possibility of compensating for its own friction internally but a correction was already present in the PLC code. It was decided to keep this correction. Correction of constant tension (CT) setpoint due to gear friction is done by simply adding a torque dependent on the velocity of the motor. This friction torque is calculated by a lookup table using the absolute speed of the motor as input. Depending on the direction of the motor, the friction is added or subtracted. Between - 5 and +5 RPM the friction is set to zero. Figure 6.15 shows the added friction before tuning, after tuning and recorded data from the scaled CMC. The tuning was done by using the Matlab curvefitting tool on the upper part of the measured data. This yielded the equation Tm (θ˙ [rpm]) = 3.615 × 10⁻¹² θ˙3 − 1.972 × 10⁻⁸ θ˙2 + 4.704 × 10⁻⁵ θ˙ + 0.08957
[Nm]
(6.1)
which was used to calculate the lookup points that was entered into the lookup table in the PLC.
70
Atle Aalerud and Tomas Klevmo Implementation of Active Control Design for Crown Mounted Compensator to Improve Drilling Performance
CHAPTER 6. SYSTEM IMPLEMENTATION
Friction torque [Nm]
0.2
0.1
0
−0.1
−0.2 −4
−2 0 2 Drive speed [1000 rpm] Real
Old
4
New
Figure 6.15: The friction curve of the electric drive After some testing it was discovered that the gear friction is not consistent and will change according to running conditions. Since the model of the gear friction is static, this will affect the feed forward control accuracy. This is especially noticeable when the motor runs in CT follow mode where the aim is to minimize the drive system impact on the passive system i.e. get the rack actuating force as close to zero as possible. As the gear is moving over a period of time, the friction may actually change by more than 50 N in each direction which equates to 0.025 Nm seen from the drive. The shape of the friction curve shown in Figure 6.15 seems to be unchanged except the offset from 0 Nm. As this is a change that happens slowly, the authors have tuned this offset manually by adding an extra direction dependent constant friction torque. However, it would be recommended to create a feedback control loop using the rack force sensor to compensate for variable friction as a more permanent solution. The flowchart in Figure 6.16 on the next page illustrates the program flow within OB34 where most of the new PLC program was placed. All program blocks in blue are new for this project. Blocks numbered in the 3000 - range are made by the authors, while the others are adopted from the NOV standard library. OB34 is an organization block which is run at 2 ms interrupt. It was discovered at a point late in the project that no significant control improvement was observed by running this interrupt at 2 ms compared to 10 ms. Nevertheless, all documented results have been documented with OB34 run at 2 ms. The only block within OB34 is the Fast Cycle function, FC3. Within this function, the measurement function block, FB3001, and the CMC Control function block, FB3003, were run sequentially. FB3001 was programmed by combining standard blocks to acquire and estimate sensor data. FB3003 contains blocks used for control. This includes a new block for feed forward control. Furthermore, it includes the feed back control FB3041, which is a renamed PID controller from the Siemens standard library. Finally, some logic is added to enable toggling and tuning from the HMI panel. The blocks FB3001, FB3002 and FB3003 has been exported and can be viewed in appendix D.
Atle Aalerud and Tomas Klevmo Implementation of Active Control Design for Crown Mounted Compensator to Improve Drilling Performance
71
CHAPTER 6. SYSTEM IMPLEMENTATION
FC3 Fast_Cycle
FB3001 Measurements
FB3001
FB715 GW1 Winch regulator functions
FB3003 CMC Control
FB1000 Plc-Log
FB3003
FB70/FB532 MRU Data + filter
FB3002 LUGRE Friction force FF
FB83 Wire Encoder
FB3041 FB Control
FB395 Wire Speed
Inhibit FF/FB
FB51 Analog Inputs x5
Output Torque Setpooint
Figure 6.16: Content of the interrupt application OB34 which was run at 2 ms interrupt The Siemens drive, which is described in detail in Chapter 5, has a very fast response. This is in comparison to traditional hydraulic systems which may have transport delays in long pipes as discussed in Subchapter 2.3. Hence, it should be possible to achieve better feedback control using the drive instead of a hydraulic system. Due to the nature of discrete systems which are sampled and controlled at a given sample rate, Ts , the control signal is inevitably time delayed approximately Ts /2. This influences the stability of the control loop. Applying control parameters from a continuous PID controller will reduce the stability of the system. But as a rule of thumb, the stability reduction is small and tolerable if the time delay is less than one tenth of the response time, Tr , of the system as it would have been with a continuous-time controller, or a controller having a very small sampling time. This means that the following equations should be satisfied: [23]
Ts Tr ≤ 2 10
(6.2)
Tr . 5
(6.3)
which yields Ts ≤
72
Atle Aalerud and Tomas Klevmo Implementation of Active Control Design for Crown Mounted Compensator to Improve Drilling Performance
CHAPTER 6. SYSTEM IMPLEMENTATION As the fastest observed rise time, Tr , is approximately 50 ms and the control system is run with a sampling frequency of 2 ms, there should be no noticeable time delay. Nevertheless, the PLC was tuned using the real system instead of using the simulated parameters directly. The PLC control loop changes the setpoint of the drive torque control very fast. Thus, the internal drive torque control must be even faster. Figure 6.17 shows some of the internal control system in the Siemens drive control unit where Figure 6.17c shows the internal torque loop. It should be noticed that this internal loop is run with a cycle time of 125 µs. This equals 8000 Hz, which is 16 times faster than the control of the PLC at 500 Hz. This satisfies the requirement of cascaded controllers where the inner loop must be significantly faster than the outer loop. Since the internal torque loop of the drive system operated at such high speed, this part of the control could be entirely disregarded when the control system was designed.
Atle Aalerud and Tomas Klevmo Implementation of Active Control Design for Crown Mounted Compensator to Improve Drilling Performance
73
CHAPTER 6. SYSTEM IMPLEMENTATION
(a) The drive system outer position control which was disabled in this project
(b) The additional torque 2 input was used for controlling the drive directly. Additional torque 3 was available for internal friction torque, but this was solved using the PLC
(c) Internal torque/current loop run with internal PI-controller at 125 µs
Figure 6.17: The most important parts of the internal Siemens S7T drive control system. The position and velocity controls were disabled as the control was run directly by controlling the setpoint of the internal torque loop 74
Atle Aalerud and Tomas Klevmo Implementation of Active Control Design for Crown Mounted Compensator to Improve Drilling Performance
CHAPTER 6. SYSTEM IMPLEMENTATION As it will be further described in Subchapter 7.2, the frequencies that needed control were only around 10 Hz. Although the control was sufficiently fast, it was still difficult to increase the gain of the feed back control without loosing stability. It appeared that the high control frequency of the PLC also amplified high frequencies within the system which created instability. Thus, a filter was implemented to attenuate the high frequencies. The solution was a Chebyshev filter block. The Chebyshev block was developed in SCL code by Kjell Løvås at NOV. Coefficients are calculated in an excel spreadsheet that he has made and put into the PLC-block. The parameters are cutoff frequency as a percentage of the sampling frequency, the number of poles and percent ripple. As described in Chapter 7 system frequencies exists around 9 Hz. It was therefore preferable to remove frequencies with a cutoff frequency of 5 Hz. It is calculated as a percentage of the sampling frequency and it was decided that the filter should be run on a 20 ms interrupt. 5 Hz is 10 % of the sample frequency, which is as low as you should go for this type of filter. The filter response with 2 poles, 1 % ripple and a cutoff frequency of 5 Hz is shown in Figure 6.18.
0.0084
−10
−0.4597
−20
−0.9279
−30
−1.396
−40
−1.8642
−50
−2.3323
−60
−2.8004
−70
Phase [rad]
Magnitude [dB]
0
−3.2686 0
5
10 15 Frequency [Hz]
20 Magnitude
Phase
Figure 6.18: Magnitude Response [dB] and Phase Response of Chebyshev filter Adding the filter means that the controller will only receive updated process values every 20 ms. The result of this will be that the P gain will remain stable throughout the 20 ms and you could therefore be tempted to think that it would be equivalent to running the controller at 20 ms also. This is not the case, as the integrator will wind up according to the rate the controller is run. Figure 6.19 illustrates the effects of the integrator when running the controller at both 10 ms and 2 ms interrupts. The effect of the different rates is that the integrator time needs to be tuned for a specific interrupt rate. An integrator tuned at 2 ms rather than 10 ms will inject more power into the system as illustrated by the shaded area in blue. The obvious alternative is to run the controller at the same interrupt as the filter. It was decided that the controller should stay where it is because simply tuning the integrator was less time consuming than moving the controller. No other plots have been created using filtered data.
Atle Aalerud and Tomas Klevmo Implementation of Active Control Design for Crown Mounted Compensator to Improve Drilling Performance
75
CHAPTER 6. SYSTEM IMPLEMENTATION
SP e PV
I
P
10 ms
20 ms
30 ms
Figure 6.19: The effect of different scan rates when using a Chebyshev filter inside the control loop
2.4
0.3
2.2
0.2
2
0.1
1.8
0
1.6
−0.1
1.4
−0.2
175
180 Heave
185 Time [s] Unfiltered
Chebyshev filtered
Figure 6.20: Filtered hookload
76
Atle Aalerud and Tomas Klevmo Implementation of Active Control Design for Crown Mounted Compensator to Improve Drilling Performance
190
Heave [m]
Hook load [kN]
Adding the filter meant that the controller could have a higher gain on the feedback. However, sampling with a rate of only 20 ms brings the controller dangerously close to violating equation (6.3). The amplitude spectrum shown in Figure 7.6 on page 86 shows that the passive system does have frequencies in the 20 Hz range, but the dominant frequencies are in the 10 Hz range. The controller with a 20 ms sample rate should be fast enough to attenuate the frequencies in the 10 Hz range but too slow for the 20 Hz range. This appears to be the case upon closer inspection of Figure 7.6. The filter introduces a delay that is visible in Figure 6.20. It appears that this approach balances between instability due to system noise on the one hand and instability due to signal delay on the other hand.
CHAPTER 6. SYSTEM IMPLEMENTATION The control system was implemented in the Siemens PLC. It is not very intuitive monitoring the DB’s of a PLC. Hence a Human Machine Interface (HMI) to visualise the system is needed. The WinCC flexible Engineering Software can be used to configure SIMATIC operator devices from small Micro Panels to powerful Multi Panels as well as PC-based HMI with WinCC flexible Runtime SW. For the current project, the original test winch HMI software was used as a base to quickly get an overview of the many drive system features such as alarms, temperature monitoring and safety features. The display, which is shown in Figure 6.21, was the most used of the implemented displays. It was modified to show additional information relevant to the scaled CMC.
Figure 6.21: Screenshot of the most used HMI display. The menu was originally made for winch software, but has been modified to display additional information. The new parts are the center and right column It would be desirable to visualize the current friction by creating a x-y-trend view of the friction using the cylinder velocity and the hookload. This kind of trending is not supported by WinCC flexible, but it is possible with WinCC(TIA Portal) V11. Such trending will probably become a possibility in future inplementations. Trending the hookload versus time would be possible, but this was considered less important as PLClog was used for all time dependent logging. [42]
Atle Aalerud and Tomas Klevmo Implementation of Active Control Design for Crown Mounted Compensator to Improve Drilling Performance
77
CHAPTER 6. SYSTEM IMPLEMENTATION
78
Atle Aalerud and Tomas Klevmo Implementation of Active Control Design for Crown Mounted Compensator to Improve Drilling Performance
CHAPTER 7. TESTING AND VERIFICATION
Chapter 7
Testing and Verification 7.1
Test Setup
As shown in Figure 7.1 a control desk was placed in front of the Stewart platform. From this desk it is possible to reach both the emergency stop button for the Stewart platform and the emergency stop button for the drive system which can be seen in the left most corner of the desk. If the stop button for the Stewart platform is pressed, all motion of the platform would halt instantaneously.
Figure 7.1: The test setup comprising a computer, control cabinet, Stewart platform and the scaled CMC
Atle Aalerud and Tomas Klevmo Implementation of Active Control Design for Crown Mounted Compensator to Improve Drilling Performance
79
CHAPTER 7. TESTING AND VERIFICATION Conversely, if the button of the drive system is pressed, all motor torque would be discontinued, but the motor locking break would not be enabled. This “safety” feature has been deactivated within the drive system since the application of the brake would have catastrophic consequences. The control cabinet and the computer with the HMI-interface is also within reach. It was easy to control the drive with the right hand while keeping the left hand on the emergency stop of the drive. This was especially effective while tuning the gain of the control system and testing the effect of instability. Although it was never necessary to use the emergency stop of the Stewart platform, it is comforting to have it close at hand. The dedicated control computer for the Stewart platform is unfortunately placed out of direct reach and is not seen in Figure 7.1. Hence, starting, stopping or changing the wave pattern requires leaving the control desk. This resulted in the need for two people when logging data. For future use, the thesis authors recommend that equipment placed on the platform is controlled from the same place as the Stewart platform is controlled. This would require just one person to operate the system. Experiments were executed in a structured manner to ensure that variations in behavior could be identified. The platform was run using different wave patterns as described in Subchapter 2.2, different pressures and different parts of the control system active. The first structured passive test sequence was run the 3rd of April. These recordings were used for model adaption and verification. When the control system was developed and implemented, a full structured test was run the 3rd of May. In this way, changes over time could also be documented. To capture and store the test results, the proprietary NOV software PLC Log v.3.2 was used. This software contacts the PLC using TCP/IP and reads values stored in the PLC DB’s. The values can be plotted and stored in a log file. Because there were many parameters to log from several different DB’s, the tool Fast Log Creator [36] was used to generate the PLC Log file and source directly so all data could be extracted from only one DB. By using this tool it was possible to log data at approximately 15 ms intervals. To analyze rigid systems which may contain high frequencies, it may be necessary to sample with a higher sample rate. To achieve this, data must be buffered within the PLC itself and therefore requires a different approach.
80
Atle Aalerud and Tomas Klevmo Implementation of Active Control Design for Crown Mounted Compensator to Improve Drilling Performance
CHAPTER 7. TESTING AND VERIFICATION
7.2
Performance
To achieve good performance in a controlled system, it is necessary to have good measurements. The pressure transmitters and load cells were calibrated using known references. Even though the MRU and wire encoder were calibrated, it was interesting to verify the accuracy of especially the MRU. This position measurement was a vital part of the control system. Figure 7.2 shows how the actual measurements of the wire encoder and MRU and how they were able to follow the combined wave 3 described in equation (2.5) on page 10. Ocean waves are rather predictable as they will not make sudden changes. This specific MRU is able to predict its heave rather accurately without delay due to the use of an internal Kalman filter. The largest errors can be observed when the wave has a change in direction and the estimator tends to overshoot. 0.3
Heave [m]
0.2 0.1 0 −0.1 −0.2
0
50
100 Input wave
150 200 Time [s] Wire encoder
250
300
MRU
Figure 7.2: The input heave signal, wave 3, and heave position measurements. The wire encoder measures the signal perfectly while the MRU has a small overshoot (The encoder signal is offset and inverted for comparison) Accuracy of the measurements was validated using the root mean square (RMS) of the measurements compared to the input wave. The MRU had an RMS error value of 15.2 mm, and the wire encoder had an RMS error value of 0.54 mm. The repeatability of this encoder system was estimated in equation (5.6) to be 5.37 mm. The resulting RMS was very good and it was deemed unlikely that measurement errors would cancel each other out. An example would be if the platform had an undershoot at the same time the wire encoder had an overshoot. This result implies that the crown block remained very stationary, which makes sense as it was bolted to the floor. Furthermore, the Stewart platform was with the use of this test verified to be very precise and the wire encoder system must have had better repeatability than estimated. The accuracy of the MRU was described in Subchapter 5.5 to be whichever is highest of 5 % and 5 cm. The MRU measured a maximum of 0.271 m for the applied wave, this would yield an accuracy of 50mm. Thus, the MRU has showed a much better performance than promised with the RMS error value of 15.2 mm. Since the error for this small wave was close to the 5 % range, it can be assumed that the error would be significantly less than 5 % for larger waves.
Atle Aalerud and Tomas Klevmo Implementation of Active Control Design for Crown Mounted Compensator to Improve Drilling Performance
81
CHAPTER 7. TESTING AND VERIFICATION
2.6
0.4
2.4
0.3
2.2
0.2
2
0.1
1.8
0
1.6
−0.1
1.4
−0.2
1.2
−0.3
50
60
70
80 Heave
90
100 110 Time [s] 3rd of April
120
130
140
Heave [m]
Hook load [kN]
While the performance of the measuring equipment was tested, it was possible to record data for modeling and control. The initial measurements used to create the simulation models of the system were recorded the 3rd of April, 2013. On this date the system was lubricated, but had not been run for several days. It was documented with new recordings after one month of testing, that further lubrication and movement of the system had resulted in reduced friction. The force measured in the hookload is shown in Figure 7.3 where it can be seen that the static friction is reduced by approximately 200 N. Moreover, an important observation is that the sudden leap in force occurs at the same time of the heave motion as before. Consequently, the Lugre friction parameter describing the slip velocity was relatively unchanged.
150
3rd of May
Figure 7.3: Hookload of passive tests run at different times (The heave signal is an excerpt of wave 3 described by equation (2.5)) To achieve a good performance, it is necessary to tune the control system comprising the feed forward LuGre friction estimator and a PI-controller for feedback control, described in Subchapter 4.2 and illustrated in Figure 4.4 on page 40. When tuning the feed forward control, the parameters found in the parameter estimation was used as a starting point. But due to changes over time and inaccuracies in the model, the parameters had to be adjusted. By using PLC Log, it was possible to see the hookload and the calculated force from the LuGre friction estimator simultaneously without activating the control. Hence, the estimator was tuned to resemble the shape of the hookload before it was inverted and used for feed forward control. The feedback control was tuned using the good gain method described in Subchapter 4.2. The tuning of the feedback force control is more dependent on the stiffness of the drill string than if position feedback was used. It can be shown that as the length of a steel drill string is increased, the stiffness will be reduced. According to the thesis supervisor at NOV, a common problem is that the force feedback control easily becomes unstable due to this reduced stiffness.
82
Atle Aalerud and Tomas Klevmo Implementation of Active Control Design for Crown Mounted Compensator to Improve Drilling Performance
CHAPTER 7. TESTING AND VERIFICATION To verify this, two tests were conducted to compare the performance of feedback control using different drill string stiffness. Both experiments were conducted using the same pressure of 6 bar and heave described by wave 2 in equation (2.4). The first experiment was carried out using the steel rod as the drill string, while the second experiment used a soft rubber hose, which was slightly fiber enforced. By testing elongation at different pressures it was estimated that assembled wires and the drill string had a spring stiffness of roughly 1.3 × 10⁶ N/m using the steel rod and 8 × 10⁴ N/m using the rubber hose. The two scenarios were chosen to simulate two extreme situations. The first emulates a short drill string on a hard rock formation while the second emulates a long drill string on a soft rock formation. These scenarios may not be accurate, but they should give an idea of the control properties. Figure 7.4 illustrates one period of the results from these experiments. SP is the set value for the feedback control, Fh is the hookload and Fa is the actuation force. The steel test was run with the controller using P = 0.4 and T I = 100 ms. But for the rubber test, the gain had to be reduced to P = 0.05 to maintain stability. This clearly verifies that the gain must be reduced as the drill string spring stiffness is reduced if the force is to be used for feedback control. 2.5
Force [kN]
2 1.5 1 0.5 0 −0.5 0
2 SP
4 Fh Steel
6 Time [s] Fh Rubber
8
10 Fa Steel
12 Fa Rubber
Figure 7.4: Steel drill string compared to rubber drill string using feed back control (Data was recorded the 3rd of May, 2013) The experiments discussed above were repeated using the LuGre friction feed forward control and then the combined feed forward and feedback control. One period of the results from these tests is plotted in Figure 7.5.
Atle Aalerud and Tomas Klevmo Implementation of Active Control Design for Crown Mounted Compensator to Improve Drilling Performance
83
CHAPTER 7. TESTING AND VERIFICATION
Force [kN]
2 1.5 1 0.5 0 −0.5 0
2 SP
4 Fh FF
6 Time [s] Fh FF+FB
8
10 Fa FF
12
Fa FF+FB
(a) Comparison of control using rubber drill string
2.5
Force [kN]
2 1.5 1 0.5 0 −0.5 0
2 SP
4 Fh FF
6 Time [s] Fh FF+FB
8
10 Fa FF
12
Fa FF+FB
(b) Comparison of control using steel drill string
Figure 7.5: Comparison of feed forward control and combined feed forward and back control using rubber and steel drill string (Data was recorded the 3rd of May, 2013) Evaluating the response of the rubber drill string, it can be seen in Figure 7.5a that the combined control only has marginally improved response compared to the feed forward control. The root mean square (RMS) of the combined control is 143 N while the feed forward has 155 N. The feedback control from Figure 7.4 had a RMS value of 305 N and the passive system had a RMS value of 403 N. Thus, the feedback has very little effect when the drill string has a low spring stiffness, but the LuGre friction feed forward clearly improves the hookload stability.
84
Atle Aalerud and Tomas Klevmo Implementation of Active Control Design for Crown Mounted Compensator to Improve Drilling Performance
CHAPTER 7. TESTING AND VERIFICATION The response of the steel drill string shown in Figure 7.5b implies something completely different. Looking at approximately the time 4 s and 9 s it is clear that the feedback is helpful for keeping the set value. However, the overshoot is slightly higher at the force leap. Thus, tuning the gain of this feedback should also be an evaluation of local fatigue versus stability of the weight on bit. Note that fatigue has not been the scope of this thesis. For this reason, the RMS is considered to be the best performance indicator. The RMS of the passive system for this experiment was 355 N while using feedback as shown in Figure 7.4 yielded 104 N RMS. The feed forward control yielded 99 N RMS and the RMS value of the combined control was 108 N. The results discussed above are summarized in Table 7.1 and it may be concluded that the feedback control performs well when the drill string stiffness is high. However, it has a very little effect due to the necessity of using very low gains as the drill string stiffness decreases. The controller parameters may be automatically adjusted according to the length of the drill string, thus optimizing the feedback controller. In this test setup the performance of the feedback controller was poor.
Rubber Steel
Passive
Feed back
Feed forward
Combined
403 N 355 N
305 N 104 N
155 N 99 N
143 N 108 N
Table 7.1: RMS for test using wave 2 and 6 bar pressure By using the data from the experiments above, the single-sided amplitude spectrum of the hookload was generated using the fast Fourier transform (FFT) in Matlab. The plots of this analysis are displayed in Figure 7.6. The rectangular window effect caused a lot of spectral leakage noise in the plots. A Hanning window has therefore been applied.
Atle Aalerud and Tomas Klevmo Implementation of Active Control Design for Crown Mounted Compensator to Improve Drilling Performance
85
|Y(f)| [dB]
CHAPTER 7. TESTING AND VERIFICATION
40 20 0 −20 0
5
10
15 Frequency [Hz]
20
25
20
25
20
25
20
25
|Y(f)| [dB]
(a) Steel drill string, in follow mode, 6 bar and wave 2
40 20 0 −20 0
5
10
15 Frequency [Hz]
|Y(f)| [dB]
(b) Steel drill string, control mode, 6 bar and wave 2
40 20 0 −20 0
5
10
15 Frequency [Hz]
|Y(f)| [dB]
(c) Rubber drill string, follow mode, 6 bar and wave 2
40 20 0 −20 0
5
10
15 Frequency [Hz]
(d) Rubber drill string, control mode, 6 bar and wave 2
Figure 7.6: Single-Sided Amplitude Spectrum of y(t) (Data was recorded the 3rd of May, 2013) The first of the spectrums, Figure 7.6a, shows the system when using the steel drill string and compensating in passive mode. It can be observed that it has some dominating frequencies in the 9 Hz region in addition to the applied heave at 0.08 Hz which has several dominating harmonics in the 0 - 5 Hz region. To control such a system, the controller should run at 100 Hz or more. The next spectrum, Figure 7.6b, reflects the same system using the combined feed forward and feedback control. However, it can be seen that the wave harmonics are not dominating. Further, there are new frequencies introduced in the 3 - 4 Hz region. These frequencies may be caused by the active control system. 86
Atle Aalerud and Tomas Klevmo Implementation of Active Control Design for Crown Mounted Compensator to Improve Drilling Performance
CHAPTER 7. TESTING AND VERIFICATION
The third spectrum, Figure 7.6c, reveals that the passive system is changed when rubber drill string is used. The dominating frequencies has moved from the 9 Hz region to around 3 Hz. Observing the final spectrum, Figure 7.6d, it appears that the frequency of the control is placed in the same region as the passive system. This is most likely the reason why the performance of the feedback is very reduced. The two passive frequencies can also be observed as oscillations in Figure 7.4. The system had been tested using different drill string stiffness, but it should also be tested using different waves and pressures. A collection of experiments was run using the three wave types described in equations (2.3) to (2.5) on page 9 and on page 10. Further, 6 and 7 bar pressure was used and passive and active compensation. The active compensation comprised feed forward, feedback and combined control. In Figure 7.7 the hookload and actuating force are displayed for the test using 6 bar pressure, the combined control and wave 3 which is the most realistic scenario. Secondly in Figure 7.7, is the Simulink simulation of the same scenario as described above. This simulation was described in Subchapter 4.2 on page 37 and uses the SimulationX model. The model was created based on the data recorded on the 3rd of April and it can be observed in Figure 7.7c, that a larger actuating force is required by the controller. The simulated hookload yields a much better result. Nevertheless, the model inhabits all the important features of the scaled CMC. The effect of static friction, viscous friction and the “stop and go” effect at 183 s are all similar to the scaled CMC. The performance of the passive CMC, as the system was run using 6 bar pressure and wave 3, is shown in Figure 7.3. This test yielded 319 N RMS variation from the average hookload. The typical fluctuations were between 1500 - 2300 N. The maximum peak was 2396 N and the minimum was 1100 N. The active control results visualized in Figure 7.7 has a hookload variation of 98 N RMS where 1800 N is the set operation point. The remaining pulses have a maximum at 2637 N and a minimum at 1040 N. The RMS values of the mentioned experiments are summarized in Table 7.2 for the passive and active case.
Passive compensation Active control
wave 1
6 bar wave 2
wave 3
wave 1
7 bar wave 2
wave 3
283 N 84 N
355 N 108 N
319 N 98 N
285 N 106 N
348 N 111 N
328 N 85 N
Table 7.2: RMS for passive compensation and active control using different waves and pressures
Although the pulses in the hookload look scary considering local fatigue, they do not contain very much power as they are very short in duration. Further, the actual drill string contains much more damping effects than the test setup. This is caused by several friction elements such as the mud within the drill string. For this reason, it may be assumed that the short pulses will be filtered by the drill string. Thus, it does not affect the actual WOB significantly. This is in contrast to the passive compensation where the filtered hookload probably would resemble the ocean wave.
Atle Aalerud and Tomas Klevmo Implementation of Active Control Design for Crown Mounted Compensator to Improve Drilling Performance
87
CHAPTER 7. TESTING AND VERIFICATION
Heave
0.2 0 −0.2 160
165
170
175
180
185 Time [s]
190
195
200
205
210
190
195
200
205
210
200
205
210
(a)
Hook load [kN]
2.5
2
1.5
1 160
165
170
175
180
185 Time [s] Logged data
Simulation
(b)
Actuating force [kN]
0.6 0.4 0.2 0 −0.2 −0.4 −0.6 −0.8 160
165
170
175
180
185 Time [s] Logged data
190
195
Simulation
(c)
Figure 7.7: Simulation and physical recordings of the hookload and actuating force for a portion of wave 3 (Data recorded the 3rd of May, 2013.)
88
Atle Aalerud and Tomas Klevmo Implementation of Active Control Design for Crown Mounted Compensator to Improve Drilling Performance
CHAPTER 7. TESTING AND VERIFICATION
7.3
Implications
The tests have revealed that some of the parameters of the model might change over time. This poses a challenge to the designer of the control system and the person in charge of maintaining it. A control system that estimates its own parameters would be very beneficial in this case. A MPC system with this capability could be implemented to solve this problem and many others at the same time. For this application, it is difficult to know what type of benchmark that should be applied to measure the performance of the system. This thesis has focused on stabilizing hookload and a low pass filter effect is assumed to attenuate rapid changes before they reach the drill bit. The operator does not presently have real time information about WOB and this might create an artificially high focus on a stable hookload. With real-time monitoring of WOB or an accurate drill string model to predict it, the operator could be convinced that some variations in the hookload are acceptable. It might even be possible to let it vary in a controlled manner to compensate for downhole irregularities. The LuGre friction estimator appears to have yielded the most significant improvement to the implemented control system. This estimator should also be applicable to the full scale CMC as it is easily tuned. Further, it may be used to improve control of other machines where stiction is of concern. The main priority when improving on the tested system should be to implement a variable feedback gain that changes depending on the drill string stiffness. This would ensure that the system will not become unstable as the drill string length increases. This would require a model of the drill string with a spring stiffness that depends on its length. As the precision of the MRU is crucial for the feed forward control, it can be assumed that this control will work even better for the full scale CMC as the MRU will have significantly less error for larger waves. The use of the MRU velocity values was decided based on the desire to use the same type of sensors as in real life. For the purpose of estimating cylinder friction, however, the choice should maybe have been a derivative of the wire encoder signal. The MRU has the largest inaccuracy around zero velocity and the performance might therefore benefit from the proposed change. Nevertheless, the tests have showed a system that performs well and the goals of the project have been met. Many simplifications have been necessary in order to finish on time, but the fact that it all works together is a very good result.
Atle Aalerud and Tomas Klevmo Implementation of Active Control Design for Crown Mounted Compensator to Improve Drilling Performance
89
CHAPTER 7. TESTING AND VERIFICATION
90
Atle Aalerud and Tomas Klevmo Implementation of Active Control Design for Crown Mounted Compensator to Improve Drilling Performance
CHAPTER 8. CONCLUSION
Chapter 8
Conclusion The crown mounted compensator (CMC) functions as a large hydro-pneumatic spring designed to compensate for wave induced heave motion. This passive system performs very well on it’s own, but exhibits significant friction behavior. Static friction in the main cylinders is especially detrimental because the force in the hook has sudden changes. This in turn causes undesirable fluctuations in the weight exerted on the drill bit, leading to a reduced drilling performance. To aid in different control designs and also in understanding of the CMC system, nonlinear models have been developed that capture the force variation that results from the friction. The models have been adapted to the dimensions of a functioning 1:7 scale model of the CMC and parameters have been identified to yield model responses closely resembling that of the real system. In succession to the modeling, two control strategies have been designed and simulated. One employing a LuGre friction estimator in a feed forward loop and a filtered feedback from the hook load. The other strategy was to use one of the models to design a model predictive controller. Both systems have showed promising performance in simulation and one of them has been implemented in the physical system. The scaled CMC has been placed on a Stewart platform to simulate wave response. Subsequently, it has been fitted with the necessary sensors and an electric drive, rack and pinion for actuation. The necessary wiring has been installed and programming of the first control strategy has been implemented in a programmable logic controller by modifying and supplementing an existing drive control system. By implementing the LuGre based control system, the hook load variations were reduced from 320 N RMS to 100 N RMS. Most of this load variation was corrected by the feed forward control. Hence, the control system was only dependent on the feedback loop for setpoint tracking. This was especially useful when the drill string stiffness was decreased and feedback control tends to become unstable. This thesis has demonstrated that implementation of active heave compensation is feasible using an electric drive and a rack and pinion gear. The goals of the project has been met where a well functioning system with parts that are working together has been made. This could be considered a very good result.
Atle Aalerud and Tomas Klevmo Implementation of Active Control Design for Crown Mounted Compensator to Improve Drilling Performance
91
BIBLIOGRAPHY
Bibliography [1] “Metronic Systems homepage,” Metronic Systems. [Online]. Available: metronic.com.pl/uploads/images/catalog_src/pc-28_src_1.jpg
http://www.
[2] “SINUMERIK & SINAMICS Automation Systems for Machine Tools,” Siemens, 2007, Catalog NC 61. [Online]. Available: http://industria.siemens.com.mx/Motion%20Control/ Docs/Sinumerik%20&%20SINAMICS.pdf [3] “Measurement and Sensor Systems with conception - Rope Length Transmitter,” FSG Fernsteuergeraete, October 2011, data sheet. [4] “Technical Datasheet, Ex Heavy Duty Absolute AX 65 - SSI,” Hengstler, May 2011, data sheet. [Online]. Available: http://www.acumo.se/file/ datablad-preliminary-ax65-ssi-2011-05-18-09-45-57-en.pdf [5] Aplisens Technical Staff, User’s Manual Pressure Transmitters PCE-28 Differential Pressure Transmitters PRE-28 Hydrostatic Level Probes PCE-28P, F ed., Aplisens, February 2012. [Online]. Available: http://www.aplisens.com/produkty/pdf/DTR.PCE. PRE%28ENG%29.pdf [6] ——, “Pressure Transmitter PCE-28,” Aplisens, 2013, data sheet. [Online]. Available: http://www.aplisens.com/produkty/pdf/PCE-28.pdf [7] Atlanta Technical Staff, “Servo Drive System,” Atlanta, 2012, catalog. [8] P. T. Boggs and J. W. Tolle, “Sequential quadratic programming,” Acta numerica, vol. 4, no. 1, pp. 1–51, 1995. [9] E. F. Camacho and C. B. Alba, Model Predictive Control (Advanced Textbooks in Control and Signal Processing). Springer, 2007. [10] Certex Technical Staff, “Ståltau/wire tekniske data og tabeller,” Certex, product Catalogue. [Online]. Available: http://www.certex.dk/UserFiles/NO/Produktkatalog/Staltau.pdf [11] M. Choux, I. Tyapin, and G. Hovland, “Extended friction model of a hydraulic actuated system,” 2012 Proceedings Annual Reliability and Maintainability Symposium, pp. 1–6, Jan. 2012. [Online]. Available: http://ieeexplore.ieee.org/lpdocs/epic03/wrapper.htm? arnumber=6175517 [12] C. De Wit, H. Olsson, K. Astrom, and P. Lischinsky, “A new model for control of systems with friction,” Automatic Control, IEEE Transactions on, vol. 40, no. 3, pp. 419–425, 1995. [13] K. Do and J. Pan, “Nonlinear control of an active heave compensation system,” Ocean Engineering, vol. 35, no. 5-6, pp. 558–571, Apr. 2008. [Online]. Available: http://linkinghub.elsevier.com/retrieve/pii/S0029801807002508 92
Atle Aalerud and Tomas Klevmo Implementation of Active Control Design for Crown Mounted Compensator to Improve Drilling Performance
BIBLIOGRAPHY [14] J.-m. Godhavn, A. Pavlov, G.-o. Kaasa, and N. L. Rolland, “Drilling seeking automatic control solutions,” pp. 10 842–10 850, 2011. [15] P. Gu, A. A. Walid, Y. Iskandarani, and H. R. Karimi, “Modeling, simulation and design optimization of a hoisting rig active heave compensation system,” International Journal of Machine Learning and Cybernetics, Feb. 2012. [Online]. Available: http://www.springerlink.com/index/10.1007/s13042-012-0076-x [16] J. Haaø, S. Vangen, I. Tyapin, M. Choux, G. Hovland, and M. R. Hansen, “The Effect of Friction in Passive and Active Heave Compensation of Crown Block Mounted Compensators,” nt.ntnu.no, vol. 1, no. 1, pp. 316–320. [Online]. Available: http://www.ifac-papersonline.net/Detailed/52643.htmlhttp://www.nt.ntnu.no/ users/skoge/prost/proceedings/offshore-control-2012/papers/0040.pdf [17] M. R. Hansen and T. O. Andersen, Hydraulic Components and Systems. Agder, 2009. [18] D. H. Hanssen, Programmerbare Logiske Styringer.
University of
Tapir akademisk forlag, 2008.
[19] J. Hao, L. Yancong, Z. Yanting, L. Zhendong, and W. Guangbin, “Research on new drill string heave compensation system for floating drilling platform,” Proceedings of 2011 International Conference on Fluid Power and Mechatronics, pp. 791–795, Aug. 2011. [Online]. Available: http://ieeexplore.ieee.org/lpdocs/epic03/wrapper.htm? arnumber=6045869 [20] J. T. Hatleskog and M. W. Dunnigan, “An impedance approach to reduce the contact-instability whilst drilling with active heave compensation,” Ocean Engineering, vol. 49, pp. 25–32, Aug. 2012. [Online]. Available: http://linkinghub.elsevier.com/retrieve/ pii/S0029801812001321 [21] J. Hatleskog and M. Dunnigan, “Active Heave Crown Compensation Sub-System,” OCEANS 2007-Europe, pp. 1–6, 2007. [Online]. Available: http://ieeexplore.ieee.org/xpls/ abs_all.jsp?arnumber=4302215 [22] F. Haugen, “he Good Gain method for simple experimental tuning of PI controllers,” Modeling, Identification and Control: A Norwegian Research Bulletin, vol. 33, no. 4, pp. 141–151, 2012. [Online]. Available: http://www.mic-journal.no/ABS/MIC-2012-4-3.asp [23] ——, Advanced DYNAMICS and CONTROL. [24] F. . Haugen, Reguleringsteknikk.
TechTeach, August 2010.
Trondheim: Akademika forl., 2012.
[25] B. Houska, H. J. Ferreau, and M. Diehl, “Acado toolkit - an open-source framework for automatic control and dynamic optimization,” Optimal Control Applications and Methods, vol. 32, no. 3, pp. 298–312, 2011. [26] ——, “An auto-generated real-time iteration algorithm for nonlinear MPC in the microsecond range,” Automatica, vol. 47, no. 10, pp. 2279–2285, Oct. 2011. [Online]. Available: http://linkinghub.elsevier.com/retrieve/pii/S0005109811003918 [27] B. Houska, H. J. Ferreau et al., “Acado toolkit user’s manual,” Optimization in Engineering Center (OPTEC), vol. 1, 2009.
Atle Aalerud and Tomas Klevmo Implementation of Active Control Design for Crown Mounted Compensator to Improve Drilling Performance
93
BIBLIOGRAPHY [28] B. Huyck, H. J. Ferreau, M. Diehl, J. De Brabanter, J. F. M. Van Impe, B. De Moor, and F. Logist, “Towards Online Model Predictive Control on a Programmable Logic Controller: Practical Considerations,” Mathematical Problems in Engineering, vol. 2012, pp. 1–20, 2012. [Online]. Available: http://www.hindawi.com/journals/mpe/2012/912603/ [29] C. H. King and M. D. Pinckard, “Method of and System for Optimizing Rate of Penetration in Drilling Operations,” 2000. [30] Seatex MRU User’s Manual, 10th ed., Kongsberg Seatex AS, June 2006. [31] U. A. Korde, “Active heave compensation on drill-ships in irregular waves,” Ocean Engineering, vol. 25, no. 7, pp. 541 – 561, 1998. [Online]. Available: http://www.sciencedirect.com/science/article/pii/S0029801897000280 [32] MacDermid Technical Staff, “Erifon 818 series,” 2008, data sheet. [Online]. Available: http://offshore.macdermid.com/pdf/PDS_Erifon_818_Series/Original_English_ Erifon_818_Series_PDS.pdf [33] J. Maciejowski, Predictive Control with Constraints.
Prentice Hall, 2000.
[34] National Oilwell Varco, “Assembly Drawing CMC-E EQUALIZING SYSTEM,” internal document D1319-A0002 10.rev. [35] ——, “Maintenance Instructions, CMC-E & AHC, Main,” internal document V6605-Z-MA005 2.rev. [36] ——, “Technical Description - Tool, logfile and log FB,” internal document 74515653 3.rev. [37] ——, “Technical Description, CMC-E for Main Well incl HPU,” internal document V6605Z-SA-001 0.rev. [38] ——, “Testbench Software,” internal document 79974051. [39] H. Olsson, Control systems with friction. Department of Automatic Control, Lund Institute of Technology, 1996. [40] Siemens, “CAD Creator.” [Online]. Available: http://www.cad-creator.com/CADCreator/ VorNavigation.cfm?IdListVornavi=%280-1*906%29&CFID=3290436&CFTOKEN= 74485823&Scenario= [41] ——, “Simatic s7 tia-programming 2 st-pro2 course,” 2010, course Folder Version: 5.8. [42] Siemens Industry Automation and Drive Technologies - Expert, “Siemens Industry Technical Forum,” Siemens. [Online]. Available: http://www.automation.siemens.com/ WW/forum/guests/PostShow.aspx?PageIndex=1&PostID=325482&Language=en [43] S. Skogestad and I. Postlethwaite, Multivariable Feedback Control: ANALYSIS AND DESIGN, 2nd ed. Wiley, 2005. [44] Tecsis Technical Staff, “Tension/compression force transducers with thin-film sensor,” Tecsis, data sheet. [Online]. Available: http://www.tecsis.de/uploads/media/de941.pdf
94
Atle Aalerud and Tomas Klevmo Implementation of Active Control Design for Crown Mounted Compensator to Improve Drilling Performance
LIST OF FIGURES
List of Figures 2.1 2.2 2.3 2.4 2.5 2.6 2.7 2.8 2.9
The CERRADO drillship with a CMC from NOV . . . . . . . . . . . . . . . . . . 3 Principle of operation for the CMC air/fluid system . . . . . . . . . . . . . . . . 4 Overview of the crown mounted compensator . . . . . . . . . . . . . . . . . . . . 5 Detail view of the main parts of the crown mounted compensator . . . . . . . . . 5 The scaled CMC placed on the Stewart platform in the lab . . . . . . . . . . . . 7 Calculated and actual radii of the eccentric hubs . . . . . . . . . . . . . . . . . . 8 The equalizing cylinder stroke plotted as a function of the main cylinder stroke. The main cylinder operative area is at 500 ± 300 mm . . . . . . . . . . . . . . . . 9 The hookload resulting from the wave pattern described by equation (2.4) at 7 bar 10 Two types of hydraulic drives for the active sub-system as presented by J.T. Hatleskog and M.W. Dunnigan [21] . . . . . . . . . . . . . . . . . . . . . . . . . . 11
3.1 3.2 3.3 3.4 3.5 3.6
The simplified SimulationX model of the scaled CMC system . . . . . . . . . . . Simplifications applied to the implemented string geometry . . . . . . . . . . . . Illustration of the equalizing hub forces, radii and displacements [34] . . . . . . . Functions for describing the equalizing system . . . . . . . . . . . . . . . . . . . . The equalizing power on the two sides of the equalising hubs . . . . . . . . . . . Curves for the hookload with the equalizing system disabled at 6 and 7 bar (Data was recorded the 3rd of April, 2013) . . . . . . . . . . . . . . . . . . . . . . . . . 3.7 Curves for the hookload with the equalizing system disabled at 6 and 7 bar (Data was recorded the 3rd of April, 2013) . . . . . . . . . . . . . . . . . . . . . . . . . 3.8 The direction of hydraulic flow from port a to port b . . . . . . . . . . . . . . . . 3.9 The simple mathematical model . . . . . . . . . . . . . . . . . . . . . . . . . . . . 3.10 The differential equations implemented in Simulink . . . . . . . . . . . . . . . . . 3.11 Parameter estimation for the LuGre friction estimator . . . . . . . . . . . . . . . 3.12 Two simulation models and the scaled CMC subjected to the same wave at 6 bar (Data recorded the 3rd of April, 2013) . . . . . . . . . . . . . . . . . . . . . . . . 4.1 4.2 4.3 4.4 4.5 4.6 4.7 4.8
A typical cascaded control structure . . . . . . . . . . . . . . . . . . . . . . . . . Rig heave and different kinds of feed forward control to compensate variations in the hookload . . . . . . . . . . . . . . . . . . . . . . . . . . . . . . . . . . . . . . Comparison of Stribeck and LuGre friction model . . . . . . . . . . . . . . . . . . Traditional control with friction estimator . . . . . . . . . . . . . . . . . . . . . . The tuned control result for the hookload of the simulated system. The figure illustrates a test where the pressure was 7 bar and the set value for the controller was 2.6 kN . . . . . . . . . . . . . . . . . . . . . . . . . . . . . . . . . . . . . . . . Principle of MPC strategy [9] . . . . . . . . . . . . . . . . . . . . . . . . . . . . . The basic structure of an MPC controller [9, 33] . . . . . . . . . . . . . . . . . . . The Simulink system used to design the MPC controller. The MATLAB Function contains equations (3.50) to (3.56) that are continuously solved by the Simulink solver . . . . . . . . . . . . . . . . . . . . . . . . . . . . . . . . . . . . . . . . . .
Atle Aalerud and Tomas Klevmo Implementation of Active Control Design for Crown Mounted Compensator to Improve Drilling Performance
15 17 18 19 20 22 23 25 26 31 32 33 36 38 39 40 41 42 43 46 95
LIST OF FIGURES 4.9 The MPC controller controlling “itsel” . . . . . . . . . . 4.10 MPC controller and s-function from SimulationX . . . . 4.11 A plot of the simulation of the two control systems using at 7 bar . . . . . . . . . . . . . . . . . . . . . . . . . . .
47 47 48
5.1 5.2 5.3 5.4 5.5 5.6 5.7
Illustration of the instrumentation for the scaled CMC model . . . . The control cabinet containing the Siemens PLC and drive system . The Atlanta rack [2] . . . . . . . . . . . . . . . . . . . . . . . . . . . The Siemens Synchronous Servo Motor [40] . . . . . . . . . . . . . . The force transducers and pressure transmitters used in the project . Two different types of position sensing equipment . . . . . . . . . . . Default mounting position for the MRU (Seatex MRU User’s Manual, Seatex AS) [30] . . . . . . . . . . . . . . . . . . . . . . . . . . . . . .
. . . . . . . . . . . . . . . . . . . . . . . . . . . . . . . . . . . . . . . . . . Kongsberg . . . . . . .
50 52 53 54 55 56
6.1 6.2 6.3 6.4 6.5 6.6 6.7
The scaled CMC was lifted into the lab using an excavator . . . . . . . . . . . . . Placement and fastening of the scaled CMC . . . . . . . . . . . . . . . . . . . . . Connecting the scaled CMC to the floor . . . . . . . . . . . . . . . . . . . . . . . Two of the force sensors . . . . . . . . . . . . . . . . . . . . . . . . . . . . . . . . Placement and mounting of the MRU . . . . . . . . . . . . . . . . . . . . . . . . Solidworks model of component placement . . . . . . . . . . . . . . . . . . . . . . Solidworks model of rack and pinion assembly featuring a roller and sliding bearings for guiding the rack. The slot in the roller accommodates the encoder wire . The Siemens electric drive with gear box . . . . . . . . . . . . . . . . . . . . . . . Brackets for keeping the electric drive and rack connected . . . . . . . . . . . . . Components that link the top of the scaled CMC with the freely moving crown block . . . . . . . . . . . . . . . . . . . . . . . . . . . . . . . . . . . . . . . . . . . The air and fluid pressure sensors . . . . . . . . . . . . . . . . . . . . . . . . . . . Single-line diagram of the instrumentation wiring for the scaled CMC . . . . . . The junction box -JB001 used to connect measuring instruments is placed near the top of the scaled CMC . . . . . . . . . . . . . . . . . . . . . . . . . . . . . . . Program blocks in Siemens Simatic S7 [41] . . . . . . . . . . . . . . . . . . . . . . The friction curve of the electric drive . . . . . . . . . . . . . . . . . . . . . . . . Content of the interrupt application OB34 which was run at 2 ms interrupt . . . The most important parts of the internal Siemens S7T drive control system. The position and velocity controls were disabled as the control was run directly by controlling the setpoint of the internal torque loop . . . . . . . . . . . . . . . . . Magnitude Response [dB] and Phase Response of Chebyshev filter . . . . . . . . The effect of different scan rates when using a Chebyshev filter inside the control loop . . . . . . . . . . . . . . . . . . . . . . . . . . . . . . . . . . . . . . . . . . . Filtered hookload . . . . . . . . . . . . . . . . . . . . . . . . . . . . . . . . . . . . Screenshot of the most used HMI display. The menu was originally made for winch software, but has been modified to display additional information. The new parts are the center and right column . . . . . . . . . . . . . . . . . . . . . .
59 60 61 62 62 63
6.8 6.9 6.10 6.11 6.12 6.13 6.14 6.15 6.16 6.17 6.18 6.19 6.20 6.21
7.1 7.2 7.3
96
. . . . . . . . . . . . . . . . . . . . . . . . . . . . the SimulationX model . . . . . . . . . . . . . .
The test setup comprising a computer, control cabinet, Stewart platform and the scaled CMC . . . . . . . . . . . . . . . . . . . . . . . . . . . . . . . . . . . . . . . The input heave signal, wave 3, and heave position measurements. The wire encoder measures the signal perfectly while the MRU has a small overshoot (The encoder signal is offset and inverted for comparison) . . . . . . . . . . . . . . . . Hookload of passive tests run at different times (The heave signal is an excerpt of wave 3 described by equation (2.5)) . . . . . . . . . . . . . . . . . . . . . . . .
Atle Aalerud and Tomas Klevmo Implementation of Active Control Design for Crown Mounted Compensator to Improve Drilling Performance
57
63 64 64 65 66 67 68 69 71 72 74 75 76 76 77 79 81 82
LIST OF FIGURES 7.4 7.5 7.6 7.7
Steel drill string compared to rubber drill string using feed back control (Data was recorded the 3rd of May, 2013) . . . . . . . . . . . . . . . . . . . . . . . . . . Comparison of feed forward control and combined feed forward and back control using rubber and steel drill string (Data was recorded the 3rd of May, 2013) . . . Single-Sided Amplitude Spectrum of y(t) (Data was recorded the 3rd of May, 2013) Simulation and physical recordings of the hookload and actuating force for a portion of wave 3 (Data recorded the 3rd of May, 2013.) . . . . . . . . . . . . . .
Atle Aalerud and Tomas Klevmo Implementation of Active Control Design for Crown Mounted Compensator to Improve Drilling Performance
83 84 86 88
97
LIST OF TABLES
List of Tables 3.1 3.2
Pressure dependent Stribeck model parameters that were used in the SimulationX model with the equalizing system disconnected. . . . . . . . . . . . . . . . . . . . Pressure dependent Stribeck model parameters that were used in the SimulationX model with the equalizing system connected. . . . . . . . . . . . . . . . . . . . .
21 23
5.1
Features of the 1FT6 synchronous servo motor and two stage planetary gearbox. [2] 54
7.1 7.2
RMS for test using wave 2 and 6 bar pressure . . . . . . . . . . . . . . . . . . . . 85 RMS for passive compensation and active control using different waves and pressures 87
A.1 Abbreviations . . . . . . . . . . . . . . . . . . . . . . . . . . . . . . . . . . . . . . 101
98
Atle Aalerud and Tomas Klevmo Implementation of Active Control Design for Crown Mounted Compensator to Improve Drilling Performance
APPENDIX A. ABBREVIATIONS
Appendix A
Abbreviations
Atle Aalerud and Tomas Klevmo Implementation of Active Control Design for Crown Mounted Compensator to Improve Drilling Performance
99
Abbreviation
Full Description
AHC AHC APV CAD CT DB FB FC IPC MBS MRU NOV OB OPC PHC PLC ROP SSI UIA VFD WOB
Active heave compensation / compensator Active Heave Compensation Air pressure vessels Computer Aided Design Constant Tension Data Block Function Block Function Call Industrial PC Multi-Body System Motion Reference Unit National Oilwell Varco Organization Block OLE for process control Passive heave compensation Programmable Logic Controller Rate of Penetration Synchronous Serial Interface University of Agder Variable Frequency Drive Weight on Bit Table A.1: Abbreviations
Appendix B
SimulationX Model Report
1/17 3.4.404.34 SimulationX Diagram View:1
3D-View:2
CMCv04.ism
Aalerud, Atle
2/17 3.4.404.34 SimulationX 3D-View:3
3D-View:4
CMCv04.ism
Aalerud, Atle
3/17 3.4.404.34 SimulationX Global Parameters and Results Parameters Comment Initial air pressure (Absolute) Initial oil pressure (Gauge) Start Time Stop Time Terminate Simulation when Recording of results Gravity Acceleration Gravity Acceleration (3D) Atmosphere Pressure Atmosphere Temperature Active Tracing Active Recording of Results Simulation Run Number Simulation Run Name
Name pAPV p0 tStart tStop termCond protKind gravity gravity3D pAtm TAtm traceOn protOn iSim nSim
Current Value p0+pAtm 7.07 0 70 false At least after dtProtMin 9.80665 {0,0,-gravity} 1.01325 20 true true 891 "2"
Unit [Pa] [bar] [s] [s] [-] [m/s²] [m/s²] [bar] [°C] [-] [-] [-]
f(x) CAPvVolume Parameters Comment Function f(x)
Name F
Current Value Unit 0.048 [-]
Name F
Current Value Unit PlungerCylinder1.vPiston*Eq.Fi [m]
Name F
Current Value Unit -2*EqCyl1.vPiston*EqCyl1.Fcyl [m]
f(x) Pmain Parameters Comment Function f(x) f(x) Peq Parameters Comment Function f(x) Bipolar Force Interface Plunger2 Parameters Comment Reference Frame Displacement Reference Frame Displacement 3D Primitive Selection Length of Cylinder Radius of Cylinder Length of Piston Rod Radius of Piston Rod RGB Color Transparency
CMCv04.ism
Name frame1Ref x10 frame2Ref x20 visSelect lC rC lR rR color alpha
Current Value Predecessor Frame {0.2,0,0} Predecessor Frame {0.2,0,0} Hydraulic Cylinder 1270 35 1000 30 {1.000000,1.000000,0.000000} 1
Unit [m] [m] [mm] [mm] [mm] [mm] [-] [-]
Aalerud, Atle
4/17 3.4.404.34 SimulationX Internal Force and Torque Sensor HookLoad Parameters Comment Reference Frame Displacement Calculation of Orientation Sequence of Angles Rotation Angles RGB Color Transparency
Name frameRef x0 rotSelect psiSequence psi0 color alpha
Current Value Predecessor Frame {0,0,0} Sequence of Angles x-y-z (Cardan Angles) {180,0,0} {0.2,0.2,1} 1
Unit [m]
[deg] [-] [-]
Single Pass Switch singlePass2 Parameters Comment Threshold
Name th
Current Value Unit 0 [-]
Volume CAPVs Parameters Comment Volume Initial Pressure Initial Temperature Consider Heat Transfer
Name V p0 T0 condHeatFl
Current Value CAPvVolume.F pAPV (Fixed) TAtm (Fixed) No
Unit [m³] [Pa] [K]
Name m x0 v0
Current Value 4 0 (Fixed) 0 (Fixed)
Unit [kg] [m] [m/s]
Mass Piston Parameters Comment Mass Initial Displacement Initial Velocity f(x) cMC3 Parameters Comment Function f(x)
Name F
Current Value Unit - [-] sin(2*pi()*(1/600)*t)*(0.15*sin(2*pi()*0. 08*t)+0.1*sin(2*pi()*0.11*t))
Body Force Fact Parameters Comment Reference Frame Displacement Calculation of Orientation Sequence of Angles Rotation Angles Force Radius Length of Arrowhead Scale Factor RGB Color Transparency
CMCv04.ism
Name frameRef x0 rotSelect psiSequence psi0 F rd l scale color alpha
Current Value Predecessor Frame {0,0,0} Sequence of Angles x-y-z (Cardan Angles) {0,0,0} {0,0,F_act.F} 5 20 0.000001 {1,0,0} 1
Unit [m]
[rad] [N] [mm] [mm] [-] [-] [-]
Aalerud, Atle
5/17 3.4.404.34 SimulationX f(x) F_act Parameters Comment Function f(x)
Name F
Current Value Unit self.x [m]
Name kind x
Current Value Unit Displacement Lstr.F [m]
Name th
Current Value Unit 0 [-]
Name F
Current Value Unit (-0.4380*(self.x)^4+1.4809*(self.x)^3)- [-] 2.0204*(self.x)^2+1.3912*(self.x)+0.138 5
Preset preset2 Parameters Comment Preset Displacement Single Pass Switch singlePass3 Parameters Comment Threshold f(x) k Parameters Comment Function f(x)
Signal Generator CMC2 Parameters Comment Reference Value Curve Shape Frequency Amplitude Offset Phase Shift
Name RefVar CurveTyp f y_a y0 phi0
Current Value Simulation Time t [s] Sine 0.08 -0.26*self.x 0 -5.301
Unit
Name RefVar CurveTyp f y_a y0 phi0
Current Value Simulation Time t [s] Sine 0.1 -0.1*self.x 0 -5.301
Unit
[Hz] [-] [-] [deg]
Signal Generator CMC1 Parameters Comment Reference Value Curve Shape Frequency Amplitude Offset Phase Shift
[Hz] [-] [-] [deg]
f(x) CB_el Parameters Comment Function f(x)
Name F
Current Value Unit self.x-PlungerCylinder1.maxStroke/2 [-]
Name RefVar noDiscont
Current Value Unit Simulation Time t [s] no
Curve rampUp Parameters Comment Reference Value No Handling of Discontinuities Curve curve
CMCv04.ism
Aalerud, Atle
6/17 3.4.404.34 SimulationX f(x) Lstr Parameters Comment Function f(x)
Name F
Current Value Unit - [-] 0.0472*(self.x)^4+0.1292*(self.x)^3+0. 1846*(self.x)^2+0.1988*(self.x)+0.0005
Name X1Var X2Var X3Var
Current Value Unit + + +
Summing Junction sum1 Parameters Comment x1 x2 x3 f(x) Stroke Parameters Comment Function f(x)
Name F
Current Value Unit PlungerCylinder2.xPiston [mm]
Single Pass Switch singlePass1 Parameters Comment Threshold
Name th
Current Value Unit 0 [-]
Internal Force and Torque Sensor WOB Parameters Comment Reference Frame Displacement Calculation of Orientation Sequence of Angles Rotation Angles RGB Color Transparency
CMCv04.ism
Name frameRef x0 rotSelect psiSequence psi0 color alpha
Current Value Predecessor Frame {0,0,0} Sequence of Angles x-y-z (Cardan Angles) {0,0,0} {0.2,0.2,1} 1
Unit [m]
[rad] [-] [-]
Aalerud, Atle
7/17 3.4.404.34 SimulationX Plunger Cylinder PlungerCylinder1 Parameters Comment Maximum Stroke Cylinder Diameter Rod Diameter Transfer of Coordinates Dead Volume Port A Friction Description Static Friction Force Coulomb Friction Force Limit Velocity Consider Velocity-Dependency of Friction Force Friction Coefficient Friction Exponent (0