Strategies on an US Open Platform. Francesco Guidi1, Riccardo Mori1, Jacopo Viti1,2, Nico de Jong2 and Piero Tortoli1. 1 Università di Firenze, Electronics and ...
10.1109/ULTSYM.2012.0170
Implementation of Arbitrary Contrast imaging Strategies on an US Open Platform Francesco Guidi1, Riccardo Mori1, Jacopo Viti1,2, Nico de Jong2 and Piero Tortoli1 1 Università di Firenze, Electronics and Telecomm. Dept, Firenze, ITALY 2 Biomedical Engineering Erasmus Medical Centre Rotterdam, THE NETHERLANDS allow fine tuning of all operating parameters in order to optimize each method’s performance. In this work we compare 10 techniques [5] with a single set-up. We implemented all these techniques in the ULtrasound Advanced Open Platform (ULA-OP) [7] and tested them on the same home-made phantom. The performance of these methods was evaluated in terms of Contrast to Noise Ratio (CNR) and Contrast to Tissue Ratio (CTR).
Abstract—Comparing the performance of different contrast imaging techniques can be difficult and somewhat confusing, since the tests were typically made using different in vitro setups, contrast agents, ultrasound transducers and systems. In this study, we report on the implementation of arbitrary contrast-pulse-sequences (CPS) in the ULA-OP open ultrasound system. Combined with a home-made phantom, a convenient and consistent evaluation of the main parameters characterizing various techniques is obtained. Several experiments were performed exciting BR14 microbubbles at a dilution between 1/200 and 1/800, with an average MI = 0.1, through 10 different excitation schemes including power modulation, chirp reversal and their combination. Chirp Amplitude Modulation (CAM) and Chirp Reversal Amplitude Modulation (CRAM) showed the best performance with an average CTR of 34 dB. Keywords— Ultrasound Contrast Agent (UCA), Contrast Pulse Sequences (CPS), ULtrasound Advanced Open Platform (ULA-OP)
I.
II.
A. The ULA-OP System ULA-OP controls 64 independent TX/RX channels to drive probes having up to 192 elements. Arbitrary waveform generators (AWGs) are used in transmission, while each receiver channel uses a low noise, programmable amplifier and a 12-bit 50 MSPS A/D converter. The digital beamformer allows programmable apodization and delays. The system has on board data storage capabilities, with fast data streaming toward high capacity storage units. We took advantage of the 64 AWGs to transmit the pulse sequences required by the different contrast imaging strategies; the echoes were then acquired and RF beamformed data was saved on a PC to allow further processing and quantitative measurements of the echo data. A special firmware-software combination was designed to allow the user to define arbitrary pulsing schemes and an appropriate echo processing algorithm. The ULA-OP system was programmed to transmit the different pulse sequences using a 64-element aperture, focused at a depth of 25 mm. Given the large number of different pulses, a complete experiment was divided into 4 phases (A, B, C, D), which were carried out in sequence. In each phase, up to four contrast imaging methods are implemented; the different pulses are transmitted in subsequent pulse repetition intervals (PRI) on the same M-line, then the aperture is shifted and the process repeated. This way, an image of 81 lines is simultaneously obtained for each method. The PRI was fixed at 500 μs. In the receiver, the system uses both dynamic apodization and dynamic focusing in all cases except when chirp signals were transmitted. In this latter case, fixed apodization and focus at 25 mm were used. Within each phase the US equipment transmits, receives, stores RF data and shows real-time images obtained with standard B-mode and pulse inversion (PI) processing methods. Each phase is concluded with the download of the RF samples of all the received echoes.
INTRODUCTION
Nowadays the use of Ultrasound Contrast Agents (UCAs) play an important role in clinical diagnosis. Injected UCAs cause the echogenicity of blood to surpass the surrounding tissue’s one, extending the possible applications of ultrasound (US) imaging. Contrast enhanced US imaging methods [1] have proved effective in many new areas, e.g. in the detection and characterization of intra-tumoral vessels in liver, kidney, ovary, pancreas, prostate, breast as well as in the assessment of myocardial perfusion, where slow-moving blood in microvasculature should be distinguished from the surrounding, fast-moving tissue[1]. These innovative imaging methods rely on unique UCAs’ physical properties, such as the non-linear behavior and the memory effects, in order to maximize specificity and sensitivity towards UCAs. This family includes the most commonly used multi-pulse imaging techniques (PM, PI, PMPI), the methods exploiting a coded excitation such as chirp or Golay codes, (i.e. CAM, CPI), and the approaches designed to enhance the bubble memory effects (e.g. Chirp-Reversal (CR), Pulse-SubtractionTime-Delay (PSTD), Ring-Down (RD), Dual-Frequency (DF) or combinations between CR and PM, PI, PMPI [2][3][4]. Since each method relies on a specific aspect of the UCA response, the performance can differ significantly depending on the investigated area as well as on the set-up used in the tests. A fair comparison of different methods demands that they are implemented in the same machine and evaluated on a realistic phantom. Moreover, an accurate comparison should
978-1-4673-4562-0/12/$31.00 ©2012 IEEE
EXPERIMENT
B. Set-up The measurements were performed on a home-made phantom; a homogeneous brick of tissue mimicking material (TMM) was molded following the guidelines found in [8]. The
683
2012 IEEE International Ultrasonics Symposium Proceedings
according to the various modes and combined as requested by each mode to compute the resulting RF signals. Differences in RF gain due to the contrast-specific processing were carefully compensated, to enable an absolute comparison between methods; finally the amplitude of the analytic signals was extracted and normalized to obtain the grayscale images. Quantitative measurements were performed on three different regions of interest (ROI) of equal dimensions. Each ROI was sized to obtain a statistically significant number of samples, and centered at 25 mm depth while laterally positioned on UCA, tissue and water, respectively. From the three ROIs of each image the average amplitudes were extracted; such values were then used to calculate the contrastto-tissue ratio (CTR) and contrast-to-noise ratio (CNR). The amplitude corresponding to water was considered to be the noise reference level. III.
Figure 1. Set-up schematic representation.
RESULTS AND DISCUSSION
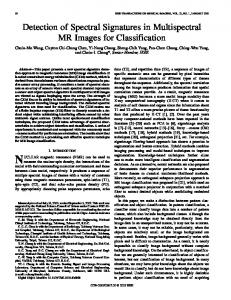
As an example, figure 2 shows 3 images corresponding to standard B-mode, PMPI and CRAM modes, respectively. The PMPI image shows an optimal tissue rejection, highlighting the UCAs signal while displaying only background noise everywhere else. The reduced tissue amplitude brings up the near and far wall edges, that appear less sharp due to the out of focus positions combined with the chamber walls curvature and the non-right angle between the US plane and the chamber axis. The CRAM image on the right has an even lower noise level, due to the greater transmitted energy combined with the subsequent compression. The greater available dynamics make the residual tissue contribution visible again. The chamber walls are now completely blurred; this is a consequence of the fixed receive focus adopted to maintain a good correlation between the received signal and the compression filter. At the bottom of the image, the light noise band is caused by the tail of the convolution between the signal and the compression mask. Figure 3 reports the average spectra computed over the three ROIs highlighted in figure 2. The spectrum from the water area in the B-mode image sets the noise reference level while the spectra from tissue and UCA show the corresponding response at the selected ROIs: the UCA spectrum appears wider than the tissue spectrum due to the nonlinear response of the UCA.
resulting TMM offers an attenuation of about 0.5 dB/cm/MHz. Furthermore, two separated cylindrical chambers were cast 20 mm apart in the TMM. Each chamber measures about 10 mm in diameter and 80 mm in depth. Before each experiment, both chambers in the TMM were filled with pure demineralized water; a suspension of UCA (BR14, Bracco SpA, Switzerland) was added in one chamber, and continuously stirred using a magnetic stirrer. Once the solution was homogeneously distributed inside the chamber, we performed the complete experiment. Several experiments were carried out at various UCA dilution rates, ranged between 1/800 and 1/200. A linear 128-element probe (LA332, Esaote, Italy) with a center frequency of 4.6 MHz and a -6 dB relative bandwidth of 102%, was placed against the TMM side and carefully aligned in order to place each hole center at about 25 mm distance from the transducer surface (see Figure 1). The excitation signals consist of sinusoidal pulses of about 1 μs, or of 5 μs chirps between 3-7 MHz with either linearly increasing (up) or decreasing (down) frequency. Table 1 summarizes the transmission settings used for each contrast imaging strategy. All signals are tapered with a Hanning window, unless otherwise specified. In all conditions two different voltage levels (12 V peak-peak and 6 V peakpeak) were applied. The generated pressure was measured in a water tank with an hydrophone (HGL 0400, Onda, Sunnyvale CA, USA); taking the TMM attenuation into account, the applied mechanical index (MI) was calculated to be no higher than 0.2 in all cases. C. Processing Methods The stored RF echoes were post-processed with Matlab® (The MathWorks, Inc., Natick, MA) to implement the required processing. All echoes were band-pass filtered with a specifically designed FIR filter (300 taps, BW = 2-8 MHz) to remove any contribution outside the transducer bandwidth, and to accurately compensate for its frequency response, thereby equalizing the system’s sensitivity; they were then grouped
Depths [mm]
B
PMPI
CRAM
10
10
10
15
15
15
20
20
20
25
25
25
30
30
30
35
-5
0 5 x [mm]
35
-5
0 5 x [mm]
35
-5
0 5 x [mm]
Figure 2. Phantom imaging of three different contrast methods, shown within a 50 dB dynamic range: B, PMPI, CRAM. (UCA concentration = 1:200).
684
2012 IEEE International Ultrasonics Symposium Proceedings
TABLE I.
CONFIGURATIONS USED FOR TRANSMISSION. TX pulses
Phase
Modes
ID
A1 A2 A3 A4 A5 A6 A7 A8 B1 B2 B3 B4 B5 B6 B7 B8 B9 C1 C2 C3 C4 C5 C6
power-modulation (PM) A
pulse-inversion (PI) power modulation combined with pulse inversion (PMPI) sub-harmonic (SH) chirp reversal (CR) chirp amplitude modulation (CAM)
B
chirp reversal amplitude modulation (CRAM) pulse subtraction time delay (PSTD) C dual-frequency (DF)
D1 D
Length [cycles]
Frequency [MHz]
Amplitude [Vpp]
4 4 4 4 4 4 4 4 20 5 µsb 5 µsb 5 µsb 5 µsb 5 µsb 5 µsb 5 µsb 5 µsb 4 4 8 4 8 1.33 µsb s1: 2.5 µsb s2: 0.5 µsb
3.5 3.5 3.5 3.5 3.5 3.5 3.5 3.5 6 3-7 (up) 3-7 (down) 3-7 (up) 3-7 (up) 3-7 (up) 3-7 (up) 3-7 (down) 3-7 (up) 4 4 4 3 6 3+6 s1: 3 s2: 6.5
6 12 6 12 -12a 6 -12 a 6 12 12 12 6 12 6 6 12 6 12 12 12 6 6 12 s1: 12 s2: 12
s1: 2.5 µsb s2: 0.5 µsb
s1: 3 s2: 6.5
ring-down (RD) D2 Standard B-mode (B) Chirp based B-mode (CB) Loss-of-correlation (LOC)
-
Notes
Rect window Linear chirps, 20% tukey window tapering. Linear chirps, 20% tukey window tapering.
Linear chirps, 20% tukey window tapering. Rectangular window. Second pulse is delayed by 1 µs. Pulse C6 corresponds to the sum of C4 and C5 pulses.
Each D1,D2 pulse is composed of two sinusoids [s1; s2] fired one after another in the same PRI. s1: -12 a s2: 12 Derived from A2 Derived from B2 Derived from A1 and A3
a Negative amplitude indicates a 180 degrees phase-shift in the transmitted pulse. b An exact number of cycles cannot be measured in this case, time duration is reported instead.
TX pulses processing, an appropriate normalization factor has been adopted. From these values, the contrast-to-tissue ratio (CTR) and contrast-to-noise ratio (SNR) parameters are derived allowing a comparison between methods. The amplitude computed in water is about the same for all methods based on the transmission of short pulses; only SH and RD show values slightly smaller due to the filter bandwidth used to remove unwanted components. Instead all methods based on long chirp TX show amplitudes at least 15 dB lower than other cases. This confirms the characteristics of the chirp pulse that, transmitting more energy than standard short pulses, is able to enhance the SNR, as reported in the table. Three modes (PM, PI, PMPI) behave in a similar way, expressing a similar CTR, always limited by noise level. With this specific home-made phantom and the adopted TX frequencies, PI shows the poorest performance, due to the second harmonic strong attenuation in the TMM. Chirp contrast methods CR, CAM and their combination, CRAM, show the same noise level as well as about the same tissue amplitude. The UCA’s amplitude rises about 4 dB in CAM and CRAM, causing a corresponding CTR enhancement (up to 34 dB), mainly due to the double amplitude pulse in the TX sequences producing higher nonlinear components from microbubbles. SH, PSTD, DF and RD show an effective tissue cancellation but poor residual UCA amplitudes. These methods
The PMPI spectrum of the tissue is indistinguishable from the water spectrum, remarking an effective tissue cancellation. The UCA spectrum is attenuated around the first harmonic and a small peak on the second harmonic is barely seen. The CRAM spectra show a strong attenuation of the white noise and a good tissue attenuation except for a residual contribute at the highest frequencies, that justifies the low-level tissue still visible in the image. All CRAM spectra cover, as expected, the full transmitted chirp bandwidth and vanishes elsewhere due to the compression filter. Table 2 reports the average amplitudes computed inside each ROI. To simplify the comparison between short and long
Amplitude (dB)
B
PMPI
0
0
-20
-20
UCA 0 Tissue Water -20
-40
-40
-40
-60
-60
-60
0
5 MHz
10
0
5 MHz
10
0
CRAM
5 MHz
10
Figure 3. Average spectra computed over the 3 ROI for the contrast methods shown in figure 2, normalized to the absolute maximum amplitude. In these graph the transducer frequency compensation has been switched off.
685
2012 IEEE International Ultrasonics Symposium Proceedings
TABLE II.
the system and the on-board arbitrary waveform generators, virtually any new transmission strategy can be implemented. Within the constraints of our set-up, the PMPI produced the best results among the standard CPS techniques; excellent performance came from chirp techniques, with a CTR improvement in the CRAM method of 22 dB over the initial chirp based image. All chirp methods were hampered by the static focalization, adopted to maintain a good matching between the used compressor and the received echo. We are currently extending the TX schemes and the post processing algorithms in order to increase the performance. We are also translating some of the tested methods in real-time in order to enable the in-vivo validations.
ROIS AVERAGE AMPLITUDE VALUES AND PERFORMANCE PARAMETERS
Modes B CB PM PI PMPI SH CR CAM CRAM PSTD DF RD LOC
UCA 70.8 65.9 63.8 57.6 64.3 62.1 51.9 55.0 56.5 62.0 57.8 50.4 37.4
Tissue 51.5 53.8 36.3 37.2 37.8 40.1 22.2 21.2 22.5 36.7 36.2 33.5 36.2
Water 36.7 20.5 36.0 36.9 37.2 33.2 19.1 19.6 20.0 36.3 35.8 33.9 35.9
CTR 19.3 12.1 27.5 20.4 26.5 22.0 29.7 33.8 34.0 25.4 21.6 16.9 1.1
CNR 34.1 45.4 27.7 20.7 27.1 28.9 32.8 35.4 36.5 25.7 22.0 16.5 1.5
REFERENCES [1] [2]
All values are in dB, UCA concentration = 1:200.
are still not optimized in terms of pulse length, windowing and temporal and frequency distance between pulses. The last row in the table reports the loss-of-correlation (LOC) image parameter, computed subtracting the echoes produced by 2 identical TX pulses, 3 PRI apart (equal to the worst case spacing that occurs in the 3 pulses length methods). Both CTR and CNR computed for this image demonstrate that subsequent echoes are substantially identical, hence the UCAs are not destroyed in a significant amount (i.e. the pressure is sufficiently low) nor an excessive stirring speed was used. All results in table 2 show a standard deviation below 2 dB. By using different UCA concentrations in the 1/200-1/800 range, such values were confirmed within 3 dB; the most evident difference is the higher attenuation in the lower part of chamber 2 when a higher concentration is used. IV.
[3]
[4]
[5]
[6]
[7]
CONCLUSION
This work has reported a fair comparison of different contrast imaging techniques, all implemented in ULA-OP equipped with suitable software. By exploiting the flexibility of
[8]
686
E. Quaia, Contrast-specific ultrasound techniques, Radiol med 2007, DOI: 10.1007/s11547-007-0157-1 Crocco, M.; Pellegretti, P.; Sciallero, C.; Trucco, A.; , "Combining multi-pulse excitation and chirp coding in contrast enhanced echographic imaging," Imaging Systems and Techniques, 2008. IST 2008. IEEE International Workshop on , vol., no., pp.45-49, 10-12 Sept. 2008. doi: 10.1109/IST.2008.4659938. Novell, A.; Der Meer, S.; Versluis, M.; Jong, N.; Bouakaz, A.; , "Contrast agent response to chirp reversal: simulations, optical observations, and acoustical verification," Ultrasonics, Ferroelectrics and Frequency Control, IEEE Transactions on , vol.56, no.6, pp.11991206, June 2009; doi: 10.1109/TUFFC.2009.1161 Novell, Anthony; Bouakaz, Ayache; , "Chirp reversal power modulation contrast imaging," Ultrasonics Symposium (IUS), 2011 IEEE International , vol., no., pp.632-635, 18-21 Oct. 2011, doi: 10.1109/ULTSYM.2011.0153 Wilson SR, Greenbaum LD, Goldberg BB., Contrast-enhanced ultrasound: what is the evidence and what are the obstacles?, AJR Am J Roentgenol. 2009 Jul;193(1):55-60. Renaud et al., In vitro comparative study of the performance of pulse sequences for ultrasound contrast imaging of the carotid artery, IEEE International Ultrasonic Symposium 2011 E Boni, L Bassi, A Dallai, F Guidi, A Ramalli, S Ricci, J Housden, P Tortoli, A reconfigurable and programmable FPGA-based system for nonstandard ultrasound methods, IEEE Trans Ultrason Ferroelectr Freq Control, 2012, V. 59(7), pp. 1378 – 1385, doi: 10.1109/TUFFC.2012.2338. Teirlink, C.J.P.M., Bezemer, R.A., Kollmann, C., Lubbers, J., Hoskins, P.R., Fish, P. Fredfeldt, K.E., Schaarschmidt, U.G. (1998) “Development of an Example Flow Test Object and Comparison of Five of these Test Objects, Constructed in Various Laboratories”, Ultrasonics, v. 36, p. 653-660.
2012 IEEE International Ultrasonics Symposium Proceedings