Article
Implementation of Single Phase Soft Switched PFC Converter for Plug-in-Hybrid Electric Vehicles Aiswariya Sekar * and Dhanasekaran Raghavan Received: 22 September 2015 ; Accepted: 10 November 2015 ; Published: 18 November 2015 Academic Editor: K. T. Chau Syed Ammal Engineering College, Ramanathapuram 623502, India;
[email protected] * Correspondence:
[email protected]; Tel.: +91-94-8800-6122
Abstract: This paper presents a new soft switching boost converter with a passive snubber cell without additional active switches for battery charging systems. The proposed snubber finds its application in the front-end ac-dc converter of Plug-in Hybrid Electric Vehicle (PHEV) battery chargers. The proposed auxiliary snubber circuit consists of an inductor, two capacitors and two diodes. The new converter has the advantages of continuous input current, low switching stresses, high voltage gain without extreme duty cycle, minimized charger size and charging time and fewer amounts of cost and electricity drawn from the utility at higher switching frequencies. The switch is made to turn ON by Zero Current Switching (ZCS) and turn OFF by Zero Voltage Switching (ZVS). The detailed steady state analysis of the novel ac-dc Zero Current- Zero Voltage Switching (ZC-ZVS) boost Power Factor Correction (PFC) converter is presented with its operating principle. The experimental prototype of 20 kHz, 100 W converter verifies the theoretical analysis. The power factor of the prototype circuit reaches near unity with an efficiency of 97%, at nominal output power for a ˘10% variation in the input voltage and ˘20% variation in the snubber component values. Keywords: boost converter; electric vehicles; soft switching; PFC; ZCS; ZVS
1. Introduction Plug-in Hybrid Electric Vehicles (PHEVs) are hybrid electric vehicles containing batteries that are rechargeable and restorable to complete charge by connecting the plug of vehicle to an external electric power source. PHEVs and Electric Vehicles (EVs) are becoming more popular with users and manufacturers. Power Factor Correction (PFC) is vital to meet the effectiveness and restrictive standards for the ac supply mains. Because of the constrained space in vehicles and expanding power intake, chargers are required to convey more power with little volume. The most well-known charger power architecture incorporates an ac-dc converter with PFC followed by an isolated dc–dc converter [1–5]. During the most recent decade, numerous standards were introduced for ac-dc converters in order to draw pure sinusoidal currents from the utilities [6,7]. Mostly they involve a diode rectifier at the front end leading to harmonics in the input current waveform. In order to shape the input current to be sinusoidal and thereby to improve the power factor, PFC is required. PFC can be of two types. Passive PFC is low cost since it does not require active switches and complex control circuits but it cannot provide high power factors like active PFC, so the active type is widely applied for PFC. Various active PFC methodologies are available for boost circuits to bring high power factor ability with ease of control attracting more research on this topic [8–11]. Due to the presence of parasitic components in the conventional boost converter the output voltage cannot be more than six times that of the applied voltage. Also when it is operated with high duty cycle the overall efficiency is reduced with increased Electro-Magnetic Interference (EMI) due to the reverse recovery problems in the diode [12]. Metal Oxide Semiconductor Field Effect Transistor
Energies 2015, 8, 13096–13111; doi:10.3390/en81112359
www.mdpi.com/journal/energies
Energies 2015, 8, 13096–13111
(MOSFET) switches experience high voltage and current stresses [13]. The input current ripple is large and this will lessen the efficiency of the system [14]. Many researches have been carried out to enhance the efficiency of the dc-dc converter. Two boost converters were interleaved to reduce the input current ripple and the switching losses with high voltage gain [15,16]. But in the applications involving high voltage, the efficiency was limited and the control was complex hence it suffers from voltage stress like that of conventional converters [17]. Cascading of boost converters does not work well due to the boost diode reverse recovery problems in the case of high output applications. To overcome these drawbacks a quadratic converter obtained by integration of two switches was proposed [18]. A sliding mode controller-based quadratic boost converter was analyzed and its efficiency was evaluated and presented in [19]. For a Zero Current-Zero Voltage Switching (ZC-ZVS) quadratic converter proposed in [20] the voltage stress in the switch was nearly same as that of the output voltage, and the current stress leads to higher conduction losses and reduced efficiency. When coupled inductors were used to achieve high voltage gain the leakage inductance losses degraded the system efficiency [21]. To recycle the leakage energy active clamp circuits were used which increased the overall cost and complexity of the structure [22]. It produced pulsated input currents. The resonance created between the parasitic capacitor of the boost diode and the leakage inductance of the coupled inductor necessitated the use of switches with high voltage ratings. Input filters are mandatory to reduce the input current ripples when the turn cycle of the coupled inductor was raised to increase the output voltage [23]. In [24], a single coupled inductor was formed by integrating the boost inductor with the transformer of the fly back converter. The advantage obtained was the achievement of high voltage gain. When a switched capacitor is integrated with a coupled inductor the leakage energy of the coupled inductor was recycled thereby reducing the voltage stress [25]. Capacitor diode voltage multiplier cells increase the voltage gain but with increased overall system cost [26]. The proposed topology in [27] degraded the voltage stress with improved voltage gain, but with additional semiconductor components, increased size and cost, reduced efficiency and it had floating output. In [24–27], the proposed converters required a large input filter in order to reduce the pulsating current ripple and experienced EMI noise problems. The circuit that combined the coupled inductor and voltage doubler cell structure reduced high input current ripple with two switches which increased the control complexity [28]. Active snubbers minimized the switching losses by means of auxiliary switches. Unfortunately, the auxiliary switch increased the complexity of both the power and control circuits [29–32]. A passive lossless snubber had quite simply restricted switching losses and EMI noise utilizing no active elements and no power dissipative elements. No additional control was required and no circulating energy was produced. The circuit structure was very simple like a RCD snubber while the power was as high as that of an active snubber and resonant converter. Less cost, excellent performance, and high reliability were the particular advantages of a passive lossless snubber [33,34]. The passive snubber circuits that were used for a basic PFC converter [35,36], a three level PFC converter [37] and a bridgeless PFC converter [38] consist of a flying capacitor in addition to snubber capacitors, inductors, and diodes. These snubber circuits act as turn ON snubbers since they recover the stored energy of the main switch with the help of the additional series-connected inductor. These circuits cannot help during turn OFF. The turn OFF passive snubber proposed for the main switch was composed of resistor, capacitor and diode components to reduce the rise of the switch voltage [39], but the snubber resistor introduced power losses to the total loss thus degrading the circuit efficiency. In order to reduce the reverse recovery current of the output diodes, a passive snubber circuit comprised of saturable inductors was used [40,41]. Unfortunately this increased the voltage stress of the main switch with additional cost of inductors. In [42] a snubber circuit with a saturable inductor was used to lower the reverse recovery current of the output diodes. Even though the problem of additional voltage stress of the main switch had been eliminated by the snubber, the main drawback was that
13097
Energies 2015, 8, 13096–13111
the three additional inductors of the snubber circuit increased the circuit size because of the nine Energies 2015, 8, page–page additional passive components. A Ripple Mirror (RM) circuit was proposed for a boost converter to reduce the ripple. Boundary mode control was presented and the converter achieved ZVS and ZCS for a boost converter to reduce the ripple. Boundary mode control was presented and the converter conditions. At rated load, the circuit had an efficiency of 93% [43]. achieved ZVS and ZCS conditions. At rated load, the circuit had an efficiency of 93% [43]. To charge To charge aa plug-in-electric plug‐in‐electric vehicle vehicle (PEV) (PEV) efficiently efficiently aa new new dc dc power power micro micro grid grid architecture architecture was The improvement improvement in in efficiency efficiency and was proposed proposed and and evaluated. evaluated. The and reduction reduction in in complexity complexity were were gained since the PEV was coupled directly with the dc link without a static converter [44]. An gained since the PEV was coupled directly with the dc link without a static converter [44]. onboard charger based on buck converter was proposed with ZCS for PEV. The controller used both An onboard charger based on buck converter was proposed with ZCS for PEV. The controller used pulse frequency modulation and pulse width modulation methods to achieve high efficiency and both pulse frequency modulation and pulse width modulation methods to achieve high efficiency high power density with reduced input current THD [45]. In [46], a ZVS forward converter was and high power density with reduced input current THD [45]. In [46], a ZVS forward converter was implemented in the power supply system for hybrid renewable energy conversion. ZVS has reduced implemented in the power supply system for hybrid renewable energy conversion. ZVS has reduced the switching and conduction losses for the active switches. the switching and conduction losses for the active switches. This paper is organized as follows: Section 2 presents a review of existing ac-dc PFC converters This paper is organized as follows: Section 2 presents a review of existing ac‐dc PFC converters and and Section Section 33 presents presents the the proposed proposed circuit circuit configuration configuration and and operating operating principle principle in in Continuous Continuous Conduction Mode (CCM). Section 4 gives the design guidelines with an illustrative example. Conduction Mode (CCM). Section 4 gives the design guidelines with an illustrative example. The The experimental output prototype prototype of of the experimental results results of of aa 100 100 W, W, 2424 VV input/40 V Vdc dc output the ac-dc ac‐dc boost boost PFC PFC acac input/40 converter with fss = 20 kHz are given in Section 5 to verify the feasibility of the proposed snubber. = 20 kHz are given in Section 5 to verify the feasibility of the proposed snubber. converter with f Finally, the conclusions drawn from this work are presented in Section 6. Finally, the conclusions drawn from this work are presented in Section 6. 2. Review of Existing ac-dc PFC Boost Topologies 2. Review of Existing ac‐dc PFC Boost Topologies The conventional boost topology is the most well-known topology for PFC applications. In PFC The conventional boost topology is the most well‐known topology for PFC applications. In PFC applications, a diode bridge is utilized to rectify the ac input voltage to dc, and this is followed by the applications, a diode bridge is utilized to rectify the ac input voltage to dc, and this is followed by boost converter, as shown in Figure 1a. the boost converter, as shown in Figure 1a.
(a)
(b)
(c) Figure 1. Existing ac‐dc Boost Power Factor Correction (PFC) Topologies. (a) Conventional ac‐dc Figure 1. Existing ac-dc Boost Power Factor Correction (PFC) Topologies. (a) Conventional ac-dc Boost PFC Converter; (b) ac‐dc Boost PFC Converter Passive Snubber [33]; (c) ac‐dc Boost PFC Boost PFC Converter; (b) ac-dc Boost PFC Converter Passive Snubber [33]; (c) ac-dc Boost PFC Converter with Passive Snubber [34]. Converter with Passive Snubber [34].
Be that as it may, this topology has its downsides, which are high input current ripple, high switching and conduction losses and reduced efficiency at higher power levels because of the diode bridge losses. The boost converter topology 13098 with passive snubber [33] achieved soft switching characteristic of the main switch with ZCS turn ON and ZVS turn OFF with the addition of two 3
Energies 2015, 8, 13096–13111
Be that as it may, this topology has its downsides, which are high input current ripple, high switching and conduction losses and reduced efficiency at higher power levels because of the diode Energies 2015, 8, page–page bridge losses. The boost converter topology with passive snubber [33] achieved soft switching characteristic of the main switch with ZCS turn ON and ZVS turn OFF with the addition of two inductors, one one diode diode and and one one capacitor capacitor as as shown shown in in Figure Figure 1b. 1b. This avoids the the degradation degradation of of inductors, This avoids efficiency with with reduction reduction diode losses, yet some has some input current ripple problems. The efficiency in in thethe diode losses, yet has input current ripple problems. The passive passive boost converter snubber circuit [34], as shown in Figure 1c achieved ZCS turn ON and ZCS boost converter snubber circuit [34], as shown in Figure 1c achieved ZCS turn ON and ZCS turn OFF turn OFF of the main switch and reduces the problem of input current ripple and switching losses, of the main switch and reduces the problem of input current ripple and switching losses, but it still but it still had the problem of lower efficiency for a vehicle charger system. In order to achieve high had the problem of lower efficiency for a vehicle charger system. In order to achieve high efficiency efficiency at light loads and low ac input lines so as to minimize the charger size and charging time at light loads and low ac input lines so as to minimize the charger size and charging time and to and to lessen the amount and cost of electricity drawn from the utility, a new passive snubber circuit lessen the amount and cost of electricity drawn from the utility, a new passive snubber circuit has has been proposed in this paper. been proposed in this paper.
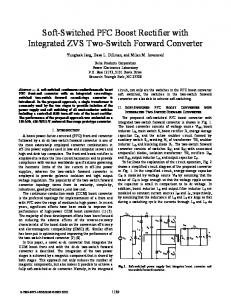
3. Circuit Structure of Proposed PFC Converter 3. Circuit Structure of Proposed PFC Converter The proposed LCD passive snubber consists of a snubber inductor L The proposed LCD passive snubber consists of a snubber inductor Lss,, snubber capacitors C snubber capacitors C11 and and C 2 and snubber diodes D 1 and D 2 as in Figure 2. The LCD snubber is added to the conventional hard C2 and snubber diodes D1 and D2 as in Figure 2. The LCD snubber is added to the conventional hard switched boost PFC converter circuit which comprises of an input inductor L switched boost PFC converter circuit which comprises of an input inductor Lmm,, output capacitor C output capacitor C00,, main diode D f and a switch S. main diode D f and a switch S.
Figure 2. Proposed Boost PFC Converter. Figure 2. Proposed Boost PFC Converter.
3.1. Operating Principle 3.1. Operating Principle One switching period of the proposed converter has six operating modes. They are explained One switching period of the proposed converter has six operating modes. They are explained by the equivalent circuit of proposed converter as in Figure 3. The key waveforms of the ac-dc by the equivalent circuit of proposed converter as in Figure 3. The key waveforms of the ac‐dc PFC PFC boost converter shown in Figure Some assumptionsare aremade madeduring during the the simulation simulation of boost converter are are shown in Figure 4. 4. Some assumptions of proposed converter: proposed converter: a b c d
Alla. All the semiconductor devices used in the proposed converter are ideal. the semiconductor devices used in the proposed converter are ideal. b. Reverse recovery of the boost converter diode is considered and taken into account. Reverse recovery of the boost converter diode is considered and taken into account. c. The output capacitor C 0 is assumed to be large to produce a constant output voltage. The output capacitor C0 is assumed to be large to produce a constant output voltage. d. The main inductor L m is much greater than snubber inductor Ls to have a constant The main inductor Lm is much greater than snubber inductor Ls to have a constant input current. input current.
13099
Energies 2015, 8, 13096–13111 Energies 2015, 8, page–page Energies 2015, 8, page–page
(a) (a)
(b) (b)
(c) (c)
(d) (d)
(e) (f) (e) (f) Figure 3. Operation modes of the proposed converter in a switching cycle: (a) mode 1; (b) mode 2; Figure 3. Operation modes of the proposed converter in a switching cycle: (a) mode 1; (b) mode Figure 3. Operation modes of the proposed converter in a switching cycle: (a) mode 1; (b) mode 2; 2; (c) mode 3; (d) mode 4; (e) mode 5; (f) mode 6. (c) mode 3; (d) mode 4; (e) mode 5; (f) mode 6. (c) mode 3; (d) mode 4; (e) mode 5; (f) mode 6.
Figure 4. Typical waveforms concerning the operation stages for the converter operating in Figure 4. Typical waveforms concerning the operation stages for the converter operating in Continuous Conduction Mode (CCM). Figure 4. Typical waveforms concerning the operation stages for the converter operating in Continuous Conduction Mode (CCM).
Continuous Conduction Mode (CCM).
5 5
13100
Energies 2015, 8, 13096–13111
3.1.1. Mode 1 (t0 < t < t1 ) Switch S is turned ON at t = t0 . Diodes D1 and D2 are in the OFF state. The main diode D f remains ON. The voltage across the snubber capacitor C1 reaches the output voltage level. During this mode the current through Lm and switch S is given by: ` ˘ V0 ´ Vin ´ VC2 pt ´ t0 q (1) ILm ptq “ ILm pt0 q ´ Lm ` ˘ V0 ´ VC2 pt ´ t0 q (2) Is ptq “ Ls Thus the switch is turned ON at the ZCS condition due to the diode current i.e., given by: ID f “ ILm ´ Is ˜ ID f ptq “ ILm pt0 q ´
` ˘ ` LS V0 ´ Vin ´ VC2 ` Lm V0 ´ VC2 Lm LS
(3) ˘¸ pt ´ t0 q
(4)
When the current through the diode D f decreases to zero then Is pt1 q “ ILm pt1 q
(5)
3.1.2. Mode 2 (t1 < t < t2 ) During the beginning of this mode snubber diode D2 is turned ON, D1 is in the OFF state due to the turn OFF of the main diode D f turn OFF, and switch S remains ON. A resonance starts between C1 , D2 , C2 , LS and the switch. The voltage across the snubber capacitor C1 is given by: ˆ ˙ ˆ ˙ L V L V VC1 ptq “ V0 ´ VC2 ´ S in cosωr pt ´ t1 q ` VC2 ` S in (6) Lm ` LS Lm ` LS a (7) ωr – pLm ` LS q {Lm LS C1 q The current through diode D2 is given by: ˆ ˙ LS Vin ID2 ptq “ ωr C1 V0 ´ VC2 ´ sinωr pt ´ t1 q Lm ` LS The input current through the main inductor Lm is given by: ˙ ˆ 1 L V Vin pt ´ t1 q ´ sinωr pt ´ t1 q ILm ptq “ ILm pt0 q ` V0 ´ VC2 ´ S in Lm ` LS ωr L m Lm ` LS
(8)
(9)
The switch current during this mode is: Is ptq “ ILS ptq “ ILm ptq ` ID2 ptq
(10)
At the end of this mode the snubber diode D1 turns ON and voltage across the snubber capacitor C1 reaches zero. 3.1.3. Mode 3 (t2 < t < t3 ) At t = t2 , the snubber diode D1 is turned ON, the snubber diode D2 remains in ON state. Snubber capacitor C1 is discharged fully. The current through the snubber inductor and the main inductor becomes: VC (11) ILS ptq “ ILS pt2 q ´ 2 pt ´ t2 q LS ILm ptq “ ILm pt2 q ´
Vin ` VC2 pt ´ t2 q Lm
13101
(12)
Energies 2015, 8, 13096–13111
Current freewheels through C1 , D2 , C2 and Lm and Vin . At t = t3 , switch is turned OFF with ZVS condition. 3.1.4. Mode 4 (t3 < t < t4 ) At t = t3 , switch S remains in OFF state with D1 and D2 remaining in ON state, and the main diode is turned ON. Snubber capacitor C1 is charged by the current through main inductor Lm through the diode D1 . The current through D1 is given as: ID1 ptq “ ILS ptq “ ILS pt2 q ´
VC2 pt ´ t2 q LS
(13)
Resonance starts between C1 , D2 , C2 , LS and source: ID2 ptq “ ID1 ptq ´ ILm ptq
(14)
At t = t4 , voltage across C1 reaches near theoutput voltage. 3.1.5. Mode 5 (t4 < t < t5 ) At t = t4, main diode remains ON; switch S will be in OFF state. A resonant path is created by LS and the parasitic capacitor C p of switch S and diodes D1 and D2 are turned OFF: VS ptq “ VC1 ptq “ V0
(15)
VLS ptq “ ´VC2
(16)
VLm ptq “ Vin ` VC2 ´ V0
(17)
I L m “ ID f
(18)
At t = t5 , the current through D1 and D2 reduce linearly to zero. 3.1.6. Mode 6 (t5 < t < t6 ) At t = t5 , the main diode is in ON state, the switch S is remains in OFF state, and snubber diodes D1 and D2 are turned OFF as the current through them reduces to zero: I L m “ ID f
(19)
VLS ptq “ 0
(20)
VLm ptq “ Vin ` VC2 ´ V0
(21)
VS ptq “ V0 ´ VC2
(22)
The snubber inductor LS and the parasitic capacitance of the converter switch S create a resonance condition. Because of this resonance, there will be a decrease in the switch voltage from the output voltage level. The next switching cycle starts at the end of this mode i.e., t = t6 , where the switch S is turned ON again. 4. Design of Proposed LCD Snubber 4.1. Main Inductor Lm The boost inductor Lm should be designed in such a way that the current that flows through it should be less than the current that it can withstand i.e. two times the maximum input current: `
ILm
˘ V0 ´ Vin ´ VC2 p1 ´ dq – Lm f S
13102
(23)
Energies 2015, 8, 13096–13111
Thus when fs increases, the value of main inductor in the proposed circuit is decreased when compared to that in the conventional converter: pV0 ´ Vin q p1 ´ dq ILm “ (24) Lm f S 4.2. Resonant Inductor LS For achieving ZCS turn ON of the switch, the required value of the snubber inductor is determined from the following equation: ` ˘ V0 ´ VC2 tr LS ą LS, min “ (25) Ii where, tr is the rise time of the switch current. When the switch is turned ON at t = t1 , the reverse recovery current of the main diode D f ` ˘ flows through the resonant inductor. V0 ´ VC2 is the voltage to be absorbed by LS to avail the ZCS condition to turn ON the switch S. When LS increases, it will decrease the turn ON losses of the switch. Maximum inductance value of LS is given as from: LS ď LS, max “
p1 ´ dq TS VC2 ILS pt2 q
(26)
4.3. Resonant Capacitors C1 and C2 To control the dv/dt of switch at turn OFF a snubber capacitor C1 is connected in parallel to the switch with the diode D1 . The minimum value of C2 depends on the output voltage as it will appear across C1 during the switch turn OFF: C1 ą C1, min “
IS pt2 q t f 2V0
(27)
where, t f is the switch current fall time When C1 increases the turn OFF losses of the switch decreases since the voltage across the switch decreases. For ZVS turn OFF: (28) VC1 pt2 q “ 0 From this maximum value of C1 is determined as: C1 ă C1, max “
2 1 t2 ´ t1 ` ˘˘ s r ´1 ` LS cos ´VC2 V0 ´ VC2
(29)
The value of C2 must be chosen such the voltage across C2 is greater than the ripple voltage: VC2 ! VC2
(30)
5. Experimental Results and Discussions The overall performance of the new passive snubber circuit is estimated with the prototype constructed according to Figure 5. The values of snubber components are determined using Equations (25)–(29). Before t = t5 , when Ls = 70 µH, I Ls ILS reaches zero for ZCS turn ON, when C1 = 4.3 nF, ZVS turn OFF is achieved and when C2 = 2.5 µF, the VC2 ripple voltage is negligibly small. The converter is operated with an ac input voltage of Vin = 24V which is rectified and boosted to the output dc voltage of V 0 = 40V and P0 = 100W at fs = 20 kHz. The proposed converter waveforms (Figure 6a–e) verify the key waveforms (Figure 4) at t = 30 s. The components used in the hardware implementation of the proposed boost PFC converter are summarized in Table 1 with a detailed description. In the experimental waveforms of the converter switch shown, there is a slow increase in the switch current and voltage since LS controls the turn ON di/dt of S and C1 controls the turn OFF 13103
Energies 2015, 8, 13096–13111
di/dt of S. It thus proves that switch S is turned ON with ZCS. There is no overlap between voltage and current waveforms for the main switch S. Energies 2015, 8, page–page Energies 2015, 8, page–page
Figure 5. Prototype model.
Figure 5. Prototype model. Figure 5. Prototype model.
(a)
(b)
(a)
(b)
(c)
(d)
(c)
(d)
(e) Figure 6. Measured waveforms for the proposed (e)converter (a) VS and IS (b) Vg and V0 (c) voltage across Lm and LS (d) voltage across Df and C1 and (e) Vin and Ii. Figure 6. Measured waveforms for the proposed converter (a) VS and IS (b) Vg and V0 (c) voltage Figure 6. Measured waveforms for the proposed converter (a) VS and IS (b) Vg and V 0 (c) voltage m and LS (d) voltage across Df and C1 and (e) Vin and Ii. across L
across Lm and LS (d) voltage across D f and C1 and9 (e) Vin and Ii . 9
13104
Energies 2015, 8, page–page Energies 2015, 8, 13096–13111
Table 1. Component values for the experimental ac‐dc PFC converter with proposed passive snubber. ac‐dc PFC Converter with Table 1. Component values forCompany the experimental ac-dc PFC converter with proposed passive snubber. Component Proposed Passive Snubber Lm JIME Component Company ac-dc PFC Converter 200 μH with Proposed Passive Snubber C0 nichicon 90 μF Lm JIME 200 µH ‐ 70 μH LS C nichicon 90 µF 0 Jb 4.3 nF C1 LS 70 µH Jb 4.3 nF C2 C1 nichicon 2.5 μF C2 nichicon 2.5 µF f(max) = 1 A) Rectifier Diode MULTICOMP 1N5408 (Vrrm = 1000V, I Rectifier Diode MULTICOMP 1N5408 (V rrm = 1000V, If (max) = 1 A) MOSFET FAIRCHILD IRF840 N‐Channel Power MOSFETs, 8A, 450 V/500 V MOSFET FAIRCHILD IRF840 N-Channel Power MOSFETs, 8A, 450 V/500 V BA157 (V = 400V, Iavg = 1 A) High Frequency Diode MIC High Frequency Diode MIC BA157 (V rrm = 400V, I = 1 A) rrm avg Transformer JIME Ferrite Core Transformer JIME Ferrite Core Input Inductor JIME Ferrite Core Input Inductor JIME Ferrite Core PIC Controller Chip MICROCHIP 16F877A PIC Controller Chip MICROCHIP 16F877A Optocoupler IsolationChip Fairchild semiconductor MCT2E Optocoupler IsolationChip Fairchild semiconductor MCT2E
The snubber elements C1 , D2 , C2 , LS along with S create a resonant path when D2 is turned ON. The snubber elements C1, D 2, C2, LS along with S create a resonant path when D2 is turned ON. This reduces the turn ON di D f {dt of S. The anode voltage is decreased from the final value V 0 to 0 V. ⁄ of S. The anode voltage is decreased from the final value V0 to 0 V. This reduces the turn ON Thus LS and D2 reduces the reverse recovery current of boost diode to a greater extent. When V C1 VC Thus LS and D2 reduces the reverse recovery current of boost diode to a greater extent. When VC1 1 increases from 0 V to V 0 , ID f = 0 A and VD f decreases from V 0 to 0 V when S is turned off as in mode increases from 0 V to V0, = 0 A and decreases from V0 to 0 V when S is turned off as in 4. There is no additional voltage stress on the main diode and also the reverse-recovery problems mode 4. There no additional stress on the main diode and the reverse‐recovery are less severeis since it achieves voltage soft switching. Figure 6e confirms that also the input voltage and input problems are less severe since it achieves soft switching. Figure 6e confirms that the input voltage and current are in-phase with near unity power factor. input current are in‐phase with near unity power factor. The measured efficiency is about 97%, which is clear from the measured input/output current andThe measured efficiency is about 97%, which is clear from the measured input/output current and voltage waveforms. The ac-dc PFC boost converter is needed to provide sufficient voltage of voltage waveforms. The ac‐dc PFC boost converter is needed to provide sufficient voltage of 400–600 V 400–600 V dc for battery charger in electric vehicle. A prototype circuit is designed to produce a dc for battery charger in electric vehicle. A prototype circuit is designed to produce a constant dc constant dc output V 0 = 40 V for an input voltage Vin range of 24 V ˘ 10%. It was operated at output V in range of 24 V ± 10%. It was operated at fs of 20 kHz. The boost fs of 200= 40 V for an input voltage V kHz. The boost converter circuit was built using the following components Lm = 200 µH; converter circuit was built using the following components L 0 = 90 μF. The Figures 7–11 C0 = 90 µF. The Figures 7–11 have been drawn with them = 200 μH; C help of simulation work carried out in have been drawn with the help of simulation work carried out in MATLAB for the developed circuit. MATLAB for the developed circuit. This has been done to verify the effectiveness of the proposed This has in been done verify the of the proposed in terms of efficiency for circuit terms of to efficiency foreffectiveness changes in the input voltage,circuit variation of snubber component changes in the input voltage, variation of snubber component values, duty cycle and load values, duty cycle and load respectively for Plug-in-Hybrid Electric vehicle applications. The power respectively for Plug‐in‐Hybrid Electric vehicle applications. The power efficiency atvalues the efficiency values of the proposed and conventional boost converters are compared P0 = 75of W, 100 proposed and conventional boost converters are compared at P 0 = 75 W, 100 Wand 125 W (Figure 7). Wand 125 W (Figure 7). The power efficiency of the proposed one at an ac voltage of Vin = 24 V is 97% The power efficiency of the proposed one at an ac voltage of V = 24 V is 97% at P 0 = 75 W, 96.8% at P0 at P0 = 75 W, 96.8% at P0 = 100 W and 95.5% at P0 = 125 W inwhich is 3.7%, 4% and 4.2% greater than = 100 W and 95.5% at P 0 = 125 W which is 3.7%, 4% and 4.2% greater than the conventional circuit, the conventional circuit, respectively. The proposed PFC converter has higher efficiency over wide respectively. The ranges proposed converter has one. higher efficiency over wide input and load ranges input and load thanPFC the conventional than the conventional one.
Figure 7. Input voltage and efficiency. Figure 7. Input voltage and efficiency.
The snubber circuit parameter values LS, C1 and C2 are varied by ±20% from the designed values and the power efficiency of the proposed converter is measured at an ac voltage of Vin = 24 V, 10 13105
Energies 2015, 8, 13096–13111
The snubber circuit parameter values LS , C1 Energies 2015, 8, page–page Energies 2015, 8, page–page
and C2 are varied by ˘20% from the designed values and the power efficiency of the proposed converter is measured at an ac voltage of Vin = 24 V, output dc voltage of V 0 = 40 V and P0 = 7500 = 75 W, 100 W and 125 W (Figure 8). At the designed range, W, 100 W and 125 W (Figure 8). At the designed range, the output dc voltage of V 00 = 40 V and P output dc voltage of V = 40 V and P = 75 W, 100 W and 125 W (Figure 8). At the designed range, efficiency is higher and it is decreased by 0.5% at ˘ 20% variation. The duty cycle and the power the efficiency is higher and it is decreased by 0.5% at ± 20% variation. The duty cycle and the power the efficiency is higher and it is decreased by 0.5% at ± 20% variation. The duty cycle and the power values of the proposed and conventional converters are plotted at P0 = 7500 = 75 W, 100 W and W, 100 W and 125 W. efficiency efficiency values of the proposed and conventional converters are plotted at P efficiency values of the proposed and conventional converters are plotted at P = 75 W, 100 W and During entirethe dutyentire cycle duty range, the proposed oneproposed has higherone efficiency than the conventional 125 During range, has efficiency than the 125 W. W. the During the entire duty cycle cycle range, the the proposed one has higher higher efficiency than one the (Figure 9). conventional one (Figure 9). conventional one (Figure 9).
Figure 8. Deviation and efficiency. Figure 8. Deviation and efficiency. Figure 8. Deviation and efficiency.
Figure 9. Duty cycle and efficiency. Figure 9. Duty cycle and efficiency. Figure 9. Duty cycle and efficiency.
The output power P 0 is varied from 75 W to 100 W and the circuit efficiency is measured at an ac The output power P The output power P00 is varied from 75 W to 100 W and the circuit efficiency is measured at an ac is varied from 75 W to 100 W and the circuit efficiency is measured at an ac input voltage of V in 0 = 40 V and fss = 20 kHz (Figure 10). The efficiency input voltage of V in = 24 V, output dc voltage of V = 24 V, output dc voltage of V input voltage of Vin = 24 V, output dc voltage of V 00 = 40 V and f = 40 V and fs = 20 kHz (Figure 10). The efficiency = 20 kHz (Figure 10). The efficiency decreases when the output power P 0 is increased for both and proposed PFC decreases when when output power 0 is increased both conventional conventional and PFC proposed PFC decreases thethe output power P0 is P increased for bothfor conventional and proposed converters. converters. During the entire operating range the proposed circuit has higher efficiency of more than converters. During the entire operating range the proposed circuit has higher efficiency of more than During the entire operating range the proposed circuit has higher efficiency of more than 6% than 6% than that of the conventional one. At V 0 = 400 V, fss = 20 kHz and P 00 = 300 W the simulation is 6% than that of the conventional one. At V = 20 kHz and P = 300 W the simulation is that of the conventional one. At V 0 = 400 V,0 = 400 V, f fs = 20 kHz and P0 = 300 W the simulation is carried carried out. The measured efficiency and duty cycle is plotted against input voltage for carried out. The measured efficiency and duty cycle is plotted against voltage for both both out. The measured efficiency and duty cycle is plotted against input voltageinput for both proposed and proposed and conventional boost PFC converters (Figure 11). The efficiency is 87% for the proposed proposed and conventional boost PFC converters (Figure 11). The efficiency is 87% for the proposed conventional boost PFC converters (Figure 11). The efficiency is 87% for the proposed converter for converter for duty cycle > and duty cycle 0.4 0.4 and 0.4 andcycle for duty cycle 0.4 duty it is 97%. It