Keywords ASM2d; model calibration; Sequencing Batch Reactor (SBR); enhanced biological phosphorus removal (EBPR); nitrogen removal; sensitivity.
n09
13/2/01
11:12 am
Page 69
S. Marsili Libelli*, P. Ratini**, A. Spagni§, G.Bortone§ *Dept. of Systems and Computers, University of Florence, via S. Marta, 3, 50139 Florence, Italy **SPES Scrl via Broganelli 84 Fabriano (AN), Italy §ENEA- Wastewater Treatment and
Water Cycle Unit, via Martiri di Monte Sole, 4 - Bologna, Italy
Abstract An enhanced process model for SBRs has been developed. Though the basic mechanism largely draws on the Activated Sludge Model n. 2d, its new features are the splitting of the nitrification stage in a two-step process, according to the well known Nitrosomonas –Nitrobacter oxidation sequence, and an improved XPAO dynamics, involved in the anaerobic/aerobic phosphorus removal process. The model was implemented through the DLL technique allowing complied C++ modules to be linked to an ordinary Simulink block diagram. The static sensitivity study revealed that if the parameter vector is partitioned into subsets of biologically related parameters and calibrated separately, the calibration procedure does not present particularly difficult aspects. Trajectory sensitivity showed also to which extent data collection could be optimised in order to improve calibration accuracy. The study of the shape of the error functional generated by parameters couples allows a much more effective calibration strategy. Keywords ASM2d; model calibration; Sequencing Batch Reactor (SBR); enhanced biological phosphorus removal (EBPR); nitrogen removal; sensitivity
Introduction
IAWQ models assume nitrification as a one-step process (Henze et al., 1986, 1995, 1998). This approach was demonstrated not to be appropriate for SBR processes, since nitrification inhibition can occur leading to nitrite accumulation, and this latter phenomenon could also happen due to incomplete denitrification (Andreottola et al., 1997). Therefore, the modified model which has been implemented in this study includes two populations of nitrifiers and two reactions steps for denitrification. For both populations of nitrifiers, yield, maximum growth rate and decay rate have been separately selected. Nitrification was modelled as follows:
Water Science and Technology Vol 43 No 3 pp 69–76 © 2001 IWA Publishing and the authors
Implementation, study and calibration of a modified ASM2d for the simulation of SBR processes
S0 SNH µ Ns S + K X Ns + S K 0 NH 0 NH SNO2 S0 K NHi µ Nb X Nb S0 + K 0 SNO2 + K NO2 ox K NHi + SNH It can be noticed that, on the bases of previous experiences (Andreottola et al. 1997), ammonia inhibition was included. in the second step of nitrification. Denitrification processes were split according to the following equation SNO3 SNO3 K 0 SS µ H η NO3 K 0 + S0 SS + K S SNO3 + K NO3 SNO3 + SNO2 SNO2 K 0 SS µ H η NO3 K 0 + S0 SS + K S SNO2 + K NO2 an
X BH
SNO2 SNO3 + SNO2
X BH
69
n09
13/2/01
11:12 am
Page 70
As a consequence of the previous model modification, P-uptake processes were also modelled as follows: q PP
sO2 s PO 4 x PHA / x PAO k MAX − x PP / x PAO x PAO( ρ 13) KO2 + sO2 K PS + SPO 4 k PHA + x PHA / x PAO k IPP + k MAX – x PP / x PAO
S. Marsili Libelli et al.
ρ13η NO3
KO2 s NO3 s NO3 sO2 k NO3 + s NO3 s NO2 + s NO3
ρ13η NO3
KO2 s NO2 s NO2 sO2 k NO2 + s NO2 s NO2 + s NO3
Phosphorus accumulating organisms (PAOs) growth was instead modelled according to the following equations:
µ PAO
sO2 s PO 4 x PHA / x PAO s NH 4 s ALK x PAO( ρ 16) KO2 + sO2 K NH 4 + SNH 4 K ALK + s ALK K P + s PO 4 k PHA + k PHA / x PAO
ρ16η NO3
KO2 s NO3 s NO3 sO2 k NO3 + s NO3 s NO2 + s NO3
ρ16η NO3
KO2 s NO2 s NO2 sO2 k NO2 + s NO2 s NO2 + s NO3
It can be noticed that the rate equations have been designed such that maximum specific growth rate of the heterotrophic organisms does not increase above maximum growth rate even though both electron acceptors (nitrite and nitrate) are present in high concentration. This paper presents the results of an identifiability and calibration study of the above described modified model using experimental data of a bench scale enhanced biological phosphorus removal (EBPR) SBR. This study represents a part of a wider research activity on automation and control of SBRs. In this research project, control strategies are based on monitoring simple and reliable physical chemical parameters such as pH, ORP and conductivity (Spagni et al., in press). In this meaning, model results will be used for the “train” of the controller. Materials and method
In Table 1, the characteristics of the synthetic feed are reported. A bench scale Sequencing Batch Reactor (SBR), alternating anoxic/anaerobic/oxic phases in a 6 hour cycle, has been used. The SBR operational parameters are reported in Table 2, while the operational cycle is represented in Figure 1.
Table 1 Synthetic feed composition Compound
Minerals
Concentration (g/L)
1.5
CH3COONa · 3H20
1.7
FeCl3 · 6H2O
Yeast extract
0.2
H3BO3
0.15
(NH4)2HPO4
0.085
CuSO4 · 5H2O
0.03
NH4Cl
0,080
KI
0.18
CaCl2 · 2H2O
0.014
MnCl2 · 4H2O
0.12
MgSO4 · 7H2O
0.09
Tap water
70
Weight (g)
to 1 L
NaMoO4 · 2H2O
0.06
ZnSO4 · 7H2O
0.12
CoCl2 · 6H2O
0.15
EDTA
0.01
n09
13/2/01
11:12 am
Page 71
Table 2 Operational SBR parameters Working volume
5L
Influent volume
1L
Time cycle Solids retention time
6h 20 d S. Marsili Libelli et al.
Figure 1 Operational SBR cycle
Chemical analyses were carried out according to Standard Methods (APHA, 1989). Respirometric analyses were carried out according to Spanjers (1993). Results and discussion Software implementation
The computer implementation used to simulate the process is composed of two main parts: the modified ASM2d module, including the microbial kinetics, and the chemical module implementing the pH equilibria. The aggregated model is too complex to be efficiently simulated using standard Matlab/Simulink coding. For this reason a different approach was followed: the model dynamics was coded as a C++ module and a DLL and called through a Simulink S-function block. The parameters of the model being used in the DLL were passed from the calling Matlab script through the parameter dialog line of the S-function block. Since the DLL was created in accordance to the Matlab pointer structure, optimal use of the C++ code was obtained since pointers instead of variables were used throughout, obtaining a very fast code. In fact, the standard 6-hour cycle, could be run in only 6 seconds on a Pentium II/350 MHz computer. This dramatic reduction in computational time allowed extensive sensitivity studies to be carried out and the application of systematic parameter calibration procedures. Figure 2 shows the programming hierarchy used in the implementation, where the connection between the modified ASM2d and the pH module is shown. Parameter calibration
The high number of parameters in the model would prevent their accurate calibration if they were taken as a whole. So the estimation problem had to be broken down into a number of more limited subproblems, involving parameter subsets affecting specific sections of the model, e.g. nitrification, phosphorus removal, and so on. Several kinetic constants appearing in the model were already available from specific experiments (Spagni, 1998) or from the literature. Others had to estimated in order to fit the entire model to the experimental data. They were first divided into homogeneous groups on a metabolic basis. It was observed that the effect of these groups on the overall model performance could be separated, indicating a large degree of parameter decoupling. The following homogeneous groups were then formed. Hydrolysis, heterotrophs, autotrophs, phosphorus, precipitation, stoichiometry
Further, in these parameter subvectors several individual parameters showed a marked influence on model response. They were selected as follows:
71
n09
13/2/01
11:12 am
Page 72
S. Marsili Libelli et al. Figure 2 Simulink implementation of the complete SBR model
Autotrophs: µ NS , µ NG , K NH 41 Phosphorus: q PP , q PHA , µ PAO , K PHA
(1)
Stoichiometry: YPO4 , YH Parameter calibration involves the minimisation of a quadratic error functional N exp
1 E ( p) = N exp
∑(y – m ) i
i
2
(2)
i =1
where is the index of experimental measurements and represent the observed data and model outputs respectively. A numerical search method was preferred for the calibration since gradient-based methods are not applicable since the gradient of functional (2) cannot be evaluated through calculus. Further, gradient search can be very inefficient in “narrow valley” situations (Himmelblau, 1972), as is often encountered in estimation of biochemical models (Seber and Wild, 1989). For this reason a search method based on an optimised version of the classical Nelder and Mead flexible polyhedron was used. Its features are described in details elsewhere (Marsili-Libelli, 1992). As a demonstration the shape of the error functional generated by two parameter couples in the groups of Eq. (1) are shown in Figure 3. The numerical search method demonstrated that some couples are not identifiable (Figure 4), while others, perhaps more strictly involved in the same biochemical processes are much more identifiable (Figure 5). Sensitivity study
72
The influence of each parameter on model response can be better assessed introducing the concept of parametric sensitivity. Two kinds of sensitivity can be defined: static and dynamical. An example of the former has already been given in Figure 3 where the variation of error functional caused by a parametric variation has been shown. Dynamical (or “trajectory”) sensitivity, introduced by Perkins (1972) and largely used in biotechnical
n09
13/2/01
11:12 am
Page 73
S. Marsili Libelli et al.
Figure 3 Shape of the error functional generated by parameter couples in the calibrated subset
Figure 4 On the left, shape of the error functional generated by parameter couples (maximum growth rate of PAO (µPAO) and biomass nitrogen content (iXB)), in the calibrated subset; on the right, confidential range at 98% and 95%
Figure 5 On the left, shape of the error functional generated by parameter couples (storage rate of PHA (qpha) and storage rate of Poly-P (qpp)), in the calibrated subset; on the right, confidential range at 98% and 95%
system identification, is a different concept since it relates to the time evolution of the system. It shows in which dynamical condition each parameter has the highest influence on system response. Given a nonlinear dynamical system dx = f ( x, u, p) (3) dt y = g( x, u, p) where x∈�n, u∈�m, y∈�q, p∈�p represent the state, input, output and parameter vectors. The parametric sensitivity of a parameter pi⊂p to the state vector x is defined as the ratio of the relative perturbation with respect to a nominal value: the parameter nominal value pi nom is assumed to produce the nominal state trajectory xnom; when pi is perturbed by a nom quantity ∆pi the state trajectory is displaced by ∆x. Thus sensitivity is defined as s pxi ≡
∆x x nom
∆pi pinom
(4) 73
n09
13/2/01
11:13 am
dS pxi dt
Page 74
=
∂f ∂x
x nom
S pxi +
∂f ∂pi
(5)
S. Marsili Libelli et al.
Taking the limit for ∆pi→0 and deriving Eq. (4) with respect to time t yields the dynamics of the sensitivity system, which depends on the nominal state trajectory xnom. For any given system (3) there exist np associated sensitivity systems (5). An obstacle to using the differential sensitivity system (5) is the need to evaluate the model Jacobean through calculus; however this complex step can be avoided if the incrematrix ∂f/∂x|x nom mental definition (4) is applied with a sufficiently small parameter variation. In this study an increment equal to ∆p=0.01×pnom has been used to assess trajectory sensitivity as the relative ratio between nominal and perturbed trajectories, namely S px =
x nom – x pert
(6)
∆p
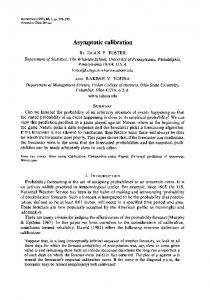
However, the rigorous definition (5) is useful to relate trajectory sensitivity to parameter identifiability. In fact it can be demonstrated (Vialas et al., 1985, Marsili-Libelli, 1992) that it is related to the gradient of the error functional ∆E(p) ∂E N exp N exp ∂E ( p) ∂p1 2 2 ∂x (7) S px [ xi – mi ] ∆E( p) = = ⋅ = [ xi – mi ] = N N exp ∂p ∂p E ∂ exp i =1 i =1 ∂p p Thus trajectory sensitivity can be used as a tool for optimal experiment design, in the sense that it shows which data should be collected in order to maximise the parameter estimation accuracy. The trajectory studies of Figure 6 show some relevant phosphorus parameters exhibit a marked sensitivity in the aerobic phosphorus-uptake phase, whereas they have hardly any influence in the anaerobic uptake mechanism.
∑
74
∑
Figure 6 Trajectory sensitivity of phosphorus kinetics. All parameters exhibit a marked sensitivity in the phosphorus-absorbing phase, whereas they have almost any influence in the anaerobic release mechanism
n09
13/2/01
11:13 am
Page 75
S. Marsili Libelli et al.
Figure 7 Calibration of nitrite oxidation (left) and ammonia oxidation (right)
Figure 8 Calibration results of the nitrogen and phosphorus sections of the model Table 3 Estimated kinetic parameters of nitrification Parameter
Value
µNBXNB
0.4 mgCOD/Lh
KNO2
0.5 mgN/L
µNSXNS
1.6 mgCOD/Lh
KNH
0.5 mgN/L
KNHi
5 mgN/L
Experimental parameter estimation
As reported by Dochain et al. (1995) and Vanrolleghem et al. (1995), another possibility to identify parameters is represented by the use of simpler models, whereas an appropriate combination of parameters might be experimentally determined. µNs and µNb were estimated by oxygen uptake rate (OUR) measurement (Spanjers, 1993). The results of calibrations on the respirometric data are reported in Figure 7 and Table 3. YNb and YNs were assumed from literature (Henze et al., 1996). bH, YPO4, YH, µHXH were also determined experimentally. The values were very similar to the literature ones, with the exception of YPO4 which was 0.26 mgP/mgCOD. Calibration results
Some results of the calibration procedure are shown in Figure 8, where the model fitting to phosphorus and nitrogen data are shown separately for clarity. The parameter partition technique of the previous subsection has been applied, together with the optimised simplex search procedure (Marsili-Libelli, 1992). It can be seen that the nitrogen removal process can be fitted quite well, whereas the discrepancy in the anaerobic phase of the phosphorus release phase can be explained by a contingent experimental condition. For experimental
75
n09
13/2/01
11:13 am
Page 76
reasons a P uptake was observed at the end of the anaerobic phase, possibly due to air entering the tank and causing early phosphorus uptake. The model is unable to accommodate this effect, which was not included. Conclusions S. Marsili Libelli et al.
An enhanced process model for the SBR process has been developed. Though the basic mechanism largely draws on the Activated Sludge Model no. 2, its new features are the splitting of the nitrification stage in a two-step process, according to the well-known Nitrosomonas–Nitrobacter oxidation sequence, and an improved XPAO dynamics, involved in the anaerobic/aerobic phosphorus removal process. An efficient software implementation of the model was obtained through the DLL technique allowing complied C++ modules to be linked to an ordinary Simulink block diagram, thus achieving a dramatic improvement in run time performance. The static sensitivity study revealed that if the parameter vector is partitioned into subset of biologically related parameters and calibrated separately, the calibration procedure does not present particularly difficult aspects from the computational point of view. Trajectory sensitivity showed also to which extent data collection could be optimised in order to improve calibration accuracy. The study of the shape of the error functional generated by parameters couples allows a much more effective calibration strategies. The results might explain that the apparent high degree of freedom in the model (Henze et al., 1998) does not exist in practice. References Andreottola, G., Bortone, G. and Tilche, A. (1997). Experimental validation of a simulation and design model for nitrogen removal in sequencing batch reactors. Wat. Sci. Tech., 35(1), 113–120. Dochain, D., Vanrolleghem, A. and Van Daele, M. (1995). Structural identifiability of biokinetic models of activated sludge respiration. Wat. Res., 29, 2571–2578. Henze, M., Grady, C.P.L., Gujer, W., Marais, G. v. R. and Matsuo, T. (1987). Activated Sludge Model No.1. IAWPRC, Task Group on Mathematical Modelling for Design and Operation of Biological Wastewater Treatment, 1986. Final Report No 1. London. 33 pp. Henze, M., Gujer, W., Mino, T., Matsuo, T., Wentzel, M.C and Marais, G.v.R. (1994). Activated Sludge Model No. 2. IAWQ, Task Group on Mathematical Modelling for Design and Operation of Biological Wastewater Treatment, 1994. Scientific and technical reports. Henze, M., Harremoes, P., Jes la Cour Jansen and Arvin, E. (1997). Wastewater Treatment - Biological and chemical processes. II edn. Ed. Springer. 383 pp. Henze, M., Gujer, W., Mino, T., Matsuo, T., Wentzel, M.C, Marais, G.v.R. and van Loosdrecht, M.C.M. (1998). Activated Sludge Model No. 2d. IAWQ Task Group on Mathematical Modelling for Design and Operation of Biological Wastewater Treatment Processes. Scientific and technical reports. Himmelblau, D. (1972). Applied Nonlinear Programming , McGraw-Hill. Marsili-Libelli, S. (1992). Parameter estimation of ecological models. Ecological Modelling, 62, 233– 258. Perkins, W.R. (1972). Sensitivity Analysis. J.B. Cruz (ed.). Feedback Systems, McGraw-Hill, New York. Seber, G.A. and Wild, C.J. (1989). Nonlinear Regression , John Wiley & Sons. Spagni, A. (1998). Biological activity to optimise wastewater treatment processes. Ph.D. Thesis, University of Parma. (In Italian). Spagni, A., Buday, J., Ratini, P. and Bortone, G. (in press). Experimental considerations on monitoring ORP, pH, conductivity and dissolved oxygen in nitrogen and phosphorus biological removal processes. Wat. Sci. Tech., 43(5). Spanjers, H. (1993). Respirometry in activated sludge. Ph.D. Thesis, Wageningen Agricultural University. The Nederland. Vanrolleghem, A., Van Daele, M. and Dochain, D. (1995). Practical identifiability of biokinetic models of activated sludge respiration. Wat. Res., 29, 2561–2570.
76