Ericsson ETM/BL/RU is a Ericsson Unix software Development Group (UDG) in ... are sharply focussed on cost and time to market of software development. At.
Implementing a Quantitatively Controlled Software Process1 Bart ter Horst, Frank Niessink and Hans van Vliet
Abstract Ericsson ETM/BL/RU is a Ericsson Unix software Development Group (UDG) in the Netherlands which was assessed at level three of the Software CMM in 1995. The customers of the software development centre, which are other departments within Ericsson, are sharply focussed on cost and time to market of software development. At the same time, performance (speed), fault tolerance and security demands are very high. These high and potentially conflicting demands make it important for this UDG to be able to communicate with its customers about the cost of software quality, i.e. how much it costs and how long it takes to develop software of a certain quality. Consequently, UDG also needs to be able to quantitatively manage and control its software process. Therefore, the organisation is currently implementing the CMM level four. In this paper, we look at the measurement system implemented by the software development centre as part of its effort to reach level four of the Software CMM. We use a generic process model of measurement-based improvement to assess the measurement activities of the organisation. This measurement-based improvement model describes on an abstract level the activities needed to both implement and use a measurement program or measurement system. For each of these activities we investigate whether UDG has implemented them, how the activities are implemented, and how the activities contribute to the goal of a quantitatively controlled software process.
1. Introduction Ericsson ETM/BL/RU is a software development centre, more specifically a Unix Development Group (UDG), in the Netherlands, which was assessed at level three of the Software CMM in 1995. The development centre is part of the research and development department of the Ericsson Telecommunications firm. At the moment, the organisation consists of 60 employees. The main product of the organisation is the Formatting and Outputting Subsystem (FOS). The FOS is a C++ application running on an adjunct processor which processes and outputs charging data produced by the central processor of an Ericsson AXE telephone exchange. The customers of the UDG are sharply focussed on cost and time to market of software development. At the same time, performance (speed), fault tolerance and security demands are very high. These high and potentially conflicting demands make it important for the UDG to be able to communicate with its customers about the cost of software quality, i.e. how much it costs and how long it takes to develop software of a certain quality. Consequently, the UDG also needs to be able to quantitatively manage and control its software process. Therefore, the organisation is currently implementing the CMM 1
Proceedings of the European Software Control and Metrics conference, Herstmonceux, England, April 27-29, 1999, pp. 167-175.
1
level four key process areas Statistical Process Management, Organisation Process Performance, and Organisation Software Asset Communality. These practises aim to meet the challenges set by the market as well as better controlling the development process. Briand, Differding, and Rombach [1] state that ‘Despite significant progress in the last 15 years, implementing a successful measurement program for software development is still a challenging undertaking.’ In our view, two important risk factors are 1) numbers are not knowledge, i.e. even after the measurements have been taken, interpretation, model building, and statistical analysis is needed to completely understand what the numbers are telling us, and 2) developer resistance. Developers know that the numbers do not always measure what they are supposed to measure and fear that management will not recognise this. In this paper, we look at the measurement system implemented by UDG as part of its effort to reach level four of the Software CMM. We use the generic process model of measurement-based improvement presented in [3] to assess the measurement activities of the organisation. This measurement-based improvement model describes on an abstract level the activities needed to both implement and use a measurement program. A short overview of the model is presented in section 2. For each of the activities we investigate whether the UDG has implemented them, how the activities are implemented, and how the activities contribute to the goal of a quantitatively controlled software process. Section 3 describes the reasons for starting the measurement program. Next, section 4 describes the implementation of the measurement program. Section 5 describes the results of the analysis of the measurement data obtained, and finally section 6 describes how the results of the measurement program were used to improve the organisation.
2. Measurement-based Improvement To analyse the measurement program of the Ericsson Unix Development Group, we use a four stage process model of measurement-based improvement. Here, we present a short overview of the model. The reader is referred to [3] for a more complete description of the model.
analysis
analysis Possible cause
Problem Goal
Improvement
Measurement Possible solution
implementation
implementation
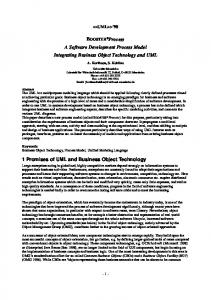
Figure 1: A generic measurement-based improvement process model
2
Measurement program Experiment
Figure 1 displays a generic process model for measurement-based improvement. It more or less resembles a ‘pretzel’, a loaf of bread in the form of a loose knot. The pretzel consists of two parts---the two halves, three concepts---the black dots, and four steps---the four arrows. The cycle starts with an organisational problem or goal (left black dot). We do not assume anything about the ‘size’ of the problem or goal. A problem could only affect one developer or the whole organisation, in both cases the same steps have to be passed through. The organisation analyses the problem (upper left arrow), and arrives at one or more possible causes of the problem and/or possible solutions (middle dot). The analysis will generally be based on a combination of knowledge about the own organisation, knowledge from literature (‘theory’), and common sense. Next, the organisation has to decide whether it has sufficient knowledge to establish the cause of the problem and correct it, or to reach the stated goal. If this is the case, the organisation need not traverse the right cycle. In most cases, however, the organisation needs to find out which of the possible causes is the real cause of the problem, or which of the possible solutions is the best solution. Or, it may need extra information to implement the solution. To gather this information, the organisation can design an experiment or set up a measurement program (lower right arrow). Executing the measurement program or experiment (right dot) results in the gathering of data, which is analysed and related to the problem or solution at hand (upper right arrow). Finally, the organisation solves the problem or reaches the goal by implementing the solutions found (lower left arrow). Although both the preceding description and the arrows in Figure 1 suggest a chronological sequence of steps, this is not necessarily the case. The arrows merely indicate causal relations. Hence, the model does not prescribe a single loop through the lemniscate. It is very well possible for an organisation to iterate the right loop a number of times before implementing a solution. For example, it may be necessary to first implement an experiment to find the cause of a problem, and then implement another experiment to find a suitable solution. Moreover, organisations might also want to implement a solution and a measurement program in parallel, to monitor the implementation of the solution. In the next four sections, we describe the measurement program of the Ericsson UDG using the four stages in the generic process model. First, we look at the organisational context of the measurement program and the reasons why Ericsson UDG decided to implement level four of the Software CMM. Next, section 4 discusses how the measurement program was implemented, what is being measured and how the measurement program is embedded in the normal development process. Section 5 shows the results of the measurement program. What data was gathered, and what analyses were done. The last of the four stages is described in section 6. Here we discuss the organisational changes and improvements that were implemented based on the results of the measurement program.
3
3. Organisational analysis In this section, we discuss the organisational context which led the UDG to implement a measurement program. The challenges facing software development at Ericsson’s Unix Development Group (UDG) are posed from three general sources: the telecommunication market, the overall organisation and the product. These are discussed below. Ericsson is a truly global organisation. Development of new products is distributed over development centres all over the world. Ericsson Telecommunication B.V. is one of the design centres involved in developing software products for the AXE telephone exchange. Each design centre develops part of the product to be delivered. This distributed development places a high demand on lead-time precision of development. All the local companies must deliver new products in orchestration so that the final product reaches the customer on time. Estimating software project cost and lead-time are crucially important. Add to this situation the telecommunication market, which is one is one of growth and competition. Both the providers and the operators of telecommunication products and services are active in a moving and highly competitive market. New developments, new competitors and new products emerge very quickly. Demands of an ever-changing market situation on development are typically stated in terms of (reduction of) time-to market and cost of new products of high quality. Ericsson must be able to provide innovative and high quality products and services to its customers fast. For the Unix Development Group this translates to developing innovative and high quality software products fast and in orchestration with many other development centres distributed world-wide. The main product of the UDG is the Formatting and Outputting Subsystem (FOS). This C++ application formats call-related data generated by the central processor of an AXE telephone exchange. The formatted data is then sent to post-processing systems of the AXE operator. The nature of the data being formatted places high demands on the FOS. This data may not be lost nor may it be duplicated. The FOS runs on an adjunct processor and must match the ever-increasing capacity and performance (speed) of the AXE exchange. It is safe to say that requirements with respect to the quality of the product in terms of stability, reliability, maintainability and performance are high. To meet these high and potentially conflicting demands, Ericsson uses the Capability Maturity Model (CMM) to get a grip on software development. Started in 1993, Ericsson reached the third level in 1995. The implemented practices provided a solid base for software development. But as the demands on the UDG grow, so do the demands on the visibility and control of processes and products. It was a logical step for the UDG to turn its attention to the fourth level of the CMM, which is titled “statistically managed”. We see that the analysis done by the UDG (the first stage from the measurementbased improvement process model) resulted in CMM level four as a possible solution for the problems mentioned above. To implement level four of the Software CMM, UDG needs to be able to quantitatively visualise and control its software development process. Hence, the UDG needs precise data about its process, such as how long the different phases in the process take, how much effort is expended, how many faults
4
are found at what point, etc. In the next section we describe how the goal of a statistically managed software process was translated into specific measurement goals and how the measurement program was implemented. We will specifically look at fault content as an example of one of the variables that the Unix Development Group wants to visualise and control.
4. Measurement implementation One of the key process areas of level four of the Software CMM is concerned with Statistical Process Control. SPC [2] is a well-known theory, using numerical data and statistical methods to visualise and control the performance of the primary process. Measurement activities were actually started when Ericsson progressed towards level three in 1995. Process measures like test results, product volume, lead-time and effort per product and process activity were collected. Measurements are a part of the software development process and performed in day-to-day operations. However, the enormity of the available data and the difficulty in identifying key performance indicators made a structured way of handling all this information impossible. The organisation was seeking more visibility of process performance, more reliable project planning and precise cost estimations. Up to this point, analyses and reporting of measurement results had been restricted to a small group of project-, process- and quality managers. There was very little feedback to the developers about the results of the measurements. The main purpose had been to provide visibility to a select audience of managers and customers. However, the use of numerical data needed to shift from tracking only to signalling and/or preventing risks for goal achievement in the early stages of the development lifecycle. The measurement system should facilitate control of the project toward stated and measurable goals. The measurement system which was set up next was based on a set of prerequisites. First of all, no new measures were to be defined. Implementation should start with the available data. Second, the measurement system should not become a separate process. All measurements must have a place in the normal workflow of software development and project management. Third, the information yielded by the measurement system should provide a solid base for decisions. The first step taken was to define organisational templates for measurement definitions in order to ensure the reliability and validity of the measures. Also, the purpose and usefulness of each measure was to be defined. These templates triggered analyses of the historical database yielding a small number of well-defined critical process performance indicators. These were introduced through a pilot. Pilots at the UDG mean that a single project will use a limited number of measurements for the duration of that project. If a pilot is successful, the piloted measurements are integrated into the software development processes. Cost estimation based on historical data was actually the first pilot of statistical process management. It preceded the use of control charts, trend-charts and S-curves typically associated with SPC. Such charts and methods are now an integral part of the organisation.
5
A lot of care was taken with the introduction of the measurements because numerical information is only too often interpreted exactly the wrong way [Marcel Proust]: "He who learns of some fact […] which is true, immediately draws conclusions which are not, and sees in this newly discovered wisdom the explanation of wholly unrelated matters." It is bad enough if developers interpret the number of defects in a product as a personal failure. It is disastrous if management would do the same. In software development a lot of factors combined determine the quality of products, processes and resources. Conclusions may only be drawn on a sound understanding of the situation. This means using multiple indicators and a lot of common sense. Interpretation and introduction of measures were not taken lightly. Extensive definition of measurements ensured proper use of numerical information. Measurements are always introduced through pilots. This has proven to be critical in the success of the measurement system. Developers could gradually get used to the use of measurements. In the end they accepted the numerical information as a reliable and clear way of communicating and controlling process performance. In the next pilot they enthusiastically embraced the use of S-curves to plan and track their own development progress. One of the goals of the measurement program was to control the fault content in products. This goal was translated to a goal for each of the test phases of a project. Projects at Ericsson’s UDG have three test phases of which the basic test is the earliest in the development life cycle. The purpose of measuring fault density is to help prevent faults and possible risks from slipping through to the next test phase in the development process. The first step taken was to analyse historical data on fault density basic test in order to get a good insight in the usability, validity and reliability of the measure. It turned out that approximately two-thirds of the components with unusual high or low fault densities in basic test also caused problems in subsequent test phases. The decision was made to pilot the statistical use of this measurement in the next project. Fault density basic test is the number of basic test faults reported per thousand noncommented source statements. So basically there are two measurements involved; the number of basic test faults and the number of statements. Measuring these was already part of the normal basic test activities. So defining the measurements formally did not involve very upsetting changes for developers. The formal definition of the measurements did however improve the reliability of the measurements. Table 1: Measurement Data Definition
Generally understood name Description Unit/scale Purpose Method of data collection
The name of the measure should be commonly accepted by those performing the measurements Brief general description of the data The scale of the measure defines which statistical method and transformations can be applied Why is the measurement performed Who is responsible, when is the measurement done, what activity triggers the measurement, how, with
6
Reliability and validation
Typical values and range
which tools, data storage An indication of the accuracy of the measurement, validation methods to be used, responsibilities for verification Typical values like mean and standard deviation, based on historical data
The measurements are defined by Measurement Data Definitions (MDDs). Table 1 describes the sections of the MDDs. These workinstruction-like MDDs were inspected by the developers responsible for executing the measurement. Through these inspections, differences in interpretation by the developers were resolved, thus improving reliability. It also helped in clarifying the purpose of the measurements and raising awareness of statistical methods. The definition opened the way for the use of control charts, which are typically associated with SPC. Table 2: Measurement Result Definition
Generally understood name Description of attribute Unit/scale Purpose
MDDs used Measurement data transformations Presentation of results
Influencing factors
Scope of application
Is the measurement result a process, product or resource attribute Describes the goal of the MRD, whether there are any corporate obligations for this MRD, and the users of the MRD List the data needed by referencing the MDDs The steps to get from the basic data to the measurement result. Also describes who is responsible, when the transformation is done, and with which tools How the results will be presented (table, trend-chart, etc.) In case of control charts, control limits are defined in this section Possible sources for variation of the measurement result. The list of factors helps to put the results in perspective and suggests directions for analysis of exceptional results To what extend can the results be seen as describing product or process quality. For example, high fault density during basic test can mean that the product is of low quality, or that the testing was very good.
At the same time a Measurement Result Definition (MRD) was drafted. This definition describes how to get from the basic data to a fault density basic test chart. But most elements of the definition are aimed at proper interpretation and use of the results. The contents of a MRD are described in table 2. From other development centres the UDG had learned that not clearly defining purpose and interpretation of measurements can have amazing results. For example, other design centres had used the number of basic test faults before. They found that the total number of reported faults always topped off just underneath the specified
7
allowed maximum. The measurement was used as an indicator for product quality, without explicitly considering other factors or measurements. In other words, the measurement results were interpreted as indicating good work and bad work. Developers decided that it would be best to keep their results under the limits and simply stopped reporting faults when the total number was about to exceed the set limits. At the UDG a series of presentations was given in the early stages of the definition of the MRD. The goal was twofold. First, to introduce developers and management to the MRD and to make clear that interpretation of results would be rigorously defined. Second, to get feedback from developers on the influencing factors listed in the MRD. The introduction and application of the measurement system can be summarised by the terms definition, interpretation, piloting and common sense. This is reflected in the basic principles of the measurement system: • Actions produce data: Everything is measurable. • Data is meaningless but leads to information: Numbers without proper interpretation are just numbers. • Combination of information leads to knowledge: Only interpreted numerical data placed within a meaningful context can be a basis for decisions. • Knowledge unused is useless knowledge: The measurement system is a tool for providing a sound understanding of a situation on which can be acted; actions produce data. In the next section we discuss how UDG analyses the data gathered and how the numbers are interpreted to form a basis for further decision making.
5. Measurement analysis The use of statistical methods contributed to improving lead-time precision. Control charts on fault content have helped to prevent defects from slipping through to subsequent development phases. The MRD ‘Fault Density Basic Test’ features two presentations: a cumulative linechart for tracking the trend of the results and a control chart. The MRD is executed by the developers each time they finish a basic test report. The presentation of all basic test report results is the responsibility of Quality Management. The control chart is presented on a weekly basis, the trendline chart monthly. For fear of misinterpretation or hasty conclusions based on incomplete information, results are always presented in combination with analysis results. These analyses are triggered by control limits defined in the MRD. The control chart features two sets of limits: control limits and specification limits. Control limits represent the normal statistical variance of basic test results. These limits were arrived at by standard statistical methods based on normal historical data. Normal historical data are all results from a regularly executed process. Any measurement results that were not the output of a normally executed software development process were excluded from the data set prior to calculating the control 8
limit. The result was a bandwidth of normal and expected behaviour. The calculated upper control limit was however higher than the goals set on fault content. So in order to ensure that process results conform to the goals, specification limits were set. Any value outside the specification limits may pose a risk for goal achievement. Specification limits are typically narrower than control limits. Values outside specification limit are analysed on possible (technical) risks for subsequent test phases and statistical deviations. With a measure like fault density, it may very well be that a single reported fault on a very small component produces a result outside specification limits. Any value outside control limits may indicate irregularities in process execution or the product itself. If a package is outside control limits an additional analysis on process executions is performed. Results outside the limits thus trigger analyses. The result of the analysis combined with other measurement results and an evaluation of influencing factors determine if, and what action is to be taken.
6. Organisational implementation and Conclusions The last stage of the measurement-based improvement process model is concerned with actual usage of the measurement results to improve the organisation. When a software component displays more defects than may be expected from the statistically determined variance of the process, a technical and statistical analysis is done. In some cases this has led to the identification of technical issues. These were solved before the component was handed over to the next phase. In other cases structural process issues were identified and solved by process improvements. Two examples where results exceeded the limits will illustrate how measurement and analysis triggered action at the UDG. The first instance was a component which basic test results exceeded the specification limit. The component in question was (statistically) normal. The team performed a technical risk analysis and identified four risks of which they proposed to solve two. The team spent five extra hours on the package before it was handed over to the next test phase. During this subsequent test phase the test team was asked to evaluate the risks and the solutions implemented by the developers of the previous phase. The test team indicated that had the risks not been solved, they would have had to spend forty extra hours on the test runs. This ratio 1:8 was also found in other components of which identified risks were solved before hand-over to the next test phase. In another instance a component’s result exceeded the control limits. Not only did the package harbour significant technical risks, on further analysis flaws in the organisation and the process were uncovered. The risks were solved before hand-over to the next phase. In addition, the process and organisation issues uncovered were reported to senior management, and resulted in a change of the development process. These issues were the first structural organisational changes implemented based on measurement results. The examples given led to two major changes in the organisation’s standard software process. The first instance, where a risk was solved before hand-over, led to a work instruction for the test team. The test team already evaluated the basic test record
9
before accepting a component. This evaluation was extended with the instruction not to accept a component with basic test results outside the limits without a risk analysis and action plan. The second instance led to addition of a process step and a better setup of team planning. The biggest change brought on by the piloted measurement is a change in mentality. Developers and management alike enthusiastically embraced the use of measurements as a reliable way of controlling and visualising their work. The pilot project gave every reason to be enthusiastic about. Lead-time-precision grew to 98% and the fault content was a fraction of the previous project, saving cost and time as well as improving the quality. In the current situation almost everyone in the organisation agrees that using measurements has to be an integral part of software development. Using the measurement-based improvement process model, we have shown why the Ericsson UDG implemented a measurement program, how it was set up, how the results were analysed and interpreted, and how the results were as used to actually improve the organisation and its software process. We can safely conclude that this measurement program is a successful program. We feel that an important determinant of its success is the fact that each of the four steps from the process model got sufficient attention: the measurement was driven by a clear goal, the implementation was done rigorously, the data analysis was appropriate, and the results of the measurement program were fed back into the organisation by using the results to improve the software process. The next step for the UDG will to use the measurement system as a tool for triggering organisational improvement. For this purpose a number of measurements covering all phases of the product lifecycle are being defined. The most important of these is the Cost of Quality measurement (COQ). Using the COQ should enable the UDG to identify and improve the weaker parts of its organisation, processes and products on a continuous basis. This means a further shift from measurements as a tool for visualisation and control to measurements as a tool for continuous organisational improvement.
References [1] Practical Guidelines for Measurement-Based Process Improvement. Lionel C. Briand, Christiane M. Differding, and H. Dieter Rombach. In: Software Process - Improvement and Practice, 2(4):253-280, December 1996. [2] Introduction to Statistical Quality Control. D.C. Montgomery, John Wiley and Sons, 1985. [3] A Pastry Cook’s View on Software Measurement. Frank Niessink and Hans van Vliet. In: Software Measurement - Research and Practice of Software Metrics, Reiner Dumke and Alain Abran (ed.), Deutscher Universitaetsverlag, Wiesbaden, Germany, 1999, pp. 109-125.
10