Evolutionary Applications Evolutionary Applications ISSN 1752-4571
ORIGINAL ARTICLE
Implementing an evolutionary framework for understanding genetic relationships of phenotypically defined insect biotypes in the invasive soybean aphid (Aphis glycines) Jacob A. Wenger and Andy P. Michel Department of Entomology, The Ohio Agricultural Research and Development Center, The Ohio State University Wooster, OH, USA
Keywords adaptation, insect biotype, plant resistance, population genetics, soybean aphid Correspondence Andy P. Michel, Department of Entomology, The Ohio Agricultural Research and Development Center, The Ohio State University, 1680 Madison Ave., Wooster, OH 44691, USA. Tel.: +1 330 263 3730; fax: +1 330 263 3686; e-mail:
[email protected] Received: 29 January 2013 Accepted: 30 May 2013 doi:10.1111/eva.12084
Abstract Adaptive evolution of pest insects in response to the introduction of resistant cultivars is well documented and commonly results in virulent (i.e., capable of feeding upon resistant cultivars) insect populations being labeled as distinct biotypes. Phenotypically defined, biotypes frequently remain evolutionarily indistinct, resulting in ineffective application of virulence control measures and shorter durability of resistant cultivars. Here, we utilize an evolutionary framework to discern the genetic relationship between biotypes of the soybean aphid (Aphis glycines, Matsumura). The soybean aphid is invasive in North America and is among the most destructive pests of commercial soybean on the continent. Attempts to breed host-plant-resistant soybean have been hampered by the emergence of virulent aphid biotypes that are unaffected by the plant’s resistance mechanism(s). Comparative population genetic analysis of virulent and avirulent (i.e., unable to feed on resistant cultivars) biotypes found populations to be genetically indistinguishable across biotype and geographic distance, with high rates of interpopulation immigration and admixture. The lack of genetic distinction between biotypes coupled with elevated genotypic diversity within all populations suggested virulence has a nongenetic-based or includes a gene complex that is widely distributed throughout soybean aphid populations, which undergo regular dispersal and unimpeded sexual recombination.
Introduction The interactions between phytophagous insects and their respective host plants have long served as a model system for coevolution (Tilmon 2008). The reciprocal adaptations occurring between populations in parasitic or mutualistic relationships results in greater specificity and interdependence between species (Thompson 1994). Many naturally occurring examples exist, though the development of crop cultivars exhibiting natural pest resistance (Painter 1968; Panda and Khush 1995; Smith 2005) provides a widespread anthropogenic microcosm of this interaction. The increased selection pressure associated with the extensive implementation across landscapes accelerates insect and host coevolutionary interactions within agroecosystems as compared to natural environments. The selection pressure
caused by resistant cultivars favors the evolution of virulence (i.e., insect populations capable of feeding and/or reproducing on resistant cultivars, Gould 1991, 1998; Rausher 2001), and ultimately decreases agricultural production and the durability of resistance. The genetic and environmental mechanisms of pest virulence to resistant cultivars are often ill defined. Within crop resistance literature, virulent pests are most commonly organized within the pseudo-taxonomic category of biotype, an intraspecies taxon defined by a shared differentiating phenotype (Claridge and den Hollander 1983; Diehl and Bush 1984). The biotype category is commonly intended as a temporary taxonomy to be used prior to uncovering the evolutionary mechanism of the differentiating phenotypic trait. However, most biotypes fail to be reclassified and languish within these ambiguous
© 2013 The Authors. Evolutionary Applications published by John Wiley & Sons Ltd. This is an open access article under the terms of the Creative Commons Attribution License, which permits use, distribution and reproduction in any medium, provided the original work is properly cited.
1041
Assessing biotypic virulence in soybean aphid
Wenger and Michel
categorizations (Downie 2010). This casts uncertainty upon the evolutionary relationships between the differentiated phenotypes, restricting the use of applied evolutionary theory to maximize the lifespan of cultivar resistance. For example, if virulent biotypes are distinct populations or evolutionary lineages, then resistant cultivars can be strategically deployed where the frequency of such virulence is low. In this study, we apply a population genetic framework, based on the theoretical work of Diehl and Bush (1984), to clarify the evolutionary relationship of a recently emerged insect pest biotype. The biotypic framework The biotypic framework, as used within taxonomy, evolutionary and applied biology, is fraught with contention and ambiguity (Claridge and den Hollander 1983; Diehl and Bush 1984; Downie 2010). For the purposes of this study, we shall define the biotype as an intraspecific classification, segregating individuals by a divergent phenotypic response to an ecological variable. This definition is intentionally broad as many ecological variables have been used to assign biotype status within populations including virulence to resistant cultivars, host-plant association, pesticide resistance, virus transmission, invasiveness, and sex ratio at birth (Montllor et al. 1983; Kim et al. 2008; Peccoud et al. 2009; De Barro et al. 2011). Indeed, there are some examples of lineage specific biotypes, such as the host races of Acyrthosiphon pisum (Via 1999; Peccoud et al. 2009) and the Bemisia tabaci species complex (De Barro et al. 2011), but these represent only a subset of all biotypes and are not reflective of all evolutionary mechanisms of virulence. Rather, these examples should be organized within more appropriate evolutionarily defined taxonomies outside of biotype such as the presence of reciprocal monophyly (Via 1990). Criticisms of the biotype taxonomy are numerous (Claridge and den Hollander 1983; Downie 2010) but commonly root themselves in the concept’s inherent ambiguity, misrepresentation of adaptive evolution, and the disconnect between divergent phenotypes and genetic differentiation. Biotype falls short of being a relevant biological taxonomy because it is designated phenotypically without implication of evolutionary origin. Phenotype is the product of the interplay between genetic variation and environment and does not necessarily denote common descent. At the intraspecific level, where biotype is utilized, differential phenotypes are likely representative of transitory adaptive evolution within the population. Thus, differentiating phenotypes could be explained through a number of mechanisms outside of a novel lineage, including the utilization of latent genetic variation and nongenetic plastic effects. While common descent is not required within a taxonomic 1042
framework, it is key to avoiding artificial indices and maintaining predictive power within biological systems (Downie 2010). A lack of monophyly is of particular concern in biotype research where investigators are commonly expected to recommend strategies to manage the frequency of virulence, which may involve manipulating environmental variables to decrease selective pressure favoring virulence (Onstad 2007). Without a clear understanding of the relationships between biotype populations, the strategies utilized may be unsuitable for the targeted biotype, causing ineffective control at best and inadvertently favoring virulence at worst. As an intraspecific taxonomy, biotypic differentiation occurs at the population level, which can then alter gene flow, selection, and structure among populations. If the diverging phenotype is genetically based, then the evolution of virulence would produce different signatures within the population, measured by the partitioning of molecular variance. Population genetic analysis allows an indirect measure of these changes through the comparison of allele frequencies and genotypic diversity within and between biotype populations while controlling for geographic-based genetic variation. Through the rapid generation of molecular markers, even in nonmodel organisms (Baird et al. 2008; Davey et al. 2011; Ekblom and Galindo 2011), we can now use modern population genetics to revisit the evolutionary-based framework suggested nearly 30 years ago by Diehl and Bush (1984). The Diehl and Bush framework removes the adaptive biotype from its current pseudo-taxonomy and places it within one of five evolutionarily relevant categories: (i) nongenetic polymorphism, (ii) polymorphic or polygenic variation within populations, (iii) geographic races, (iv) host races, and (v) species (Table 1). Importantly, these categories produce predictable patterns of gene flow, selection, and genotypic differentiation within and between biotype populations (Table 1), allowing for straightforward hypothesis testing of biotype adaptation against the standard null hypotheses of no genetic differentiation and genetic isolation by geographic distance. Therefore, population genetic analysis should be among the initial steps in characterizing and describing biotype populations. As an example of the investigative power of the Diehl and Bush framework, we performed an empirical analysis of a recently discovered biotype in an invasive species, the soybean aphid. The soybean aphid The soybean aphid (Aphis glycines) is a significant hemipteran pest of soybean (Glycine max L.) native to East Asia (Blackman and Eastop 1984). A. glycines has recently invaded North America and was first detected in Wisconsin soybean in 2000 (Wu et al. 2004; Ragsdale et al. 2011).
© 2013 The Authors. Evolutionary Applications published by John Wiley & Sons Ltd 6 (2013) 1041–1053
Wenger and Michel
Assessing biotypic virulence in soybean aphid
Table 1. Hypotheses proposed through the Diehl and Bush (1984) framework with predicted population level patterns for each. Diehl & Bush categories Nongenetic
Ubiquitous genetic
Geographic race
Host race
Species
Predicted population level responses Hypothesis
Gene flow
Structure
Genotypic diversity
Biotypic differences are not genetic in origin, but are likely associated with phenotypic plasticity, environmental effects, and endosymbionts Biotypes are the product of adaptive genetic variation, but gene flow is uninhibited. Biotypic traits subject to population level drift and selection Biotypes are geographically separate during sexual stages, limiting gene flow. Biotypes evolved via geographic isolation Biotypes associate with different primary hosts causing near sexual isolation and divergent evolutionary trajectories Biotypes are indicative of separate species that share no gene flow
Ubiquitous
No structure
Little to no deviation between biotypes. Shared *MLGs common
Ubiquitous
No structure
Limited deviation between biotypes if monogenic. None if polygenic
Restricted
Strong structure by biotype and geographic gradient
Deviation in richness between biotypes. Few Shared MLGs
Restricted
Structure between biotypes and primary host Strong structure by biotype populations
Deviation in richness between biotypes. Few Shared MLGs
None
Genotypes significantly divergent, few or no MLG shared between biotypes
*MLG, multilocus genotype.
Despite the presumed founder effect associated with invasion (Michel et al. 2009), the soybean aphid has proven to be well adapted to the industrial agro-ecosystem in North America and has rapidly expanded its range which includes 30 U.S. states and three Canadian provinces (Ragsdale et al. 2011). Within North America, the species is heteroecious and holocyclic, transitioning between asexual clonal reproduction on its secondary host, soybean, and a sexual phase on its primary and overwintering host (Rhamnus spp., with common buckthorn, R. cathartica, most frequently utilized) (Ragsdale et al. 2004). As a result of the ubiquitous presence of both primary and secondary hosts, and aphid movement among them, there are few barriers to gene flow among A. glycines populations, resulting in genetic homogenization across North America (Michel et al. 2009; Orantes et al. 2012). Soybean aphid-resistant soybean cultivars have been developed to provide an alternative to comparably expensive and ecologically damaging chemical insecticides (Hodsgon et al. 2012). Currently, five Rag (Resistance to Aphis glycines) genes have been described, Rag1 – Rag5 (Hill et al. 2006a,b; Mian et al. 2008; Zhang et al. 2008; Jun et al. 2012), with Rag1 expressing varieties commercially released in 2010. Virulence to Rag1 and Rag2 has been found in natural soybean aphid populations; natural virulence to other Rag genes is unknown. Currently, four biotypes of the soybean aphid are recognized including: biotype 1 (not virulent, i.e., avirulent, to all HPR strains), biotype 2 (virulent only to Rag1 soybean), and biotype 3 (virulent to Rag2 while remaining mostly avirulent to Rag1
soybean), and biotype 4 (virulent to Rag1 and Rag2 individually and in concert) (Kim et al. 2008; Hill et al. 2010; Alt and Ryan-Mahmutagic 2013). Although much effort has been made to elucidate the mechanism and chromosomal location of aphid resistance within soybean (Li et al. 2008; Hill et al. 2012), relatively little effort has been focused on the ecological and evolutionary genetics of soybean aphid biotypes, including genetic comparisons between biotype populations. Considering the Diehl and Bush framework, virulent biotype evolution in A. glycines could be the result of any of the five described categories with patterns of genetic variability matching those listed in Table 1. However, the lack of population structure found in previous studies (Michel et al. 2009; Orantes et al. 2012) suggested that race formation and speciation are unlikely causes of biotypic virulence. Therefore, in this case, we predicted that biotypic virulence is a function of either nongenetic environmental influences or a genetic polymorphism that is ubiquitous throughout the population via sexual recombination. To clarify the evolutionary genetic relationships among soybean aphid biotypes, we performed a molecular marker analysis of 14 populations of biotype 1 and 2, geographically distributed across seven collection sites in northern Ohio, USA. Genotypic diversity, genetic distance, and population assignment analyses were performed across geographies and biotypes. Our goals were to determine the pattern and level of genetic differentiation among biotype populations. If we find strong genetic structuring between biotype populations, then biotypes are the product of race
© 2013 The Authors. Evolutionary Applications published by John Wiley & Sons Ltd 6 (2013) 1041–1053
1043
Assessing biotypic virulence in soybean aphid
Wenger and Michel
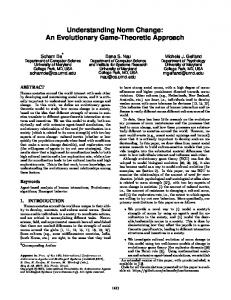
formation or speciation through restricted gene flow. Alternatively, if structure is non-existent or unassociated with biotypes, then virulence is ubiquitous throughout the North American population and is genetically admixed or environmentally induced and nongenetic (Table 1). This is the first comparison of genetic variation between soybean aphid biotype populations, and the results of this study would lead to a better understanding the evolution of virulence and improve the use of resistant soybean cultivars. Materials and methods Collection and biotype differentiation Biotype 1 and 2 soybean aphids were sampled in pairwise, concurrent collections at seven sites across northern Ohio, with sites grouped into two geographic clusters (Fig. 1, Table 2). Distances between sites were designed to account for a null hypothesis of genetic isolation by geographic distance, with gradients representing three geographic scales termed microgeographic (2 km, 120 km). Site selection was based on affiliation with the Ohio State University extension system, available field space, and aphid infestation. The eastern cluster was composed of four sites at the Ohio Agricultural Research and Development Center (OARDC) in Wooster, Wayne County, Ohio; all Wayne county field sites were established within a 2 km radius to allow sampling on a microgeographic scale. The western cluster included single field sites in Defiance, Fulton, and Wood counties in northwest Ohio. The western cluster sites were located within 120 km of one another and 225 km from the eastern cluster, thereby establishing meso- and macrogeographic collection distances. Sampling of aphids differed between the western and eastern clusters due to growing space constraint within the eastern sites. Within these sites (W1-W4, Table 2), Rag1 expressing LD-05 16060 (i.e., resistant soybean) and susceptible variety SD-01 76R (Tinsley et al. 2012) were grown
Figure 1 Geographic location of collections. Abbreviations and GPS coordinates available in Table 2.
in separate 38 9 53 cm growth flats. Soybeans were reared under standard greenhouse conditions until V3 growth stage and then transferred to the field sites. Single flats of both the Rag1 and susceptible variety were positioned on the edge of a susceptible and insecticide-free soybean field. Plants were observed every 2 days for aphid colonization. Apterous (i.e., wingless) aphids collected in the field on Rag1 expressing plants were assumed to be virulent and defined as biotype 2. Any aphids collected on susceptible soybean could be biotype 1 (avirulent to Rag1) or biotype 2 and therefore required further characterization using the detached leaf assay as outlined by Michel et al. (2010). Aphids capable of feeding and producing viable clones on the Rag1 detached leaves were classified as biotype 2 and were excluded from our analysis. Aphids that failed to feed, actively avoided the leaf, produced unviable nymphs, or suffered mortality after feeding on the leaf were defined as biotype 1. All aphids were collected from their host plant using a fine tip brush and were stored at 20°C. For east-
Table 2. Collection information for soybean aphid field sites. Field*
Collection date†
N-B1‡
N-B2‡
Latitude (N)
Longitude (W)
Defiance (Df) Wood (Wd) Fulton (Fu) Wayne-1 (W1) Wayne-2 (W2) Wayne-3 (W3) Wayne-4 (W4)
September 1 August 17 August 21 August 27–September 2 August 27–September 2 August 27–September 2 August 27–September 2
45 48 39 47 55 47 46
48 40 56 48 49 47 47
41.324 41.455 41.608 40.773 40.759 40.759 40.766
84.551 83.664 83.986 81.910 81.903 81.900 81.908
*Abbreviations in parentheses. †All collections in year 2011. ‡Sample size of biotype 1 (B1) and biotype 2 (B2).
1044
© 2013 The Authors. Evolutionary Applications published by John Wiley & Sons Ltd 6 (2013) 1041–1053
Wenger and Michel
ern cluster sites, no single daily collection produced enough aphids for population analysis; thus, collections were pooled (respective of geographic location and biotype) across an eight-day period of August 27 through September 2, 2012. These dates were selected as they coincide with peak aphid infestation in Ohio and overlap with northwestern cluster collection days. Furthermore, these dates were after known soybean aphid dispersal events that homogenize population structure, allowing us to avoid confounding geographic population structure associated with temporal factors (Orantes et al. 2012). Within the western cluster sites (Df, Wd, Fu, Table 2), three rows of susceptible and Rag1 expressing soybean were grown within insecticide-untreated susceptible soybean fields. Defiance (Df) was an exception, with three rows of soybean (per treatment) grown in a separate plot, not adjacent to conventionally grown soybean fields. At all locations, aphids were collected on a single day (Table 2) by collecting 50 infested leaves from both resistant and susceptible soybean. To avoid resampling genetically identical clones, a single leaf was collected from each sampled plant, with collected leaves stored in separate plastic bags. Leaves were then transported to the laboratory whereupon 1 aphid was removed from each leaf and stored at 20°C until later genetic analysis. Aphids from susceptible plants in the western cluster were subject to biotype determination via detached leaf assay as explained previously. DNA extraction and SNP genotyping DNA was extracted from individual aphids using the QuickExtract Seed DNA Extraction Solution (Epicentre, Madison, WI, USA) per manufacturer’s instructions. A total of 18 single nucleotide polymorphisms (Barker et al. 2011) were genotyped using the allele-specific primer extension (ASPE) technique, (Luminex, Austin, TX, USA), following the modified protocol outlined in Orantes et al. (2012). Initial isolation and amplification of genomic regions containing SNPs was performed with the Qiagen Multiplex PCR Kit (Qiagen, Valencia, CA, USA), with final product cleansing using ExoSAP-IT (Affymetrix Corporation, Santa Clara, CA, USA), following manufacturer’s instructions. Samples were processed at the OARDCMolecular and Cellular Imaging Center using the Luminex200 system. Allele calling was automated through the Masterplex QT and GT MiraBio program suites (San Francisco, CA, USA), with allele designations manually inspected and verified prior to statistical analyses. Neutrality and clonality LOSITAN (Antao et al. 2008) was employed to assess selection neutrality at the individual loci. All loci found to be
Assessing biotypic virulence in soybean aphid
under directional or balancing selection were removed from the data set. Statistical analyses were performed on data sets both lacking and containing these loci to ascertain any biases. While the sampling scheme was designed to avoid the sampling of clones, clonal identification was still required as to not bias the data set toward over-represented lineages (Arnaud-Haond et al. 2007). The data analysis programs GeneAlEx v. 6.41 (Peakall and Smouse 2006) and GenClone v. 2.0 (Arnaud-Haond and Belkhir 2007) were used to identify shared multilocus genotypes (MLGs, i.e., clones) within and between all populations. Within populations, all individuals with shared MLGs were removed so that only a single individual remained. Aphids with shared MLGs that were not within the same sampling location/ biotype were retained. All statistical analyses were performed with data sets including and excluding shared MLGs, though the results presented exclude shared MLGs. GenClone was utilized to assess clonal lineage diversity and evenness within populations, a proxy measure of gene pool size and diversity. The Pareto distribution index (C) and the Simpson’s diversity (D) and evenness score (V) were calculated to estimate the abundance and diversity of clones within and between the sampled populations. Additionally, all shared MLGs within a sampled population were assessed for origin of identity using GenClone’s PSEX statistic. PSEX estimates the probability that individuals with a shared MLG were a product of sexual reproduction, as opposed to clonal propagation. Genetic diversity and structure Hardy–Weinberg equilibrium, as measured through the inbreeding coefficient FIS, as well as expected and observed heterozygosity (HE and HO, respectively), were calculated via GENEPOP (Raymond and Rousset 1995). FIS, HO, and HE were compared across biotypes and eastern/western clusters using FSTAT V2.9.3 (Goudet 1995) with 10 000 random permutations. Linkage disequilibrium within populations was also assessed via FSTAT. Population structure was analyzed through multiple analyses. MSA 4.05 (Dieringer and Schl€ otterer 2003) was used to calculate pairwise comparisons of the fixation index (FST) between populations with Bonferroni-corrected P-values. Principal coordinate analysis (PCA) was performed using a Nei’s pairwise distance matrix in GenAlEx v. 6.41. Population assignment was estimated using both the Paetkau assignment method (Paetkau et al. 2004) and STRUCTURE 2.3.3 (Falush et al. 2003) with 250 000 reps burnin and 750 000 reps analysis for each of five independent replications. Both assignment methods were assessed across biotypes and collection sites, both individually and grouped by biotype or geographic cluster.
© 2013 The Authors. Evolutionary Applications published by John Wiley & Sons Ltd 6 (2013) 1041–1053
1045
Assessing biotypic virulence in soybean aphid
Wenger and Michel
Results Loci neutrality LOSITAN analysis revealed one locus under directional selection (42701) and two loci undergoing balancing selection (5109 and 2654) (Figure S1). The directional selection found in locus 42701 was geographically associated; the eastern cluster exhibited significantly higher heterozygosity (FIS: 0.726) than the populations within the western cluster (FIS: 0.015, FSTAT P < 0.001). Locus 42701 inflated FST values between the geographic clusters and was removed from the analysis. Loci 5109 and 2654 were not geographically or biotypically associated but were nonetheless removed from the data set to avoid confounding the patterns of divergence inherent within the remaining neutral markers. Among the remaining loci, limited linkage disequilibrium was detected between six loci, but was found to have no significant effect on statistical analyses or results. Clonal diversity Analyzing the clonal diversity among biotypes can provide an indication of the prevalence of virulence in a population. If virulence is rare, then we would expect a small diversity of genotypes to be found on Rag1 plants compared to susceptible plants due to the virulent biotype’s restricted gene
pool. However, clonal lineage assessment revealed multilocus genotype (MLG) diversity to be high both within and between biotype populations. Of the 662 sampled individuals, there were 575 distinct MLGs, of which 524 (91.1% total MLGs) were singletons (occurring in a single individual). Of the shared MLGs (51, 8.87% total MLGs), the majority were shared between individuals of the same biotype and collection site, while a minority were shared across biotype or site. PSEX values for members of shared MLGs were significant (P < 0.05), indicative of clonal origin for shared genotypes. The most common shared MLG consisted of 18 biotype 2 individuals from the Df site. This population was also the least diverse genotypically, with 22 of its 48 sampled members (45.8%) belonging to a shared MLG. In contrast, biotype 2 from the Fu site had the greatest diversity of MLGs with only one aphid (1.8%) having a shared MLG. Elevated genotypic diversity in many populations resulted in uninformative results for some MLG diversity statistics, as was seen in previous analyses of soybean aphid populations (Michel et al. 2009; Orantes et al. 2012). There was no decrease in MLG diversity within biotype 2 aphids when compared to biotype 1, suggesting that virulent aphid clones share a diverse sexual gene pool (Simpson’s D: biotype 1 = 0.994, biotype 2 = 0.974, Wilcoxon: P > 0.2, n = 7, W = 12; Table 3). Simpson’s evenness (V) was also not significantly different between biotypes (Wilcoxon,
Table 3. Diversity statistics between soybean aphid biotypes. Diversity statistics Site Biotype 1 Df Wd Fu W1 W2 W3 W4 Bio1 Avg Biotype 2 Df Wd Fu W1 W2 W3 W4 Bio2 Avg
Multilocus genotypes (MLGs)
Simpson D
Simpson V*
Pareto C†
Unique‡
Shared§
Clonal**
Total††
0.997 0.988 0.998 0.993 0.986 0.986 1.000 0.994
0.512 0.837 0.000 0.739 0.795 0.512 N/A 0.566